Multiple neuronal networks coordinate Hydra mechanosensory behavior
- Department of Bioengineering, Rice University, United States
- Department of Molecular and Cellular Biology, United States
- Department of Electrical and Computer Engineering, Rice University, United States
- Department of Neuroscience, Baylor College of Medicine, United States
Figures
Figure 1
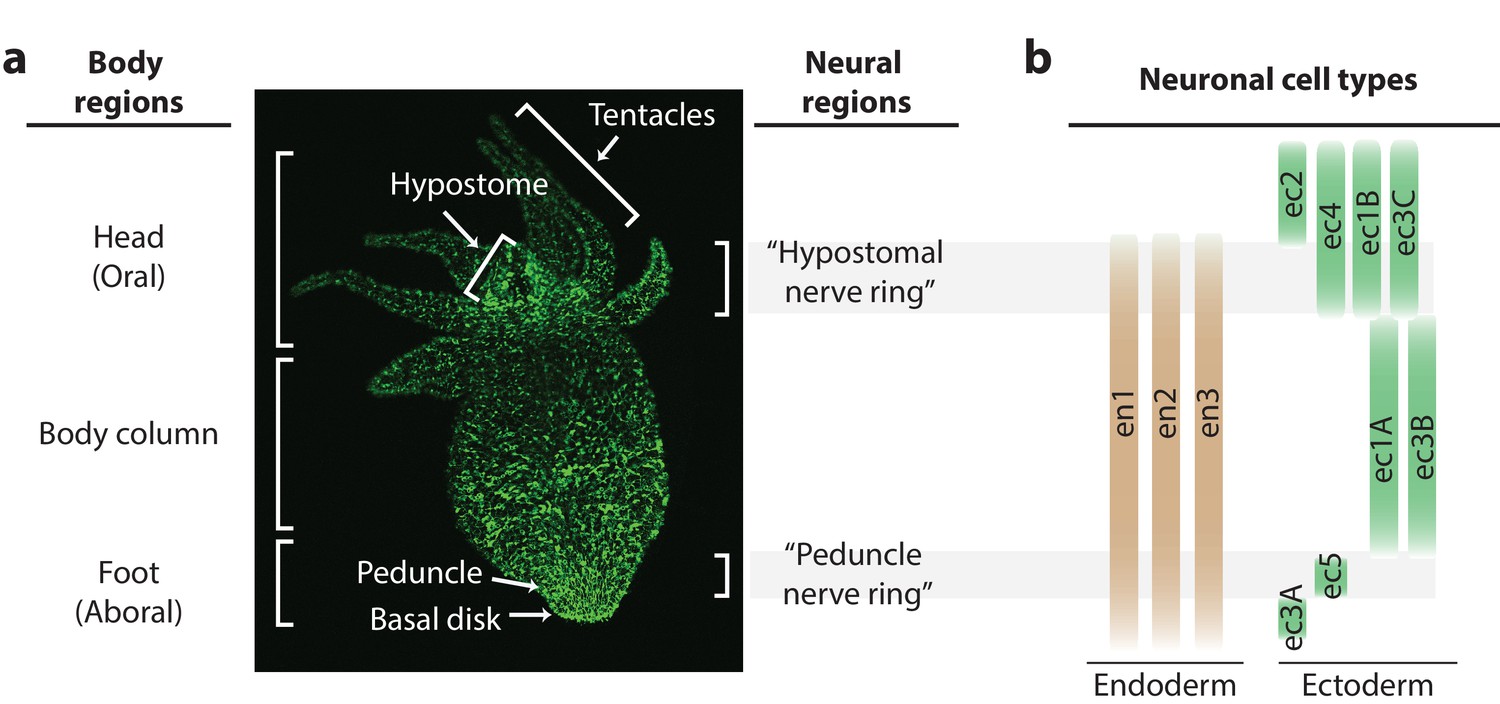
Distribution of neurons in the Hydra nerve net.
(a) Fluorescent image of Hydra nervous system. Green fluorescent protein (GFP) is expressed in neurons and neuronal progenitors (nGreen transgenic line; Siebert et al., 2019). Body anatomy is annotated on the left. White arrows indicate the body parts: hypostome, tentacles, peduncle, and basal disk. High neuronal density regions are annotated on the right. (b) Distribution of neuronal cell types varying longitudinally along the body, with endodermal nerve net cell types in tan and ectodermal nerve net cell types in green. Cell types were identified through single-cell RNA sequencing (Siebert et al., 2019).
Figure 2 with 9 supplements
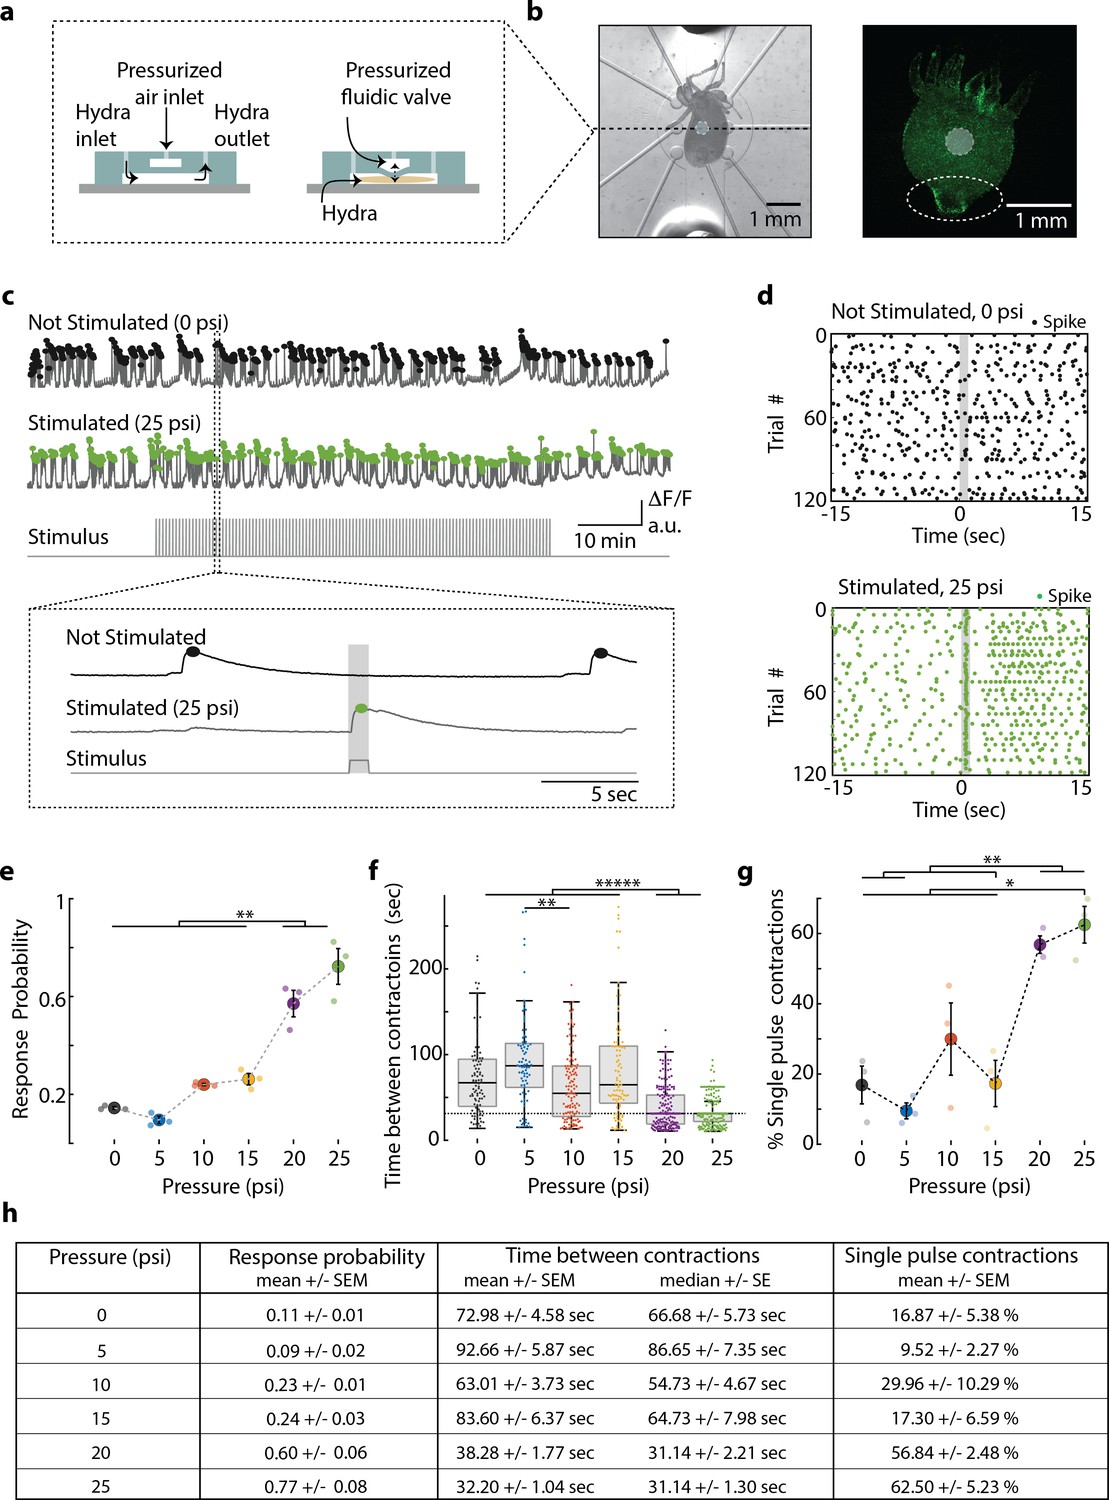
Hydra’s neuronal response depends on the mechanical stimulus intensity.
(a) (Left) Side view of double-layer microfluidic device for mechanical stimulation. (Right) Device with pressurized valve. Hydra is immobilized in the bottom Hydra layer, and pressurized air supplied into the valve layer causes the circular membrane (400 µm diameter) to push down on Hydra. (b) (Left) Brightfield image of Hydra immobilized in the bottom layer of the chip and the arrangement of micro-valves on the top layer. The micro-valve used for stimulation is falsely colored with a light blue circle. (Right) Fluorescent image of Hydra with pan-neuronal expression of GCaMP6s. White dashed circle marks the peduncle region of interest (ROI) used for quantifying calcium fluorescence changes. (c, d) Representative calcium fluorescence activity in the peduncle region from an animal not stimulated and an animal mechanically stimulated with 25 psi. Black and green dots indicate fluorescence (calcium) spikes. Gray shaded regions indicate stimulus ‘on’ time (also ‘response window’). (c) Fluorescence (calcium) trace from Hydra not stimulated (top) and stimulated with 25 psi (middle). Stimulation protocol in gray (bottom trace): 20 min no stimulation, 1 hr of repeated stimulation (1 s ‘on,’ 30 s ‘off’) and 20 min no stimulation. Stimulus ‘on’ times indicated with vertical lines. Magnification of 30 s fluorescence and stimulation protocol trace from one stimulation trial. (d) Raster plot of stimulus time-aligned spiking activity from multiple trials superimposed for Hydra not stimulated (top) and stimulated with 25 psi (bottom). (e) Mechanosensory response probability, fraction of trials (out of 119 total) that have at least one calcium spike (also contraction pulse) occurring during the 1 s response window (gray shaded region) when valve is pressurized. Large circles indicate average probability from all animals (N = 3) combined for each condition. Small circles indicate probability from a single animal. Significant pairwise comparisons are shown with brackets (one-way ANOVA with post-hoc Bonferroni correction). (f) Time interval between body contractions under each condition. Dashed line represents the time interval between stimuli (~31 s). Brackets indicate significant differences in a Kruskal–Wallis test with post-hoc Dunn–Sidak correction. (g) Percent of all body contractions that are a single pulse; brackets show significant pairwise comparisons from a one-way ANOVA with post-hoc Bonferroni correction. Error bars are standard error of mean (SEM); N = 3 Hydra for each condition; *p<0.05, **p<0.01, *****p<0.00001. (h) Table summarizing the mechanosensory response probability, time between contractions, and percent of contractions that are single pulses for each stimulus intensity (mean ± SEM or median ± SE). Source data for the quantitative characterization of mechanosensory response are available in Figure 2—source data 1.
-
Figure 2—source data 1
source file for stimulus-dependent mechanosensory response.
The file (Fig2_SourceData.mat) contains all source data used for quantitatively characterizing mechanosensory response shown in Figure 2. The file contains a struct named ‘HydraData’ with each trial in a different row. The columns contain the raw and processed data for each trial: ‘StimCondition’ indicates the stimulation pressure (0, 5, 10, 15, 20, or 25 psi) used during the trial; ‘RawFluorescenceFoot’ contains the raw fluorescence values from foot/peduncle region of interest (ROI); ‘StimulationTrace’ contains the trace of stimulus delivery where 0 is valve off, 1 is valve on (and stimulation is being applied) per frame; ‘Response Probability’ is extracted after processing ‘RawFluorescenceFoot’ with stimulation onset times from ‘StimulationTrace’; ‘TimeBetweenContractions’ is time in seconds between contraction burst pulses extracted from ‘RawFluorescenceFoot’; ‘SinglePulseContractions_Percent’ is the percent of body contractions that occur as single pulses extracted from ‘RawFluorescenceFoot’.
- https://cdn.elifesciences.org/articles/64108/elife-64108-fig2-data1-v2.mat
Figure 2—figure supplement 1
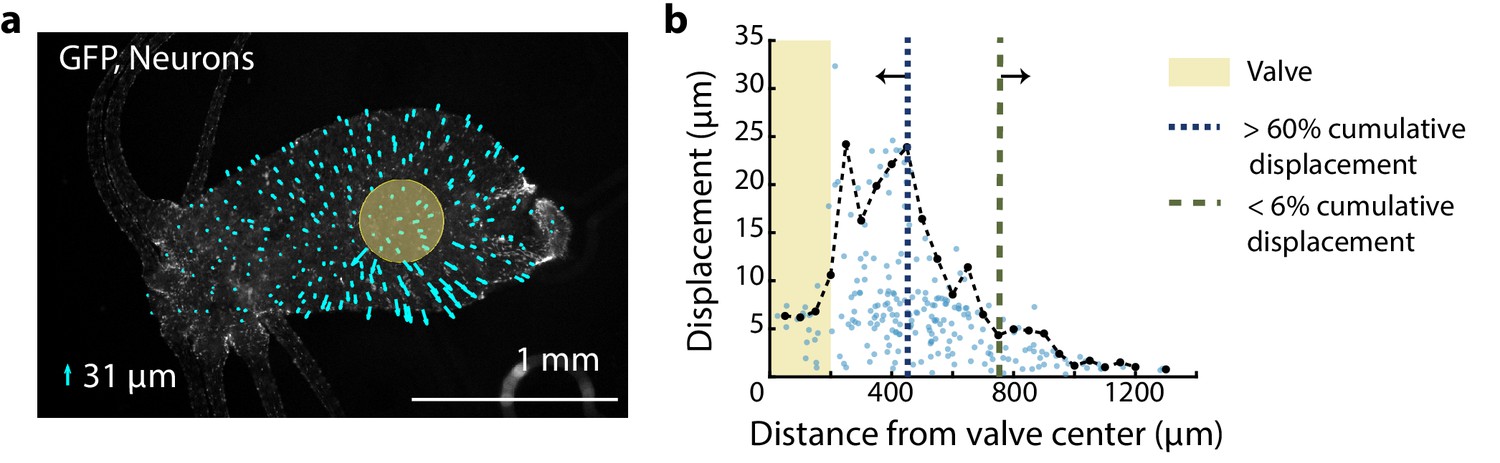
Distribution of mechanical forces.
Fluorescent image (grayscale) of transgenic Hydra (nGreen) expressing GFP in neurons and neural progenitors. The oral region is on the left. Aboral//peduncle region is on the right. Arrows (cyan) overlayed indicate the displacement of individual cells immediately before and after the valve is pressurized for stimulation (~50 ms). The lengths of the arrows are enlarged to be visible with the scaled size of the largest displacement ~31 µm as indicated by the legend (lower left). Semi-transparent (yellow) circle indicates the location of the valve (400 µm diameter). (b) Displacement of neurons due to stimulation varies with the location of the neurons from the valve center. Each semi-transparent blue dot represents a single neuron (n = 222 neurons). Black dots (connected by black dashed line) represent the average displacement of the highest three displacements within a 50 µm radial band. Microfluidic valve has a radius of 200 µm indicated by the yellow-shaded region. Majority of the cumulative displacement (>60%) is localized to a 250 µm radius bordering the valve indicated by the blue dashed line at 450 µm. Neurons more than 750 µm from the microfluidic valve center have negligible displacement (<6% cumulative displacement) indicated by the green dashed line.
Figure 2—figure supplement 2
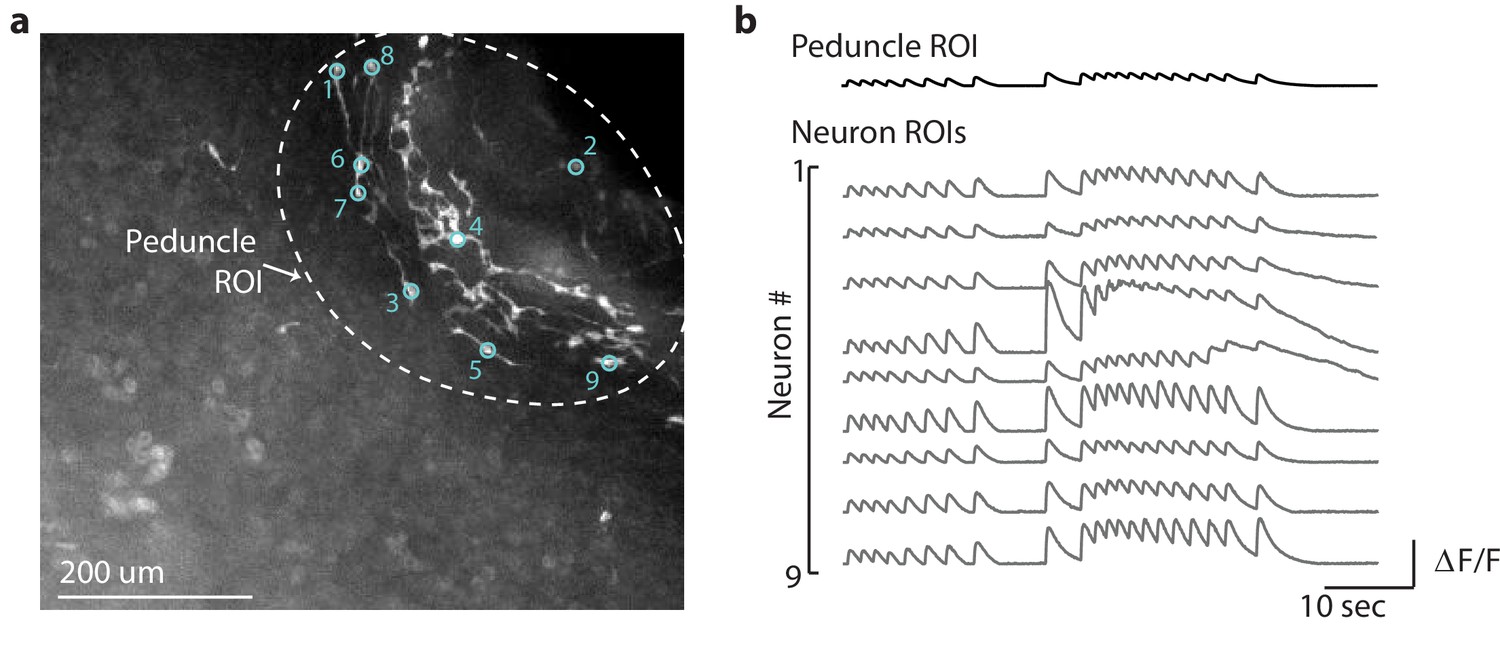
Average calcium fluorescence from large peduncle region of interest (ROI) correlated with calcium fluorescence from smaller ROIs for individual peduncle neurons.
(a) Fluorescent image of transgenic Hydra expressing GCaMP6s pan-neuronally. Dashed while circle indicates the peduncle ROI. Small cyan circles indicate the individual neuron ROIs. Peduncle region is in the top right. The oral end of the Hydra (not shown in the image) is oriented towards the bottom-left corner. (b) Average calcium fluorescence trace (black) from the large peduncle ROI. Average calcium traces (gray) from individual neurons in the peduncle.
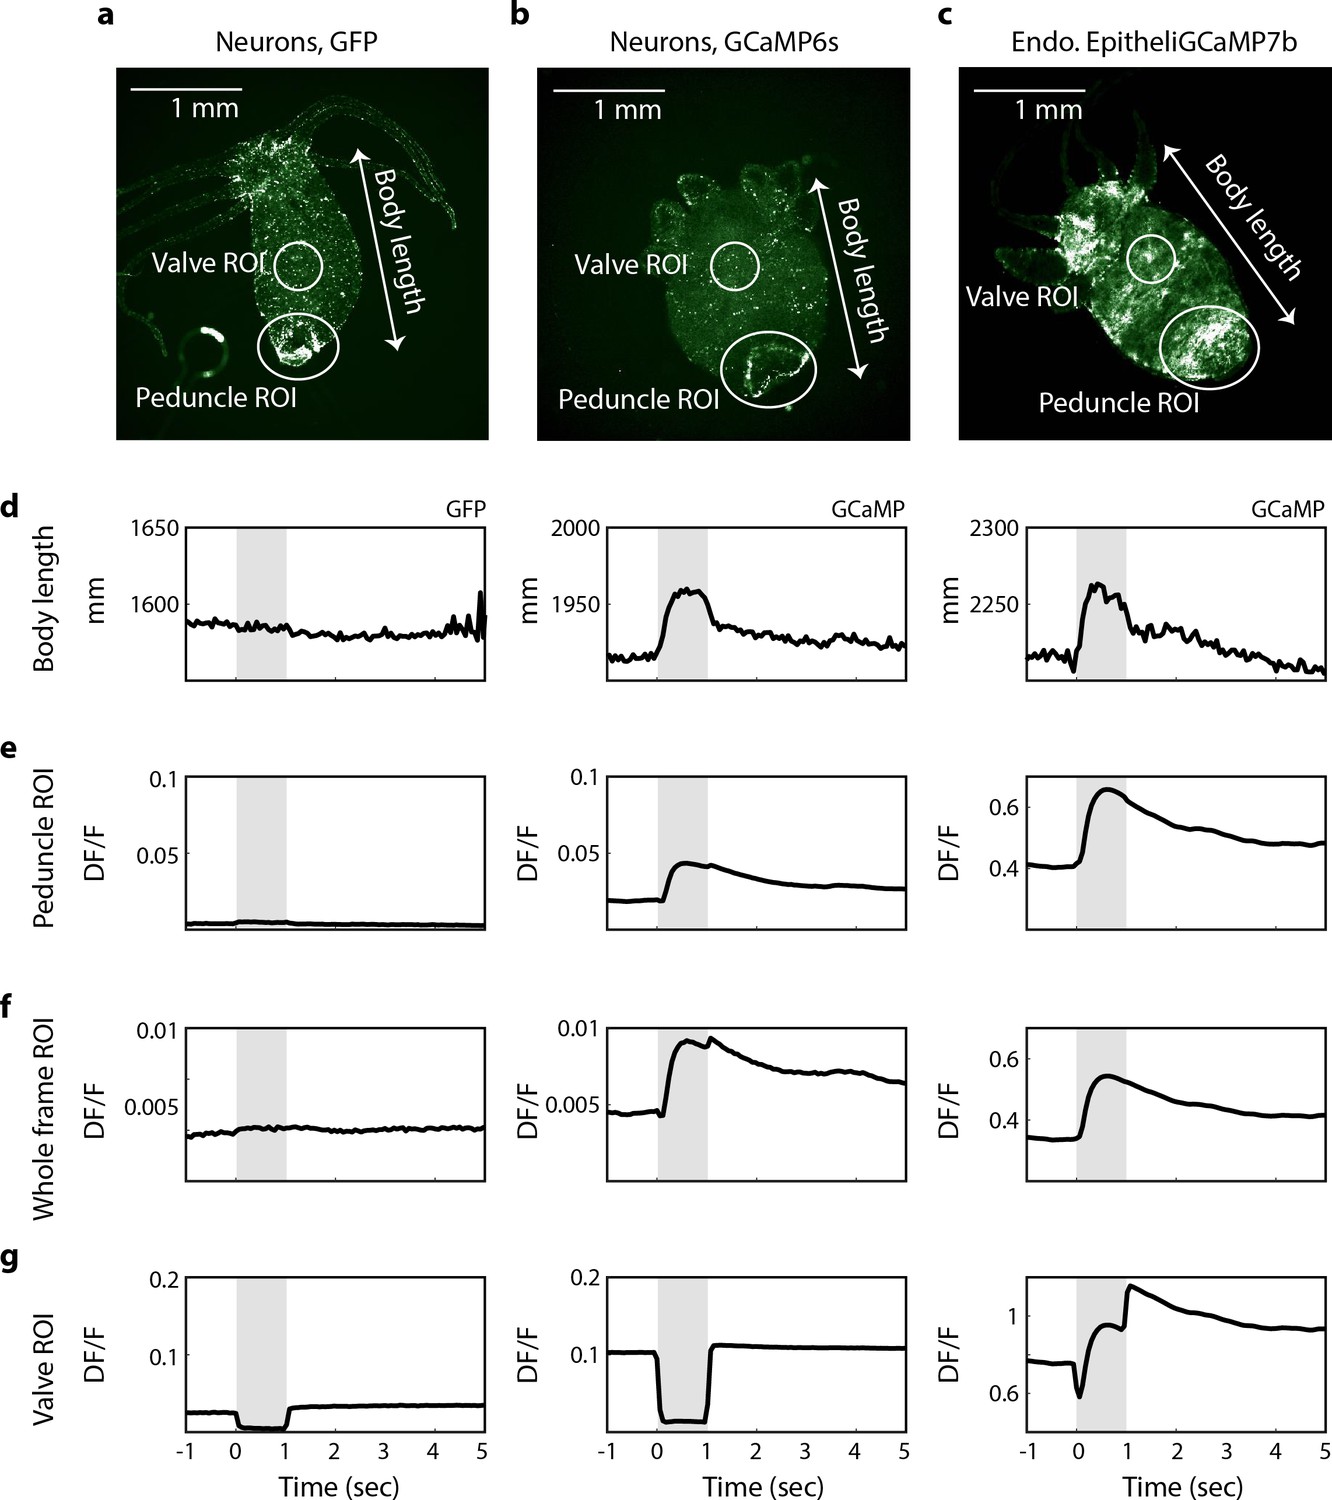
Figure 2—figure supplement 3
Spikes in calcium fluorescence are due to calcium activity not motion artifacts.
(a) Fluorescence image of transgenic Hydra (nGreen) expressing GFP in neurons false colored with hot green colormap. Neurons appear in white. (b) Fluorescence image of transgenic Hydra expressing GCaMP6s in neurons false colored with hot green colormap. (c) Fluorescence image of transgenic Hydra expressing GCaMP7b in endodermal epitheliomuscular cells false colored with hot green colormap. (a–c) Body length (white arrow), valve region of interest (ROI) (top circles), peduncle ROI (larger bottom circles), and whole-frame ROI (entire frame square) annotated on all three images for comparison. (d) Average body length trace time-aligned to stimulus onset from GFP Hydra (left) and GCaMP Hydra (middle, right). Light gray-shaded region indicates when the stimulation is on. (e) Average fluorescence trace calculated from the annotated peduncle ROI from GFP Hydra (left) and GCaMP Hydra (middle, right). (f) Average fluorescence trace calculated from the whole-frame ROI from GFP Hydra (left) and GCaMP Hydra (middle, right). (g) Average fluorescence trace calculated from the annotated valve ROI from GFP Hydra (left) and GCaMP Hydra (middle, right).
Figure 2—figure supplement 4
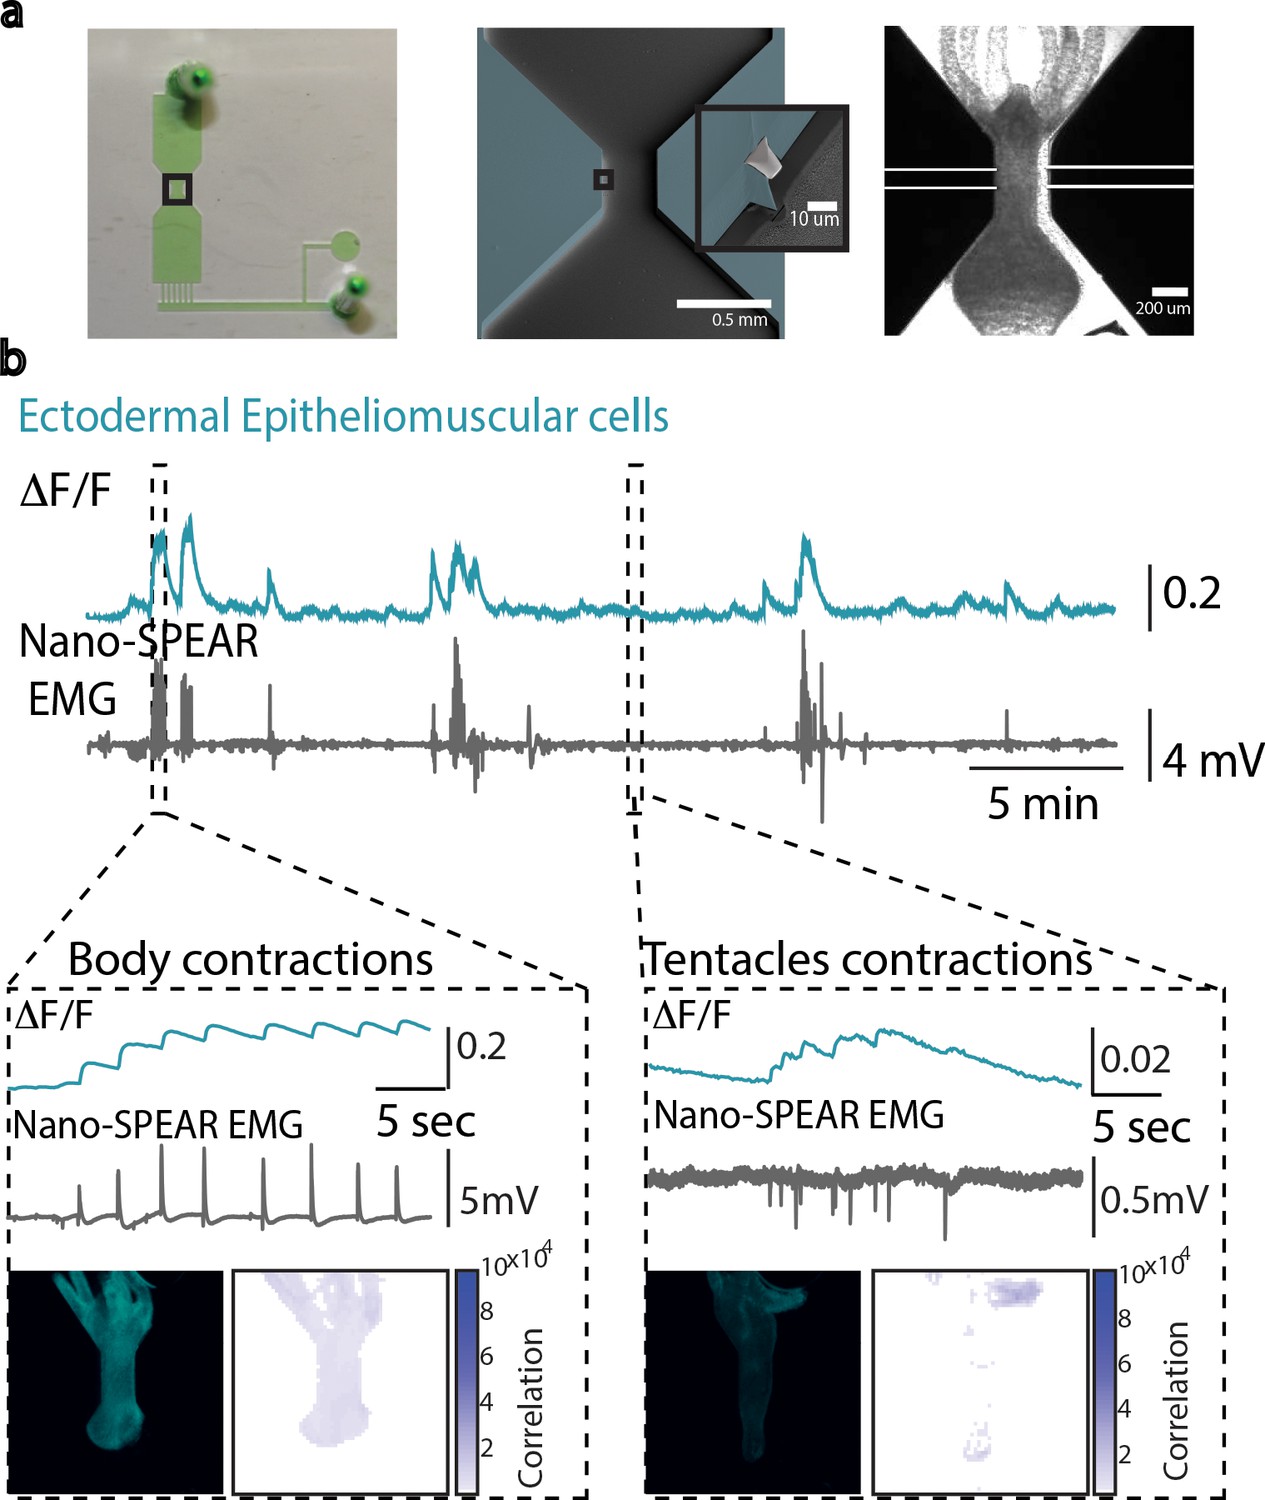
Simultaneous electrophysiology and calcium imaging of ectodermal epitheliomuscular cells.
(a) Photograph (left) of a microfluidic immobilization chamber filled with green dye. Black box highlights the recording region in the microfluidic chamber (110 µm tall). False-colored scanning electron micrograph (middle) shows the recording region (blue, photoresist; light gray, Pt; dark gray, silica) on the nano-SPEAR chip (50 µm tall). Inset shows a zoom-in of the Pt electrode (light gray) suspended midway between the top and bottom of the photoresist sidewall (blue). Brightfield image (right) shows Hydra immobilized in the microfluidic chamber placed on top of the nano-SPEAR chip with combined 160 µm tall recording region. (b) Simultaneous electrophysiology and calcium imaging in transgenic Hydra (GCaMP6s, ectodermal epitheliomuscular cells). Top trace shows mean fluorescence (∆F/F) from ectodermal epitheliomuscular cells (whole-frame region of interest [ROI]) in Hydra (GCaMP, ectodermal) (10 Hz). Bottom trace shows simultaneously recorded electrical activity from the Hydra (1 kHz). High- and low-activity periods identified based on peak amplitude. Inset: left box shows correlation during high-activity period, contraction bursts. Traces show peaks in fluorescence (top trace) coinciding with peaks in electrophysiology (bottom trace). A representative fluorescence image shows high levels of fluorescence thus calcium activity in the entire body during contraction burst events. Correlation map spatially plotting the correlation coefficient shows the entire body has calcium activity correlated with electrophysiology. Inset: right box shows correlation during low-activity period, tentacle pulses. Traces show peaks in fluorescence (top trace) coinciding with peaks in electrophysiology (bottom trace). A representative fluorescence image shows high levels of fluorescence in the tentacle region during tentacle pulses. Cross-correlation map shows the tentacle region has calcium activity correlated with electrophysiology. Almost all spikes in electrophysiology coincide with spike in fluorescence from ectodermal epitheliomuscular cells (and behavioral contractions).
© 2018, The Royal Society of Chemistry. Panel a is reproduced from Figure 2A, Badhiwala et al., 2018 by permission of The Royal Society of Chemistry. Panel a is not covered by the CC-BY 4.0 license, and further reproduction of this panel would need permission from the copyright holder.
Figure 2—figure supplement 5
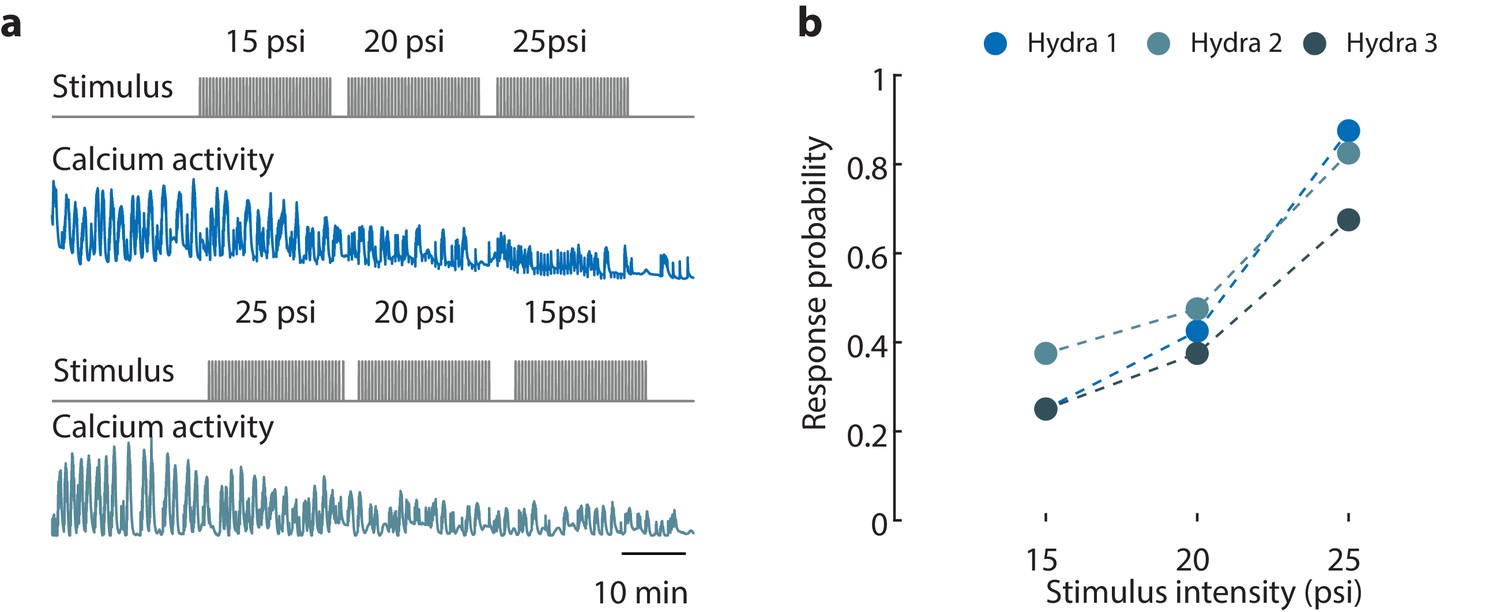
Hydra’s epitheliomuscular response is dependent on the mechanical stimulus intensity.
(a) Gray trace (top) is the stimulation protocol. 20 min no stimulation, 20 min of repeated stimulation (1 s ‘on,’ 30 s ‘off’) at 15 psi, 20 min of repeated stimulation (1 s ‘on,’ 30 s ‘off’) at 20 psi, and 20 min of repeated stimulation (1 s ‘on,’ 30 s ‘off’) at 25 psi. Stimulus ‘on’ times indicated by vertical lines. Entire frame region of interest (ROI) used for analysis of the whole-body epithelial calcium activity. Representative calcium fluorescence trace (blue) from endodermal epitheliomuscles (GCaMP7b) from animal stimulated with three different stimulus intensities for 20 min each (15, 20, and 25 psi). Representative calcium fluorescence trace (teal) from endodermal epitheliomuscles (GCaMP7b) from animal stimulated with three different stimulus intensities for 20 min each (25, 20, and 15 psi). The decrease in fluorescence amplitude observed for both increasing in and decreasing stimulus intensity is due to photobleaching of the calcium indicator. (b) Mechanosensory response probability at different stimulus intensities (N = 3 animals). Response probability, fraction of trials that have at least one calcium spike (also contraction pulse) occurring within 1 s of stimulation onset.
Figure 2—figure supplement 6
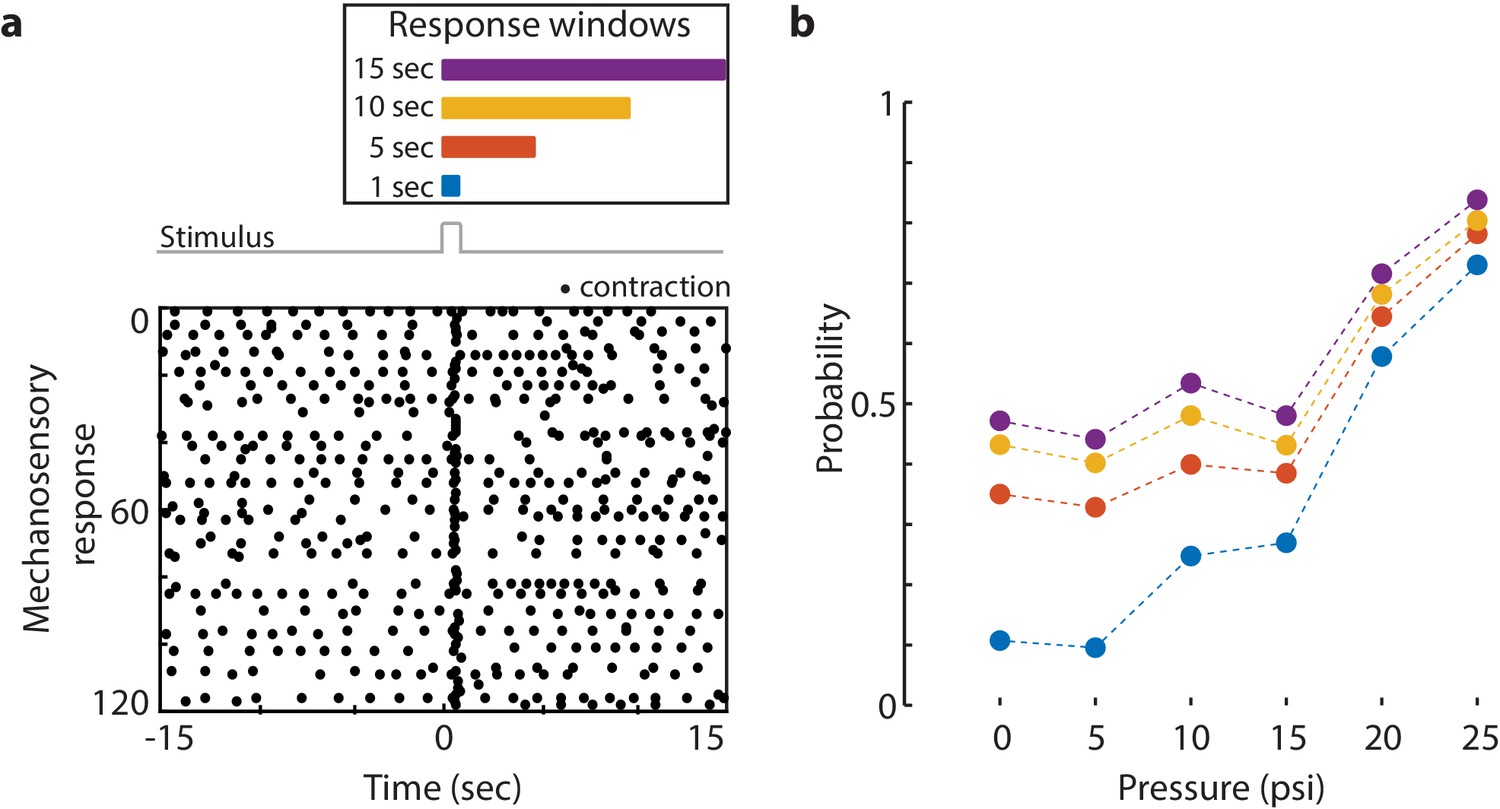
Mechanosensory response window.
(a) Different response windows tested (1 s in blue; 5 s in orange; 10 s in yellow; and 15 s in purple). (Top) The lengths of the rectangles correspond to time (s) in the raster plot below. Stimulus trace in gray. Representative raster plot of time-aligned contraction pulses from multiple trials superimposed from one animal stimulated at 20 psi every 31 s for 60 min. (Bottom) Each black dot is a spike in calcium fluorescence identified as a contraction pulse. Stimulus is applied from 0 to 1 s as indicated by a step in stimulus trace. (b) Response probability, fraction of trials that have at least one calcium spike (also contraction pulse) occurring during different response windows (1 s in blue; 5 s in orange; 10 s in yellow; and 15 s in purple within stimulation onset).
Figure 2—figure supplement 7
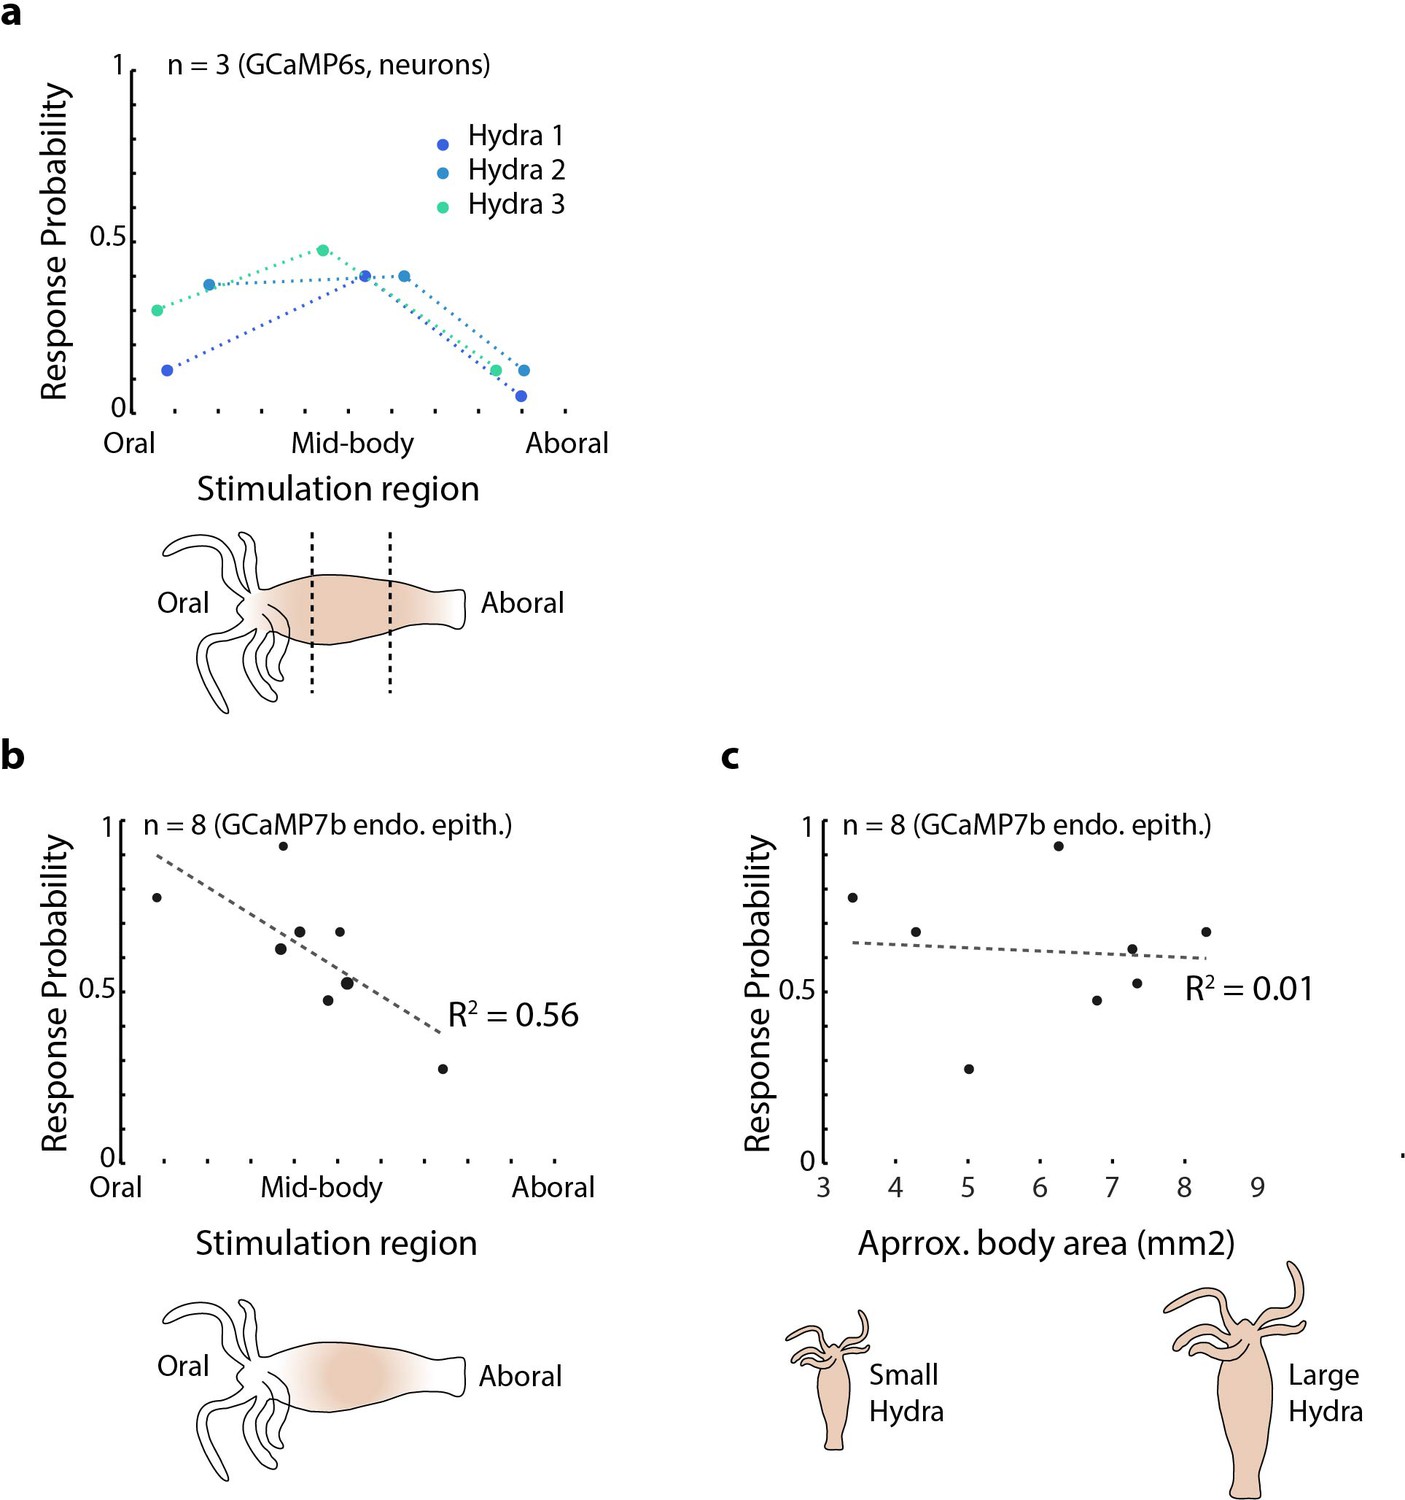
Mechanical sensitivity of different body regions in Hydra.
(a) Response probability of transgenic Hydra (N = 3 animals expressing GCaMP6s in neurons) stimulated at three different body regions: oral, mid-body, and aboral. Annotated Hydra below the plot indicates the three stimulation regions used. (b) Response probability of transgenic Hydra (n = 8 animal expressing GCaMP7b in endodermal epitheliomuscular cells). Response probability is calculated using average calcium fluorescence from neurons in the peduncle region of interest (ROI) in (a) and using average calcium fluorescence from the endodermal epitheliomuscular cells from the entire body in (b) and (c).
Figure 2—figure supplement 8
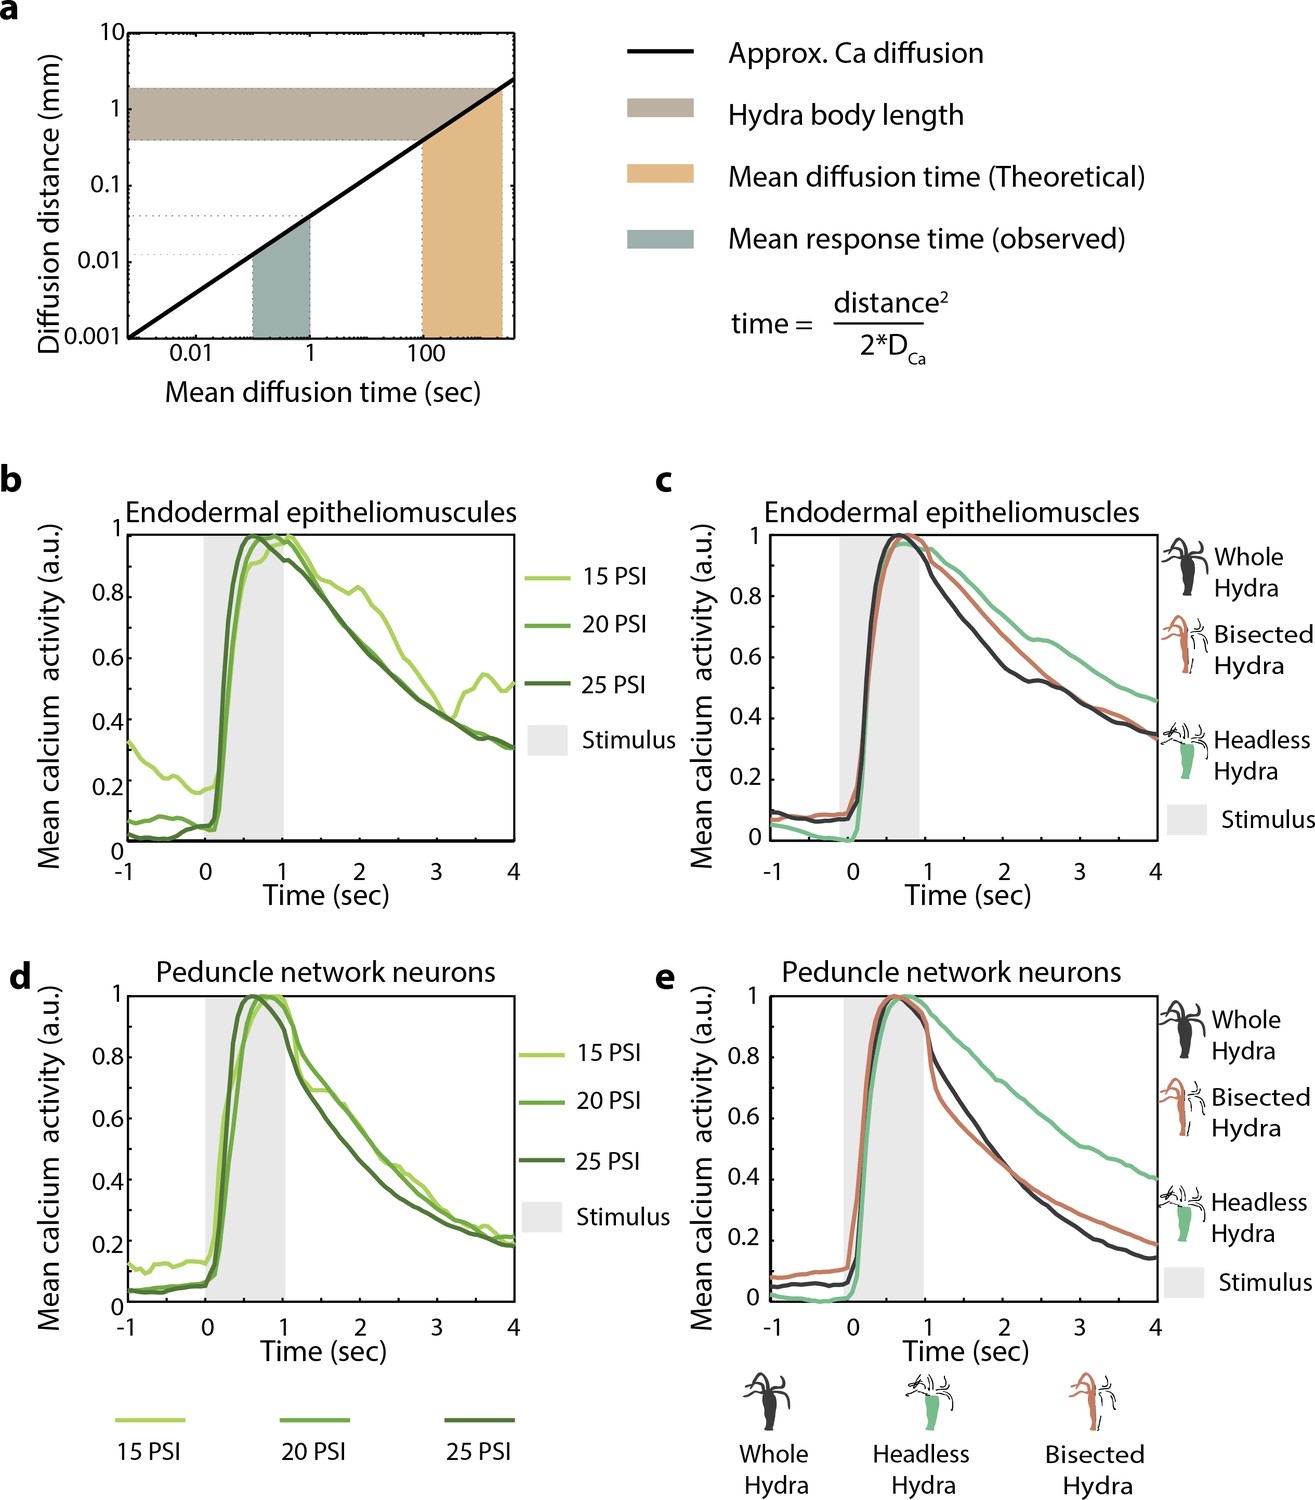
Hydra’s mechanosensory response time is faster than passive calcium diffusion through epitheliomuscular cells.
(a) Distance calcium diffuses passively over given time (left, black line plot) approximated using passive diffusion equation (right). Light brown-shaded region indicates the range of body length (~0.5–1 mm) of Hydra in microfluidic chambers used for the experiments. Teal-shaded region indicates the average time between stimulus onset and observed spike in fluorescence (mean response time 0.5–1 s). Yellow-shaded region is the theoretical mean calcium diffusion time calculated assuming passive diffusion. (b–e) Mean calcium fluorescence time-aligned to stimulus and normalized. Stimulus is applied at 0 s (valve ‘on’ from 0 to 1 s). (b) Mean calcium activity from the peduncle network of neurons at different stimulus intensities. (c) Mean calcium activity from endodermal epitheliomuscular cells at different stimulus intensities. (b, c) The line colors correspond to different stimulus intensities shown at the bottom. (d) Mean calcium activity from peduncle network of neurons in different body resections stimulated at 20 psi (pressure for ~60% response probability in whole animals). (e) Mean calcium activity from endodermal epitheliomuscular cells in different body resections different body resections stimulated at 22 psi (pressure for ~60% response probability in whole animals). (d, e) The line colors correspond to the different resections shown at the bottom with cartoon schematic of the resected Hydra with the same color.
Figure 2—figure supplement 9
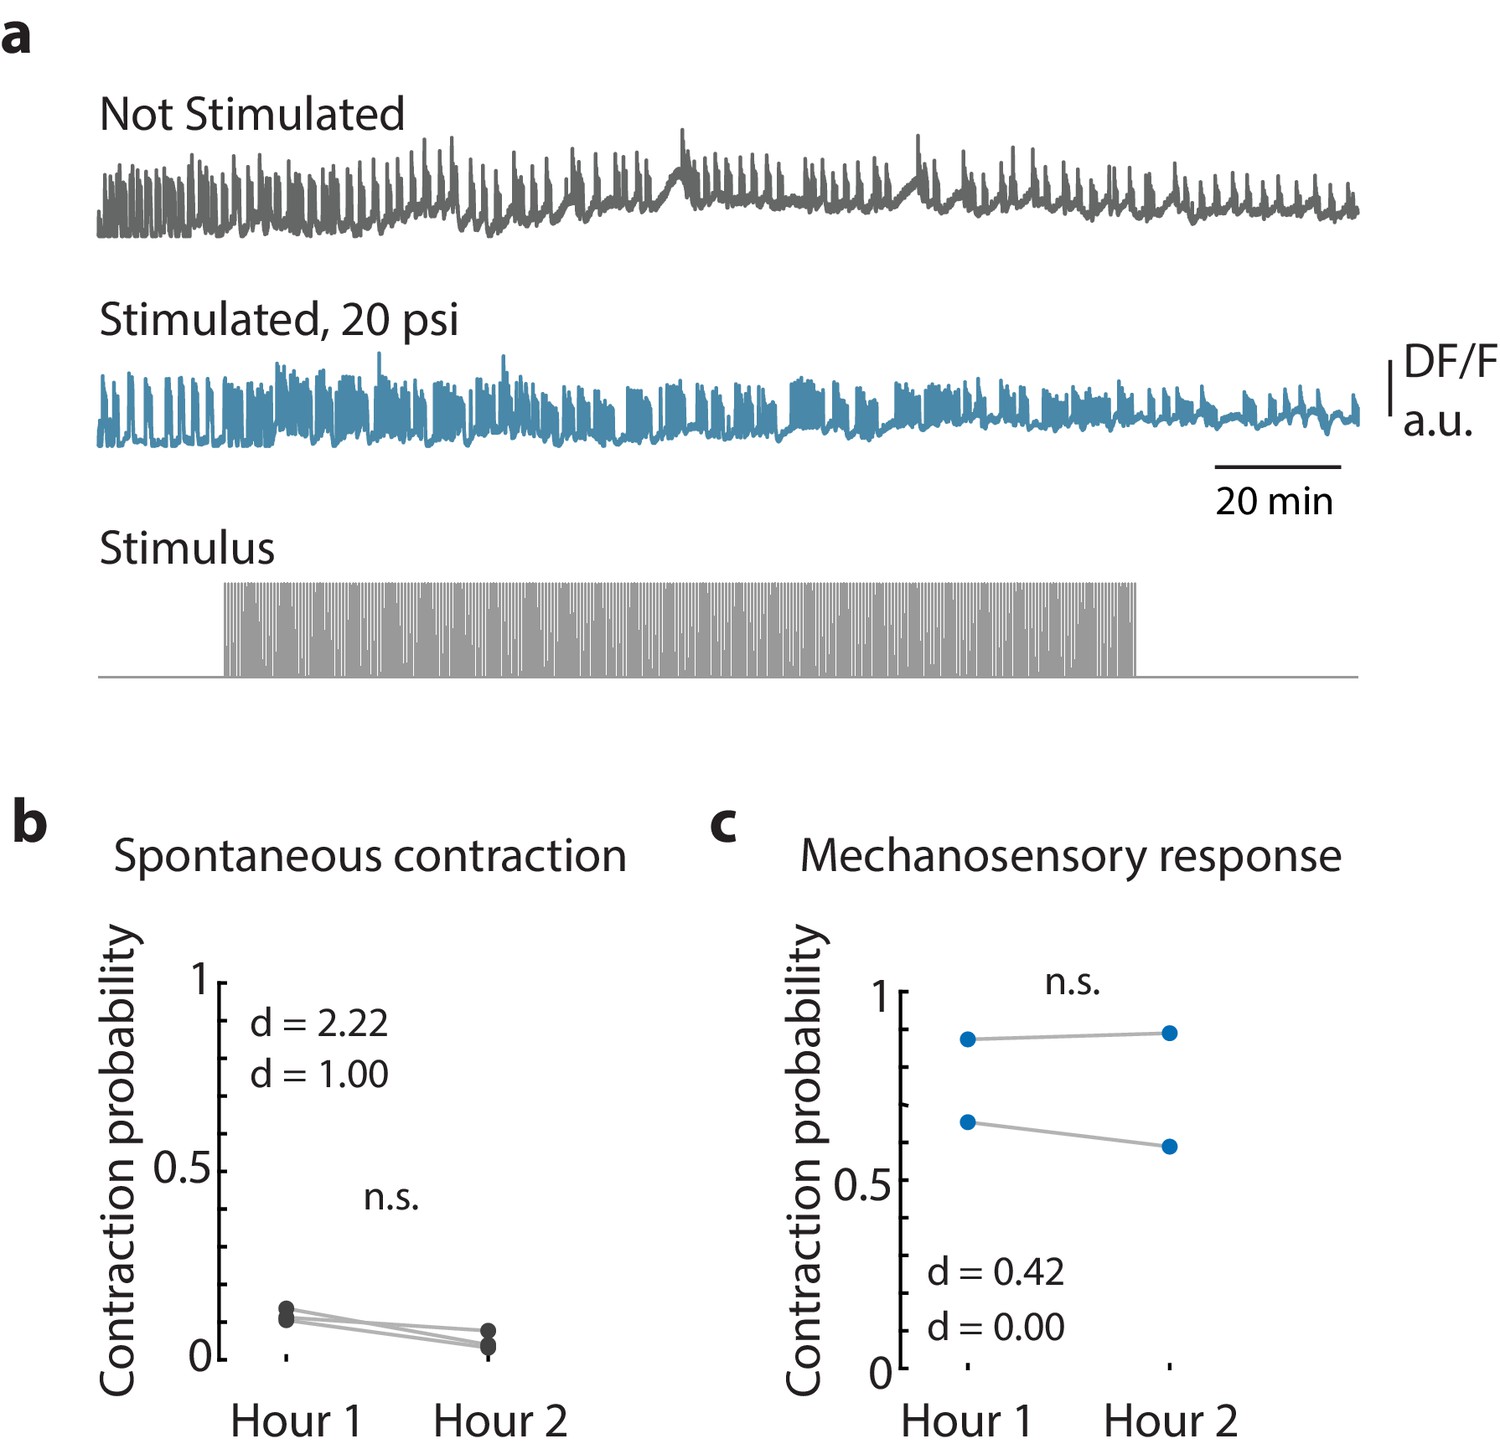
Long-term mechanical stimulation.
(a) Representative calcium fluorescence trace from the peduncle region from an animal (GcaMP6s, neurons) not stimulated and animal mechanically stimulated with 20 psi. Stimulus protocol in gray, 20 min no stimulation, 120 min of repeated stimulation (1 s ‘on,’ 30 s ‘off’) at 20 psi followed by no stimulation. (b) Spontaneous and (c) stimulated (mechanosensory response) contraction pulse probabilities for the first and second hour of stimulation compared for each animal. Gray circles are mean contraction pulse probability during no stimulation calculated from an average of 1 s window shifted by ~0.3 s over 30 s intervals (N = 3). Blue circles are contraction probability during stimulation calculated from 1 s response window during valve ‘on’ (N = 2). Light gray lines indicate the change in probabilities from hour 1 to hour 2 for each individual (paired t-test, n.s. = not significant).
Figure 3 with 5 supplements
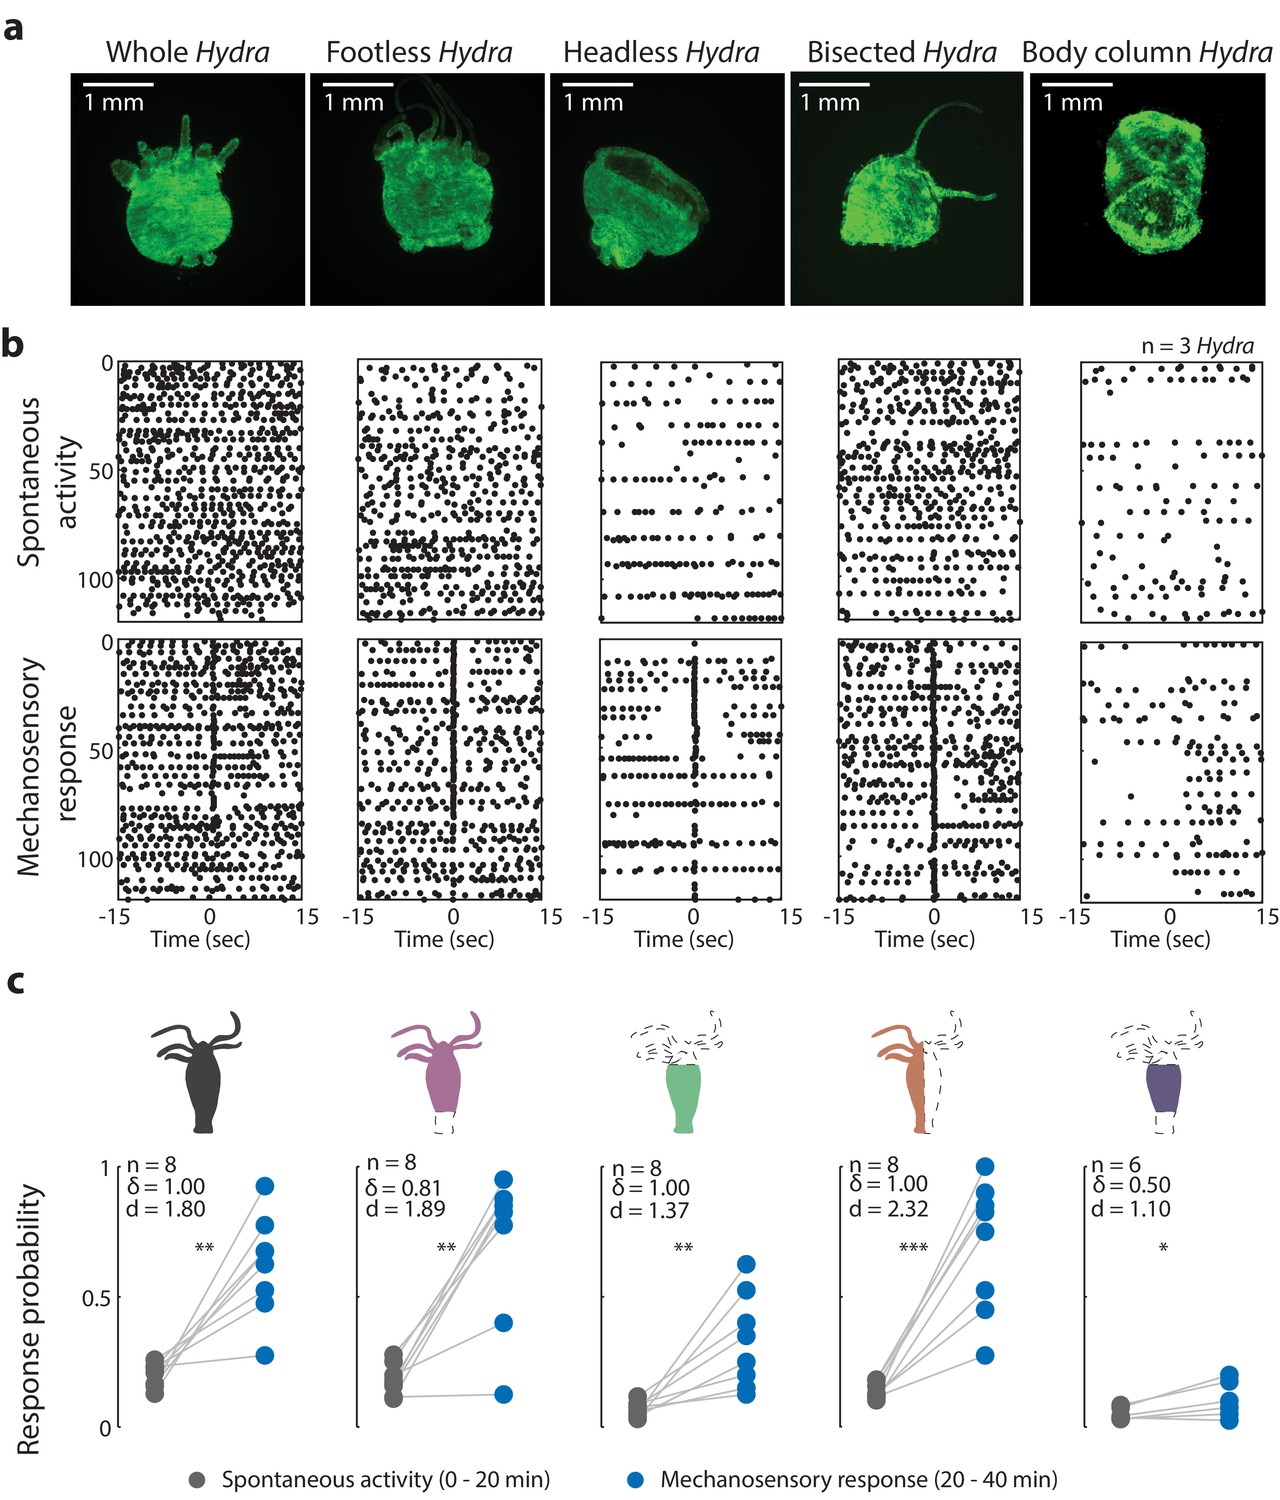
Oral region is important for mechanosensory response.
(a) Representative images of resection preparations (6–12 hr post-resections) of transgenic Hydra during contraction (GCaMP7b, endodermal epitheliomuscular cells): whole (or control), footless, headless, bisected, and body column animal. Entire frame region of interest (ROI) was used for analysis of the whole-body epithelial calcium activity. (b) Representative raster plot of stimulus time-aligned calcium spikes from three animals with multiple trials superimposed. Each black dot is a peak in calcium fluorescence identified as a contraction pulse. (c) Response probability, fraction of trials that have at least one calcium spike (also contraction pulse) occurring within 1 s of stimulation onset. Gray dots are the mean contraction probability during no stimulation (t = 0–20 min) calculated from 1 s window shifted by ~0.3 s over 30 s intervals. Blue dots are contraction probability during stimulation (t = 20–40 min) calculated from 1 s response window during valve ‘on.’ Light gray lines connect the probabilities for spontaneous contraction and mechanosensory response for each individual. Cartoon schematics of Hydra indicate the resections performed. Excised body regions are outlined with a dashed line and unfilled area. Color-filled body regions indicate the portion of Hydra retained for the experiment. p-values from a paired t-test indicated as follows: n.s. = not significant; *p<0.05; **p<0.01; ***p<0.001. Source data for the mechanosensory response in resected animals are available in Figure 3—source data 1.
-
Figure 3—source data 1
Source file of mechanosensory response in resected animals.
The file (Fig3_SourceData.mat) contains all source data used for characterizing mechanosensory response in resected animals in Figure 3. The file contains a struct named ‘HydraData’ with each trial in a different row. The columns contain the raw and processed data for each trial: ‘StimCondition’ indicates stimulation condition (w/or w/o stimulation; body resections – whole, bisected, no foot = footless, no head = headless, no head and foot = BodyColumn); ‘RawFluorescenceFoot’ contains the raw fluorescence values from foot/peduncle region of interest (ROI); ‘StimulationTrace’ contains the trace of stimulus delivery where 0 is valve off, 1 is valve on (and stimulation is being applied) per frame; ‘Response Probability’ is the stimulated contraction probability extracted after processing ‘RawFluorescenceFoot’ with stimulation onset times from ‘StimulationTrace’; ‘BasalContractionProbability’ is spontaneous contraction probability extracted after processing ‘RawFluorescenceFoot’ during (t = 0–20 min) the initial acclimation period without stimulation.
- https://cdn.elifesciences.org/articles/64108/elife-64108-fig3-data1-v2.mat
Figure 3—figure supplement 1
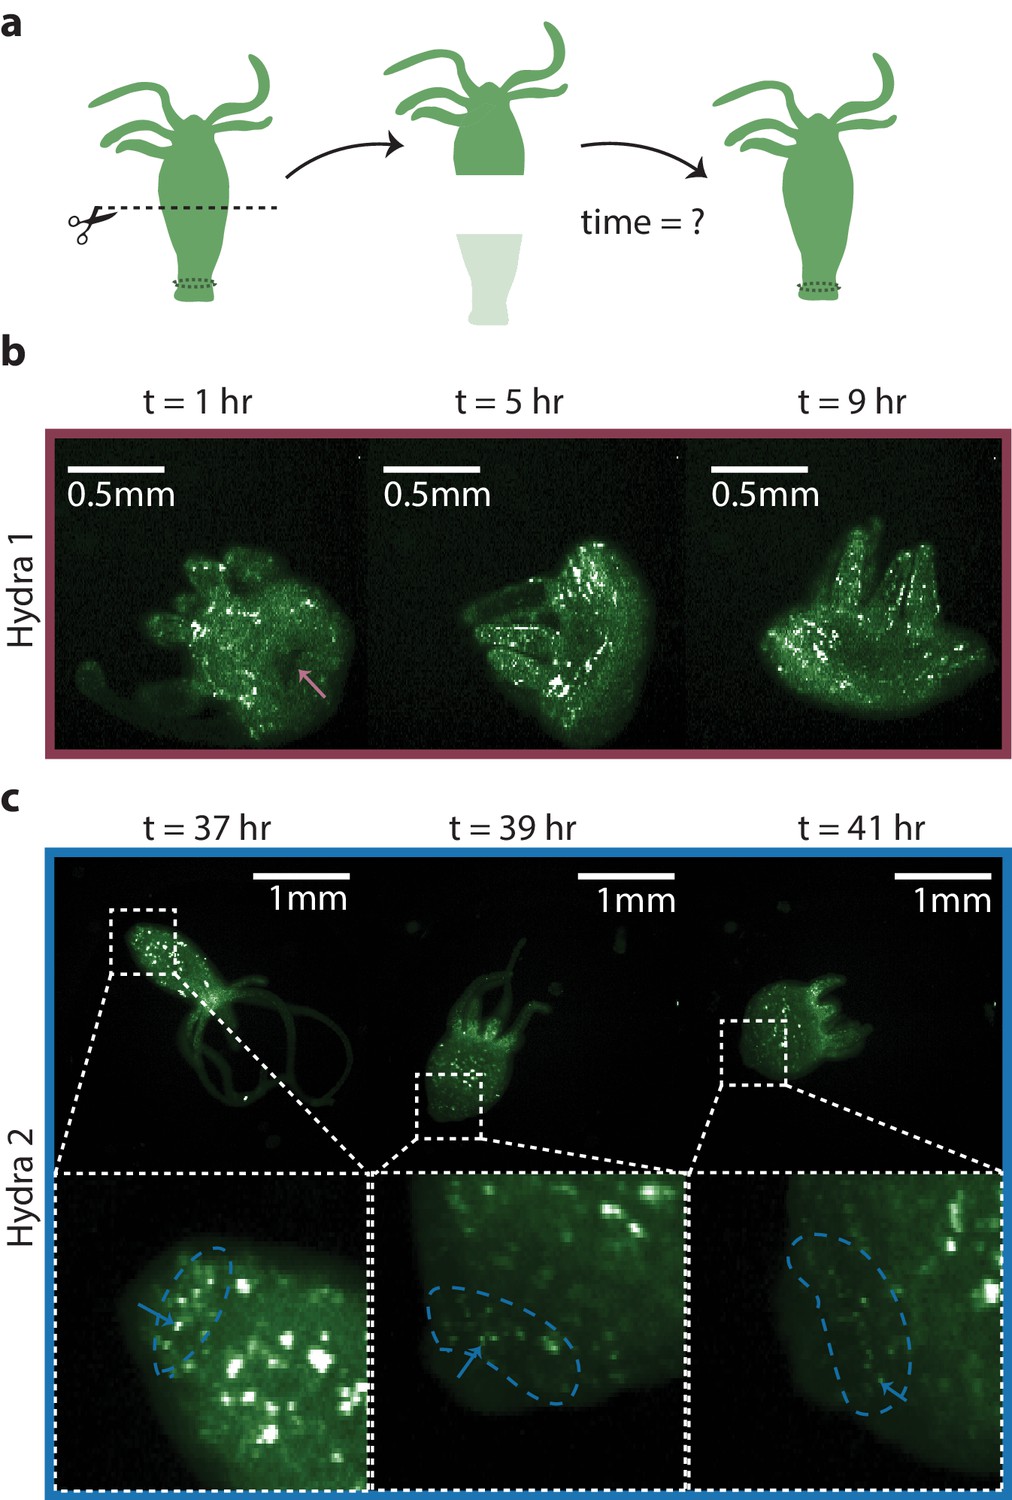
Regeneration of the peduncle network.
(a) Summary schematic of the experiment performed. Dashed line indicates where the incision was made to remove the lower half of the transgenic Hydra body (GcaMP6s, neurons) to discover when the peduncle neuronal network is regenerated. (b) Fluorescence images of ‘footless’ Hydra during body contractions at various timepoints t = 1 hr, 5 hr, and 9 hr after bisection. Pink arrow indicates the open wound visible at t = 1 hr but not at other timepoints. (c) Fluorescence images of another ‘footless’ Hydra during body contractions at various timepoints t = 37 hr, 39 hr, and 41 hr. Blue dashed circle indicates the region where the peduncle network is found. Blue arrows indicate some of the neurons in the peduncle network with clearly well-connected neurons at t = 41 hr.
Figure 3—figure supplement 2
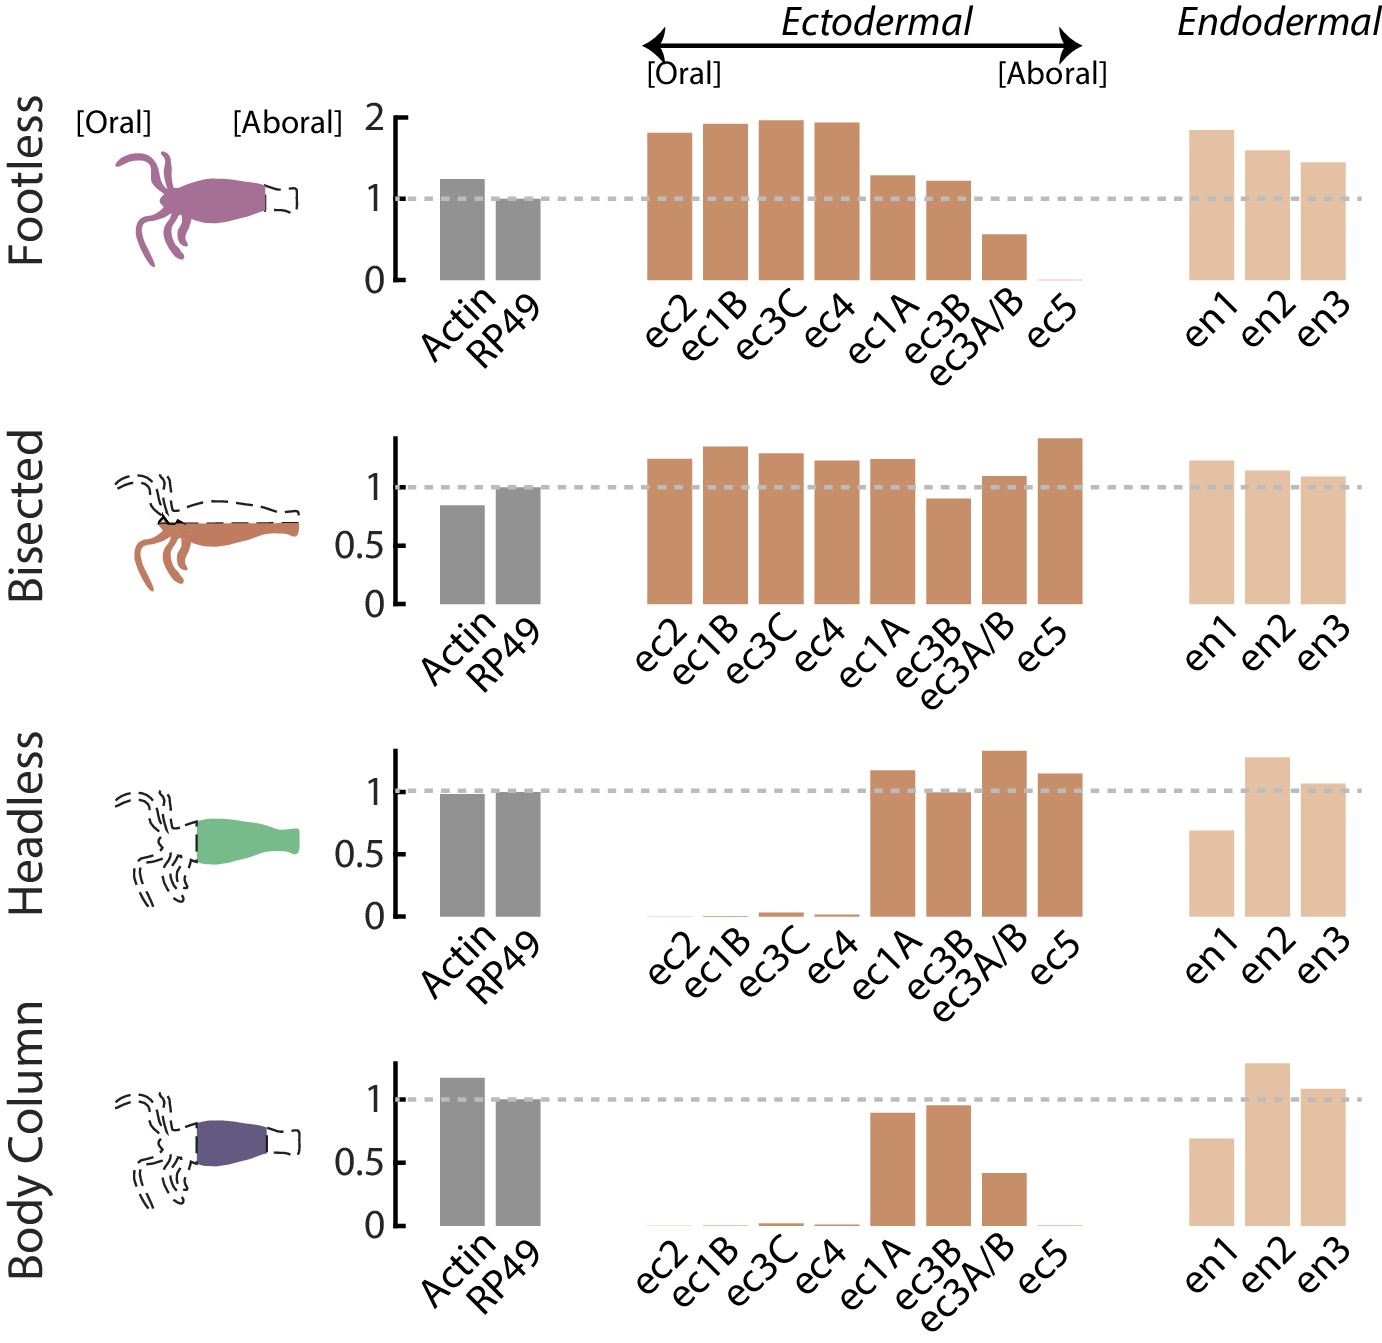
RT-qPCR analyses of neuron subtype-specific gene expression in resected animals demonstrates loss of specific neuron subtypes.
RT-qPCR was used to test for the loss of specific neuron subtypes in whole, tube (no head or foot), headless, footless, and bisected Hydra using uniquely expressed biomarkers for each subtype. There is not a specific biomarker for ec3A (located in the basal disk), so the marker used to test for the presence or absence of this cell type is also expressed in ec3B (located in the body column). Therefore, expression of the ec3A/B marker gene is reduced, but not completely lost in animals with resected feet (‘tube’ and ‘footless’). However, ec5 expression (located in the peduncle above the basal disk) is completely lost in animals with resected feet, thus it is clear that the ec3A subtype is completely lost in these animals. Biomarkers for neuron subtypes located in the head and tentacles (ec1B, ec2, ec3C, ec4) are completely lost in animals with resected heads (‘headless’ and ‘tube’). Data were analyzed with the 2^-ΔΔCt method, and results were normalized to the housekeeping gene RP49 and to expression in whole animals.
Figure 3—figure supplement 3
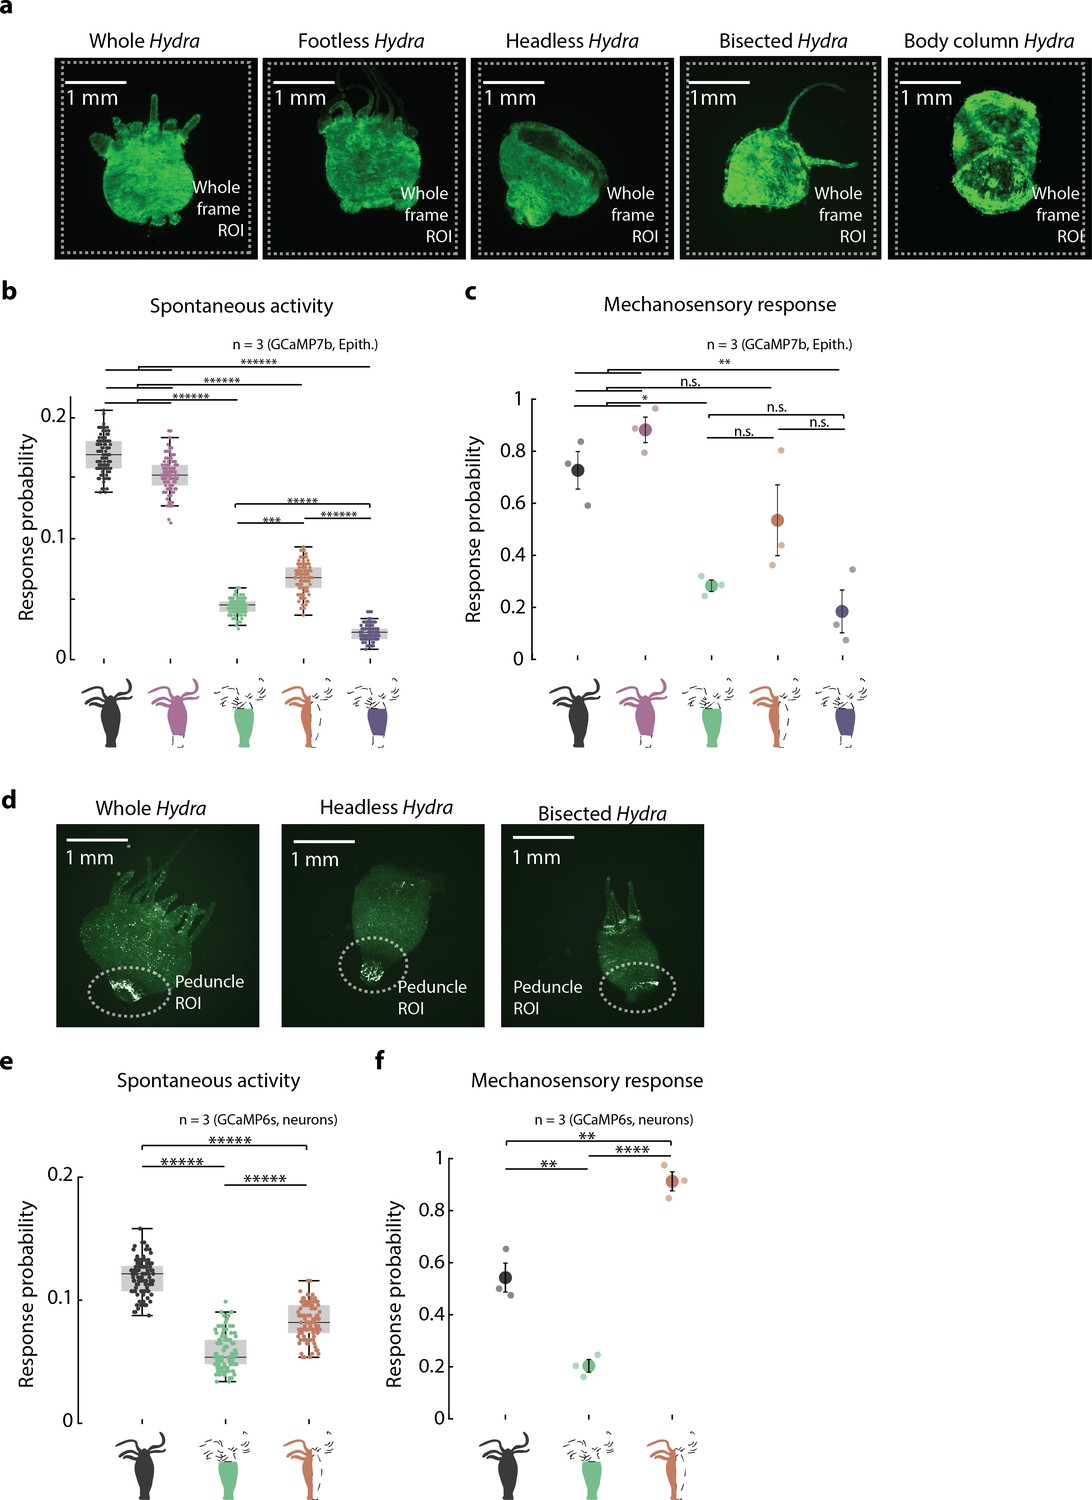
Mechanosensory response from endodermal epitheliomuscular cells and neurons in resected Hydra.
(a) Representative images of resection preparations of transgenic Hydra (GCaMP7b, endodermal epitheliomuscular cells): whole (or control), ‘footless,’ ‘headless,’ ‘bisected,’ and ‘body column.’ White dashed square indicates the whole-frame region of interest (ROI) used for quantifying response. (b) Spontaneous probability of at least one spiking event (or contraction pulse) occurring during a random 1 s window (1 s window slide by ~0.3 s across 30 s stimulation intervals; Kruskal–Wallis test with post-hoc Dunn–Sidak correction). (c) Mechanosensory response probability during 1 s of valve on. Response probability, fraction of trials that have at least one calcium spike (also contraction pulse) occurring within 1 s of stimulation onset. Large circles indicate average values from all animals combined for each condition. Small circles indicate probability from individual animals (one-way ANOVA with post-hoc Bonferroni correction). Error bars are standard error of mean (SEM) (N = 3 Hydra for each condition; analysis from 60 min of stimulation, which is imaging t = 20–80 min; n.s. = not significant, **p<0.01, ****p<0.0001, *****p<0.00001). (d) Representative images of resection preparations of transgenic Hydra (GCaMP6s, neurons): whole (or control), ‘headless,’ and ‘bisected.’ White dashed circle indicates the peduncle ROI used for quantifying response. (e) Spontaneous probability of at least one spiking event (or contraction pulse) occurring during a random 1 s window (1 s window slide by ~0.3 s across 30 s stimulation intervals; Kruskal–Wallis test with post-hoc Dunn–Sidak correction). (f) Mechanosensory response probability during 1 s of valve on. Large circles indicate average values from all animals combined for each condition. Response probability, fraction of trials that have at least one calcium spike (also contraction pulse) occurring within 1 s of stimulation onset. Small circles indicate probability from individual animals (one-way ANOVA with post-hoc Bonferroni correction). Error bars are standard error of mean (SEM) (N = 3 Hydra for each condition; analysis from 60 min of stimulation, which is imaging t = 20–80 min; n.s. = not significant, **p<0.01, ****p<0.0001, *****p<0.00001).
Figure 3—figure supplement 4
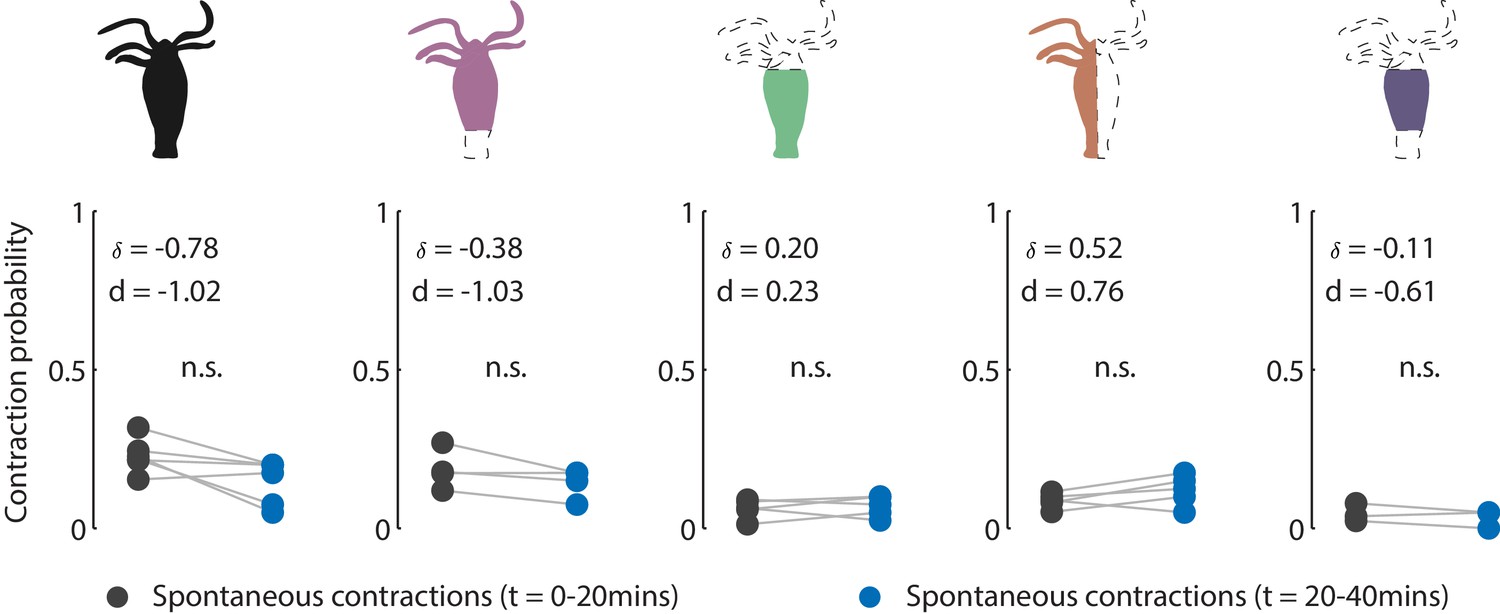
Contraction activity in non-stimulated animals.
Cartoon schematic of resection preparations of transgenic Hydra (GCaMP7b, endodermal epitheliomuscular cells): whole (or control), ‘footless,’ ‘headless,’ ‘bisected,’ and ‘body column’ animals. Entire frame region of interest (ROI) used for analysis of the whole-body epithelial calcium activity. Gray circles are mean contraction probability during t = 0–20 min. Blue circles are mean contraction probability during t = 20–40 min (this time corresponds to when stimulated animals receive mechanical stimuli). Mean probability calculated from 1 s window shifted by ~0.3 s over 30 s intervals. Response probability, fraction of trials that have at least one calcium spike (also contraction pulse) occurring within 1 s of stimulation onset. Pressure in valves = 0 psi. Light gray lines pair the spontaneous contractions probability from the first 20 min interval with the second 20 min interval from each individual animal. Whole N = 4, footless N = 3, headless N = 3, bisected N = 5, body column N = 3 Hydra, paired t-test, n.s. = not significant.
Figure 3—figure supplement 5
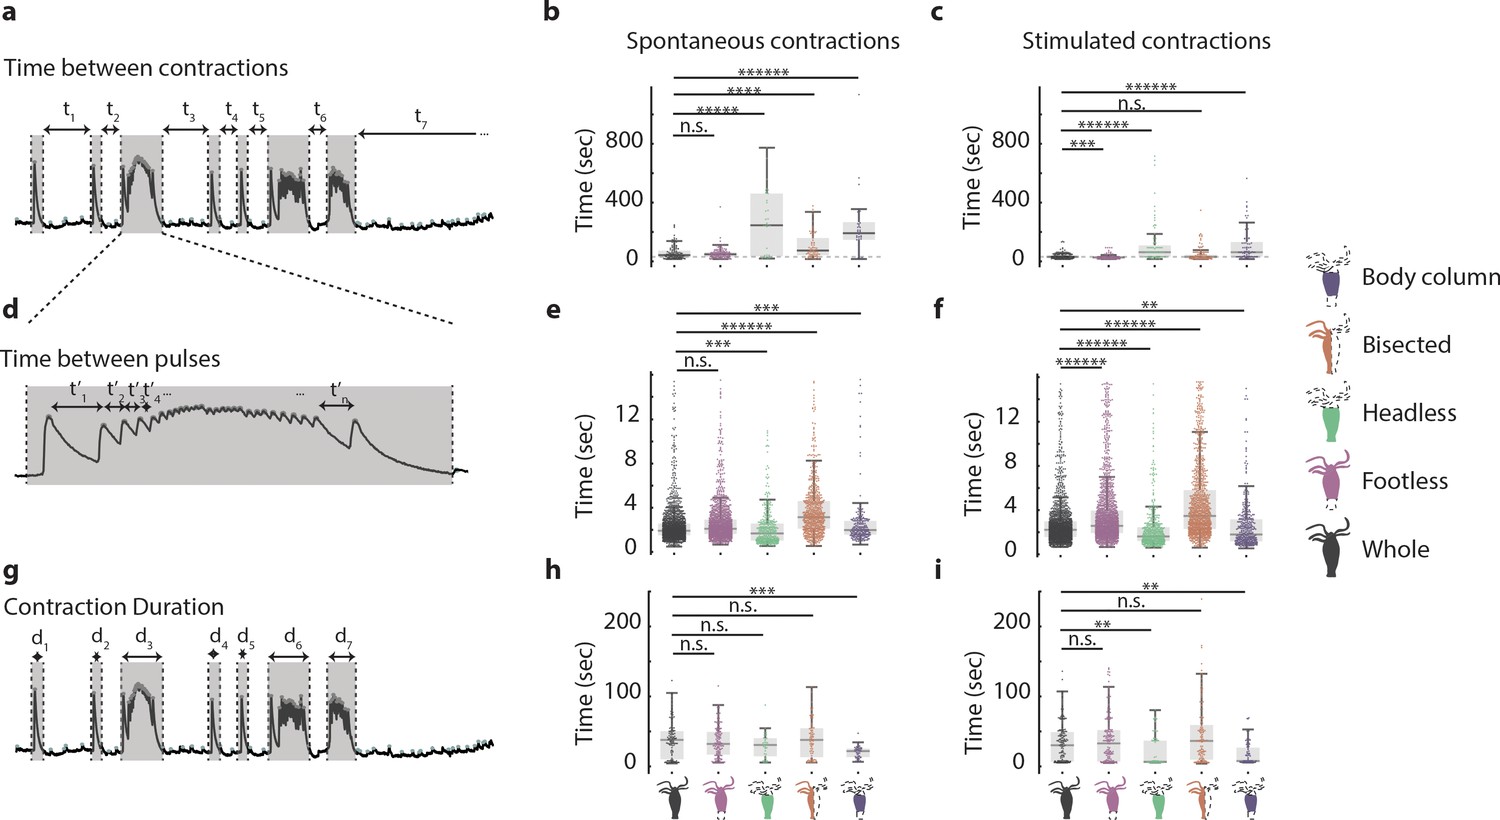
Hypostome and peduncle nerve rings work together to coordinate contractile behavior.
(a) Representative fluorescence trace used to calculate time interval between contractions. (b) Time interval between spontaneous contractions in animals with different resections: whole, ‘footless,’ ‘headless,’ ‘bisected,’ and ‘body column.’ (c) Time interval between stimulated contractions in animals with different resections. (d) Representative fluorescence trace used to calculate time interval between contraction pulses. For illustration purpose, only a select few of the time intervals are shown. (e) Time interval between spontaneous contraction pulses in animals with different resections. (f) Time interval between stimulated contraction pulses in animals with different resections. (g) Representative fluorescence trace used to calculate contraction duration. (h) Duration of spontaneous contractions in animals with different resections. (i) Duration of stimulated contractions in animals with different resections. N = 3 Hydra (GcaMP7b, ectodermal epitheliomuscles) per resection Kruskal–Wallis test with Dunn–Sidak correction, n.s. = not significant, **p<0.01, ***p<0.001, ****p<0.0001, *****p<0.00001, ******p<0.000001.
Figure 4 with 3 supplements
Distinct networks of neurons involved in spontaneous and stimulated behaviors.
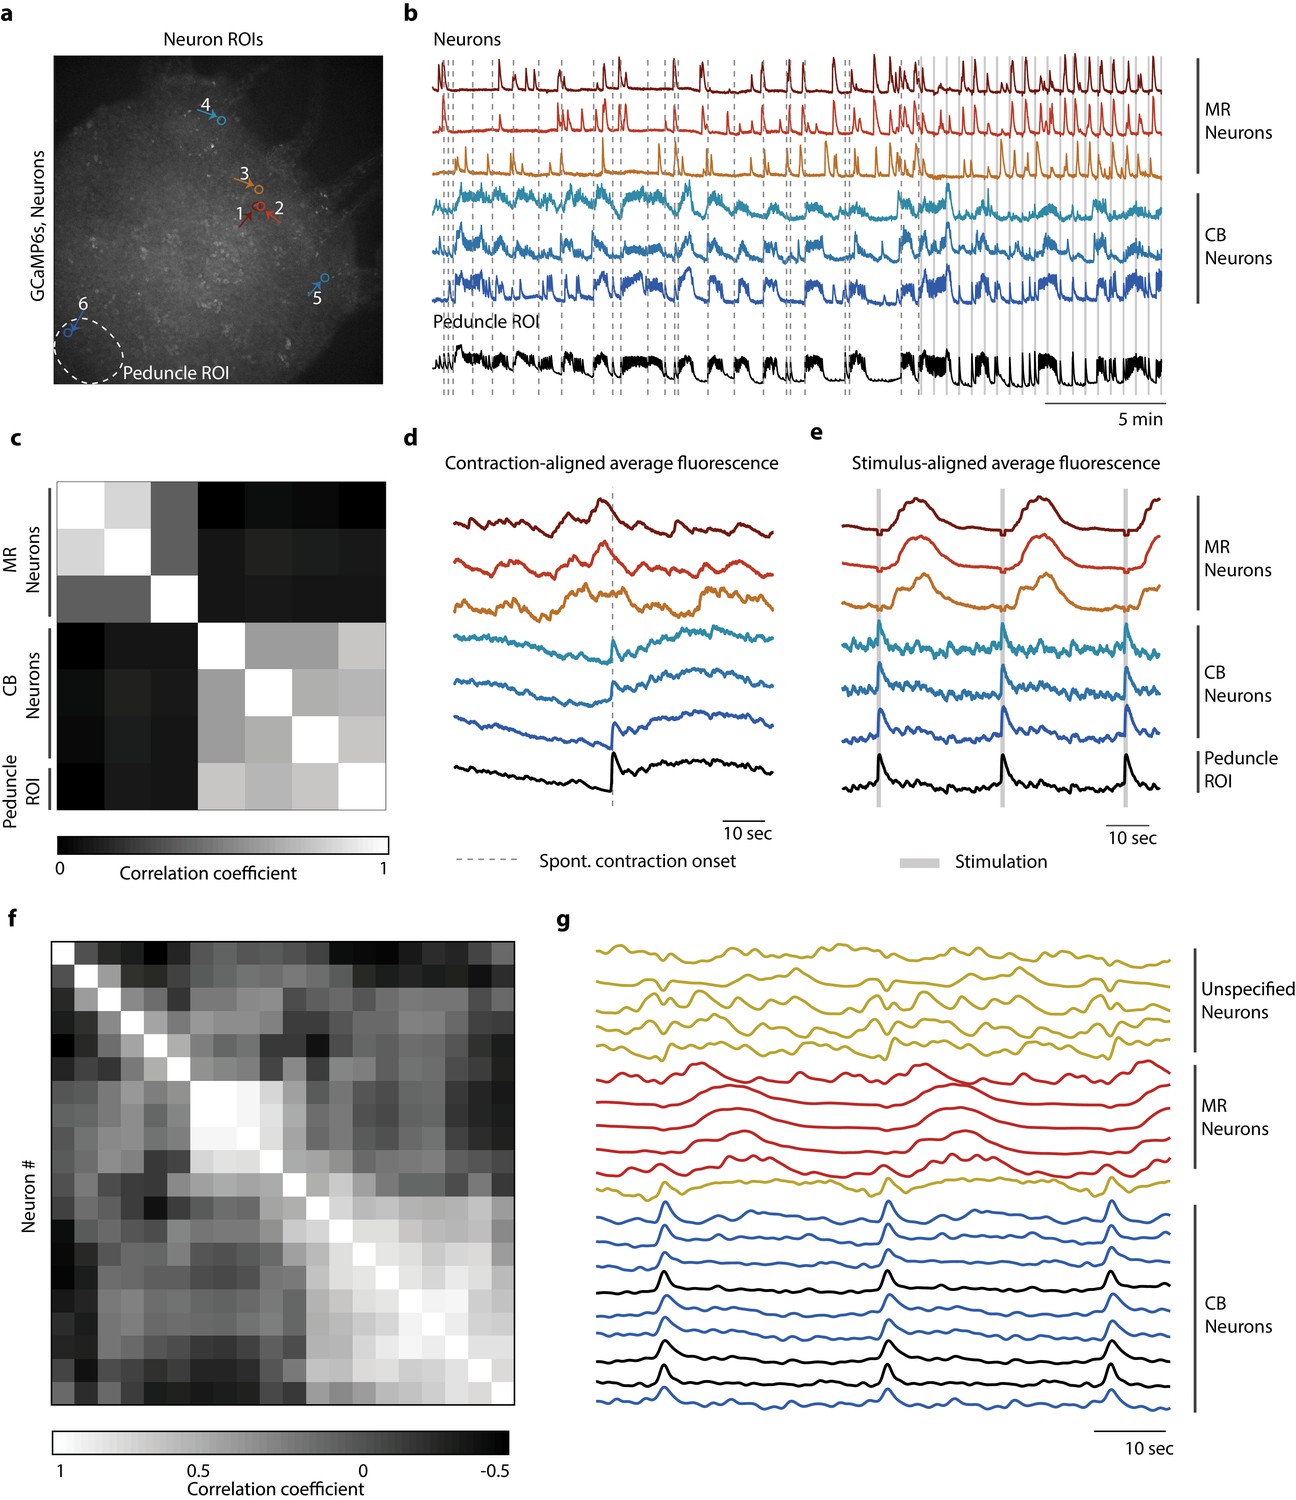
(a) Fluorescent image of transgenic Hydra expressing GCaMP6s pan-neuronally. Individually tracked neurons regions of interest (ROIs) are indicated by arrows, and peduncle ROI is outlined with a white dashed circle. (b) Calcium fluorescence traces from single neurons (top six traces) and average calcium fluorescence from peduncle ROI (bottom trace). Mechanically responsive (MR) neurons are shown in shades of red. Contraction burst (CB) neurons are shown in shades of blue. (c) Heat map shows the correlation coefficients of individually tracked neurons and peduncle ROI from Hydra 1, with color bar at the bottom. Correlation was computed using the entire 30 min calcium fluorescence from single neurons shown in (b). (d) Average calcium fluorescence traces from each of the neurons and peduncle ROI during spontaneous behaviors time-aligned with the onset of spontaneous body contractions. Dashed line indicates the onset of body contraction. (e) Average calcium fluorescence traces from each of the neurons and peduncle ROI during stimulated behaviors time-aligned with the onset of mechanical stimulation. Gray-shaded rectangle indicates mechanical stimulation. (f) Heat map shows the correlation coefficients of (g) the average calcium fluorescence traces from each of the neurons and peduncle ROI (traces in black) from three different Hydra during stimulated behaviors time-aligned with the onset of mechanical stimulation. Three groups of neurons were identified across the three Hydra. CB neurons (traces in blue), MR neurons (traces in red), and unspecified neurons (traces in yellow). (a–e) Calcium fluorescence traces and correlation analysis (entire 30 min of activity, 20 min of spontaneous activity, and 10 min of stimulated activity) from one representative Hydra. (f, g) Correlation analysis of the average stimulus-aligned calcium fluorescence (30 s stimulation interval average from 10 min of stimulated activity) of each neuron pooled multiple Hydra (N = 3 Hydra) to highlight the three groups of neurons identified: CB, MR, and unspecified. Source data for fluorescent calcium activity from single neurons are available in Figure 4—source data 1.
-
Figure 4—source data 1
source file for fluorescent calcium activity from single-neuron regions of interest (ROIs).
The file (Fig4_SourceData.zip) contains three folders ‘Hydra1,’ ‘Hydra2,’ and ‘Hydra3’ for the three different animals with individually tracked single neurons. Each folder contains a file called ‘IndividualNeuronTraces.mat’ with three different matrices: ‘NeuronROI_RawFluorAllFrames’ matrix (# of rows = # of neurons + 1, # of columns = # of frames) contain the raw fluorescence intensities individual neuronal ROIs. Each row is different neuron, and the last row in the matrix is the average fluorescence from peduncle ROI’; ‘ROI_xLocAllFrames’ matrix (# of rows = # of neurons, # of columns = # of frames) contains the x position of the center of circular ROIs for individual neurons; ‘ROI_yLocAllFrames’ matrix (# of rows = # of neurons, # of columns = # of frames) contains the y position of the center of circular ROIs for individual neurons.
- https://cdn.elifesciences.org/articles/64108/elife-64108-fig4-data1-v2.zip
Figure 4—figure supplement 1
Single-cell correlation analysis.
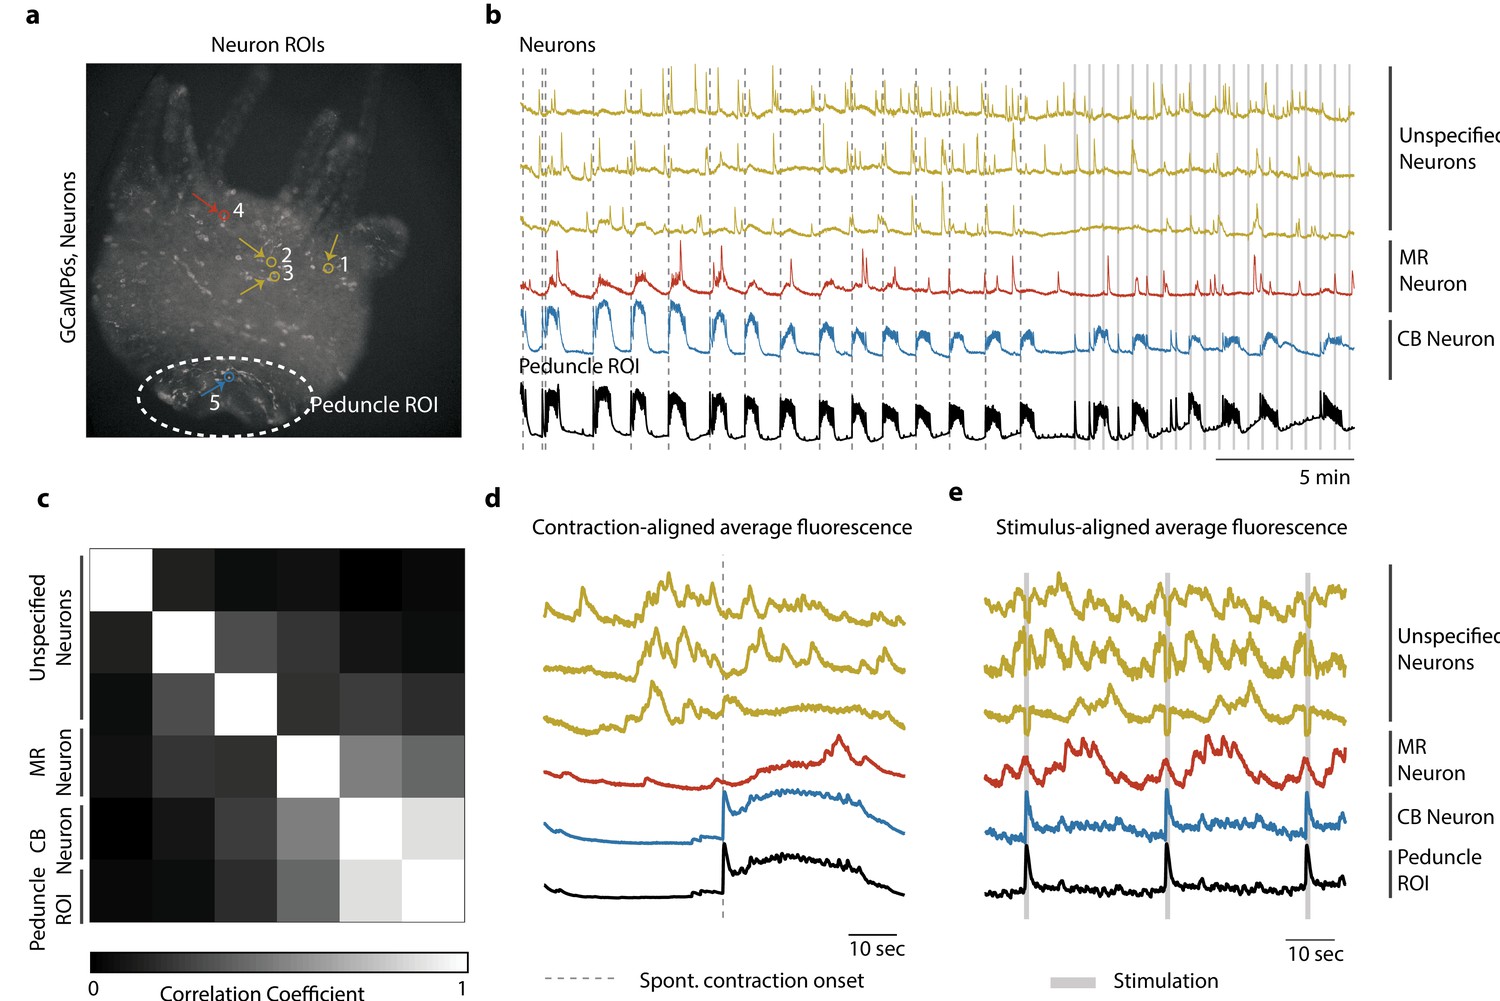
(a) Fluorescence image of transgenic Hydra (#2) expressing GCaMP6s pan-neuronally. Individually tracked neuronal regions of interest (ROIs) are indicated with circles. The neurons are numbered in the order their traces appear in (c–e) with the same colors. Peduncle ROI outlined with white dashed line. (b) Calcium fluorescence traces from single neurons (top six traces) and average calcium fluorescence from peduncle ROI (bottom trace). Mechanically responsive (MR) neurons are shown in shades of red. Contraction burst (CB) neurons are shown in shades of blue. Unspecified neurons are shown in yellow, and their activity do not resemble any of the previously identified neuronal networks (contraction burst, rhythmic potential, or the mechanically responsive reported here). (c) Heat map shows the correlation coefficients of individually tracked neurons and peduncle ROI. Color bar is at the bottom. (d) Average calcium fluorescence traces from each of the neurons and peduncle ROI during spontaneous behaviors time-aligned with the onset of spontaneous body contractions. Dashed line indicates the onset of body contraction. (e) Average calcium fluorescence traces from each of the neurons and peduncle ROI during stimulated behaviors time-aligned with the onset of mechanical stimulation. Gray-shaded rectangle indicates mechanical stimulation.
Figure 4—figure supplement 2
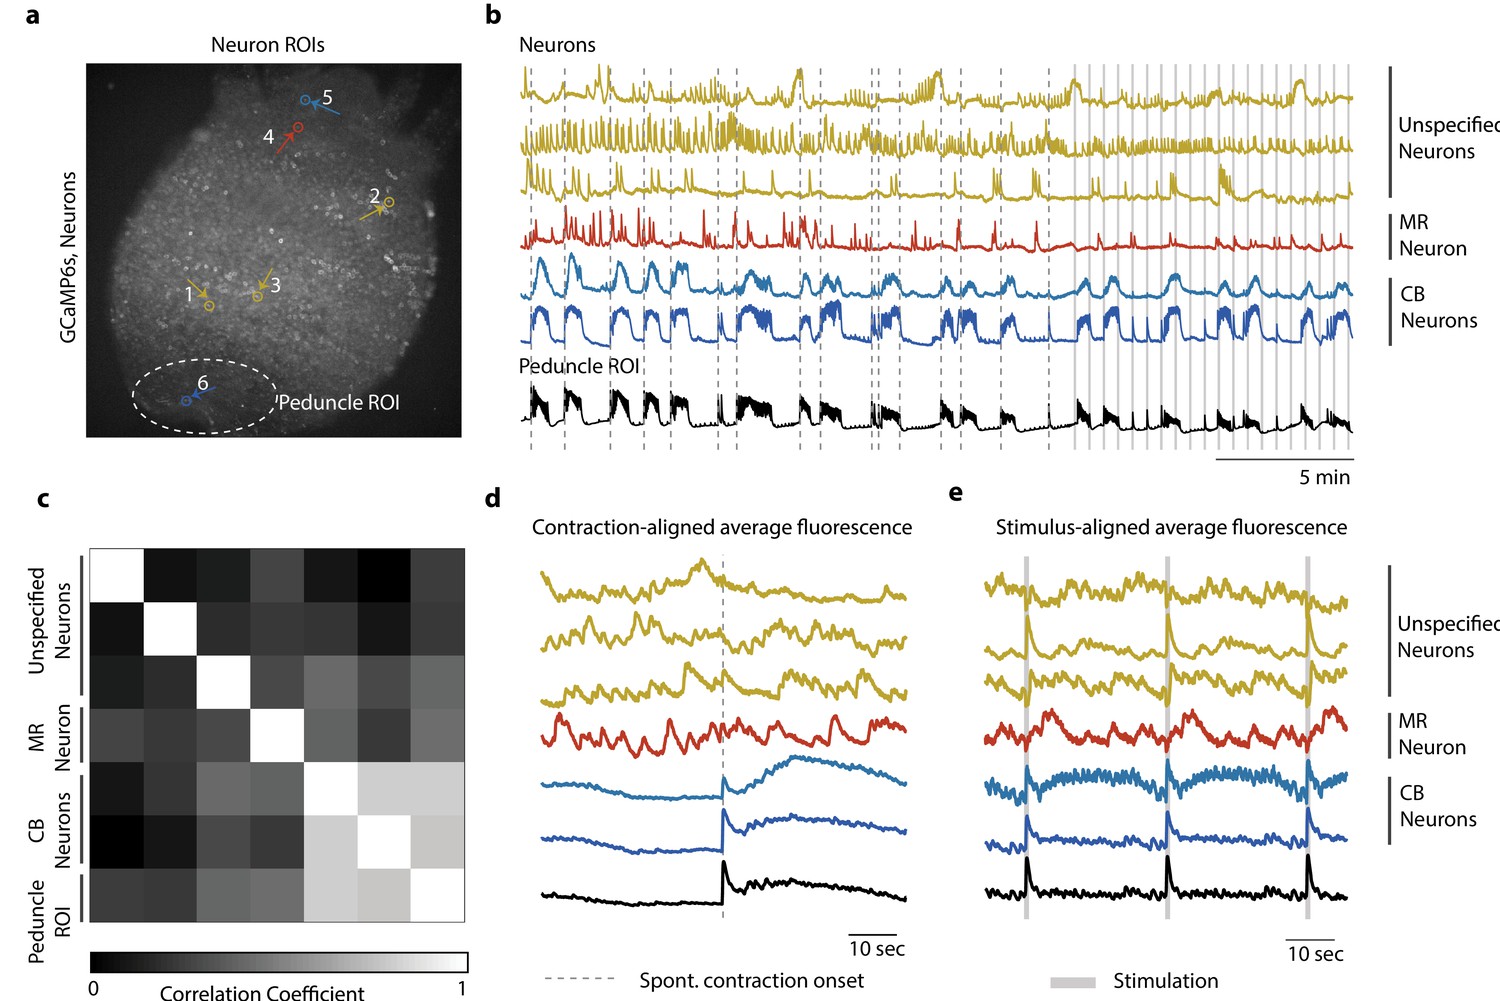
Single-cell correlation analysis.
(a) Fluorescence image of transgenic Hydra (#3) expressing GCaMP6s pan-neuronally. Individually tracked neuronal regions of interest (ROIs) are indicated with circles. The neurons are numbered in the order their traces appear in (c–e) with the same colors. Peduncle ROI outlined with white dashed line. (b) Calcium fluorescence traces from single neurons (top five traces) and average calcium fluorescence from peduncle ROI (bottom trace). Mechanically responsive (MR) neurons are shown in shades of red. Contraction burst (CB) neurons are shown in shades of blue. Unspecified neurons are shown in yellow, and their activity do not resemble any of the previously identified neuronal networks (contraction burst, rhythmic potential, or the mechanically responsive reported here). (c) Heat map shows the correlation coefficients of individually tracked neurons and peduncle ROI. Color bar is at the bottom. (d) Average calcium fluorescence traces from each of the neurons and peduncle ROI during spontaneous behaviors time-aligned with the onset of spontaneous body contractions. Dashed line indicates the onset of body contraction. (e) Average calcium fluorescence traces from each of the neurons and peduncle ROI during stimulated behaviors time-aligned with the onset of mechanical stimulation. Gray-shaded rectangle indicates mechanical stimulation.
Figure 4—figure supplement 3
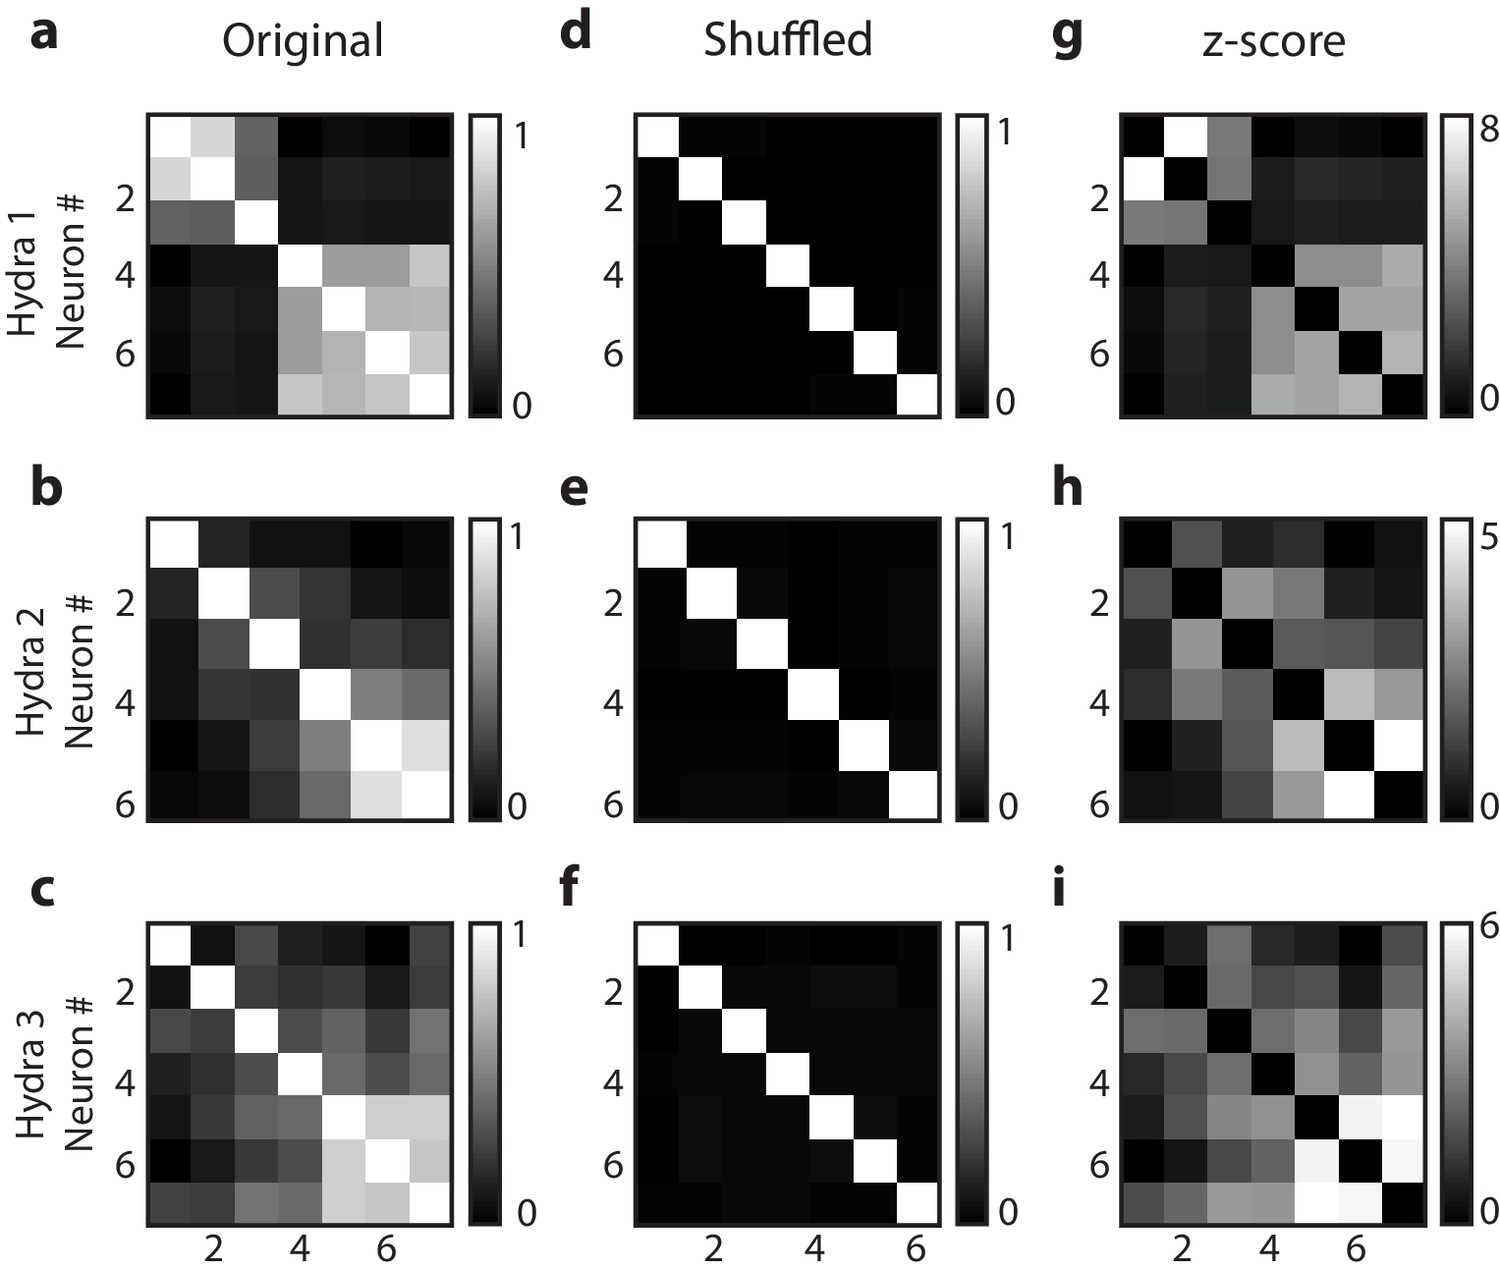
Random shuffling of single-cell correlation analysis.
Individual neuronal fluorescence time series were randomly shuffled to show the correlation coefficients were not due to random chance in all three Hydra (each row is a different Hydra). Original correlation coefficients from 10 min of raw fluorescence time series (a–c), shuffled correlation coefficients from randomly reshuffled blocks reconstructing 10 min of fluorescence time series (d, e) and z-score of correlation coefficients calculated based on random reshuffling (g–i). Original correlation coefficients were calculated from 10 min of raw fluorescence activity for each of the neurons during mechanical stimulation. Shuffled correlation coefficients were calculated by taking the mean of correlation coefficients from randomly reshuffled fluorescence time series. Briefly, the raw fluorescence time series from 10 min of mechanical stimulation was divided into 100 blocks, which were then randomly recombined for each of the neurons to calculated correlation coefficients and this random reshuffling was repeated 1000 times. Z-score was calculated using the mean and standard deviation of the correlation coefficients calculated from random reshuffling repeated 1000 times. The heat map for z-score (g–i) resembles the original correlation coefficients (a–c), indicating the correlation coefficients of the raw fluorescence time series were not a result of random chance. Except for the diagonals that represents autocorrelation, the mean correlation coefficients resulting from randomly reshuffled fluorescence (e, f) are zero for all neuron pairs, indicating the correlation due to random chance. Description of videos.
Videos
Video 1
Microfluidic system to study mechanosensory response in Hydra.
Dashed blue circle indicates the microfluidic valve that presses down on Hydra. Mechanosensory response from neurons and epitheliomuscular cells is shown.
Video 2
Spontaneous neural calcium activity in normal animals.
Dashed blue circle indicates the region of interest (ROI) used for calcium trace shown in blue (bottom) (playback 100×).
Video 3
Stimulated neural calcium activity in normal animals.
Dashed blue square indicates the region of interest (ROI) used for calcium trace shown in blue (bottom). Dashed white circle indicates the location of the valve that presses down on Hydra when inflated. Gray trace shows the stimulus protocol, where vertical lines indicate valve ‘on’ times. Stimulus applied beginning t = ~20 min and ends t = ~80 min. Valve is ‘on’ for 1 s and ‘off’ for 30 s (playback 100×).
Video 4
Spontaneous endodermal epitheliomuscular calcium activity in normal animals.
Dashed blue square indicates the region of interest (ROI) (entire frame) used for the calcium trace shown in blue (bottom) (playback 100×).
Video 5
Stimulated endodermal epitheliomuscular calcium activity in normal animals.
Dashed blue square indicates the region of interest (ROI) (entire frame) used for calcium trace shown in blue (bottom). Dashed white circle indicates the location of the valve that presses down on Hydra when inflated. Gray trace shows the stimulus protocol, where vertical lines indicate valve ‘on’ times. Stimulus applied beginning t = ~20 min and ends t = ~80 min. Valve is ‘on’ for 1 s and ‘off’ for 30 s (playback 100×).
Video 6
Spontaneous neural calcium activity in longitudinally bisected animals.
Dashed blue circle indicates the region of interest (ROI) used for calcium trace shown in blue (bottom) (playback 100×).
Video 7
Stimulated neural calcium activity in longitudinally bisected animals.
Dashed blue circle indicates the region of interest (ROI) used for calcium trace shown in blue (bottom). Dashed white circle indicates the location of the valve that presses down on Hydra when inflated. Gray trace shows the stimulus protocol, where vertical lines indicate valve ‘on’ times. Stimulus applied beginning t = ~20 min and ends t = ~80 min. Valve is ‘on’ for 1 s and ‘off’ for 30 s (playback 100×).
Video 8
Spontaneous neural calcium activity in headless animals.
Dashed blue circle indicates the region of interest (ROI) used for calcium trace shown in blue (bottom). Animal is less active without the head and fewer spikes in calcium activity of peduncle neurons are observed (playback 100×).
Video 9
Stimulated neural calcium activity in headless animals.
Dashed blue circle indicates the region of interest (ROI) used for calcium trace shown in blue (bottom). Dashed white circle indicates the location of the valve that presses down on Hydra when inflated. Gray trace shows the stimulus protocol, where vertical lines indicate valve ‘on’ times. Stimulus applied beginning t = ~20 min and ends t = ~80 min. Valve is ‘on’ for 1 s and ‘off’ for 30 s. Animal is less active without the head and fewer spikes in calcium activity of peduncle neurons are observed without stimulation. After stimulation begins, more single-pulse contractions occur (playback 100×).
Video 10
Spontaneous endodermal epitheliomuscular calcium activity in footless animals.
Dashed blue square indicates the region of interest (ROI) (entire frame) used for the calcium trace shown in blue (bottom) (playback 100×).
Video 11
Stimulated endodermal epitheliomuscular calcium activity in footless animals.
Dashed blue square indicates the region of interest (ROI) (entire frame) used for calcium trace shown in blue (bottom). Dashed white circle indicates the location of the valve that presses down on Hydra when inflated. Gray trace shows the stimulus protocol, where vertical lines indicate valve ‘on’ times. Stimulus applied beginning t = ~20 min and ends t = ~80 min. Valve is ‘on’ for 1 s and ‘off’ for 30 s (playback 100×).
Video 12
Spontaneous endodermal epitheliomuscular calcium activity in headless animals.
Dashed blue square indicates the region of interest (ROI) (entire frame) used for the calcium trace shown in blue (bottom). Animal is less active without the head and fewer spikes in calcium activity of the whole body endodermal epitheliomuscular cells are observed (playback 100×).
Video 13
Stimulated endodermal epitheliomuscular calcium activity in headless animals.
Dashed blue square indicates the region of interest (ROI) (entire frame) used for calcium trace shown in blue (bottom). Dashed white circle indicates the location of the valve that presses down on Hydra when inflated. Gray trace shows the stimulus protocol, where vertical lines indicate valve ‘on’ times. Stimulus applied beginning t = ~20 min and ends t = ~80 min. Valve is ‘on’ for 1 s and ‘off’ for 30 s. Animal is less active without the head and fewer spikes in calcium activity of epitheliomuscular cells are observed without stimulation. After stimulation begins, more single-pulse contractions occur (playback 100×).
Video 14
Spontaneous endodermal epitheliomuscular calcium activity in bisected animals.
Dashed blue square indicates the region of interest (ROI) (entire frame) used for the calcium trace shown in blue (bottom). Animal is less active without the head and fewer spikes in calcium activity of the whole body endodermal epitheliomuscular cells are observed (playback 100×).
Video 15
Stimulated endodermal epitheliomuscular calcium activity in bisected animals.
Dashed blue square indicates the region of interest (ROI) (entire frame) used for calcium trace shown in blue (bottom). Dashed white circle indicates the location of the valve that presses down on Hydra when inflated. Gray trace shows the stimulus protocol, where vertical lines indicate valve ‘on’ times. Stimulus applied beginning t = ~20 min and ends t = ~80 min. Valve is ‘on’ for 1 s and ‘off’ for 30 s. Animal is less active without the head and fewer spikes in calcium activity of epitheliomuscular cells are observed without stimulation. After stimulation begins, more single-pulse contractions occur (playback 100×).
Video 16
Spontaneous endodermal epitheliomuscular calcium activity in body column animals.
Dashed blue square indicates the region of interest (ROI) (entire frame) used for the calcium trace shown in blue (bottom). Animal is less active without the head and fewer spikes in calcium activity of the whole body endodermal epitheliomuscular cells are observed (playback 100×).
Video 17
Stimulated endodermal epitheliomuscular calcium activity in body column animals.
Dashed blue square indicates the region of interest (ROI) (entire frame) used for calcium trace shown in blue (bottom). Dashed white circle indicates the location of the valve that presses down on Hydra when inflated. Gray trace shows the stimulus protocol, where vertical lines indicate valve ‘on’ times. Stimulus applied beginning t = ~20 min and ends t = ~80 min. Valve is ‘on’ for 1 s and ‘off’ for 30 s. Animal is less active without the head and fewer spikes in calcium activity of epitheliomuscular cells are observed without stimulation. After stimulation begins, more single-pulse contractions occur (playback 100×).
Video 18
Stimulated neural calcium activity in the hypostome and body column of normal animals.
Dashed blue circle indicates the region of interest (ROI) used for calcium trace shown in blue (bottom). Dashed white circle indicates the location of the valve that presses down on Hydra when inflated. Gray trace shows the stimulus protocol, where vertical lines indicate valve ‘on’ times. Stimulus applied beginning t = ~20 min, valve is ‘on’ for 1 s and ‘off’ for 30 s. Imaged with 10 × 0.45 NA objective (playback 100×).
Tables
Table 1
qPCR primers for neuronal subtypes.
| Subtype | transcriptID | F sequence | R sequence |
|---|---|---|---|
| en1 | t29955aep | GCC GCA GTA TCA TCA TAC AAA TC | CCA TAA ACC ACA CAT CGC ATA AA |
| en2 | t20666aep | CTT CTT GCT TCT ATC CTC GTT CT | TAC CTC AAG TAA ATT ATC GGT CTC G |
| en3 | t33579aep | CGT TGG TAT GAC TAT AAT CGT TGT TAT G | AGG ATA CAT CAC CCA CCA AAT C |
| ec1A | t22316aep | GCC TTT CTT TAT CTC GGG TAT CT | ACC TCC CAT GAG TAG CTG TA |
| ec1B | t20807aep | AAG ATC TAC GAC GTC ATA TCA ATC A | TCA TGC CCT TAT TAC CCT CTT G |
| ec2 | t7411aep | GCG CCT TGT AAC TAT GGT CTT A | TTC GTA GAA CAT TGT CAT CTT CCT |
| ec3A | t9620aep | CGG TGC TGC TCC TAA TTC AA | CTC CGG TGC ACT GAT TTA TAG G |
| ec3B | t7664aep | TGT TTC AAA TGC AGA CGA AGA TG | GCG TGT TTA TTT GCC TGG AC |
| ec3C | t19558aep | CGG TTA GAT ACA CTG CGG TTA G | TAC GTG CCG TTC TTC GTT T |
| ec4 | t33899aep | GGC TTT AAT CGT TGT AGC TCT TG | CTT GCT ATC TTC TGA CAA GTG ATT G |
| ec5 | t6329aep | CCA ACA ATG GTC GAA TGA AGA AA | ATC GCC AGG TTT GTA TCC TTT A |
| RP49 | t6797aep | GCC AAA CTG GAG AAA ACC TAA AG | TCA GGC ATA AGA TGA CGT GTC |
| Actin | t11116aep | CGC CCT CGT AGT TGA TAA TGG | AAT CCT TCT GTC CCA TAC CAA C |
Additional files
Download links
A two-part list of links to download the article, or parts of the article, in various formats.
Downloads (link to download the article as PDF)
Open citations (links to open the citations from this article in various online reference manager services)
Cite this article (links to download the citations from this article in formats compatible with various reference manager tools)
Multiple neuronal networks coordinate Hydra mechanosensory behavior
eLife 10:e64108.
https://doi.org/10.7554/eLife.64108


