Multi-step vs. single-step resistance evolution under different drugs, pharmacokinetics, and treatment regimens
- Institute of Integrative Biology, ETH Zurich, Switzerland
- Evolutionary Biology, Institute for Biology, Freie Universität Berlin, Germany
Figures
Figure 1 with 2 supplements
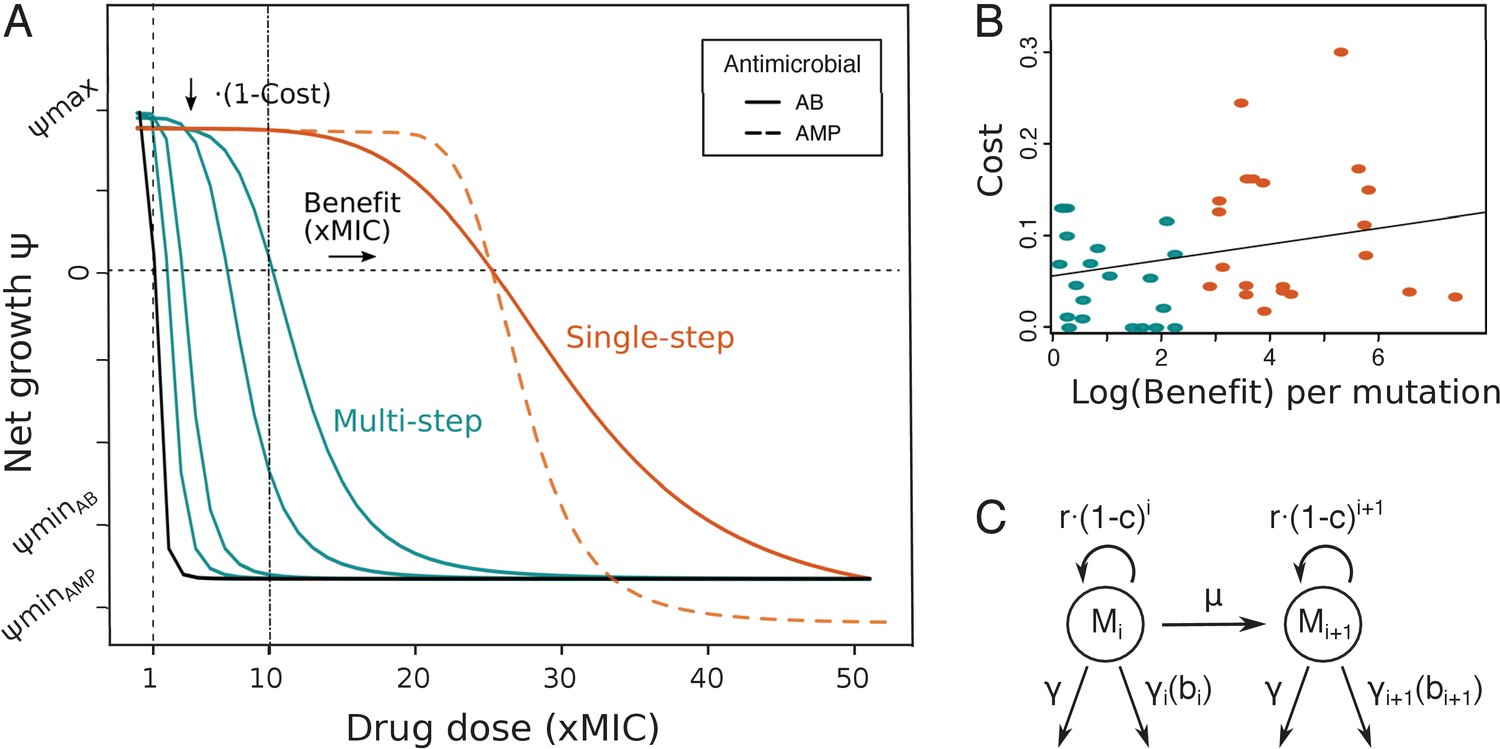
Pharmacodynamic (PD) model of single- and multi-step resistance.
(A) The PD curve relating bacterial net growth (which is between the maximal growth rate and the maximal killing rate ) to antimicrobial drug concentration (given in fold minimum inhibitory concentration (MIC)) illustrating a sensitive wildtype (black) and mutants with either small (blue) or large (orange) MIC increases per mutation (benefit), assuming a typical clinical drug dose of 10xMIC. Characteristic PD curves for antibiotic (AB) (solid lines) and antimicrobial peptide (AMP) (dashed lines) single-step resistance are compared (orange), demonstrating the typically steeper decrease () and lower observed with AMPs. (B) Shown are costs and benefits from various empirical studies (Table 1), each dot representing resistance mutations to a specific AB or AMP class. The cost of a mutation shows a very weak positive correlation with the log (benefit) (R2 = 0.07, p=0.09). Blue and orange colors show multi- or single-step resistance benefits given the drug dose in (A). (C) Schematic of the PD model with several mutated subpopulations (), which grow with a cost r(1-c)i, determined by the number of mutations i, mutate with rate µ, and die at a constant rate and a drug-specific rate , which is dependent on the benefit conferred per mutation.
-
Figure 1—source data 1
Empirical data used to obtain Figure 1B.
Calculated mean and standard deviation for mutational benefits and costs taken from Spohn et al., 2019 or Melnyk et al., 2015 for individual antimicrobial classes are given.
- https://cdn.elifesciences.org/articles/64116/elife-64116-fig1-data1-v2.xlsx
Figure 1—figure supplement 1
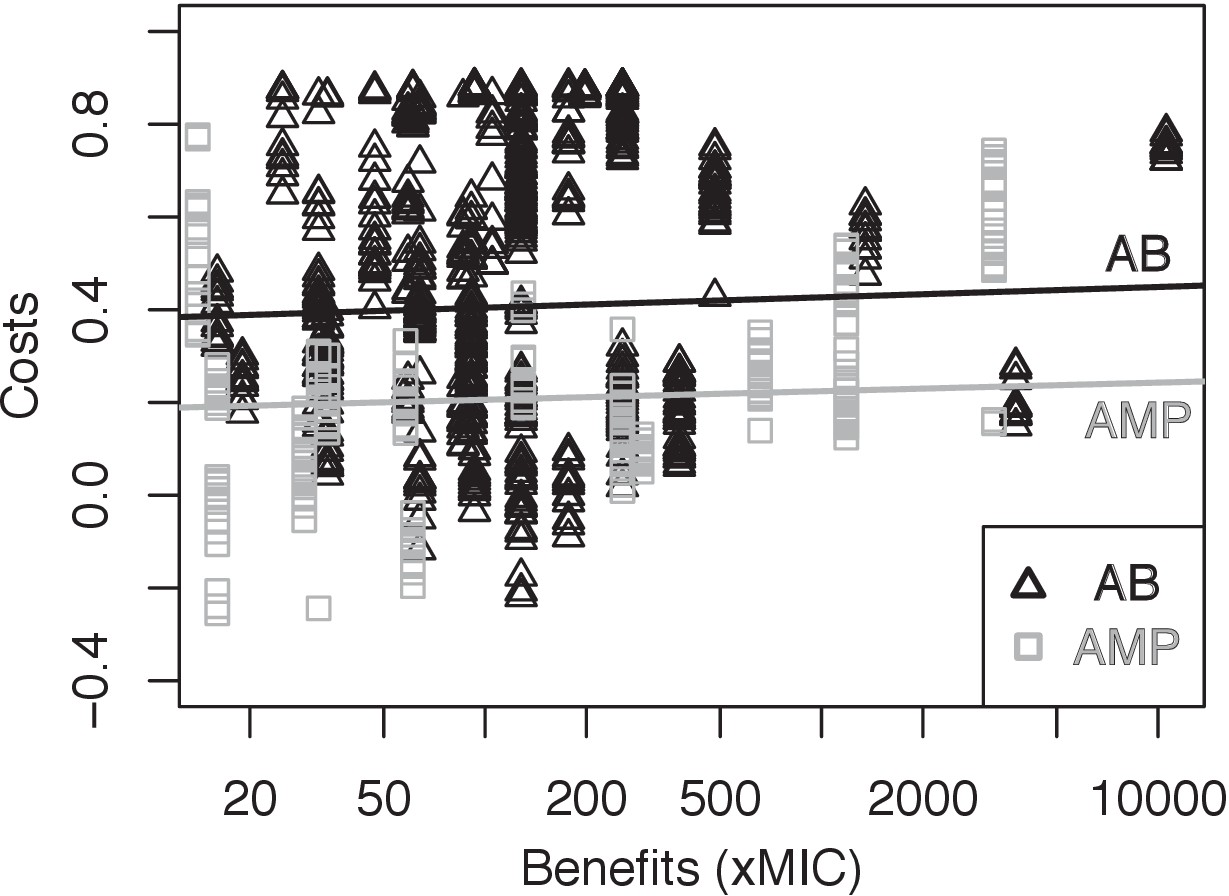
Direct comparison of mutational benefits and costs between antimicrobial peptides (AMPs) and antibiotics (ABs) from Spohn et al., 2019.
Cost (relative growth reduction) and benefit (minimum inhibitory concentration increase) of mutations at the end of the evolution experiments with AMPs (gray rectangles) or ABs (black triangles) from Spohn et al., 2019 are shown. We find only a weak negative correlation (obtained through linear regression) between the costs and (log) benefit. This could be due to the fact that in this study five mutations were present in one genome on average and compensatory mutations could confound the actual costs of resistance mutations.
Figure 1—figure supplement 2
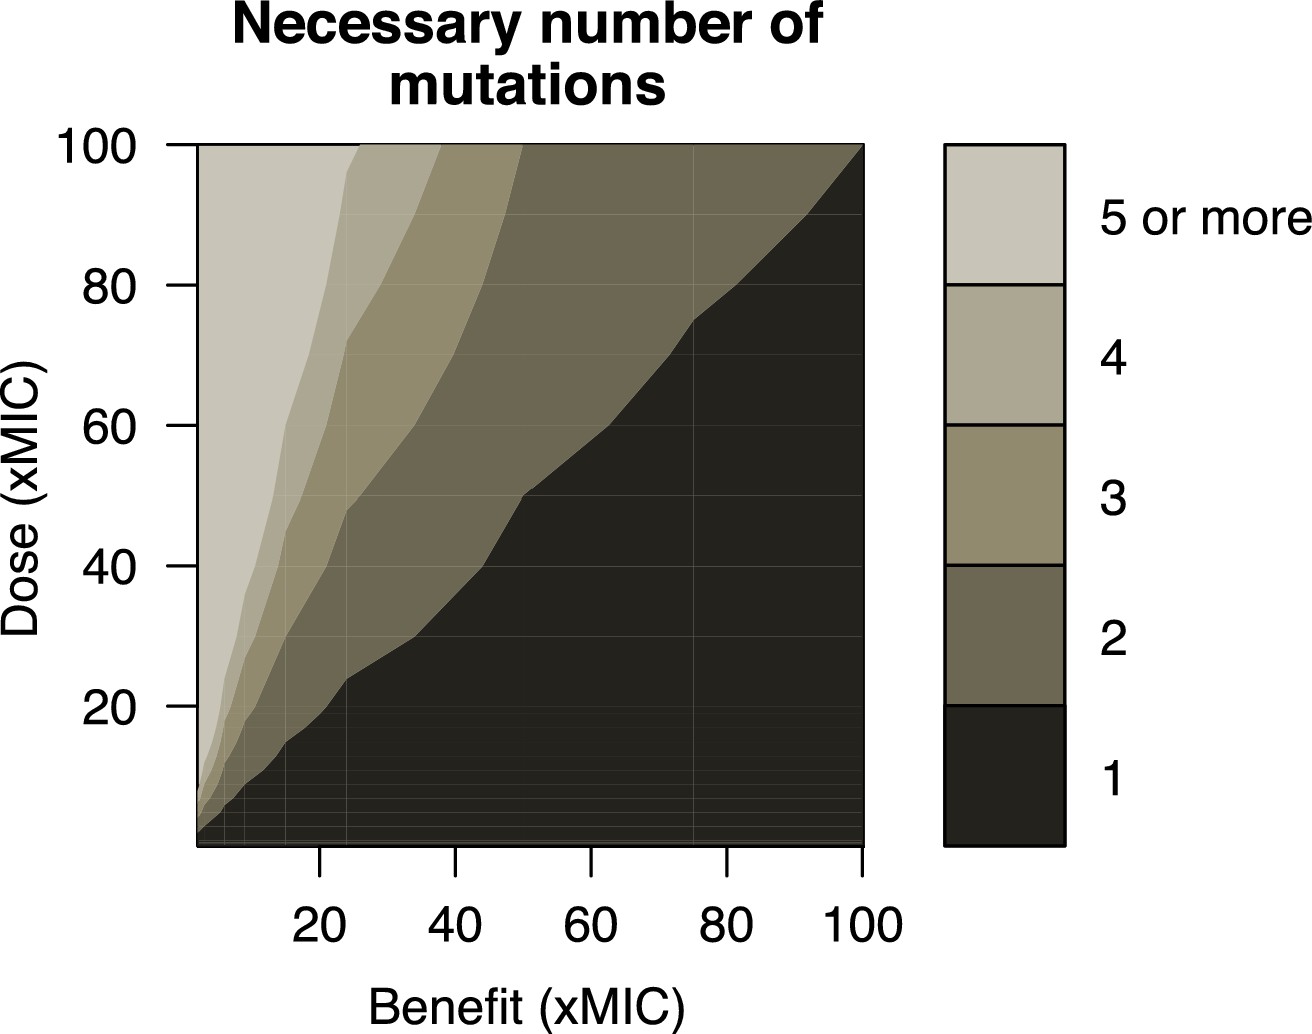
Number of mutations necessary for resistance.
The combination of a given drug dose (xMIC) and the benefit per mutation (xMIC) determines the number of mutations necessary for bacterial growth in our pharmacodynamic model: single-step evolution occurs when only one mutation is needed (dark gray area), whereas multi-step resistance requires two or more mutations (lighter gray areas). MIC: minimum inhibitory concentration.
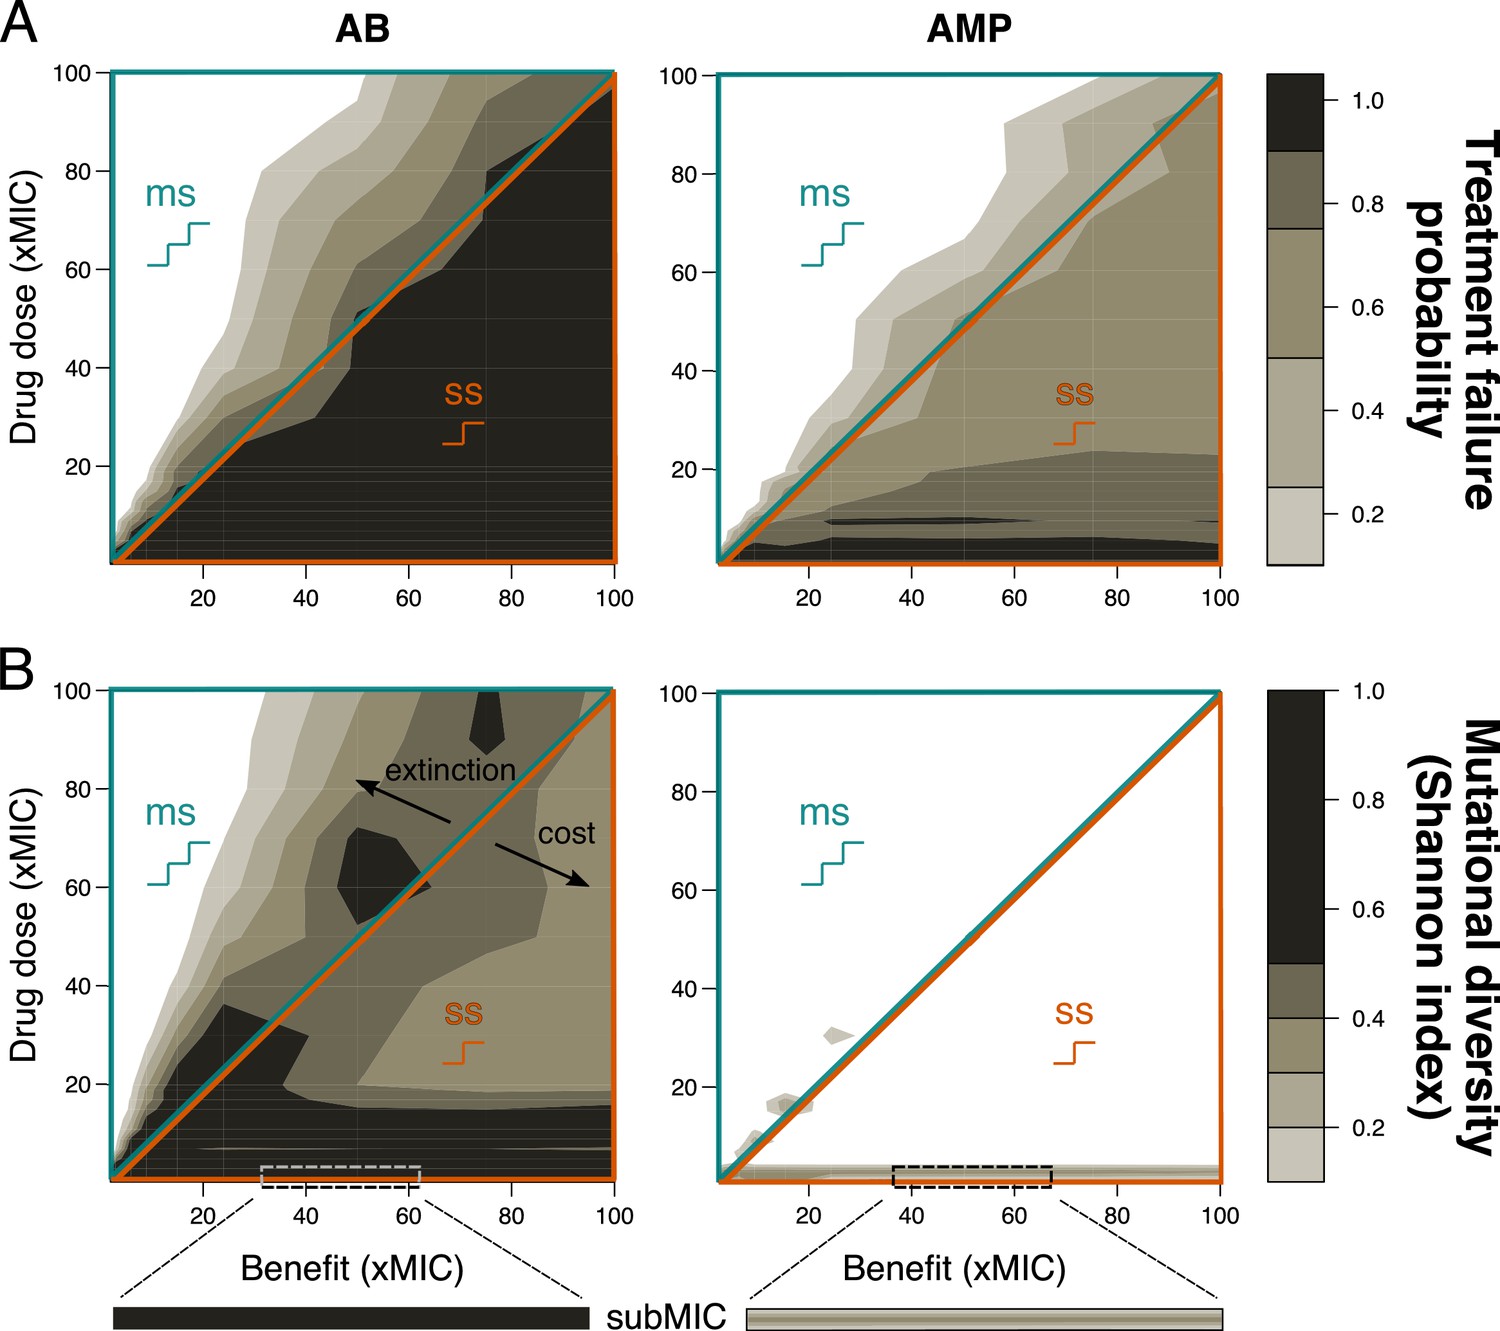
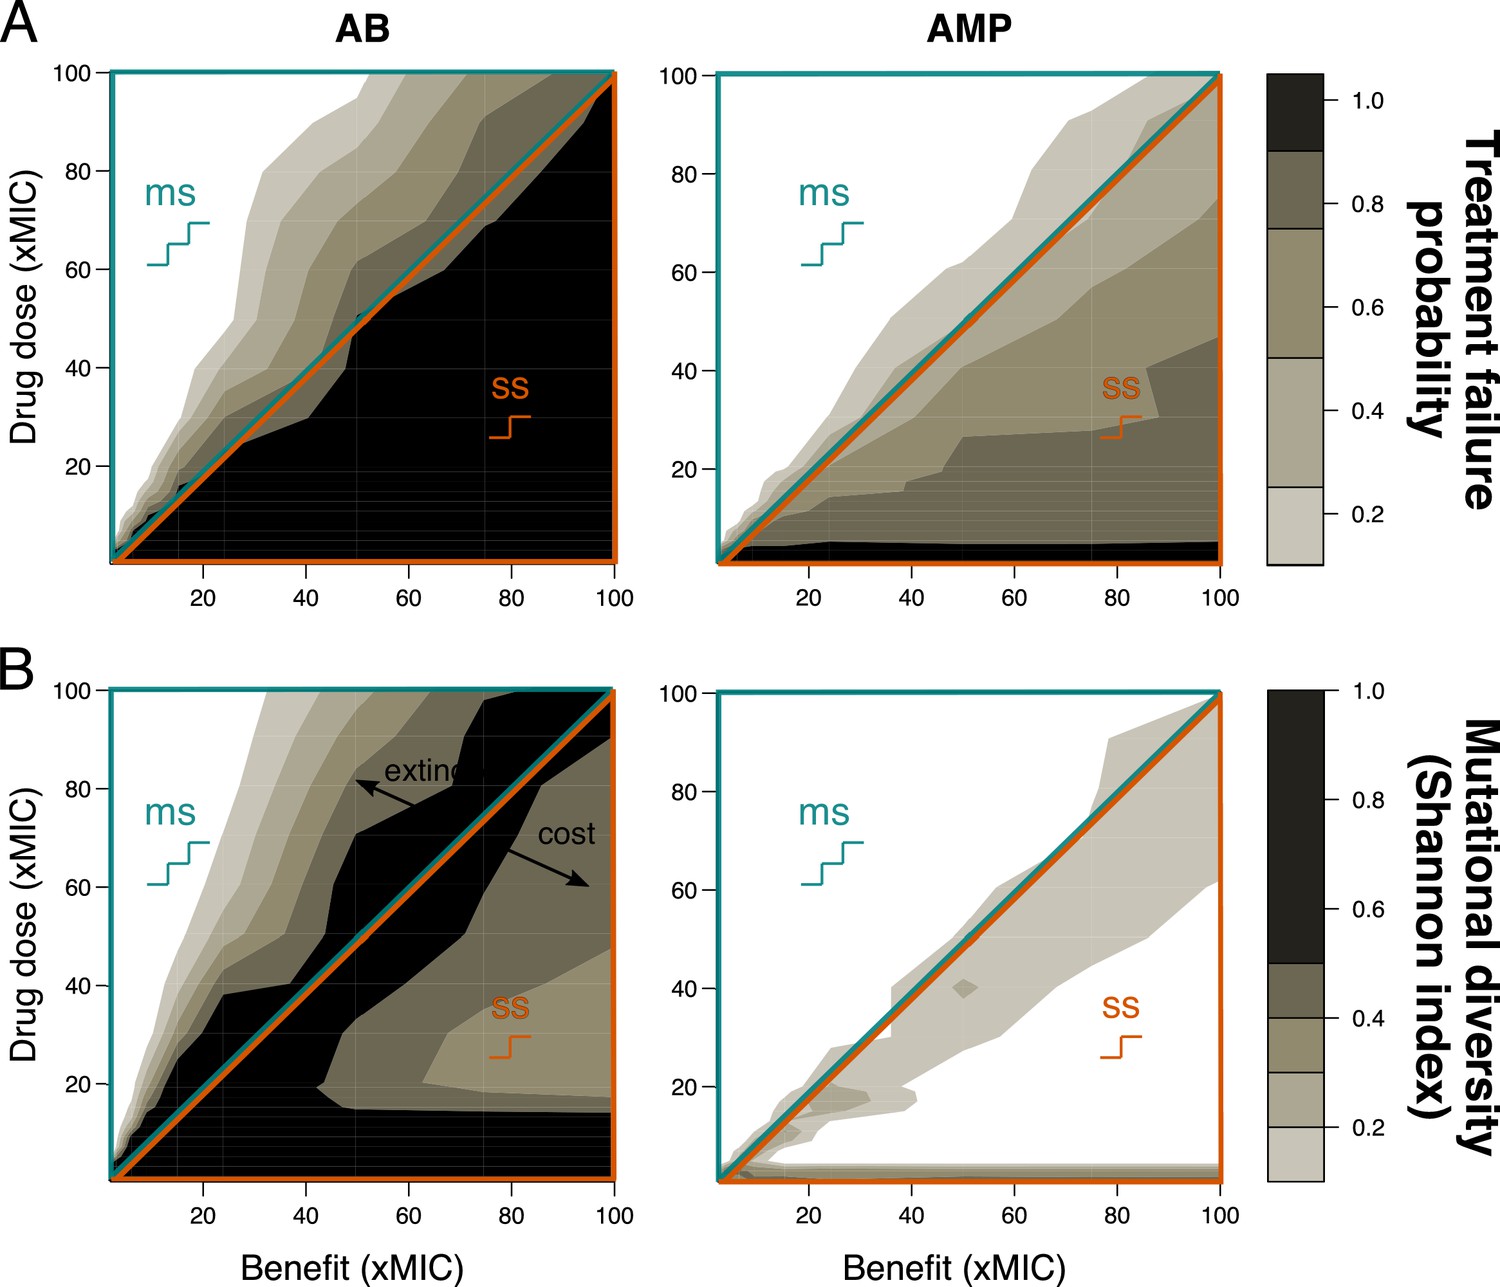
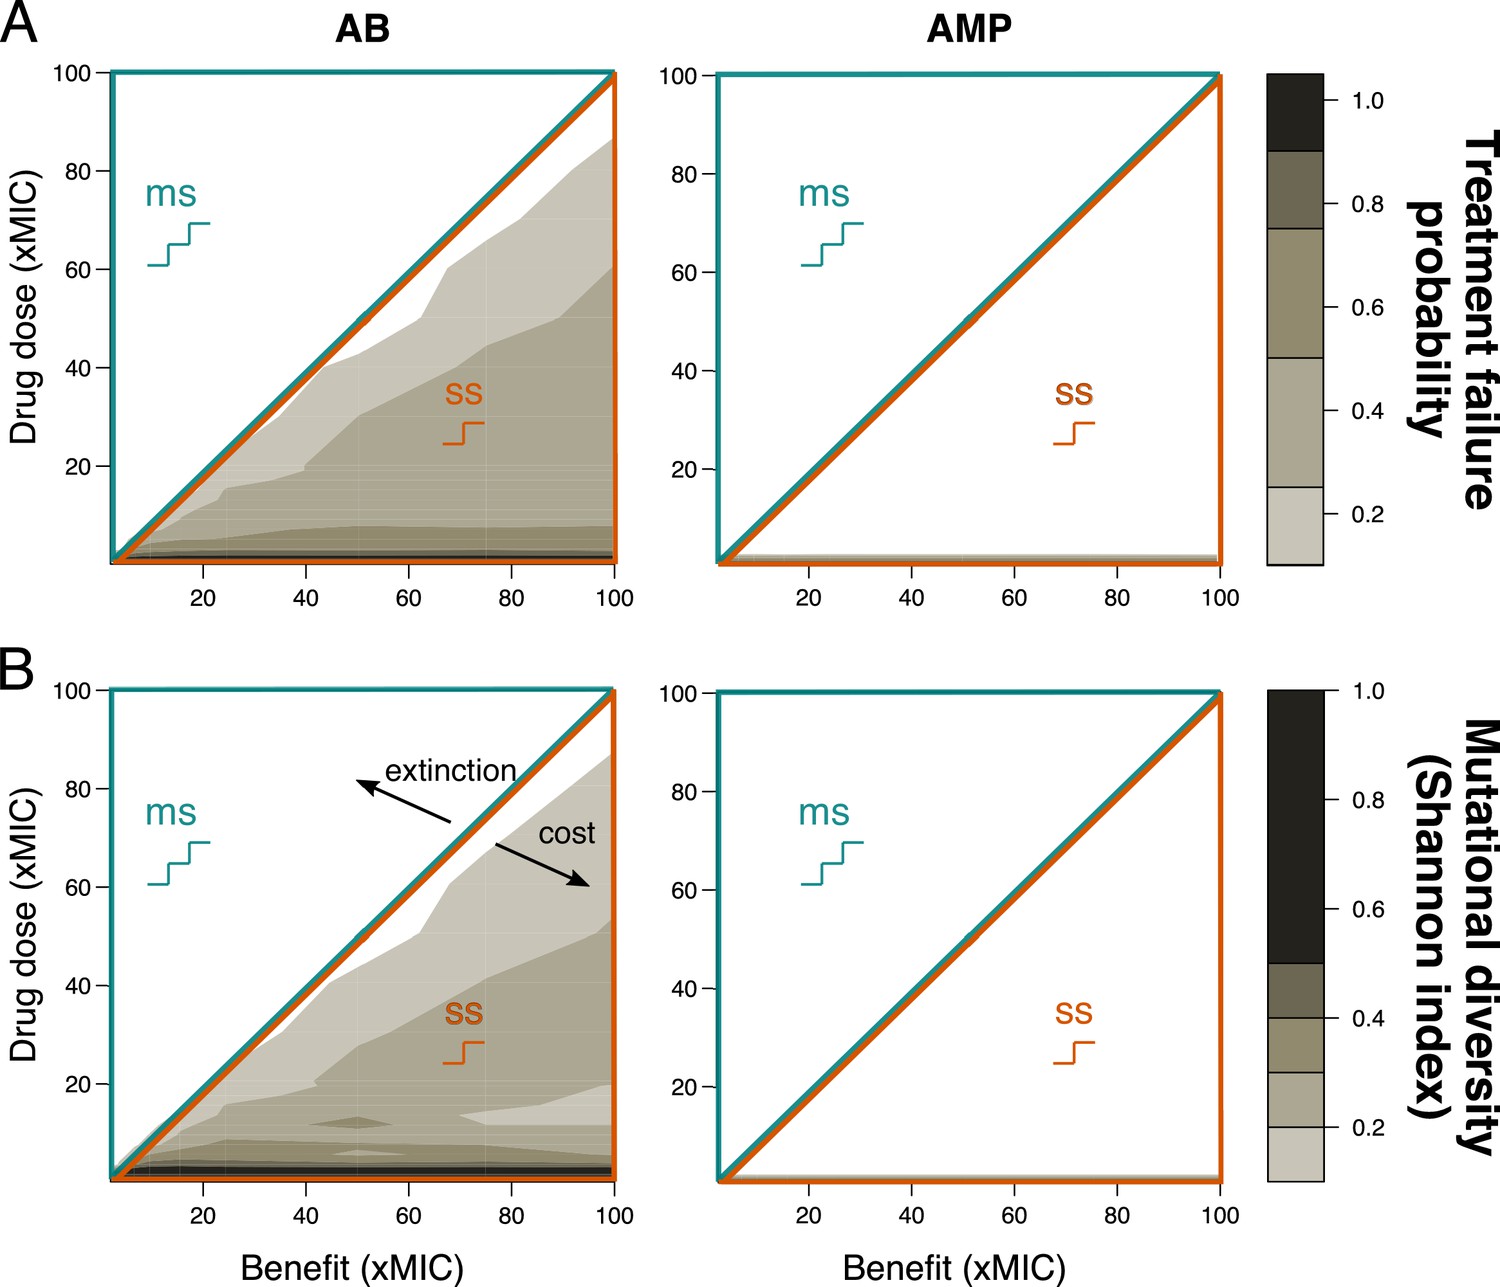
Figure 2 with 6 supplements
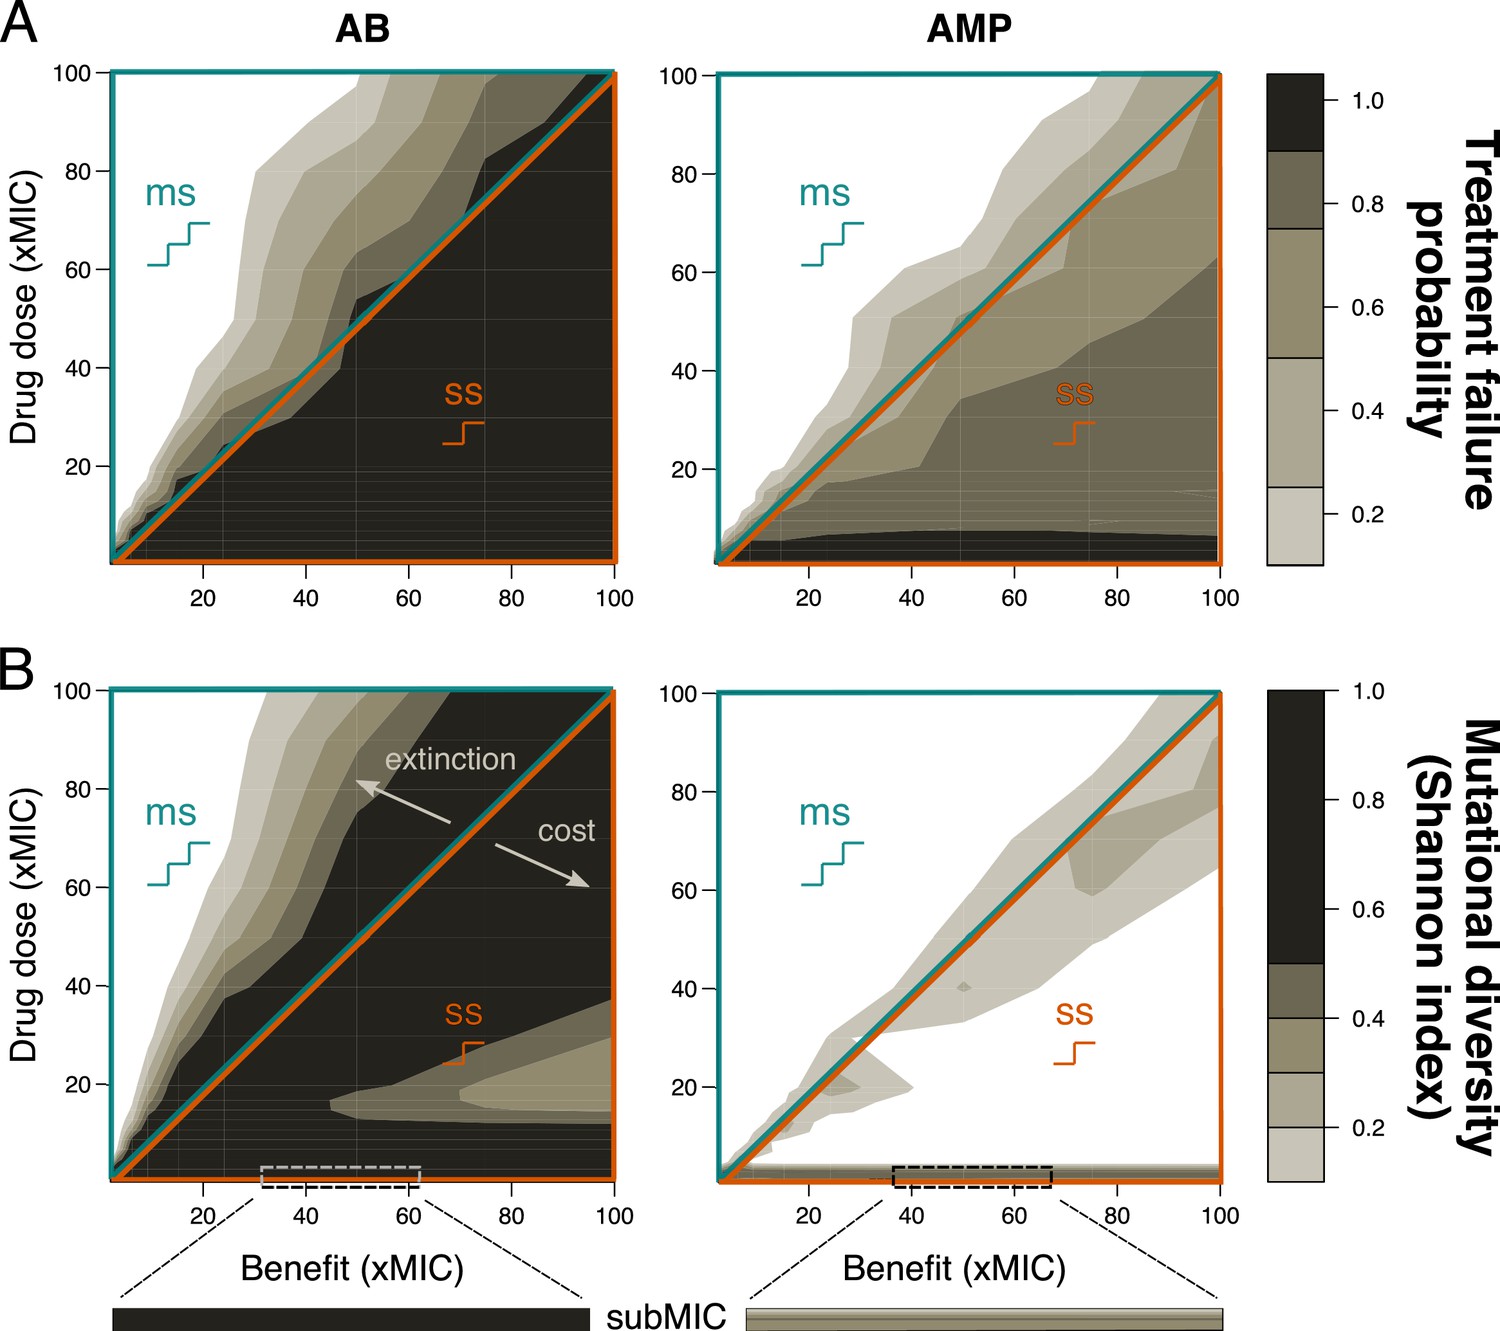
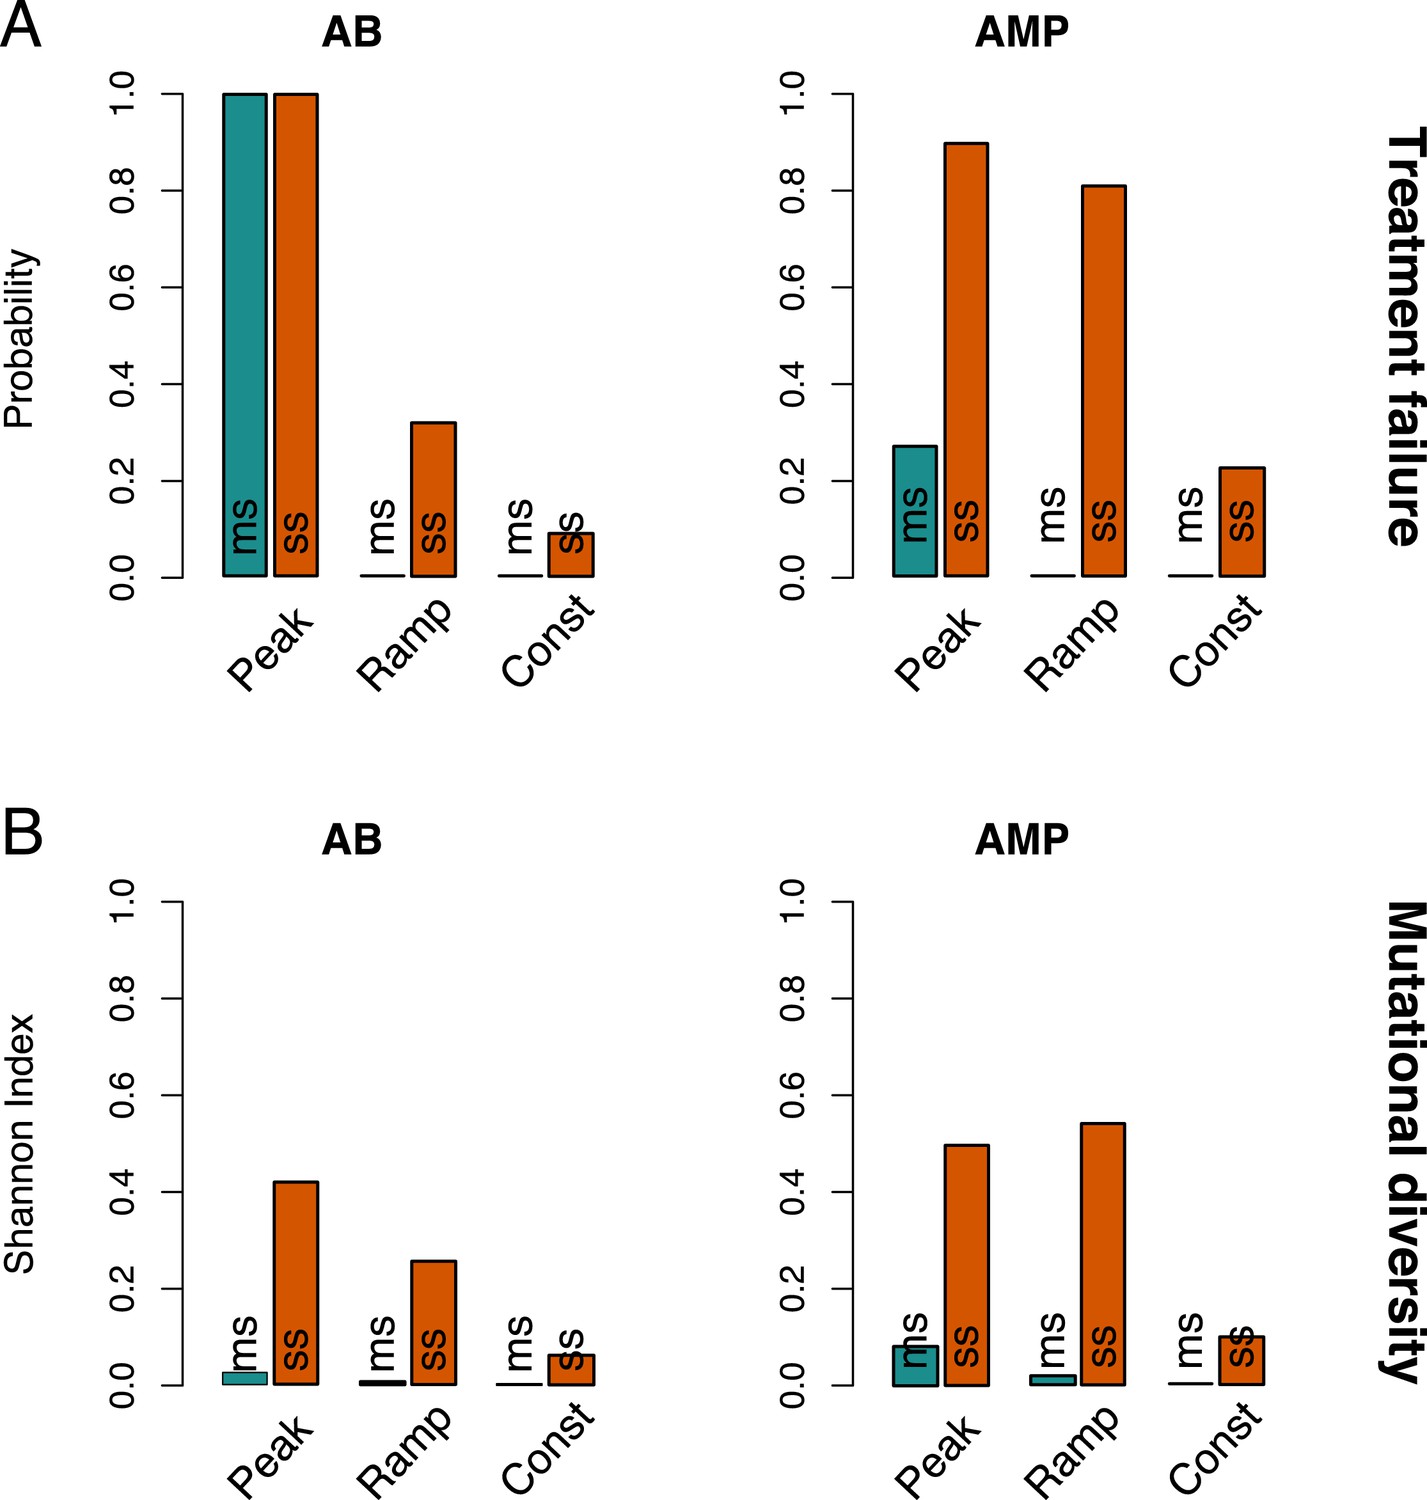
Resistance evolution with single- and multi-step patterns for peak pharmacokinetic (PK).
(A) Treatment failure probability (measured at the end of the treatment period) and (B) mutational diversity (calculated over the whole treatment period) are shown for two different antimicrobial classes (antibiotics (ABs), left; antimicrobial peptides (AMPs), right) for different combinations of mutational benefits (xMIC) and drug doses (xMIC). The diagonal line shows where the benefit per mutation is exactly equal to the given drug dose and separates single-step (ss, lower orange triangle), where one mutation gives a benefit higher than the applied dose, from multi-step (ms, upper blue triangle) resistance, where more than one mutation is needed for the accumulated benefit to match the drug dose. The arrows indicate the decrease in diversity either due to increasing extinction (too many mutations are needed for survival) or due to increasing cost per mutation (costs are too high compared to the additional benefit). A representative example of subMIC mutational diversity is shown magnified below the plots in (B). MIC: minimum inhibitory concentration.
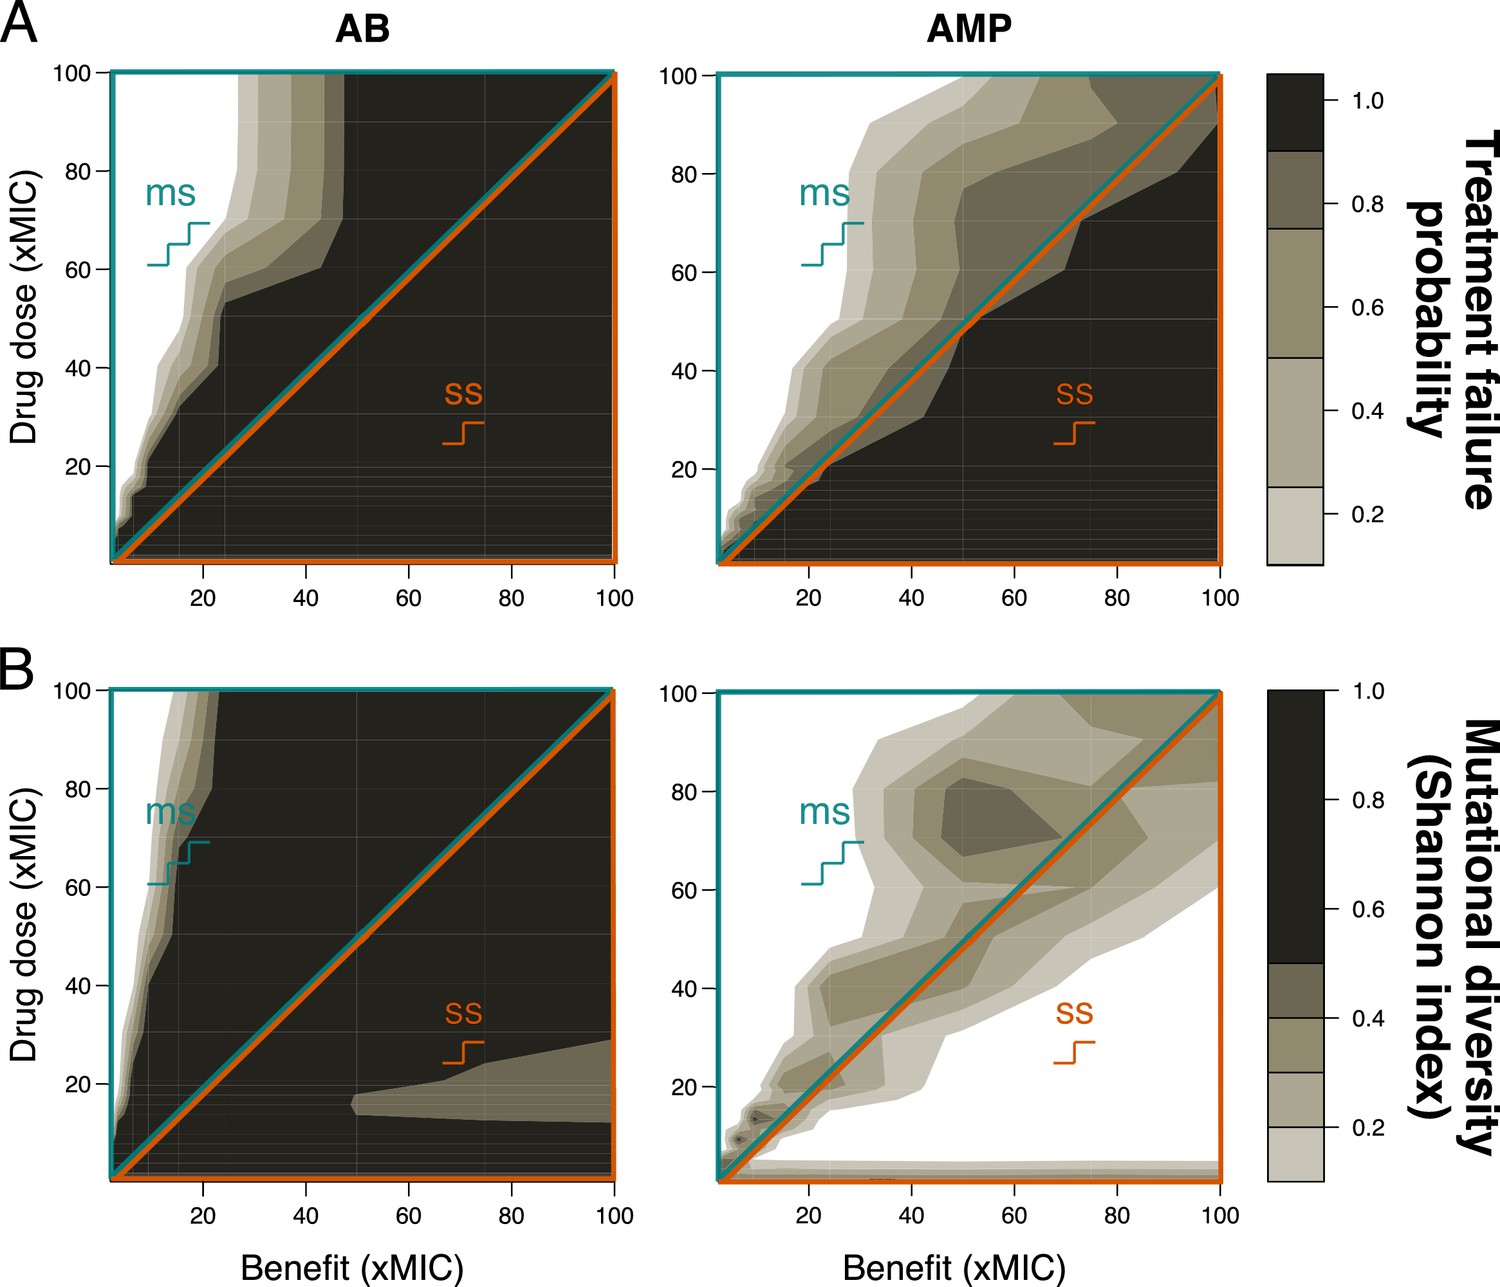
Figure 2—figure supplement 1
Resistance evolution with single- and multi-step patterns for peak pharmacokinetic (PK) with steeper correlation between cost and log(benefit).
(A) Treatment failure probability and (B) mutational diversity are shown for two different antimicrobial classes (antibiotics (ABs), left; antimicrobial peptides (AMPs), right) for different combinations of mutational benefits (xMIC) and drug doses (xMIC). The diagonal line separates single-step (ss, lower orange triangle) from multi-step (ms, upper blue triangle) resistance. A representative example of subMIC mutational diversity is shown magnified below the plots in (B). MIC: minimum inhibitory concentration.
Figure 2—figure supplement 2
Resistance evolution with increased mutation rates (proportional to the number of mutations required for resistance).
(A) Treatment failure probability and (B) mutational diversity are shown for antibiotic (AB) treatments with peak pharmacokinetic (PK) for different combinations of mutational benefits (xMIC) and drug doses (xMIC). The diagonal line separates single-step (ss, lower orange triangle) from multi-step (ms, upper blue triangle) resistance. Mutation rates were increased for lower-benefit mutations, which resulted in increased mutational diversity, but not higher treatment failure. MIC: minimum inhibitory concentration.
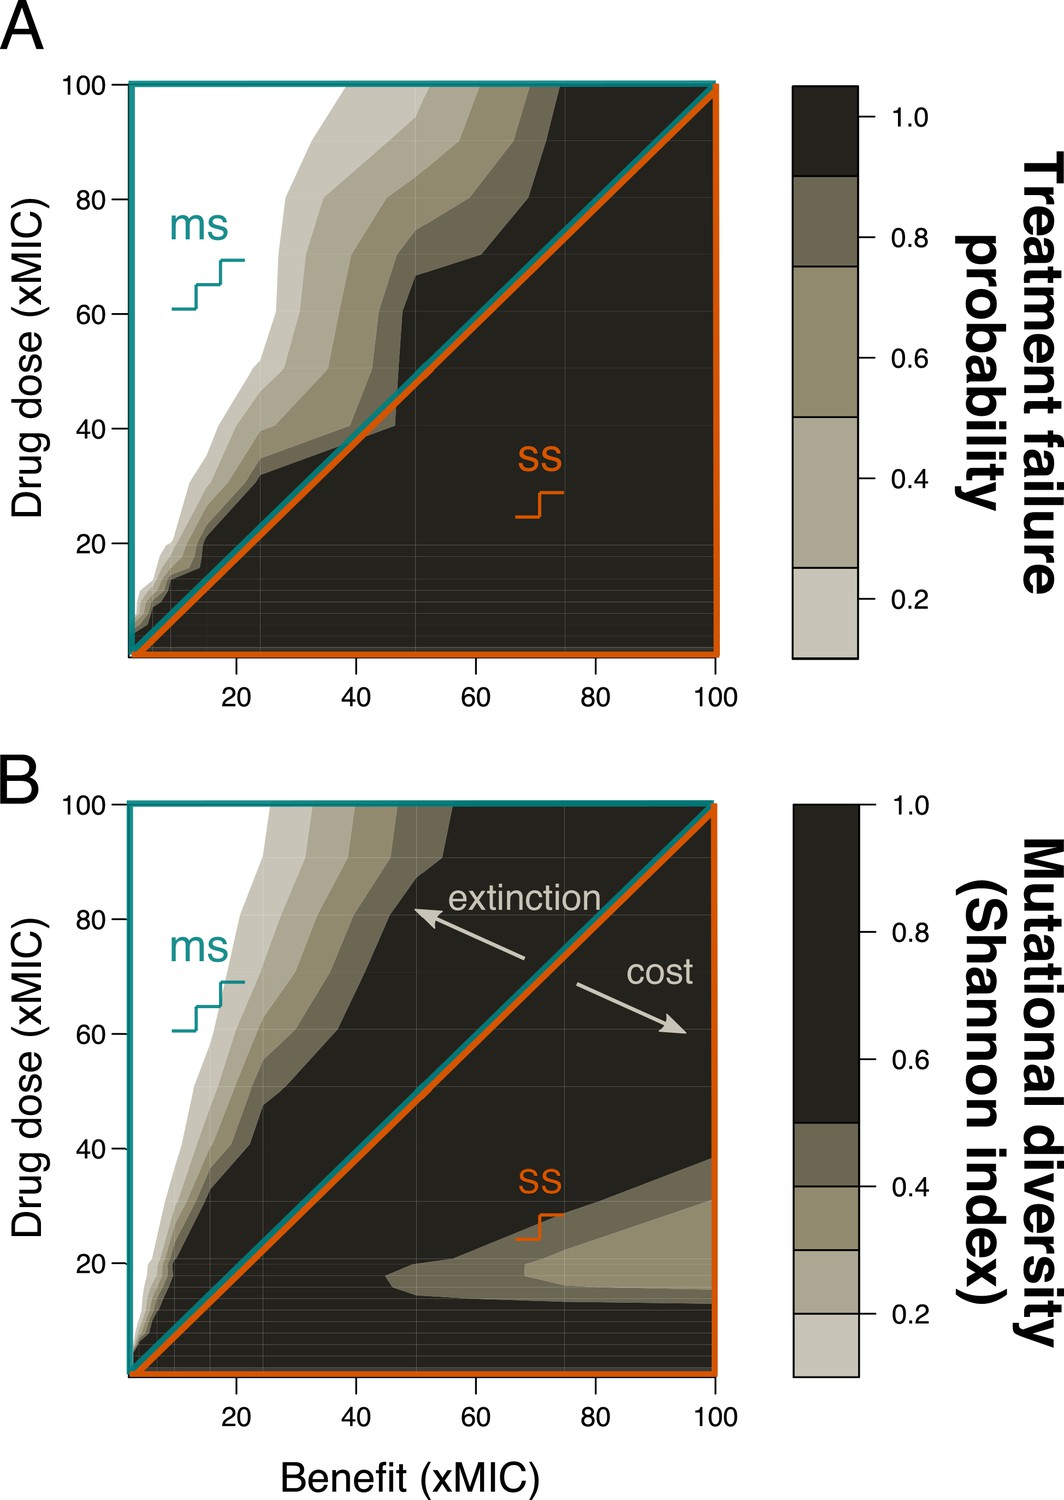
Figure 2—figure supplement 3
Relative population frequencies with horizontal gene transfer (HGT).
Shown are representative examples of population frequencies at the end of drug treatments (antibiotic (AB) or antimicrobial peptide (AMP)) at subMIC or above minimum inhibitory concentration (MIC) levels. Black indicates the wildtype (completely sensitive), blue the population fraction with one mutation, and orange (brown) the population fraction with a plasmid and 0 (1) mutation.
Figure 2—figure supplement 4
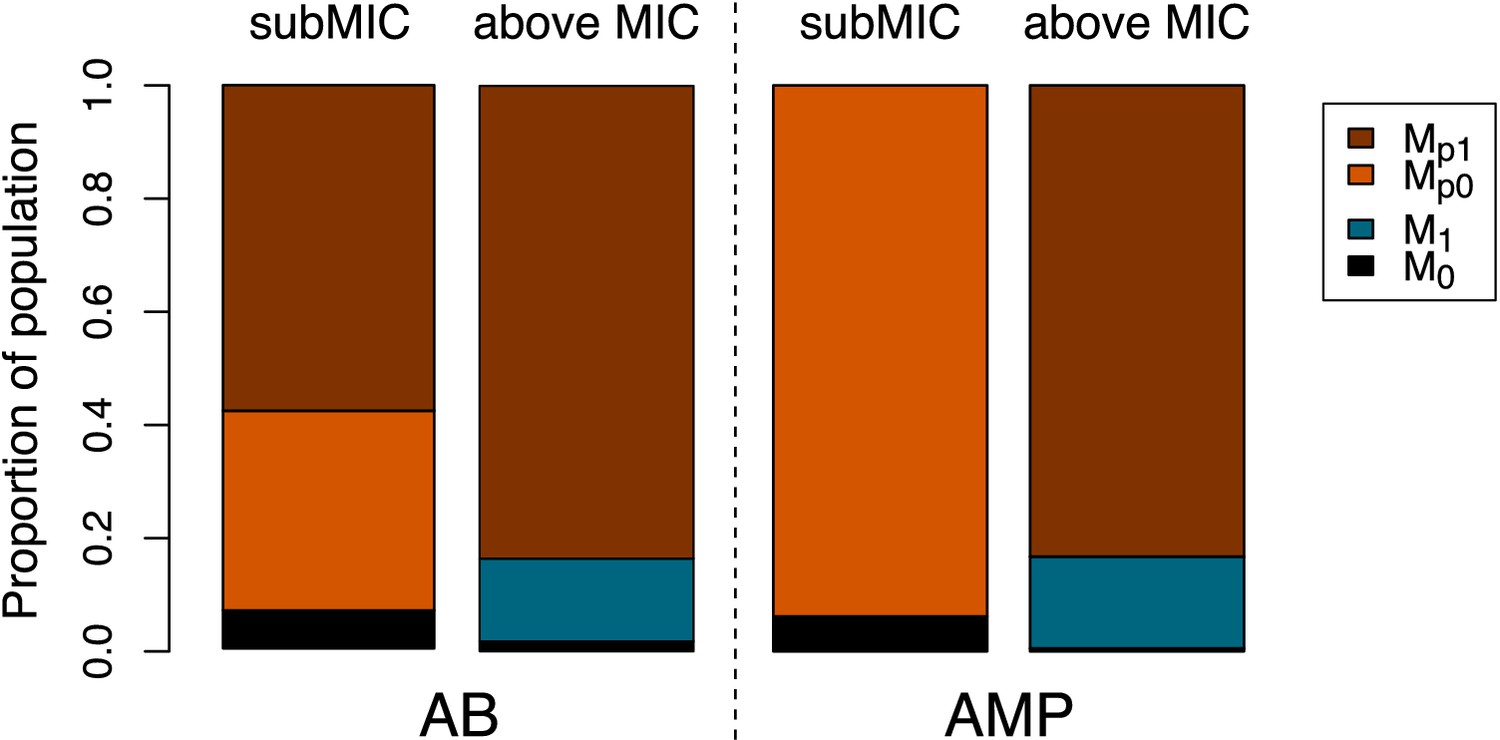
Treatment failure is similar with and without horizontal gene transfer (HGT).
The probability of treatment failure with pharmacokinetic (PK) are shown for four antibiotic (AB) doses (xMIC) in simulations with (solid lines) or without (dashed lines) HGT over a range of mutational benefits (xMIC). MIC: minimum inhibitory concentration.
Figure 2—figure supplement 5
Resistance evolution with random mutational benefit and cost.
Benefit and cost of the first mutation were predetermined (x-axis), determining single-step (ss) or multi-step (ms) resistance patterns, but further mutational benefits and costs were drawn randomly and independently. (A) Treatment failure probability and (B) mutational diversity are shown for two different antimicrobial classes (antibiotics (ABs), left; antimicrobial peptides (AMPs), right) for different combinations of mutational benefits (xMIC) and drug doses (xMIC). The diagonal line separates ss (lower orange triangle) from ms (upper blue triangle) resistance. MIC: minimum inhibitory concentration.
Figure 2—figure supplement 6
Resistance evolution with single-step (ss) and multi-step (ms) patterns for peak pharmacokinetic (PK) starting from neutral mutation heterogeneity.
(A) Treatment failure probability and (B) mutational diversity are shown for two different antimicrobial classes (antibiotics (ABs), left; antimicrobial peptides (AMPs), right) for different combinations of mutational benefits (xMIC) and drug doses (xMIC). The diagonal line separates ss (lower orange triangle) from ms (upper blue triangle) resistance. MIC: minimum inhibitory concentration.
Figure 3 with 7 supplements
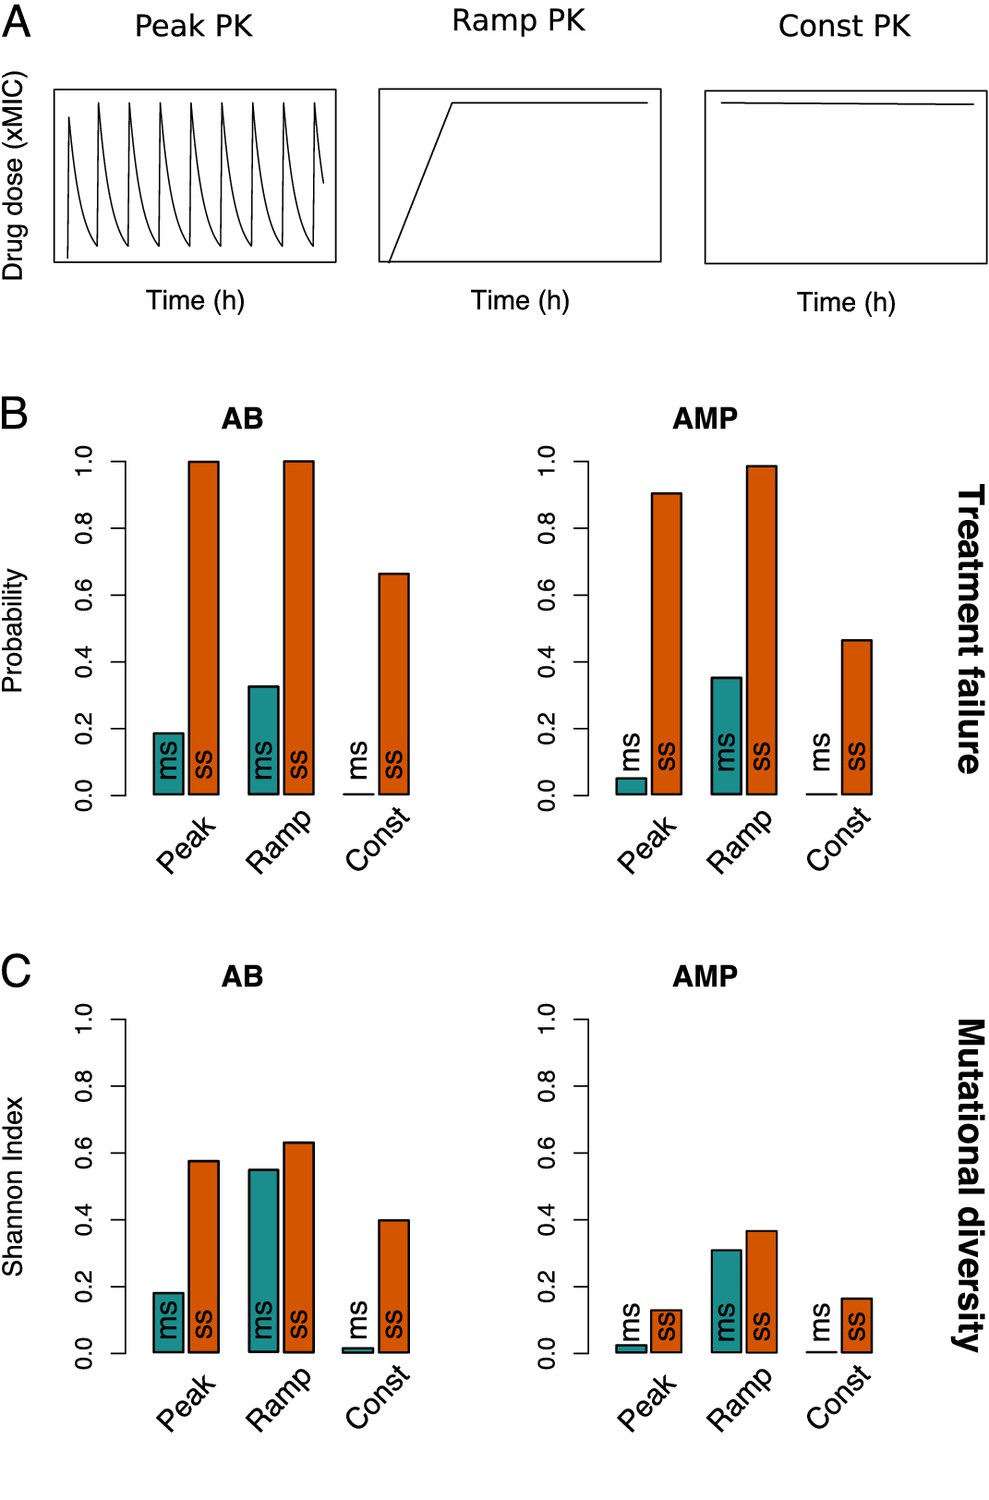
Resistance evolution patterns with different pharmacokinetics (PKs).
(A) The three PKs used in the model are shown over time (in hours) for the same peak drug concentration (xMIC). (B) The treatment failure probabilities and (C) mutational diversities are given for the three PKs from (A) and two antimicrobial drug classes (antibiotics (ABs) and antimicrobial peptides (AMPs)). Blue (orange) bars show averages calculated over the blue (orange) framed triangular areas of multi-step (ms) (single-step (ss)) resistance evolution shown in Figure 2, Figure 3—figure supplements 1 and 2. MIC: minimum inhibitory concentration.
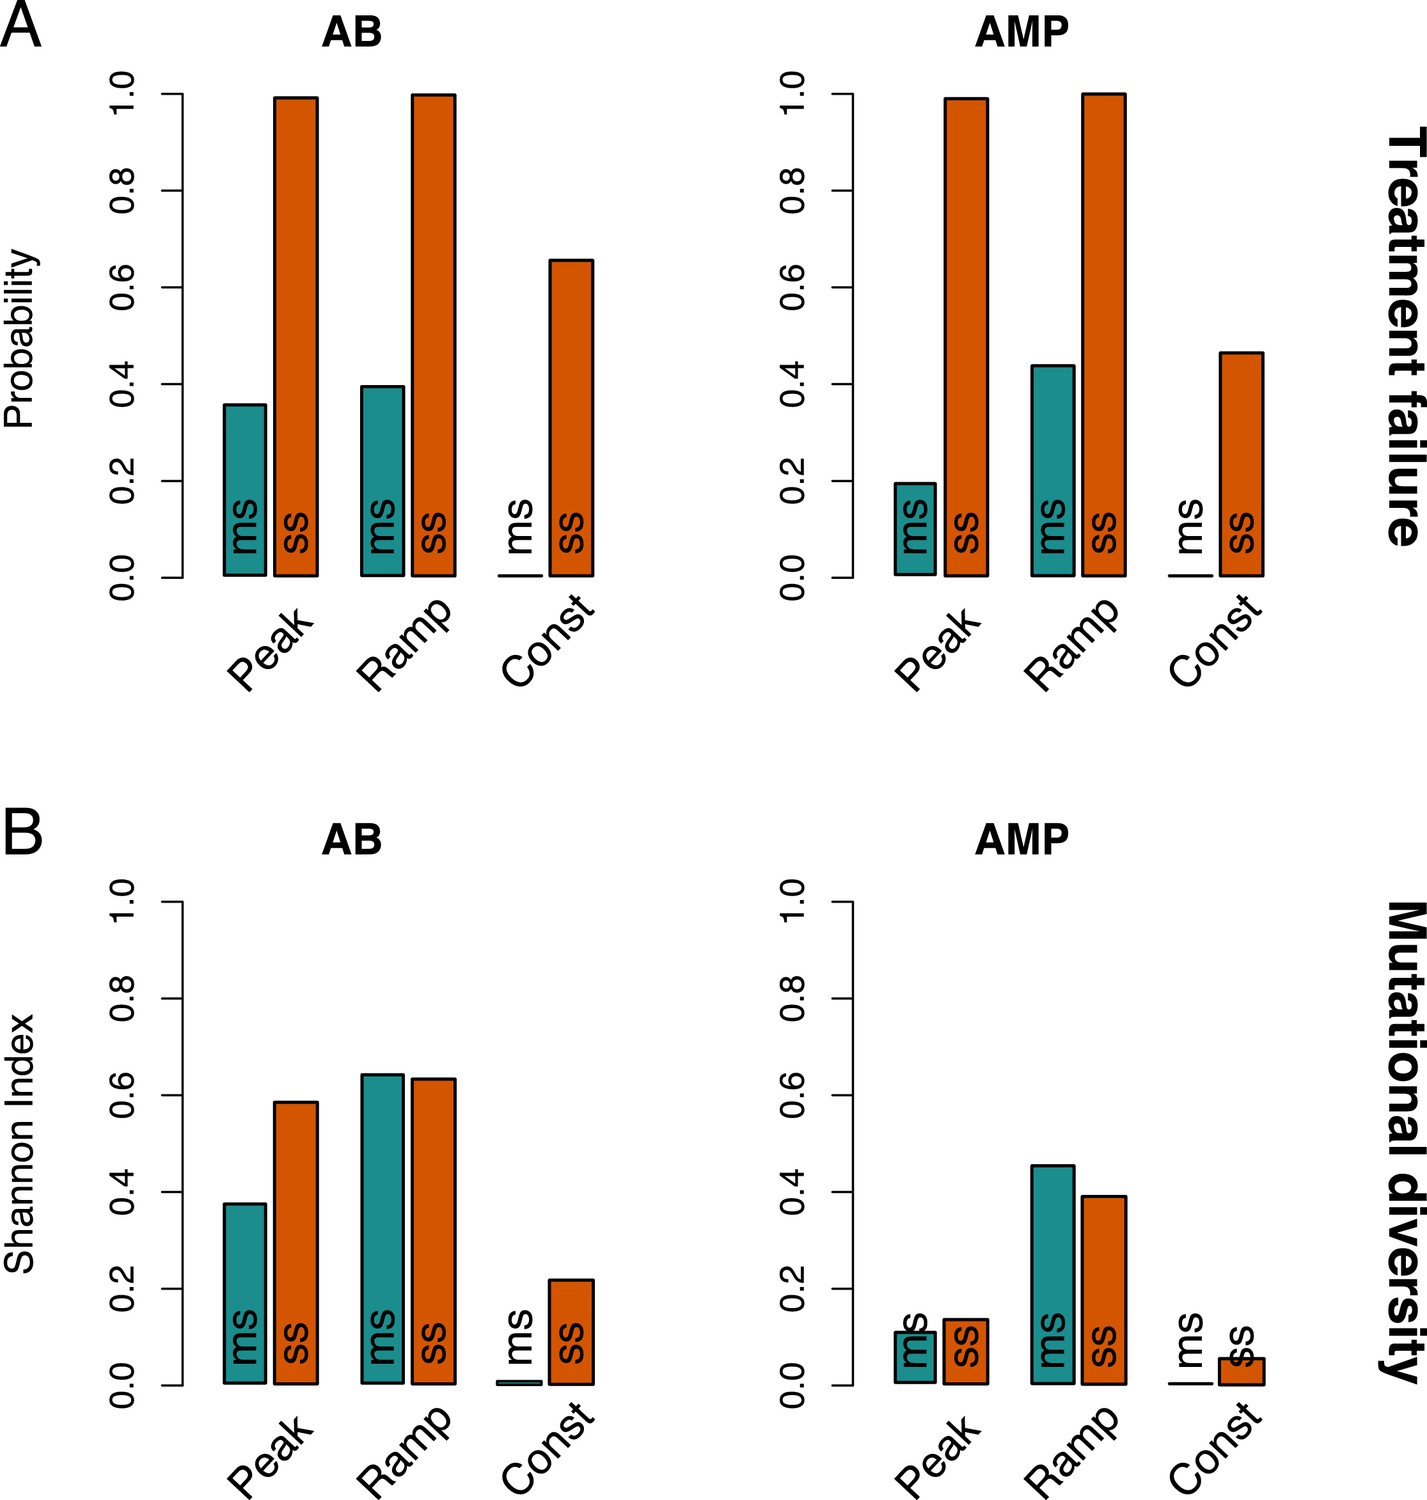
Figure 3—figure supplement 1
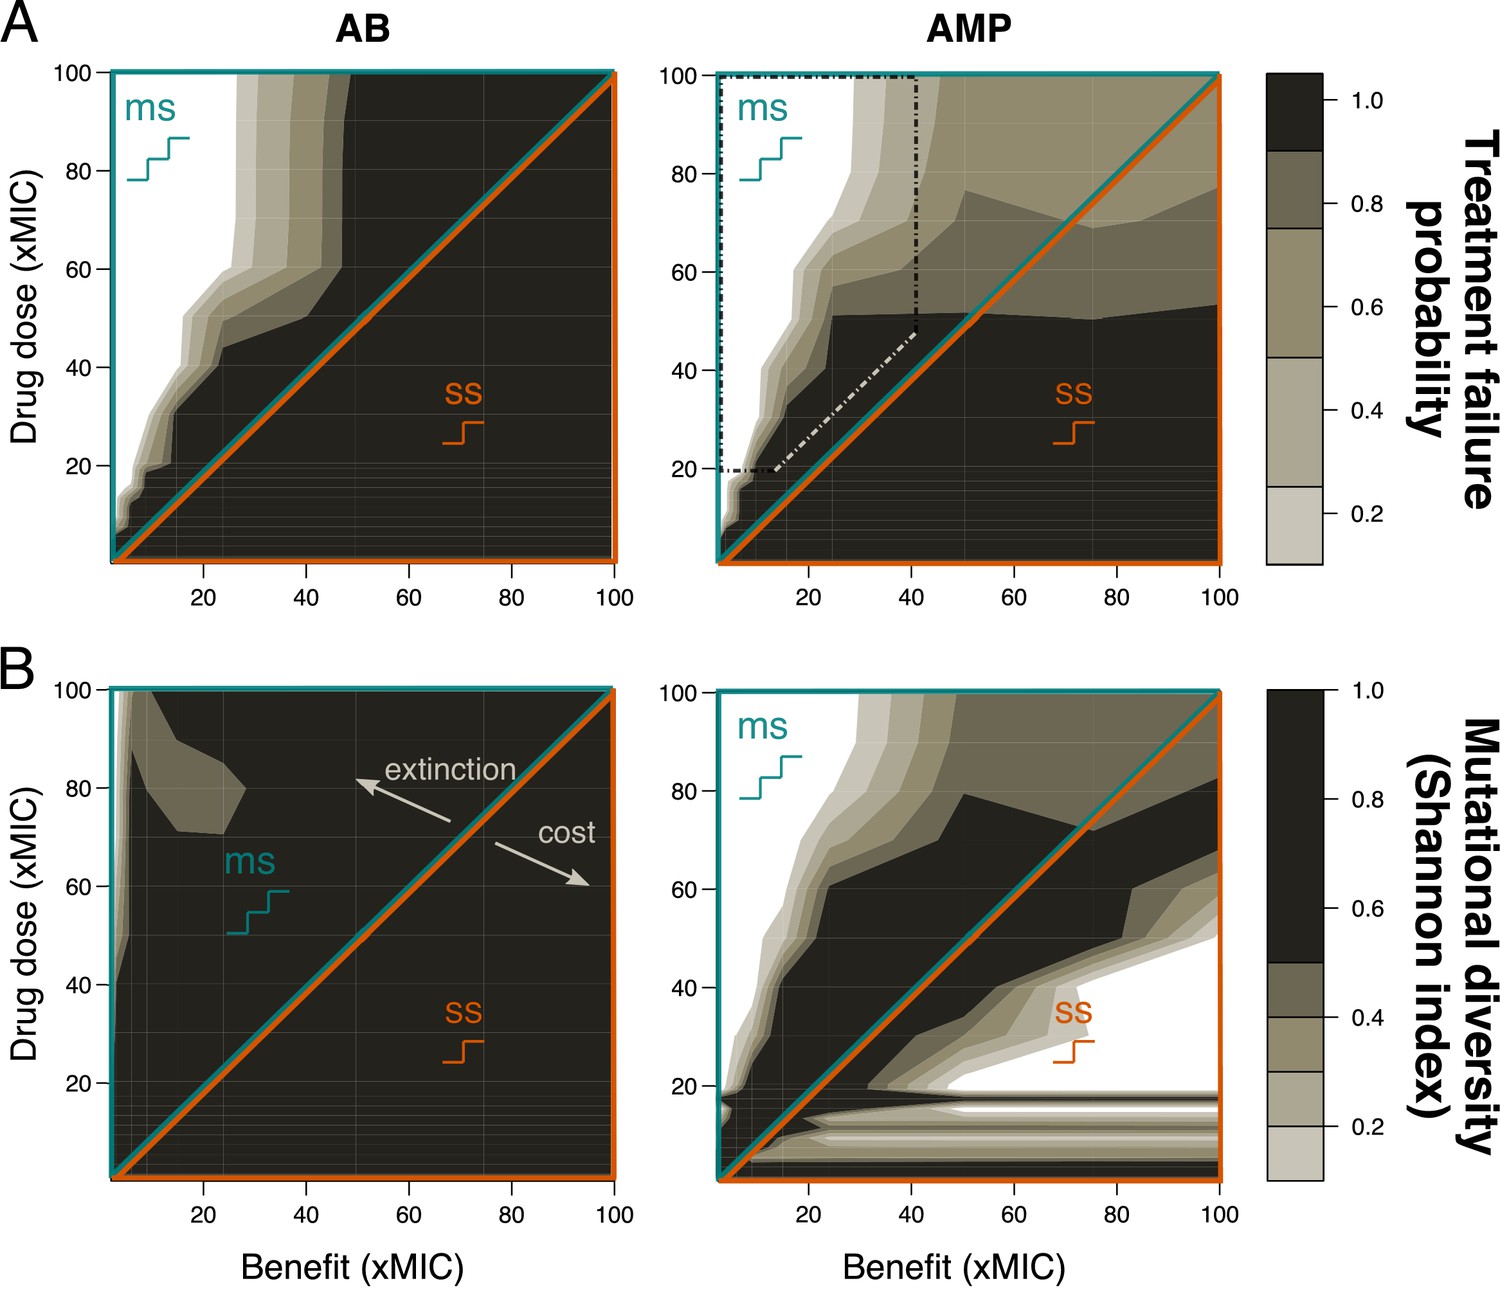
Resistance evolution with single-step (ss) and multi-step (ms) patterns for ramp pharmacokinetic (PK).
(A) Treatment failure probability and (B) mutational diversity are shown for two different antimicrobial classes (antibiotics (ABs), left; antimicrobial peptides (AMPs) right) for different combinations of mutational benefits (xMIC) and drug doses (xMIC). The diagonal line separates ss (lower orange triangle) from ms (upper blue triangle). The dotted rectangle shows the area in which AMPs lead to higher treatment failure probabilities than ABs. MIC; minimum inhibitory concentration.
Figure 3—figure supplement 2
Resistance evolution with single-step (ss) and multi-step (ms) patterns for constant pharmacokinetic (PK).
(A) Treatment failure probability and (B) mutational diversity are shown for two different antimicrobial classes (antibiotics (ABs), left; antimicrobial peptides (AMPs) right) for different combinations of mutational benefits (xMIC) and drug doses (xMIC). The diagonal line separates ss (lower orange triangle) from ms (upper blue triangle) resistance. MIC: minimum inhibitory concentration.
Figure 3—figure supplement 3
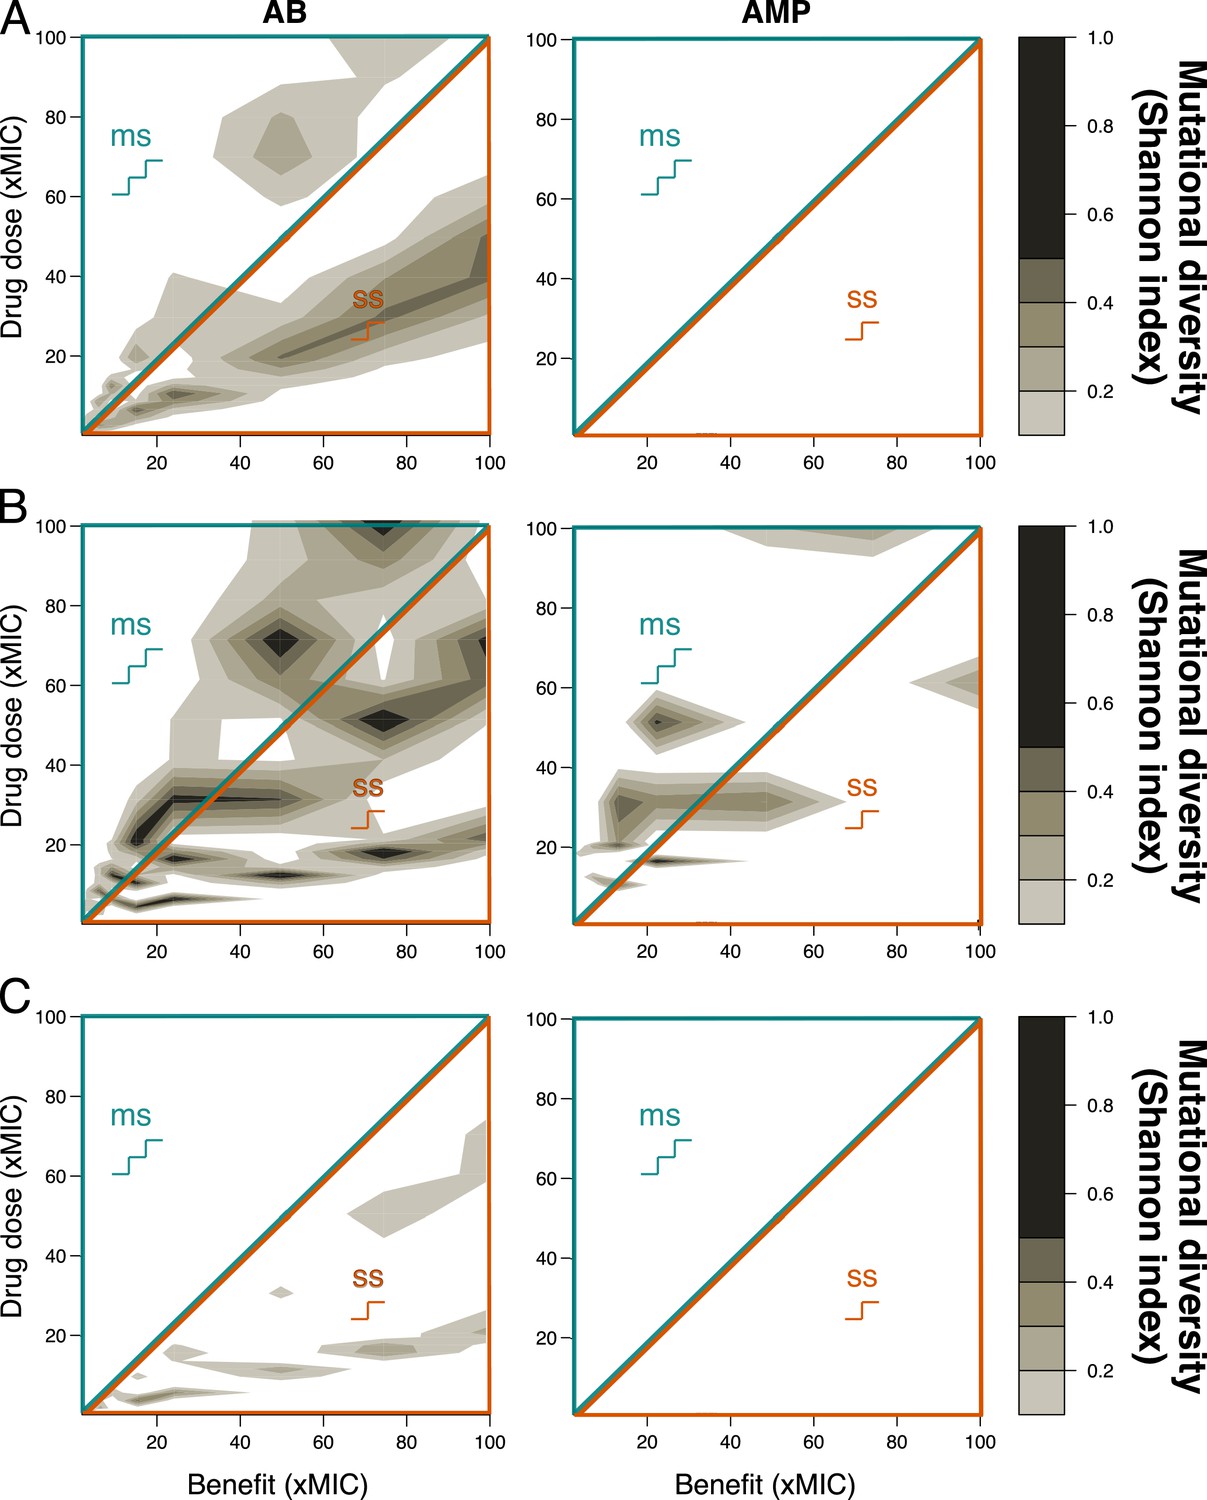
Mutational diversity at the end of the treatment period.
Mutational diversity was calculated as Shannon diversity after 200 hr of treatment applying peak (A), ramp (B), or const (C) pharmacokinetic (PK) for two different antimicrobial classes (antibiotics (ABs), left; antimicrobial peptides (AMPs), right) for different combinations of mutational benefits (xMIC) and drug doses (xMIC). The diagonal line separates single-step (ss, lower orange triangle) from multi-step (ms, upper blue triangle) resistance. Diversity is generally strongly reduced but shows a similar trend for AB treatments to the maximal diversity over the whole treatment period (Figure 2B, Figure 3—figure supplements 1B and 2B) as it is highest at benefit magnitudes that are only slightly higher than the given drug dose, that is, one mutation provides enough benefit for survival but a second one still improves growth enough to justify the additional cost, or slightly lower than the given drug dose, that is, sufficient mutations come up fast enough for survival and at least two are needed for survival. For AMPs, which have a steeper , populations are either reduced to the fittest phenotype (just enough mutations as needed to survive) or go extinct. MIC: minimum inhibitory concentration.
Figure 3—figure supplement 4
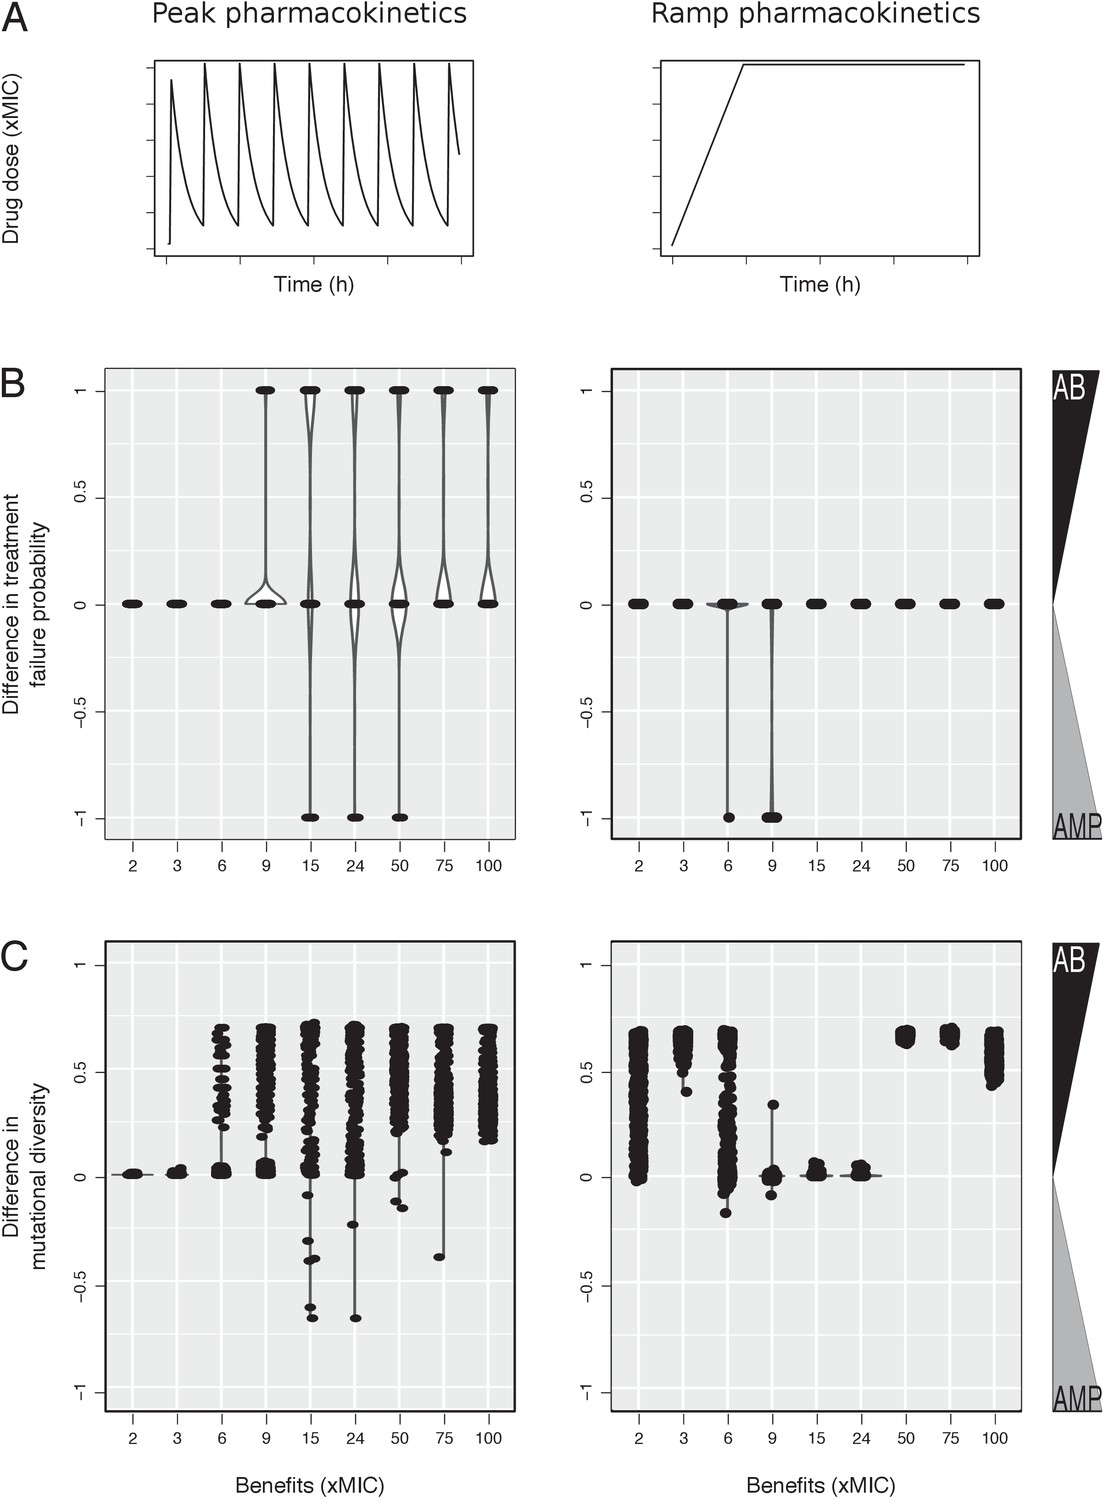
Comparison of resistance evolution with antibiotic (AB) and antimicrobial peptide (AMP) treatments using peak or ramp pharmacokinetic (PK).
(A) Violin plots show the densities, as well as the individual simulation results, obtained from calculating the difference between AB and AMP treatments regarding (B) treatment failure and (C) mutational diversity after every simulation with positive values showing higher incidence in AB treatments and negative values, higher incidence in AMP treatments. Simulations were run with a ramp PK increase of 48 hr at 20xMIC drug dose for various benefits as shown. MIC: minimum inhibitory concentration.
Figure 3—figure supplement 5
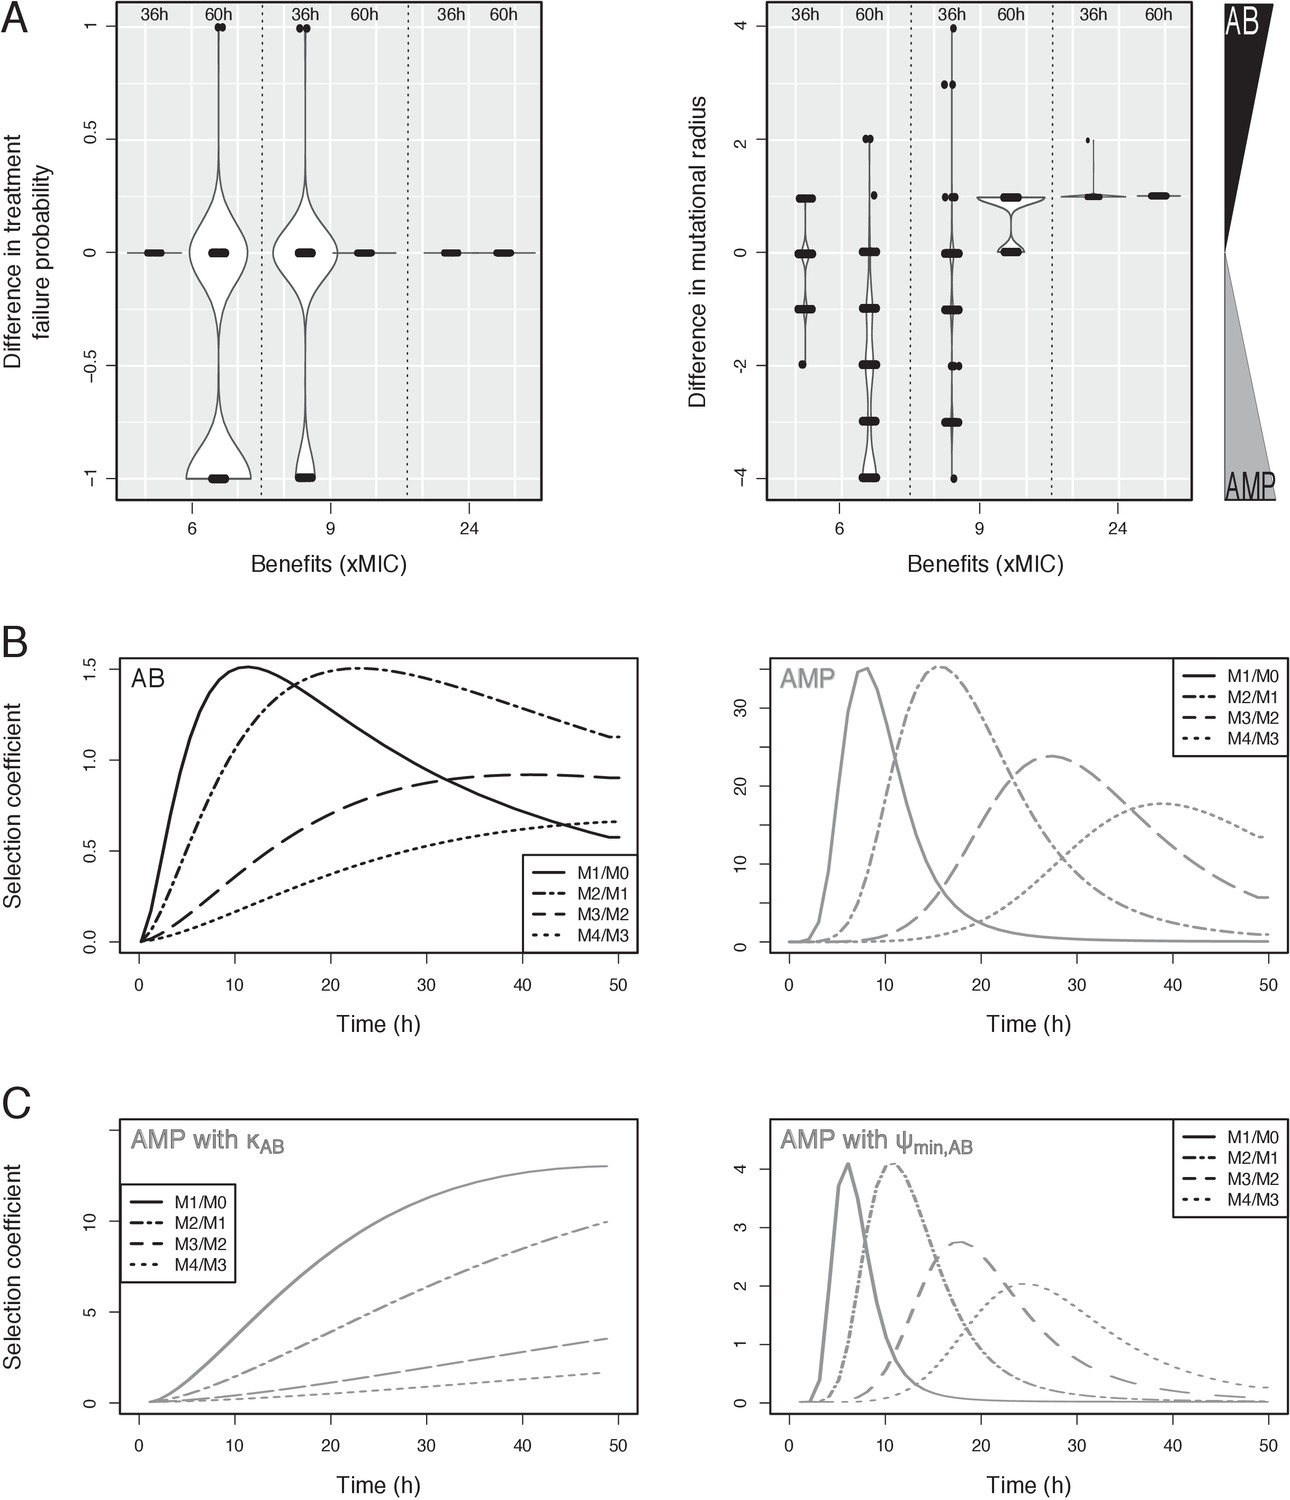
Selection coefficient analysis.
(A) Violin plots give the density and individual points for the difference between antibiotic (AB) and antimicrobial peptide (AMP) treatment failure probability calculated after every simulation run with a ramp pharmacokinetic (PK) increase of 36 hr or 60 hr at 20xMIC drug dose for various mutational benefits as shown. Positive values showing higher incidence in AB treatments and negative values, higher incidence in AMP treatments. (B) Selection coefficients (see Materials and methods for calculation) for a (final) drug dose of 20xMIC, a ramp time of 48 hr and a benefit per mutation of 2xMIC are shown for AB (left) or AMP (right) treatments. Solid lines give the selection of the first mutant over the wildtype, dash-dotted lines selection of the second over the first mutant, dashed lines selection of the third over the second mutant, and dotted lines selection of the fourth over the third mutant. (C) Selection coefficients for the same conditions as in (B) with AMP treatments but the pharmacodynamic (PD) parameter κ (left) or (right) are swapped with the ones for AB treatments. Whereas κ changes the selection coefficients in a qualitative manner, does so in a quantitative manner.
Figure 3—figure supplement 6
Resistance evolution patterns with different pharmacokinetics (PKs) and pharmacodynamics (PDs) for bacteriostatic drug action.
(A) The treatment failure probabilities and (B) mutational diversities are given for the three PKs from Figure 3A and two antimicrobial drug classes (antibiotics (ABs) and antimicrobial peptides (AMPs)) when incorporating drug effect into bacterial growth, instead of death. Blue (orange) bars show averages calculated over areas of multi-step (ms) (single-step (ss)) resistance evolution (not shown). Bacteriostatic action reduces treatment failure in ramp and const PK treatments, but increases it with peak PKs. Generally, AB treatments show a stronger impact of drug action than AMPs.
Figure 3—figure supplement 7
Resistance evolution patterns with different pharmacokinetics (PKs) for simulations starting from neutral mutation heterogeneity.
(A) Treatment failure probabilities and (B) mutational diversities are given for the three PKs from Figure 3A and two antimicrobial drug classes (antibiotics (ABs) and antimicrobial peptides (AMPs)). Blue (orange) bars show averages calculated over areas of multi-step (ms) (single-step (ss)) resistance evolution (not shown but similar to Figure 2—figure supplement 5, S6). Specifically, ms resistance patterns show higher treatment failure and mutational diversity, but the increase is generally less than twofold.
Figure 4 with 2 supplements
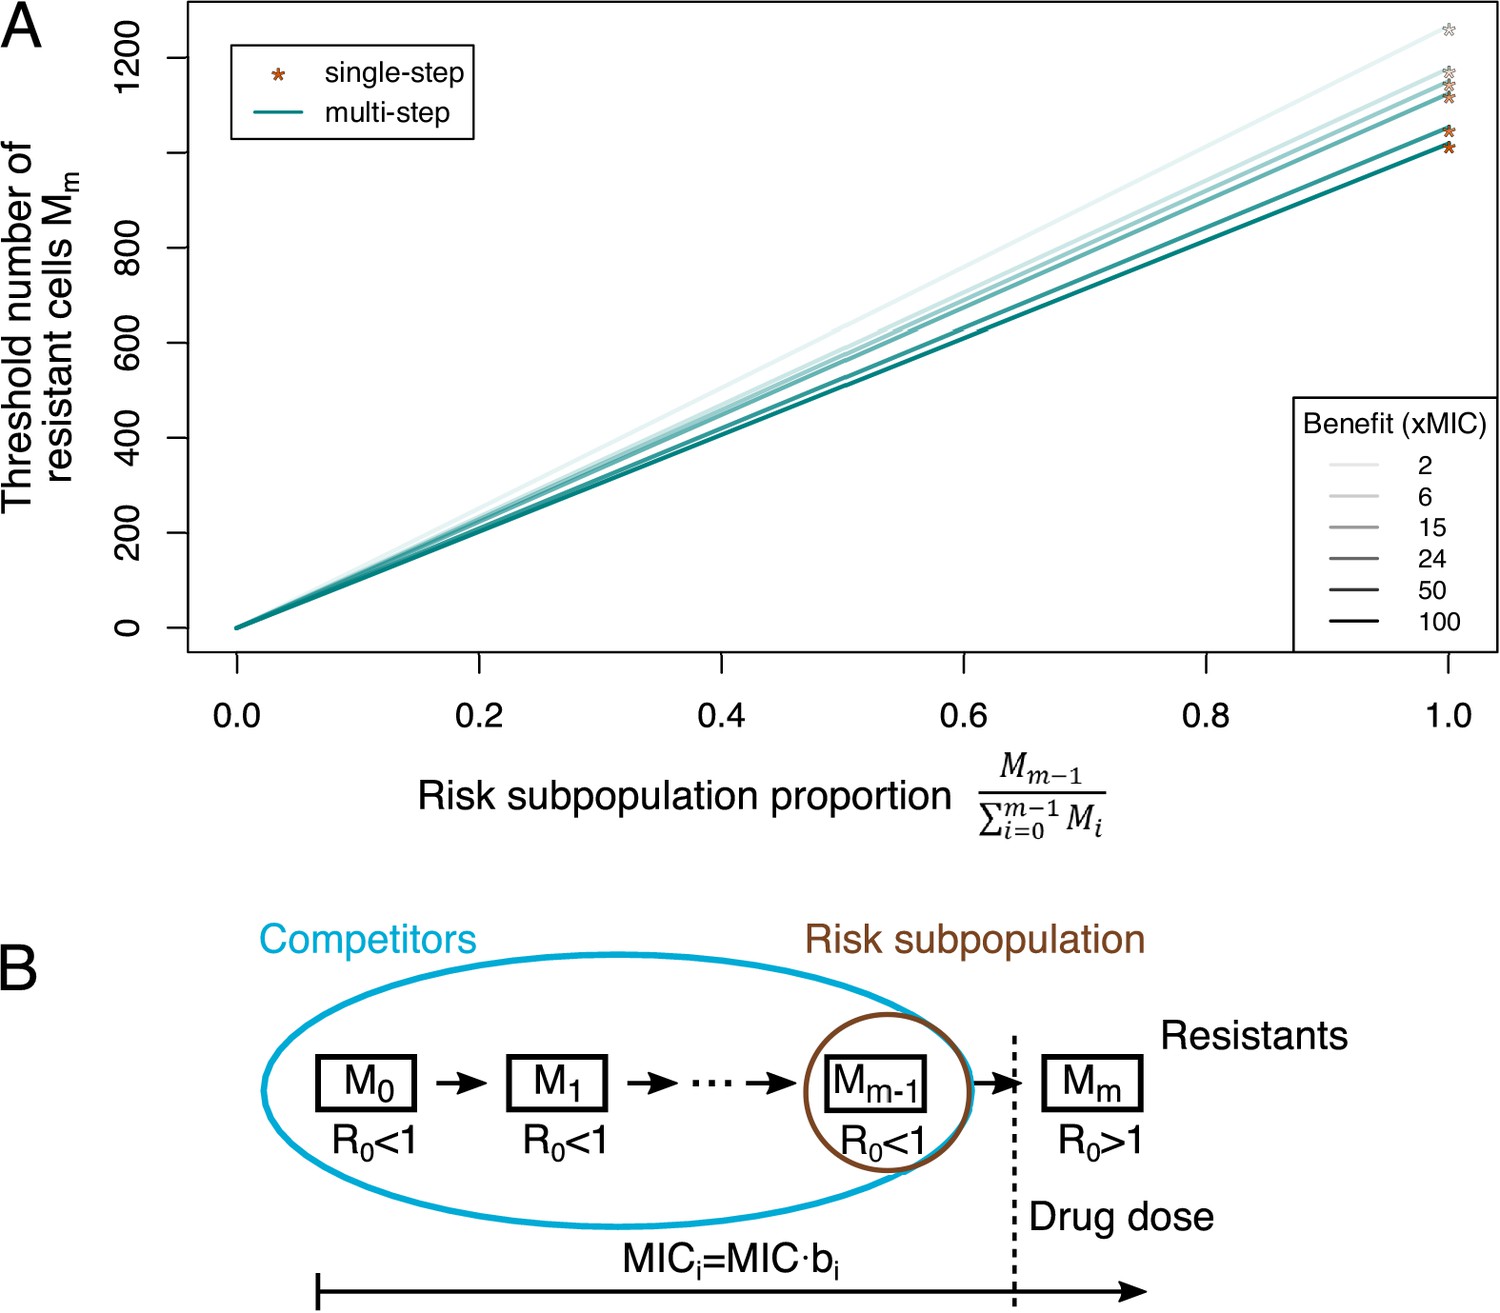
Adaptive treatment threshold.
(A) The dependence of the threshold number of resistant bacteria cells Mm is given for different proportions of the risk population to the whole competitor population for single-step (orange stars), where the risk population is always equal to 1, and multi-step (blue lines) resistance patterns. Different benefits (and correlated costs) per mutation are shown as different color shades. (B) The minimum inhibitory concentration (MIC) increases with every mutation (given by bi), but only an MIC above the given drug dose will lead to a reproductive number R0 >1, that is, growth of the population (resistant cells). All other subpopulations serve as competitors, and the subpopulation one mutation away from resistance is the risk population.
Figure 4—figure supplement 1
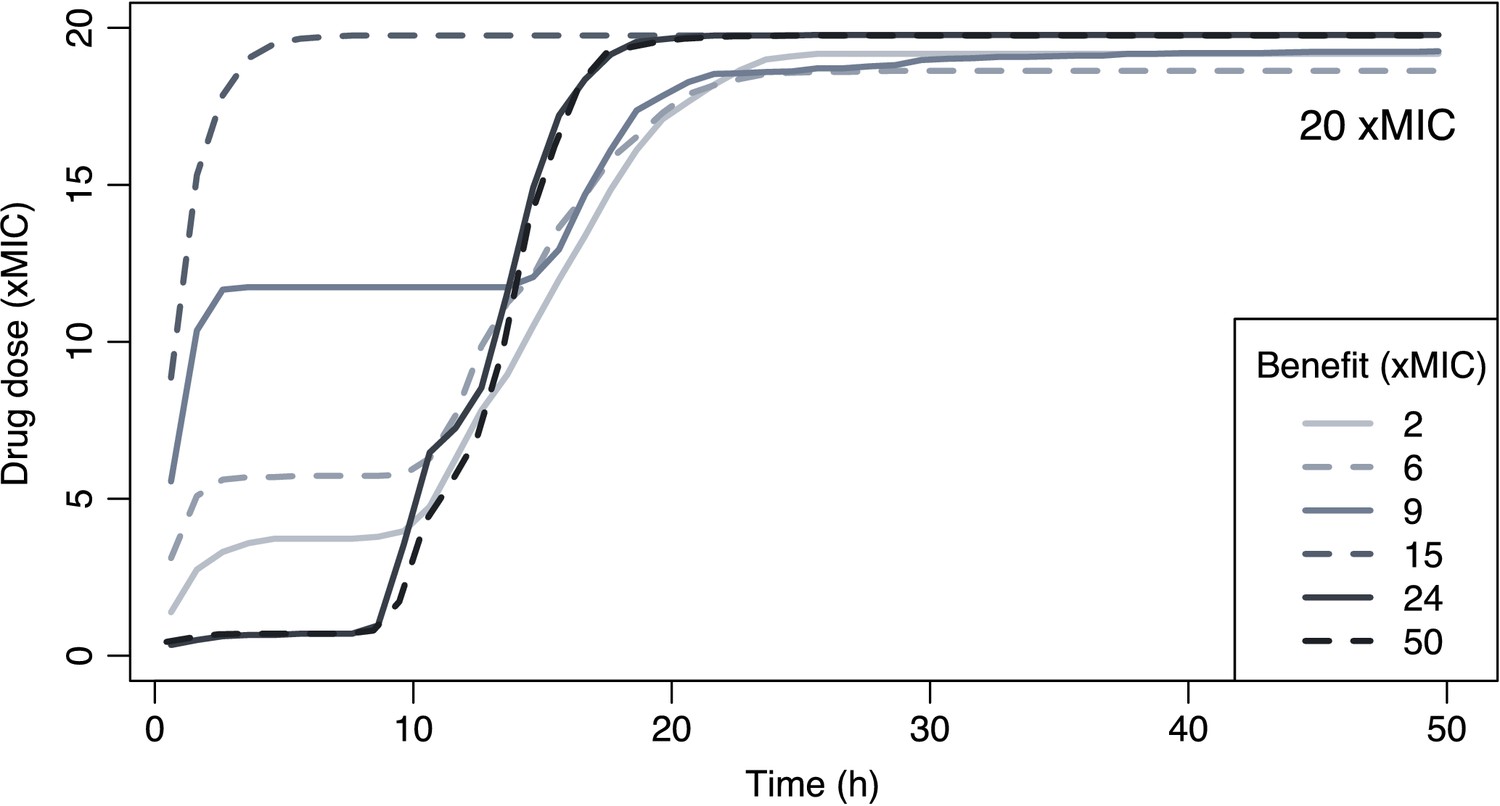
Optimal pharmacokinetic (PK) for adaptive treatment.
Shown are the optimal PKs (xMIC) over time (hours) if drug doses are adapted to keep the bacterial population below a certain maximum but the number of competitors as high as possible. The maximum drug dose was set as 20xMIC, and the mutational benefit was varied between 3 and 50 (xMIC). MIC: minimum inhibitory concentration.
Figure 4—figure supplement 2
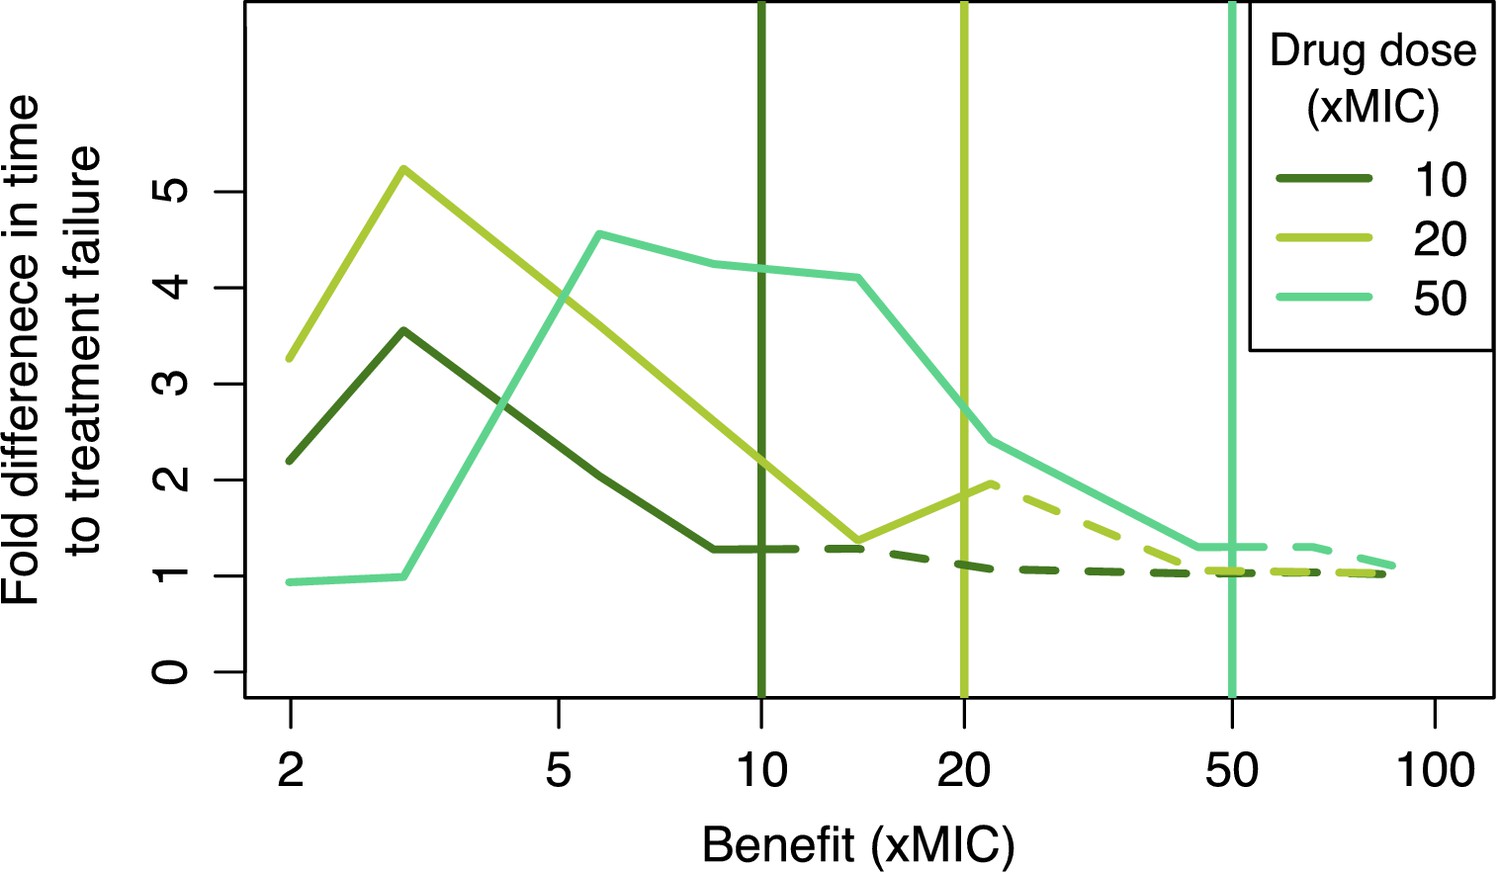
Differences in time to treatment failure are more pronounced with multi-step patterns.
Shown is the fold difference between aggressive (peak pharmacokinetic (PK)) and adaptive treatment in the time needed for the pathogens to escape treatment at a specific maximum drug dose (xMIC) for a range of mutational benefits (xMIC), starting with a population containing enough mutants to favor adaptive treatment. Vertical lines show the respective thresholds dividing multi-step from single-step resistance patterns (single-step patterns are shown in dashed lines). Particularly for multi-step resistance evolution, adaptive treatment can lead to much longer time periods before treatment failure, but we also find a trade-off: if the pathway to resistance involves too many steps, then keeping the competitive population alive requires very low doses, whereas the few resistant bacteria do not pay enough growth cost to delay treatment failure longer than with aggressive treatment. MIC: minimum inhibitory concentration.
Tables
Table 1
Benefits and costs of drug resistance mutations from experimental studies reported for antibiotics (ABs) and antimicrobial peptides (AMPs), with small mutational benefits (likely giving rise to multi-step resistance patterns) given in blue and large ones (likely giving rise to single-step resistance patterns) in red, assuming a typical clinical drug dose of about 10× minimum inhibitory concentration (MIC) (Figure 1A, B).
| Source | Drug type | Organism and evolution environment | Number and type of mutations | Benefit per mutational event | Cost per mutation event | Benefit measurement | Fitness measurement |
|---|---|---|---|---|---|---|---|
| Spohn et al., 2019 (benefits and costs calculated for individual AB classes are given in Figure 1—source data 1) | AMP | Escherichia coli K-12 BW25113 populations were evolved in minimal salt (MS) medium over 20 transfers every 72 hr at 30°C (~120 generations) with successively increasing dosages of the antimicrobial | 197 independent mutational events (deletions, insertions, SNPs (Single nucleotide polymorphisms), and intergenic mutations) ~5.2 (±0.8) mutational events/genome | All MIC samples: 5.1 (±7.2) xMIC ~= xMIC/mutation Only the ones where costs were measured as well: 31.4 (±8.5) xMIC ~= xMIC/mutation | 0.2 (±0.16) ~=0.04/mutation | Serial broth (MS) dilution medium; MIC was defined as OD600 < 0.05 fold-increase compared to ancestor | Continuous monitoring of optical density of liquid cultures (in MS); area under the growth curve from 1 to 24 hr, normalized by the wildtype (WT) |
| AB | N.D. Assumed: ~5 | All MIC samples: 72.0 (±2.8) xMIC ~= xMIC/mutation Only the ones where costs were measured as well: 120.0 (±2.8) xMIC ~= xMIC/mutation | 0.47 (±0.29) ~=0.1/mutation | ||||
| Melnyk et al., 2015 (benefits and costs calculated for individual AB classes are given in Figure 1—source data 1) (and references therein: synthesis of 24 studies) | AB | Borrelia burgdorferi, Campylobacter jejuni, E. coli, Enterococcus faecium, Mycobacterium smegmatis, Mycobacterium tuberculosis, Staphylococcus aureus, Streptococcus pneumonia (all pathogenic) in various environments | Single mutational events (in total 128 mutations) | (±19.8) xMIC | 0.13 (±0.24) | MIC fold-increase to ancestor | Competitive fitness (via in vitro growth assays with WT) |
| Chevereau et al., 2015 | AB | E. coli K-12 BW25113 knockout strains (Keio collection) were incubated at 30°C for 20 hr in rich media (LB) with various ABs | Single-gene deletions (3913 mutant strains) ~4 mutations, all types (day 10) | Mecillinam: (±1.1) xIC50 Trimethoprim: (±1) xIC50 Ciprofloxacin: (±1.2) xIC50 ~ (±1.1) xIC50 | 0.13 (±0.07) N.D. | IC50 (in LB) | Reduction in growth rate (in LB); calculated from a linear fit of log(OD) in the range 0.022 < OD < 0.22; given relative to WT |
| Lofton et al., 2013 | AMP | Salmonella typhimurium LT2 was passaged daily in rich media (refined LB) at 37°C with successively increasing AMP concentrations for 400–500 generations | SNPs and deletions 2–3 mutational events | LL-37: xMIC ~= xMIC/mutation WGH: xMIC ~=– xMIC/mutation CNY100HL: xMIC ~= xMIC/mutation | 0.076 (±1.1) ~=0.025–0.038/mutation 0.11 ~=0.037–0.055/mutation 0.17 ~=0.057–0.085/mutation | MIC through serial broth (refined LB) dilution | Growth rate from OD600 measurements (in refined LB) in the range 0.02 < OD < 0.2; given relative to WT |
| Kubicek-Sutherland et al., 2017 | AMP | S. aureus (MRSA) WT JE2 (DA28823; clinical isolate) was passaged daily in minimal media (MIEM) at 37°C with successively increasing AMP concentrations | 1–3 (adaptive) amino acid substitutions | LL-37: (±6.2) × survival (for this AMP benefit was measured not as fold MIC increase but fold bacterial survival) ~= xMIC/mutation WGH: (±1.2) xMIC ~=– xMIC/mutation PR-39: (±1) xMIC ~= xMIC/mutation | <= 0 (no detectable cost, rather an advantage, was found in the media used in the evolution experiment) | MIC through serial broth (MIEM) dilution, except for LL-37 where kill curves were used (in tryptic soy broth, rich media) | Maximum growth rate in MIEM based on (exponential phase) OD600 measurements; given relative to WT |
| Makarova et al., 2018 | AMP | S. aureus SH1000 and E. coli MG1655 were transferred for seven daily passages in rich media (Mueller Hinton Broth [MHB]) at 37°C with successively increasing AMP dosages | All types ~2.4 (±0.9) mutational events | Tenecin 1: (±1.1) xMIC of wt ~= xMIC/mutation | 0.25 (±0.13) ~=0.1/mutation | MIC through serial broth (MHB) dilution; defined as inhibition of visible growth after 24 hr | Maximum growth rate in MHB based on OD600 measurements |
| AMP | Mean: (±5.3) xMIC/mutation | Mean: 0.04 (±0.03)/mutation | |||||
| AB | Mean: (±7.1) xMIC/mutation | Mean: 0.10 (±0.07)/mutation |
Key resources table
| Reagent type (species) or resource | Designation | Source or reference | Identifiers | Additional information |
|---|---|---|---|---|
| Software, algorithm | R package adaptivetau | Johnson, P. Tau-Leaping Stochastic Simulation. R package version 2.2–3 (2019) (Johnson, 2019) | RRID:SCR_001905 | The epsilon parameter (i.e., tolerance of relative rate changes in step size selection) was changed to 0.01 to increase accuracy |
| Other | Previously published datasets | Melnyk A, Wong A, Kassen R. The fitness costs of antibiotic resistance mutations. (2015) (Melnyk et al., 2015) | Dryad repository: http://doi.org/ 10.5061/dryad.5rc47 |
Additional files
-
Source code 1
R package containing the pharmacokinetic and pharmacodynamic model for multi-step resistance evolution.
R code used for the simulations shown in Figures 2–4 and figure supplements (with the exception of Figure 1—figure supplement 1). Documentation of each function is included in the package.
- https://cdn.elifesciences.org/articles/64116/elife-64116-code1-v2.resistance.zip
-
Supplementary file 1
Model parameters.
Parameter values and units used in the pharmacodynamic model for either antibiotic or antimicrobial peptide simulations are shown.
- https://cdn.elifesciences.org/articles/64116/elife-64116-supp1-v2.docx
-
Transparent reporting form
- https://cdn.elifesciences.org/articles/64116/elife-64116-transrepform-v2.docx
Download links
A two-part list of links to download the article, or parts of the article, in various formats.
Downloads (link to download the article as PDF)
Open citations (links to open the citations from this article in various online reference manager services)
Cite this article (links to download the citations from this article in formats compatible with various reference manager tools)
Multi-step vs. single-step resistance evolution under different drugs, pharmacokinetics, and treatment regimens
eLife 10:e64116.
https://doi.org/10.7554/eLife.64116


