Early maternal loss leads to short- but not long-term effects on diurnal cortisol slopes in wild chimpanzees
- Department of Human Behavior, Ecology and Culture, Max Planck Institute for Evolutionary Anthropology, Germany
- Taï Chimpanzee Project, Centre Suisse de Recherches Scientifiques, Côte d'Ivoire
- Department of Primatology, Max Planck Institute for Evolutionary Anthropology, Germany
- Department of Human Evolutionary Biology, Harvard University, United States
- Division of Psychology, University of Stirling, United Kingdom
- Tropical Conservation Institute, Florida International University, United States
- World Wide Fund for Nature, Dzanga Sangha Protected Areas, Central African Republic
- Robert Koch Institute, Epidemiology of Highly Pathogenic Microorganisms, Germany
- Centre Suisse de Recherches Scientifiques en Côte d'Ivoire, Côte d'Ivoire
- Unité de Formation et de Recherche Biosciences, Université Félix Houphouët Boigny, Côte d'Ivoire
- Interim Group Primatology, Max Planck Institute for Evolutionary Anthropology, Germany
- Institut des Sciences Cognitives, CNRS, France
Figures
Figure 1
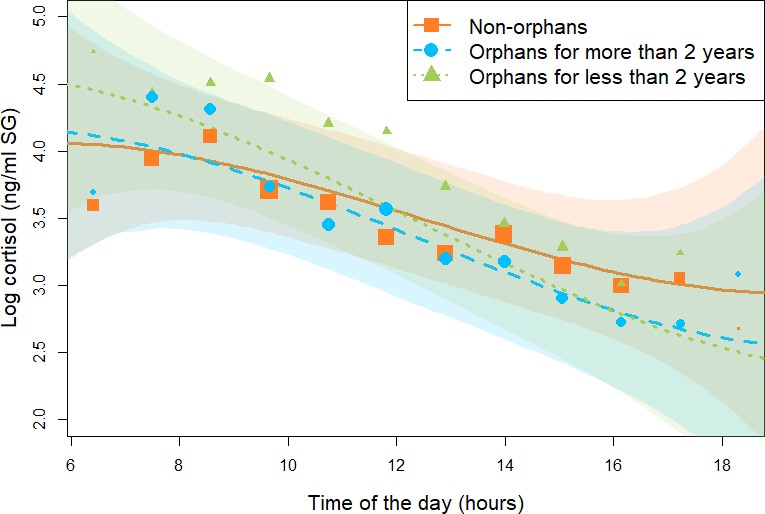
Effect of maternal loss on daily urinary cortisol level variations in immature chimpanzees.
Non-orphans are depicted by orange squares, recently orphans (orphaned for less than 2 years) by green triangles, `and non-recently orphaned (orphaned for more than 2 years) by blue circles. Each dot represents the average hourly cortisol level for all individuals of each orphan category. The size of the dot is proportional to the sample size (e.g., the number of data points) contributing to each dot. The orange solid line and green and blue dashed lines depict the model line prediction, and the orange, green, and blue area the 95% credible interval (CI) from the all immature model for non-orphans, recently orphans, and non-recently orphans, respectively. The model lines depict the consistent effect of the interaction between orphan status and the linear term for time of day in the all immature model (estimate: –0.22, 95% CI: [–0.03: –0.48]). The sample size for the all immature model was N = 846 samples and 50 individuals.
Figure 2
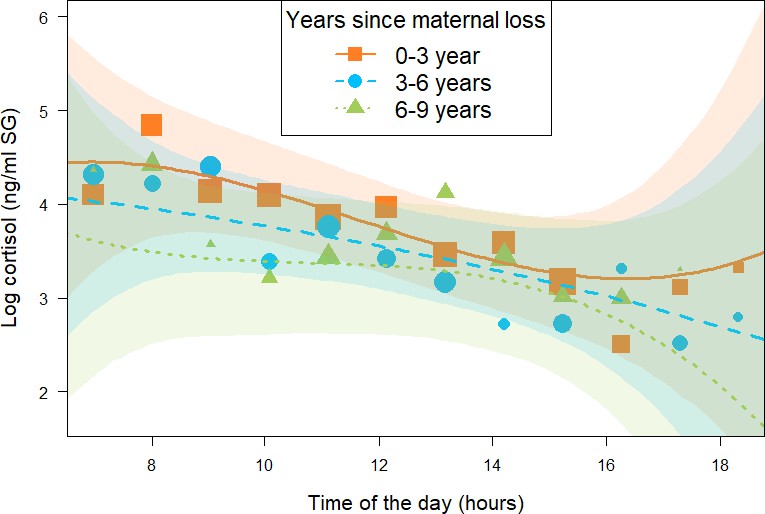
Effect of time (in years) since being orphaned on daily urinary cortisol level variations of immature orphan chimpanzees.
Orange squares, blue circles, and green triangles depict cortisol levels for individuals who lost their mother less than 3 years ago, 3–6 years ago, and 6–9 years ago, respectively. Each dot represents the average hourly cortisol level of all individuals for each of the three categorical intervals of years since maternal loss. The size of the dot is proportional to the sample size (number of urine samples collected) for each hour of the day. The orange solid line, blue dashed line, and green dashed lines indicate model line predictions, and the orange, blue, and green light areas indicate the 95% credible interval (CI) for individuals who lost their mother less than 3 years ago, 3–6 years ago, and 6–9 years ago, respectively (immature orphan model). The model line depicts the interaction between years since maternal loss and the cubic term for time of day in the immature orphan model: (estimate and [90% CI]: –0.06 [-0.14: 0.00]), but this effect comprised a relatively large uncertainty since the 95% CI overlapped 0 (Table 2). Note that while the predictor ‘years since maternal loss’ was modeled as a continuous variable in the immature orphan model, for ease of interpretation we depict the results here for three categorical intervals of ‘years since maternal loss’. The sample size for the immature orphan model was N = 393 samples and 17 individuals.
Figure 3
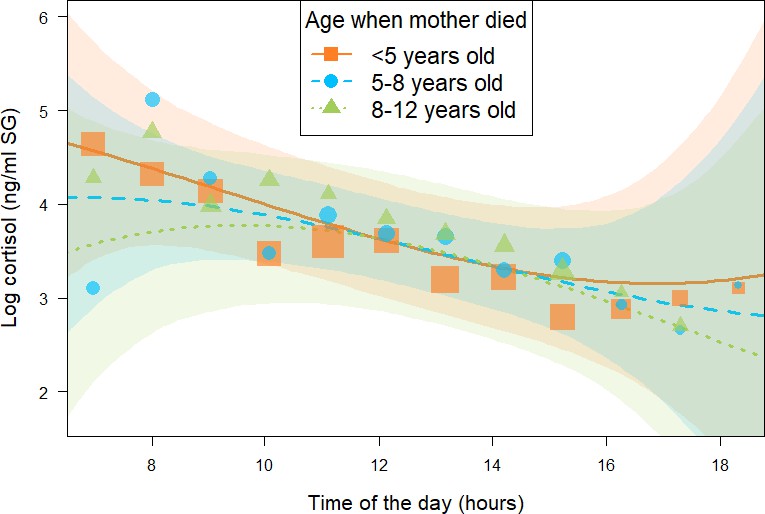
Effect of age at which immature orphans lost their mother on daily urinary cortisol level variations of immature orphan chimpanzees.
Orange square, blue circles, and green triangles depict cortisol levels for individuals who lost their mother when they were less than 5 years, 5–8 years, and 8–12 years of age, respectively. Each dot represents the average hourly cortisol level of all individuals for each of the three categories of age when mother died. The size of the dot is proportional to the sample size (number of urine sample collected) for each hour of the day. The orange solid line and blue and green dashed lines indicate model line predictions, and the orange, blue, and green light areas the 95% credible interval (CI) for individuals who lost their mother when they were less than 5 years, 5–8 years, and 8–12 years of age, respectively (immature orphan model). The model lines depict the consistent effect of the interaction between age when mother died and the quadratic term of time of day in the immature orphan model (estimate and [95% CI]: –0.12 [0.00: –0.23]). Note that while ‘age at maternal loss’ was modeled as a continuous variable in the immature orphan model, for ease of interpretation the model is depicted here for three categorical intervals of ’age when mother died’. The sample size for the immature orphan model was N = 393 samples and 17 individuals.
Appendix 1—figure 1
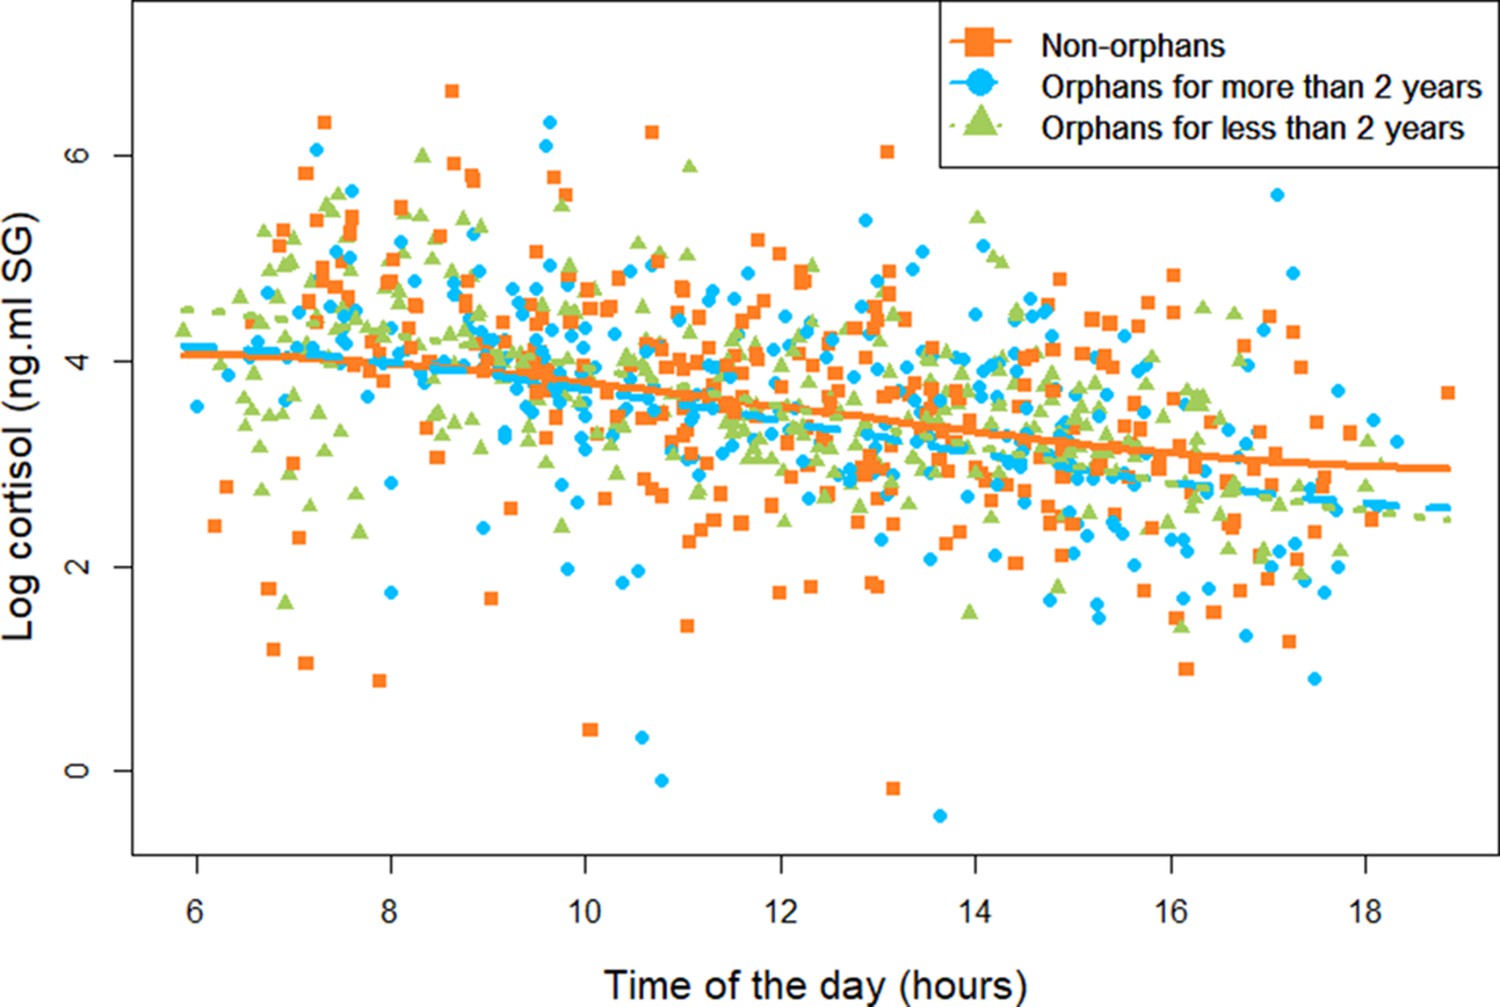
Diurnal cortisol level variation in immature chimpanzees.
Non-orphans are depicted by orange squares, recently orphans (orphaned for less than 2 years) by green triangles, and non-recently orphaned (orphaned for more than 2 years) in blue circles. Each dot represents one sample. As for Figure 1, the orange solid line and green and blue dashed lines depict the model prediction lines from the all immature model Model 1a for non-orphans, recently orphans, and non-recently orphans, respectively. The model lines depict the consistent effect of the interaction between orphan status and the linear term for time of day in the all immature model Model 1a (estimate: –0.22, 95% credible interval [CI]: [–0.03: –0.48]). The sample size for the all immature model Model 1a was N = 846 samples and 50 individuals.
Appendix 1—figure 2
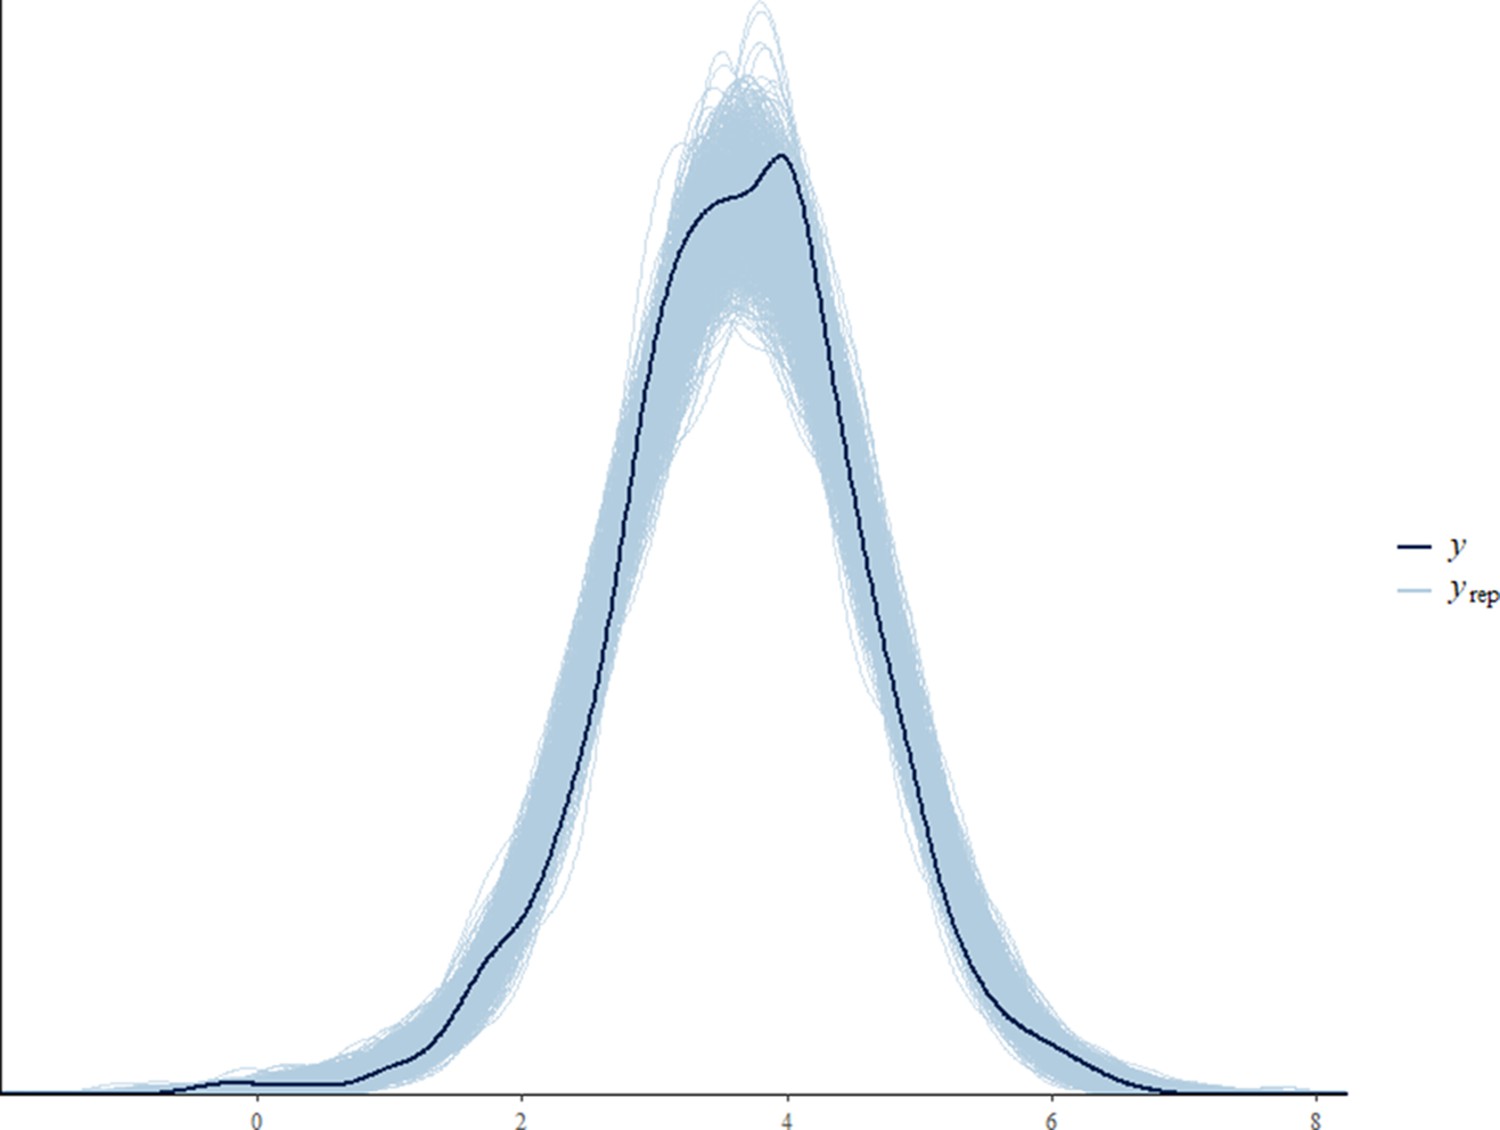
Posterior predictive check for the all immature model.
Appendix 1—figure 3
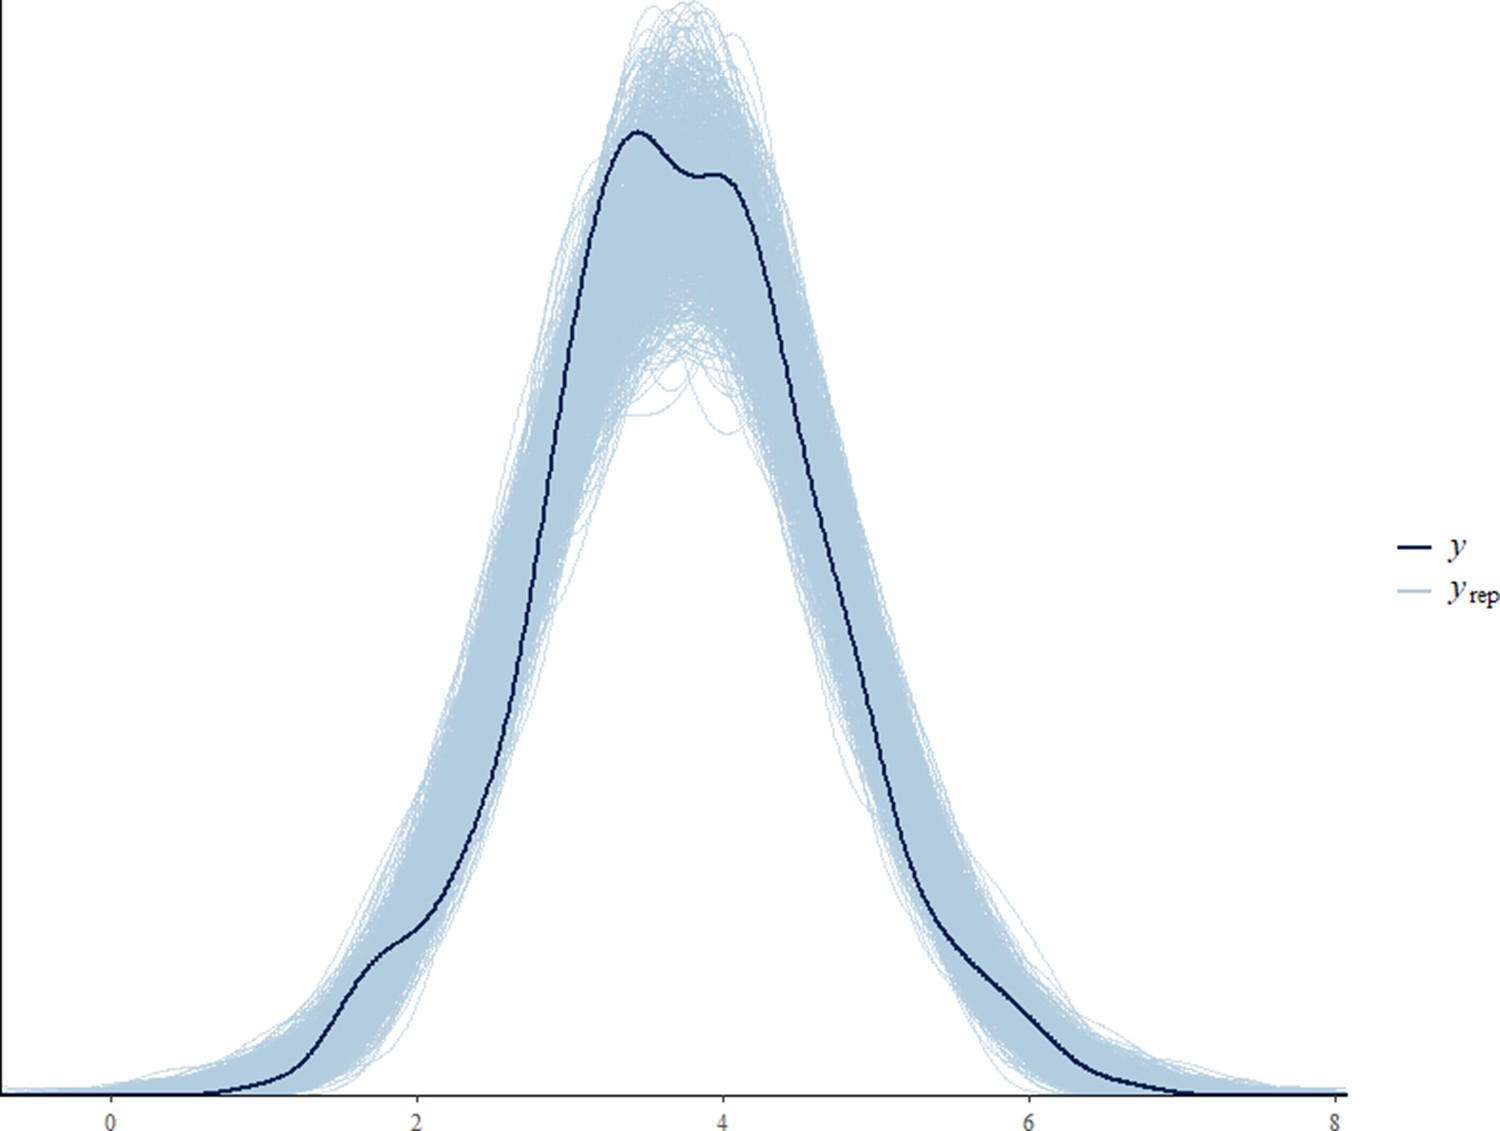
Posterior predictive check for the immature orphan model.
Appendix 1—figure 4
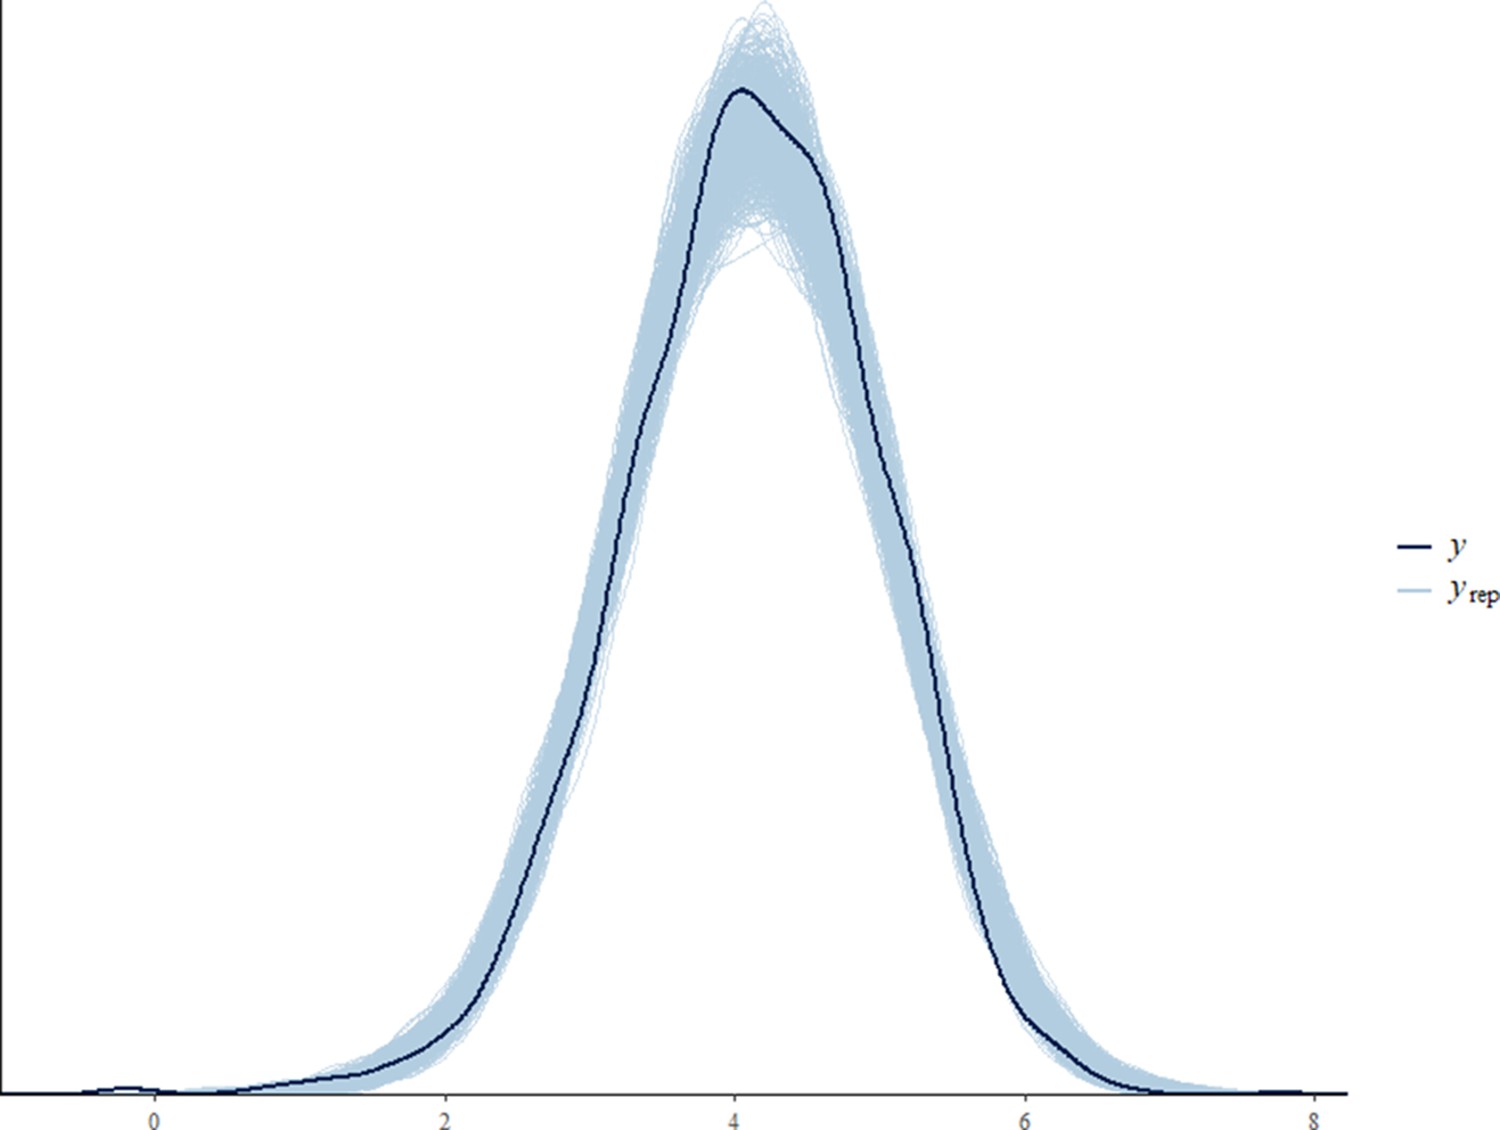
Posterior predictive check for the all adult male model.
Appendix 1—figure 5
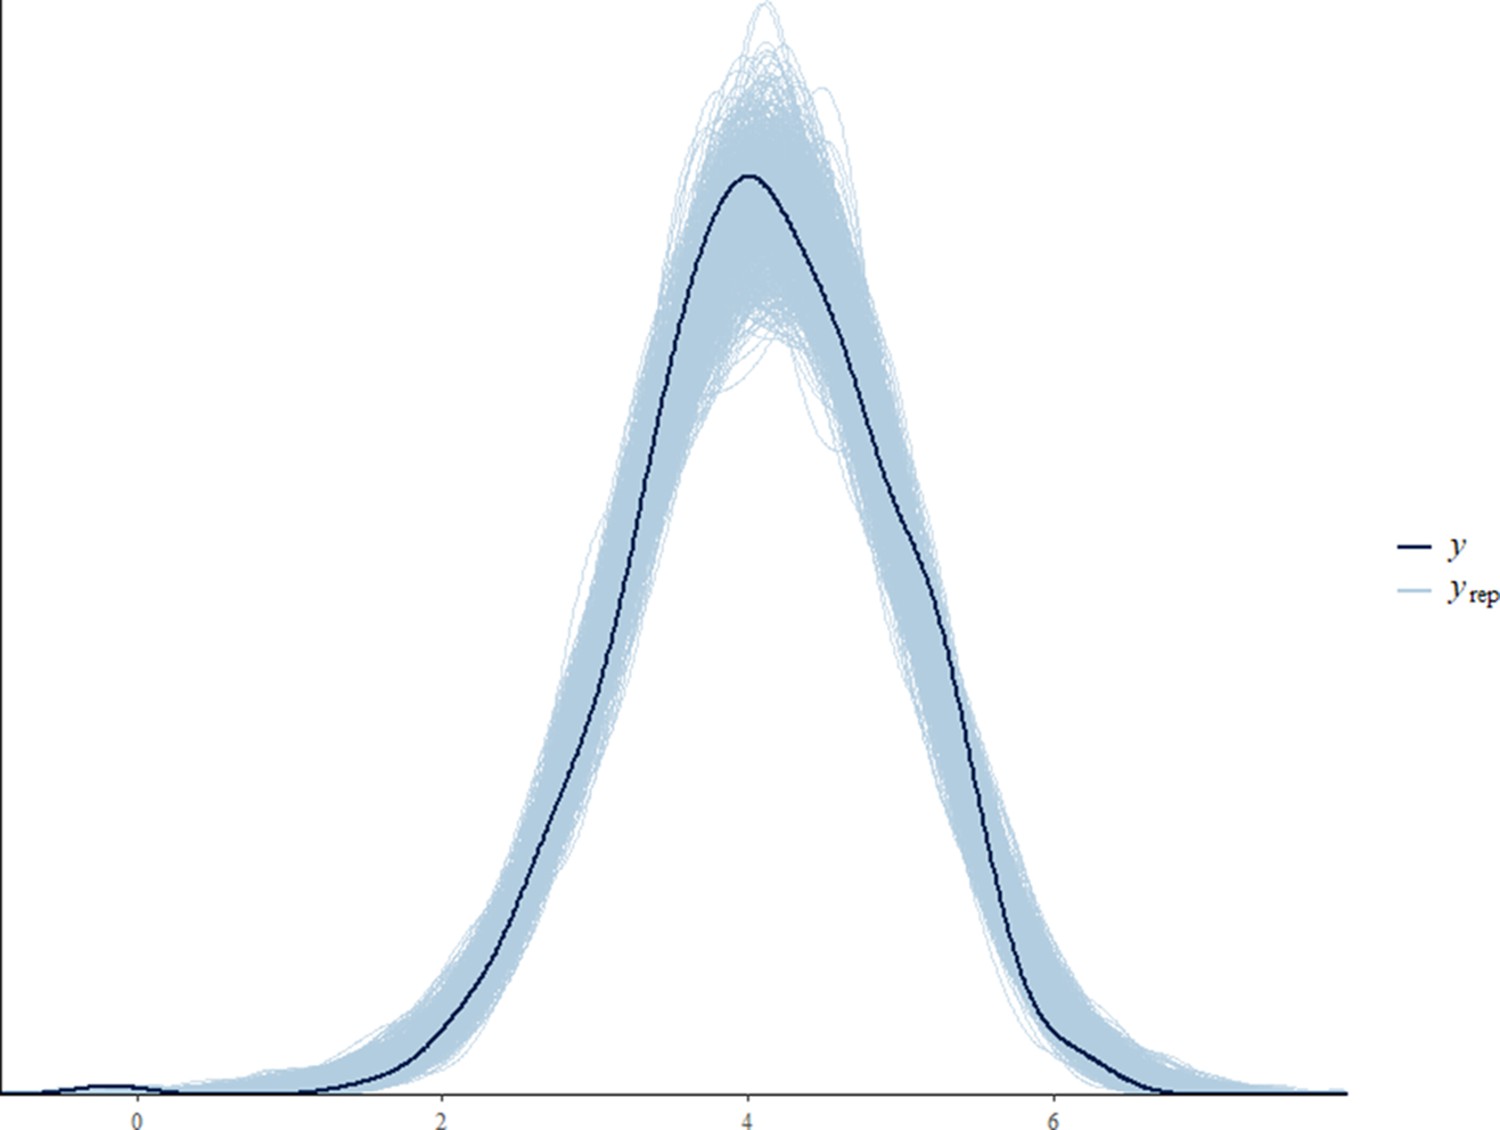
Posterior predictive check for the adult male orphan model.
Tables
Table 1
Sample size for immature and adult male orphans and non-orphans in each of the four study communities.
| Community | Age class | Orphan status | N.ID | No. of samples | Mean ± SE no. of sample per individual | Age range (years) |
|---|---|---|---|---|---|---|
| Taï East | Immatures | Non-orphans | 8* | 112 | 14.0 ± 3.8 | 3.8–11.9 |
| Recently orphaned | 5* | 116 | 23.2 ± 9.1 | 4.1–11.9 | ||
| Non-recently orphaned | 9* | 136 | 15.1 ± 6.4 | 6.1–11.8 | ||
| Adult males | Non-orphans | 4 | 456 | 114.0 ± 56.2 | 13.8–40.7 | |
| Orphans | 3 | 354 | 118.0 ± 18.0 | 12.3–19.8 | ||
| Taï Middle | Immatures | Non-orphans | ||||
| Recently orphaned | ||||||
| Non-recently orphaned | ||||||
| Adult males | Non-orphans | 3 | 17 | 5.7 ± 0.67 | 17.2–33.7 | |
| Orphans | ||||||
| Taï North | Immatures | Non-orphans | 11 | 168 | 15.3 ± 4.3 | 3.0–12.0 |
| Recently orphaned | ||||||
| Non-recently orphaned | 2 | 7 | 3.5 ± 0.5 | 10.5–11.3 | ||
| Adult males | Non-orphans | 3 | 95 | 31.7 ± 9.1 | 12.3–20.8 | |
| Orphans | 2 | 61 | 30.5 ± 3.5 | 12.1–20.4 | ||
| Taï South | Immatures | Non-orphans | 17* | 173 | 10.2 ± 1.5 | 2.8–11.9 |
| Recently orphaned | 2* | 18 | 9.0 ± 6.0 | 4.1–9.2 | ||
| Non-recently orphaned | 5* | 116 | 23.2 ± 7.7 | 6.1–11.9 | ||
| Adult males | Non-orphans | 7 | 858 | 122.6 ± 18.1 | 12.1–45.3 | |
| Orphans | 6 | 343 | 57.2 ± 31.5 | 12.1–21.9 |
-
*
50 immature individuals were included in this study but one immature in Taï East and two immatures in Taï South were sampled before and after their mother died (i.e., they are counted twice in the table, once as an orphan and once as a non-orphan). Six males were included in the study as both mature and immature individuals.
Table 2
Results of the all immature and the immature orphan models.
These two models tested in immatures for the effect of orphan status (all immature model) and, for immature orphan only, the effect of age when mother died and years since maternal loss (orphan immature model) on cortisol levels and diurnal cortisol slopes. The results presented here are from reduced all immature and immature orphan models after removing the interactions for which the 90% credible interval (CI) overlapped 0. SE indicates the standard error of the estimate for each predictor. The coded level for each categorical predictor is indicated in parentheses. Control predictors are italicized. 95% CI low and 95% CI high indicate the lower and upper limits of the 95% CI. Likewise, 90% CI low and 90% CI high indicate the lower and upper limits of the 90% CI. CIs that do not overlap 0 are indicated in bold. Predictors for which the 95% CI did not overlap 0 are indicated with salmon shading, and predictors for which the 95% CI overlapped 0 but the 90% CI did not overlap 0 are indicated with yellow shading. LCMS: liquid chromatography mass spectrometry. Time of the day2: quadratic term for time of the day. Time of the day3: cubic term for time of the day.
| Model | Response | Predictor | Estimate | SE | 95% CI low | 95% CI high | 90% CI low | 90% CI high |
|---|---|---|---|---|---|---|---|---|
| All immature model | Log urinary cortisol levels (ng/ml SG) | Intercept | 3.69 | 0.27 | 3.17 | 4.23 | 3.26 | 4.14 |
| Time of the day | –0.38 | 0.08 | –0.53 | –0.22 | –0.51 | –0.25 | ||
| Time of the day2 | –0.01 | 0.08 | –0.17 | 0.14 | –0.14 | 0.11 | ||
| Time of the day3 | 0.03 | 0.04 | –0.05 | 0.12 | –0.04 | 0.10 | ||
| Orphan category (orphan for less than 2 years) | 0.01 | 0.19 | –0.36 | 0.38 | –0.30 | 0.32 | ||
| Orphan category (orphan for more than 2 years) | –0.14 | 0.22 | –0.58 | 0.32 | –0.50 | 0.23 | ||
| Sex ratio | 0.07 | 0.07 | –0.06 | 0.2 | –0.04 | 0.18 | ||
| Community size | –0.12 | 0.06 | –0.24 | 0.01 | –0.22 | –0.01 | ||
| Individual sex (male) | –0.26 | 0.25 | –0.78 | 0.22 | –0.67 | 0.13 | ||
| Individual age at sample | –0.01 | 0.17 | –0.33 | 0.37 | –0.27 | 0.29 | ||
| LCMS method (old) | 0.06 | 0.35 | –0.62 | 0.78 | –0.50 | 0.64 | ||
| Sin(seasonDate) | –0.07 | 0.04 | –0.14 | 0 | –0.13 | –0.02 | ||
| Cos(seasonDate) | 0.01 | 0.04 | –0.06 | 0.08 | –0.05 | 0.07 | ||
| Orphan category (less than 2 years): time of the day | –0.22 | 0.10 | –0.41 | –0.03 | –0.38 | –0.07 | ||
| Orphan category (more than 2 years): time of the day | –0.11 | 0.08 | –0.27 | 0.03 | –0.24 | 0.01 | ||
| Immature orphan model | Log urinary cortisol levels (ng/ml SG) | Intercept | 3.59 | 0.26 | 3.08 | 4.11 | 3.17 | 4.02 |
| Time of the day | –0.44 | 0.17 | –0.75 | –0.05 | –0.7 | –0.14 | ||
| Time of the day2 | –0.01 | 0.07 | –0.16 | 0.13 | –0.13 | 0.1 | ||
| Time of the day3 | 0.03 | 0.11 | –0.18 | 0.27 | –0.14 | 0.22 | ||
| Orphan’s age when mother died | 0.00 | 0.24 | –0.51 | 0.46 | –0.41 | 0.38 | ||
| Years since maternal loss | –0.16 | 0.16 | –0.48 | 0.14 | –0.42 | 0.09 | ||
| Sex ratio | –0.06 | 0.11 | –0.27 | 0.15 | –0.23 | 0.11 | ||
| Community size | –0.05 | 0.08 | –0.22 | 0.12 | –0.19 | 0.09 | ||
| Individual sex (male) | 0.1 | 0.3 | –0.47 | 0.7 | –0.38 | 0.6 | ||
| LCMS method (old) | –0.04 | 0.32 | –0.66 | 0.64 | –0.55 | 0.51 | ||
| Sin(seasonDate) | 0.02 | 0.05 | –0.09 | 0.12 | –0.07 | 0.1 | ||
| Cos(seasonDate) | 0.04 | 0.05 | –0.07 | 0.14 | –0.05 | 0.12 | ||
| Years since maternal loss: time of the day | 0.19 | 0.1 | –0.01 | 0.38 | 0.02 | 0.35 | ||
| Years since maternal loss: time of the day2 | –0.05 | 0.05 | –0.15 | 0.05 | –0.14 | 0.03 | ||
| Years since maternal loss: time of the day3 | –0.06 | 0.04 | –0.15 | 0.02 | –0.14 | 0.00 | ||
| Age when mother died: time of the day | 0.08 | 0.09 | –0.09 | 0.25 | –0.06 | 0.22 | ||
| Age when mother died: time of the day2 | –0.12 | 0.06 | –0.23 | –0.00 | –0.21 | –0.02 |
Appendix 1—table 1
Results of the all adult male model testing the effect of maternal loss on cortisol profiles in all mature males.
’All adult male model full’ refers to the full model ran with all the interactions considered. ‘All adult male model reduced’ refers to the reduced model after removing the interactions for which the 90% credible interval (CI) overlapped 0. SE indicates the standard error of the estimate for each predictor. The coded level for each categorical predictor is indicated in parentheses. Control predictors are italicized. 95% CI low and 95% CI high indicate the lower and upper limits of the 95% CI. Likewise, 90% CI low and 90% CI high indicate the lower and upper limits of the 90% CI. CIs that do not overlap 0 are indicated in bold. LCMS: liquid chromatography mass spectrometry. Time of the day2: quadratic term for time of the day. Time of the day3: cubic term for time of the day.
| Model | Response | Predictor | Estimate | SE | 95% CI low | 95% CI high | 90% CI low | 90% CI high |
|---|---|---|---|---|---|---|---|---|
| All adult male model full | Log urinary cortisol levels (ng/ml SG) | Intercept | 3.97 | 0.25 | 3.44 | 4.44 | 3.55 | 4.36 |
| Time of the day | –0.48 | 0.09 | –0.67 | –0.32 | –0.63 | –0.35 | ||
| Time of the day2 | –0.07 | 0.05 | –0.17 | 0.03 | –0.15 | 0.01 | ||
| Time of the day3 | 0.03 | 0.04 | –0.05 | 0.12 | –0.04 | 0.1 | ||
| Orphan status (yes, orphan) | 0.02 | 0.19 | –0.36 | 0.38 | –0.29 | 0.32 | ||
| Individual age at sample | 0.19 | 0.14 | –0.07 | 0.49 | –0.03 | 0.42 | ||
| LCMS method (old) | 0.17 | 0.31 | –0.41 | 0.82 | –0.31 | 0.69 | ||
| Community size | 0.06 | 0.09 | –0.13 | 0.24 | –0.1 | 0.21 | ||
| Sex ratio | 0.04 | 0.07 | –0.11 | 0.18 | –0.09 | 0.16 | ||
| Dominance rank | 0.04 | 0.08 | –0.12 | 0.19 | –0.09 | 0.17 | ||
| Sin(seasonDate) | –0.04 | 0.02 | –0.08 | 0 | –0.07 | 0 | ||
| Cos(seasonDate) | –0.01 | 0.02 | –0.05 | 0.03 | –0.04 | 0.03 | ||
| Orphan status (yes): time of the day | 0.02 | 0.04 | –0.05 | 0.1 | –0.04 | 0.09 | ||
| Orphan status (yes): time of the day2 | 0.01 | 0.04 | –0.08 | 0.09 | –0.06 | 0.08 | ||
| Orphan status (yes): time of the day3 | –0.03 | 0.08 | –0.18 | 0.13 | –0.15 | 0.1 | ||
| All adult male model reduced | Log urinary cortisol levels (ng/ml SG) | Intercept | 3.97 | 0.24 | 3.45 | 4.43 | 3.55 | 4.35 |
| Time of the day | –0.49 | 0.08 | –0.67 | –0.33 | –0.64 | –0.36 | ||
| Time of the day2 | –0.06 | 0.04 | –0.15 | 0.03 | –0.14 | 0.01 | ||
| Time of the day3 | 0.04 | 0.04 | –0.03 | 0.12 | –0.02 | 0.11 | ||
| Orphan status (yes, orphan) | 0.03 | 0.18 | –0.33 | 0.38 | –0.28 | 0.32 | ||
| Individual age at sample | 0.19 | 0.14 | –0.07 | 0.48 | –0.02 | 0.42 | ||
| LCMS method (old) | 0.17 | 0.3 | –0.41 | 0.8 | –0.3 | 0.68 | ||
| Community size | 0.05 | 0.09 | –0.13 | 0.24 | –0.1 | 0.21 | ||
| Sex ratio | 0.03 | 0.07 | –0.11 | 0.17 | –0.09 | 0.15 | ||
| Dominance rank | 0.04 | 0.08 | –0.12 | 0.19 | –0.09 | 0.17 | ||
| Sin(seasonDate) | –0.04 | 0.02 | –0.08 | 0 | –0.07 | 0 | ||
| Cos(seasonDate) | –0.01 | 0.02 | –0.05 | 0.03 | –0.04 | 0.03 |
Appendix 1—table 2
Results of the adult male orphan model testing, in orphan mature males only, the effect of age at maternal loss on cortisol profiles.
’Adult male orphan model full’ refers to the full model ran with all the interactions considered. ‘Adult male orphan model reduced’ refers to the reduced model after removing the interactions for which the 90% credible interval (CI) overlapped 0.SE indicates the standard error of the estimate for each predictor. The coded level for each categorical predictor is indicated in parentheses. Control predictors are italicized. 95% CI low and 95% CI high indicate the lower and upper limits of the 95% CI. Likewise, 90% CI low and 90% CI high indicate the lower and upper limits of the 90% CI. CIs that do not overlap 0 are indicated in bold. LCMS: liquid chromatography mass spectrometry. Time of the day2: quadratic term for time of the day. Time of the day3: cubic term for time of the day.
| Model | Response | Predictor | Estimate | SE | 95% CI low | 95% CI high | 90% CI low | 90% CI high |
|---|---|---|---|---|---|---|---|---|
| Adult male orphan full | Log urinary cortisol levels (ng/ml SG) | Intercept | 4.07 | 0.33 | 3.41 | 4.71 | 3.53 | 4.58 |
| Time of the day | –0.5 | 0.13 | –0.77 | –0.24 | –0.72 | –0.29 | ||
| Time of the day2 | –0.08 | 0.07 | –0.21 | 0.05 | –0.19 | 0.03 | ||
| Time of the day3 | 0.04 | 0.06 | –0.09 | 0.17 | –0.06 | 0.14 | ||
| Orphan’s age when mother died | –0.12 | 0.25 | –0.62 | 0.37 | –0.53 | 0.29 | ||
| Community size | 0.04 | 0.21 | –0.34 | 0.48 | –0.27 | 0.4 | ||
| Sex ratio | 0.02 | 0.17 | –0.31 | 0.34 | –0.25 | 0.29 | ||
| Dominance rank | –0.07 | 0.18 | –0.41 | 0.3 | –0.36 | 0.24 | ||
| Orphan’s age at sample | 0.43 | 0.37 | –0.23 | 1.24 | –0.12 | 1.08 | ||
| LCMS method (old) | 0.03 | 0.31 | –0.55 | 0.66 | –0.45 | 0.54 | ||
| Sin(seasonDate) | –0.01 | 0.03 | –0.08 | 0.05 | –0.07 | 0.04 | ||
| Cos(seasonDate) | –0.01 | 0.03 | –0.08 | 0.06 | –0.07 | 0.05 | ||
| Orphan’s age when mother died: time of the day | 0.03 | 0.07 | –0.11 | 0.18 | –0.09 | 0.04 | ||
| Orphan’s age when mother died: time of the day2 | 0.06 | 0.04 | –0.02 | 0.14 | –0.01 | 0.12 | ||
| Orphan’s age when mother died: time of the day3 | –0.02 | 0.04 | –0.11 | 0.06 | –0.09 | 0.15 | ||
| Adult male orphan reduced | Log urinary cortisol levels (ng/ml SG) | Time of the day | 4.07 | 0.33 | 3.43 | 4.72 | 3.55 | 4.6 |
| Time of the day2 | –0.51 | 0.13 | –0.77 | –0.26 | –0.72 | –0.3 | ||
| Time of the day3 | –0.07 | 0.07 | –0.21 | 0.06 | –0.19 | 0.04 | ||
| Orphan’s age when mother died | 0.04 | 0.06 | –0.08 | 0.17 | –0.05 | 0.14 | ||
| Community size | –0.08 | 0.25 | –0.59 | 0.41 | –0.5 | 0.33 | ||
| Sex ratio | 0.04 | 0.21 | –0.36 | 0.49 | –0.28 | 0.39 | ||
| Dominance rank | 0.02 | 0.17 | –0.33 | 0.33 | –0.27 | 0.28 | ||
| Orphan’s age at sample | –0.07 | 0.18 | –0.42 | 0.31 | –0.36 | 0.24 | ||
| LCMS method (old) | 0.43 | 0.38 | –0.24 | 1.26 | –0.12 | 1.09 | ||
| Sin(seasonDate) | 0.02 | 0.31 | –0.58 | 0.66 | –0.47 | 0.54 | ||
| Cos(seasonDate) | –0.01 | 0.03 | –0.08 | 0.06 | –0.07 | 0.05 | ||
| Time of the day | –0.01 | 0.03 | –0.08 | 0.06 | –0.07 | 0.04 |
Appendix 1—table 3
List of orphan immatures in the study and information about the adoption by adult individuals in the community.
| Identity | Sex | Community | Age when mother died (years) | Adopted?* | Duration of adoption* | No. of samples in the study | Age when sampled for the study |
|---|---|---|---|---|---|---|---|
| Beatrice | F | East | 4.9 | Yes | >3 years | 38 | 5.3–8.6 |
| Emma | F | East | 4.1 | Yes | >2 years | 17 | 4.1–6.1 |
| Eolos | M | East | 3.9 | Yes | >3 years | 7 | 7.0–7.3 |
| Erasmus | M | East | 8.7 | Unknown | 31 | 8.8–11.8 | |
| Fatima | F | East | 6.6 | Unknown | 8 | 7.8–10.1 | |
| Gia | F | East | 2.6 | Yes | 17 months | 8 | 10.6–11.9 |
| Maimouna | F | East | 4.7 | No | 20 | 6.7–8.9 | |
| Quarantine | F | East | 5.5 | Yes | >2 years | 4 | 7.6–7.9 |
| Richelieu | M | East | 5.4 | Unknown | 64 | 10.7–11.8 | |
| Willy | M | East | 10.5 | Unknown | 57 | 10.5–11.9 | |
| Baloo | F | South | 3.8 | yes | 1 year | 22 | 7.3–8.5 |
| Caramel | M | South | 7.3 | Unknown | 4 | 8.7 – 9.3 | |
| Mohan | F | South | 4.1 | Yes | 1.5 year | 34 | 4.1 – 6.5 |
| Oscar | M | South | 4.7 | Yes | >2 years | 49 | 8.1 – 11.9 |
| Wala | F | South | 4.9 | Unknown | 25 | 8.1 – 10.9 | |
| Roxane | F | North | 4.7 | Unknown | 4 | 10.5 – 11.3 | |
| Volta | F | North | 3.8 | Unknown | 3 | 10.7 – 10.7 |
-
*
Data taken from Samuni et al., 2019a.
Additional files
Download links
A two-part list of links to download the article, or parts of the article, in various formats.
Downloads (link to download the article as PDF)
Open citations (links to open the citations from this article in various online reference manager services)
Cite this article (links to download the citations from this article in formats compatible with various reference manager tools)
Early maternal loss leads to short- but not long-term effects on diurnal cortisol slopes in wild chimpanzees
eLife 10:e64134.
https://doi.org/10.7554/eLife.64134


