Three-dimensional biofilm colony growth supports a mutualism involving matrix and nutrient sharing
- Department of Bioengineering, Stanford University School of Medicine, United States
- Department of Cell and Tissue Biology, University of California San Francisco, United States
- Pharmaceutical Sciences Division, School of Pharmacy, University of Wisconsin-Madison, United States
- Great Lakes Bioenergy Research Center, Wisconsin Energy Institute, University of Wisconsin-Madison, United States
- Department of Bacteriology, University of Wisconsin-Madison, United States
- Department of Medical Microbiology and Immunology, University of Wisconsin-Madison, United States
- Department of Microbiology & Immunology, Stanford University School of Medicine, United States
- Chan Zuckerberg Biohub, United States
Figures
Figure 1 with 2 supplements
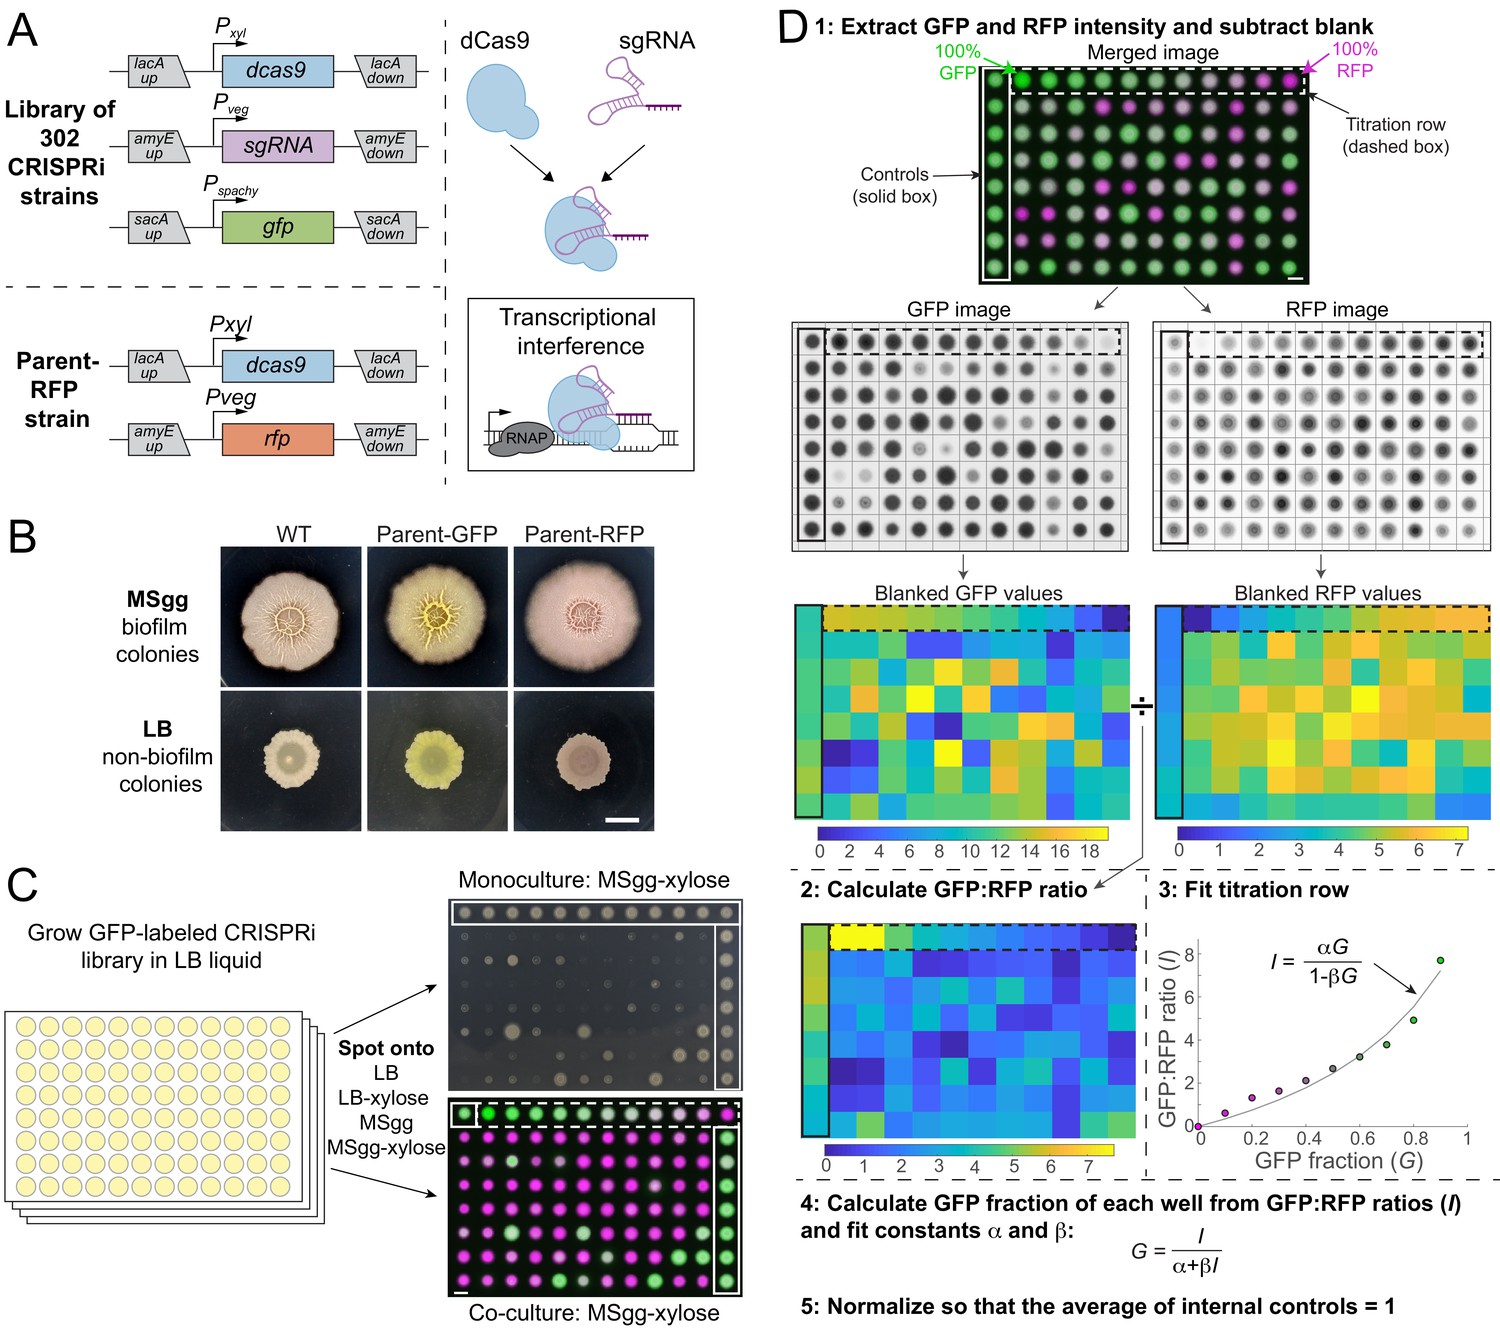
A high-throughput screening strategy to measure colony-based competition within bacterial colonies.
(A) We constructed a GFP-labeled library of CRISPR interference (CRISPRi) knockdowns of all known essential and conditionally essential genes (top left). In the library, the nuclease-deactivated Cas9 gene (dcas9) is inducible with xylose and the single-guide RNA (sgRNA) is constitutively expressed. dCas9 binds the sgRNA and blocks transcription by physically impeding RNA polymerase (right). Every strain is labeled with gfp expressed from the sacA locus. A parent strain (parent-RFP, bottom left) that expresses rfp as well as dCas9 without an sgRNA was used in competition assays. (B) The parent-GFP (sacA::gfp, lacA::dCas9) and parent-RFP strains have similar phenotypes to wild type on both biofilm-promoting MSgg agar and non-biofilm-promoting LB agar. Cultures were grown in liquid LB to an optical density (OD600) ~1, and then 1 µL was spotted in the middle of wells of a six-well plate containing LB agar or MSgg agar. Image intensities were adjusted identically; the yellow and red colors of the parent strains are due to GFP and RFP expression, respectively. Scale bar: 5 mm. (C) Schematic of screening strategy to measure the monoculture colony size and competitive fitness of each knockdown against the parent-RFP strain. GFP-labeled knockdown libraries were grown in liquid culture in 96-well microtiter plates. Monocultures were spotted onto LB and MSgg agar plates (top right) without or with xylose to achieve basal or full knockdown, respectively, of the targeted gene. The monoculture plates contained parent controls in wells along an outer column and row (solid box). Co-cultures of a 1:1 volumetric mixture of the parent-RFP and GFP-labeled library strains were spotted onto agar plates of LB and MSgg, without or with xylose. Controls in which parent-GFP was mixed with parent-RFP are bounded by horizontal red box. Bottom right: merged image of RFP and GFP signals from co-cultures. The co-cultures include a titration row from 100% GFP cultures to 100% RFP cultures in 10% increments (dashed box), and several controls of 1:1 mixtures of the parent GFP and parent-RFP strains (purple box). Scale bar: 5 mm. (D) Schematic of image analysis to quantify competitive fitnesses from the co-culture screen. Data from plate 1 spotted on MSgg is presented as an example. Plates were segmented and individual colony intensities were extracted from the GFP and RFP images. GFP intensities were divided by RFP intensities to obtain ratios I. The titration row (dashed box) was fit to a curve using the equation I=αG/(1−βG), where G is the fraction of the parent-GFP strain, to extract fit parameters α and β for each plate individually. These parameters were used to map the GFP fractions of each colony and values were normalized so that the parent-GFP:parent-RFP control co-cultures on each plate (solid box) had an average value of 1. Scale bar 5 mm.
Figure 1—figure supplement 1
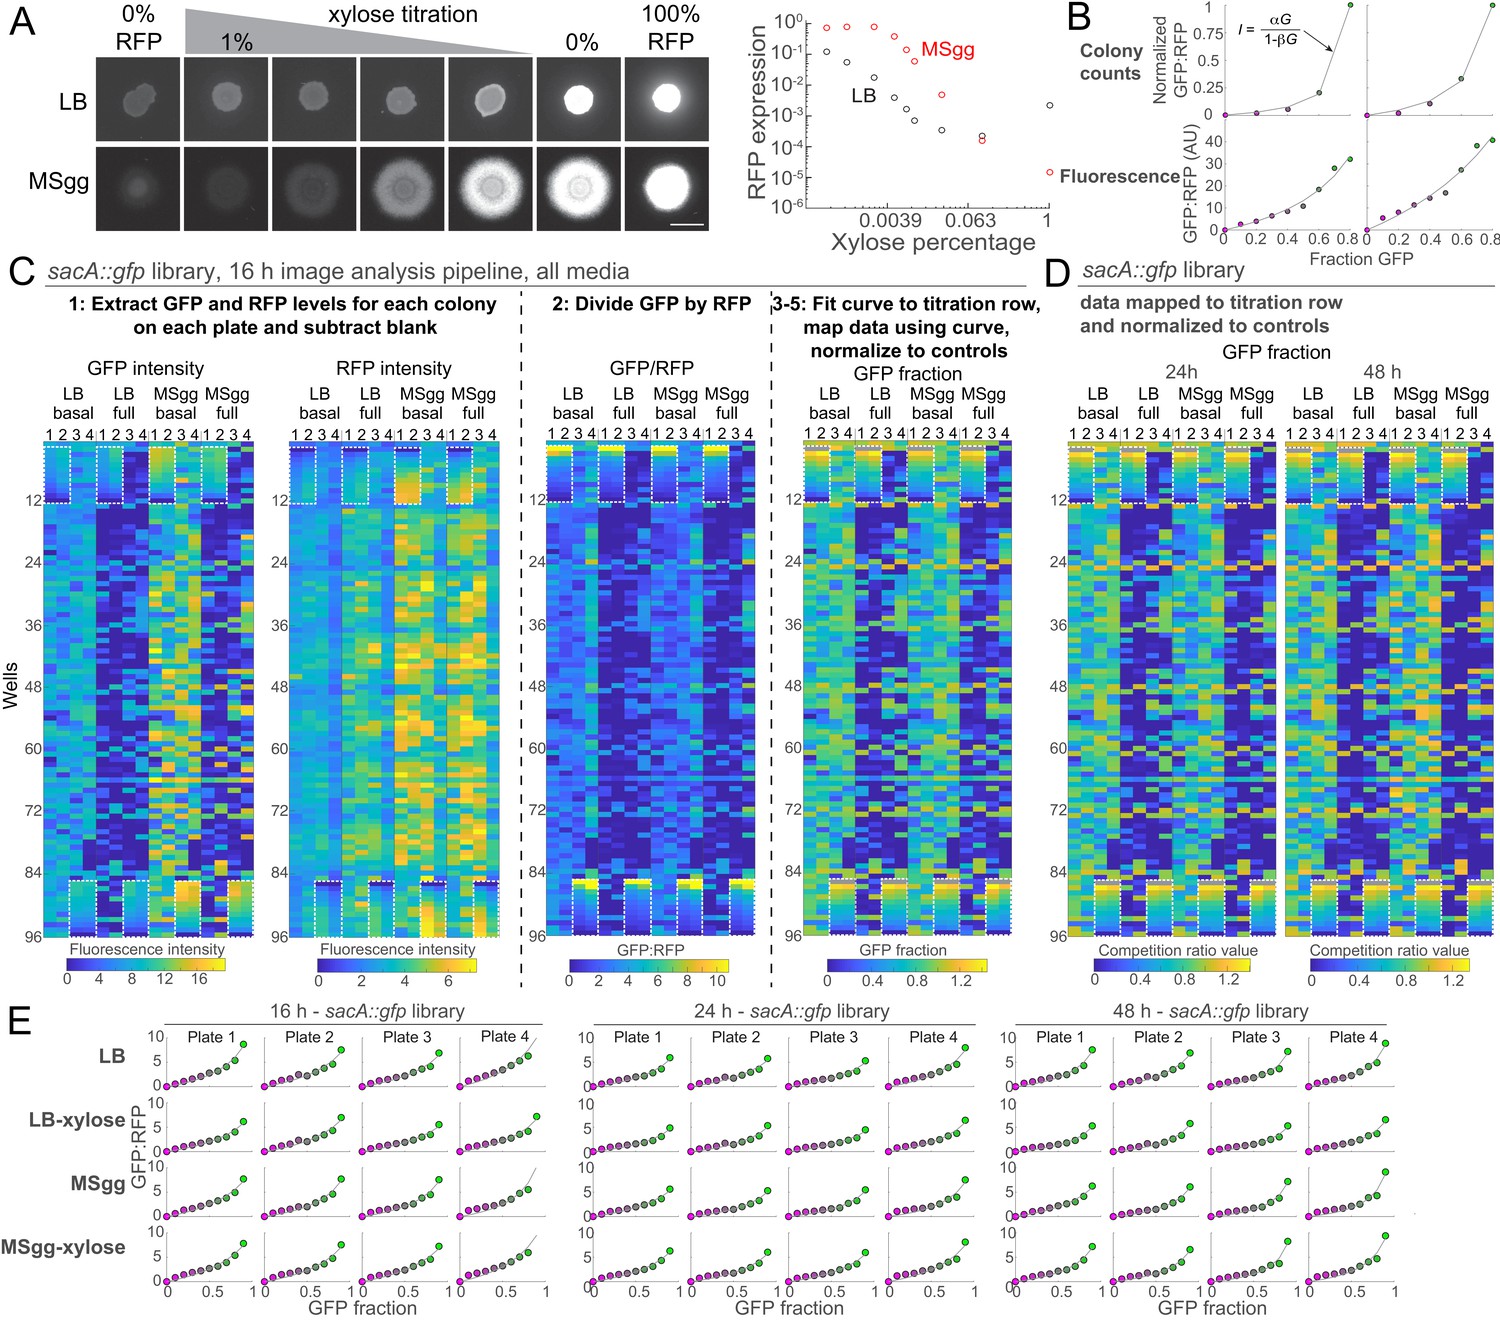
CRISPRi is an efficient tool for tunable knockdown of gene expression in non-biofilm and biofilm colonies, enabling high-throughput competition screens.
(A) Varying CRISPRi induction generates titrated gene expression in colonies on LB and on the biofilm-promoting medium MSgg. We spotted a strain with CRISPRi targeting rfp onto LB or MSgg agar plates with various amounts of xylose. Left: images were acquired after 24 hr of growth. Right: RFP levels varied inversely with xylose concentration, with basal repression minimally decreasing expression of RFP and higher levels of xylose repressing expression by 10- to 1000-fold in LB and ~10,000-fold in MSgg. Data were normalized to RFP levels in a strain without a CRISPRi sgRNA (100% RFP). Scale bar 5 mm. (B) Colony counts and fluorescence measurements of co-cultures both map well to the predicted ratio function. Top: parent-RFP and parent-GFP cultures were mixed in various fractions and spotted onto LB (left) or MSgg (right) agar plates. Colony count ratios were normalized to the value for GFP fraction of 0.8 to account for differences in parent-RFP and parent-GFP culture densities. Fluorescence and colony count ratios are shown as circles, and the predicted fitting function is shown as a gray line. (C) Competition data for the entire sacA::gfp library after 16 hr of growth at each step of the analysis pipeline. The titration row is denoted by white dashed boxes. The few gray boxes represent empty wells or wells that involved division by zero during processing and hence were ignored. (D) Competition data for the sacA::GFP library after 24 and 48 hr of growth. The titration row is denoted by white dashed boxes. The few gray boxes represent empty wells or wells that involved division by zero during processing and hence were ignored. (E) Data from the titration row of parent-GFP and parent-RFP co-cultures were well fit by the predicted equation I=αG/(1–βG) (red lines, Figure 1D). Circles show the ratio of GFP:RFP intensities of the 0–90% GFP (100–10% RFP) colonies plotted against the fraction of GFP for each plate of each library at each time point in B, C.
Figure 1—figure supplement 2

Images of plates from the competition screen with the sacA::GFP library.
Merged images from the competition screen on LB and MSgg agar under basal and full knockdown, at 16, 24, and 48 hr. The CRISPRi strains and parent-GFP controls are false-colored in green, and the parent-RFP is false-colored in magenta. The dashed boxes show the titration row of each plate, and the solid boxes show the parent-GFP + parent-RFP controls. The distance between the centers of neighboring colonies is 9 mm.
Figure 2 with 1 supplement
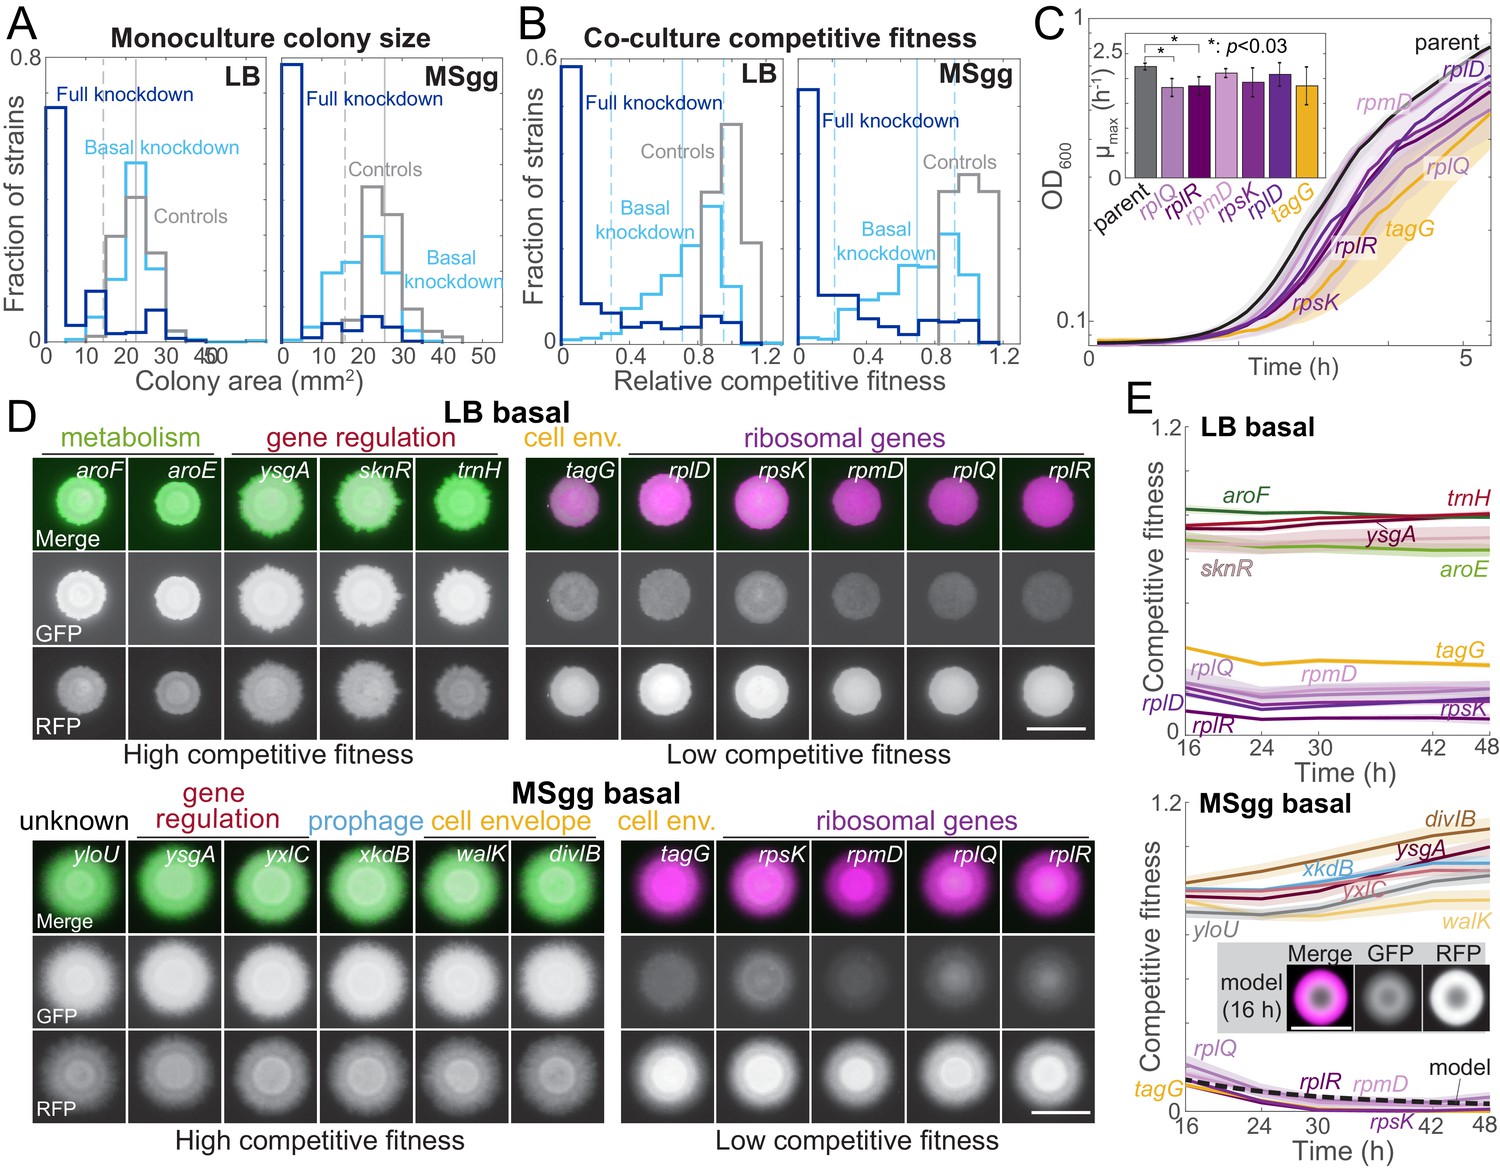
Growth on biofilm-promoting medium, increased knockdown, and competition against parent-RFP all broaden the distribution of fitnesses across the library.
(A) Basal knockdown (light blue) of essential genes on LB agar (which does not promote biofilms) resulted in similar colony sizes as parent-GFP controls (gray); only 13 of 302 colonies had a colony size two standard deviations below the mean of the controls. By contrast, on biofilm-promoting MSgg agar the distribution of colony sizes spread to smaller values, with 80 colonies more than two standard deviations below the mean of the controls. Full knockdown (dark blue) inhibited growth of most strains. Data are from measurements at 16 hr using the sacA::gfp library. Vertical solid lines are means of the control distributions, and dashed lines show two standard deviations below the mean. (B) 17 (LB) and 11 (MSgg) knockdown strains in the library competed poorly against the parent-RFP strain at basal knockdown (light blue), while 41 (LB) and 46 (MSgg) had competitive fitness similar to parent-GFP+parent-RFP controls (gray) even at full knockdown (dark blue). Data are from competition ratios at 16 hr using the sacA::gfp library. Low-fitness strains were defined as having fitness at least two standard deviations below the mean of the data, and neutral-fitness strains were defined as having fitness at least one standard deviation above the mean. Vertical solid lines are means of the distribution from basal knockdown, and dashed lines show two standard deviations below and one standard deviation above the mean. (C) Strains with low competitive fitness for basal knockdown generally had lower growth rates in liquid monoculture than parent control strains. Colonies were inoculated into liquid LB, and OD600 was monitored over time. Ribosome-related genes are shown in shades of purple, and a cell envelope-related gene (tagG) is shown in yellow. Curves are means, and shaded regions represent one standard deviation (n = 3). Inset: maximum growth rates. *: p<0.03, Student’s unpaired t-test with a Benjamini–Hochberg multiple-hypothesis correction. (D) On both LB and MSgg agar, basal knockdown of ygsA, which is involved in gene regulation, exhibited high competitive fitness (left) and tagG and ribosomal-gene knockdowns exhibited low competitive fitness (right). GFP (knockdown strain) is false-colored green, and RFP (parent) is false-colored magenta. Images are from 16 hr using the sacA::gfp library. Scale bar: 5 mm. (E) Competitive fitness of the strains with the highest and lowest values was approximately constant after 16 hr. Curves are means, and shaded regions represent one standard error of the mean (n = 3 independent measurements). Inset and dashed black line: a reaction-diffusion model of co-culture colony growth with physically realistic parameters indicates that knockdowns (magenta) with maximum growth rate 20% lower than the parent (green) reproduce the colony size (bottom, inset) and competitive fitness (bottom, dashed black line) of ribosomal protein knockdowns after 16 hr (Materials and methods, Figure 2—figure supplement 1C).
Figure 2—figure supplement 1
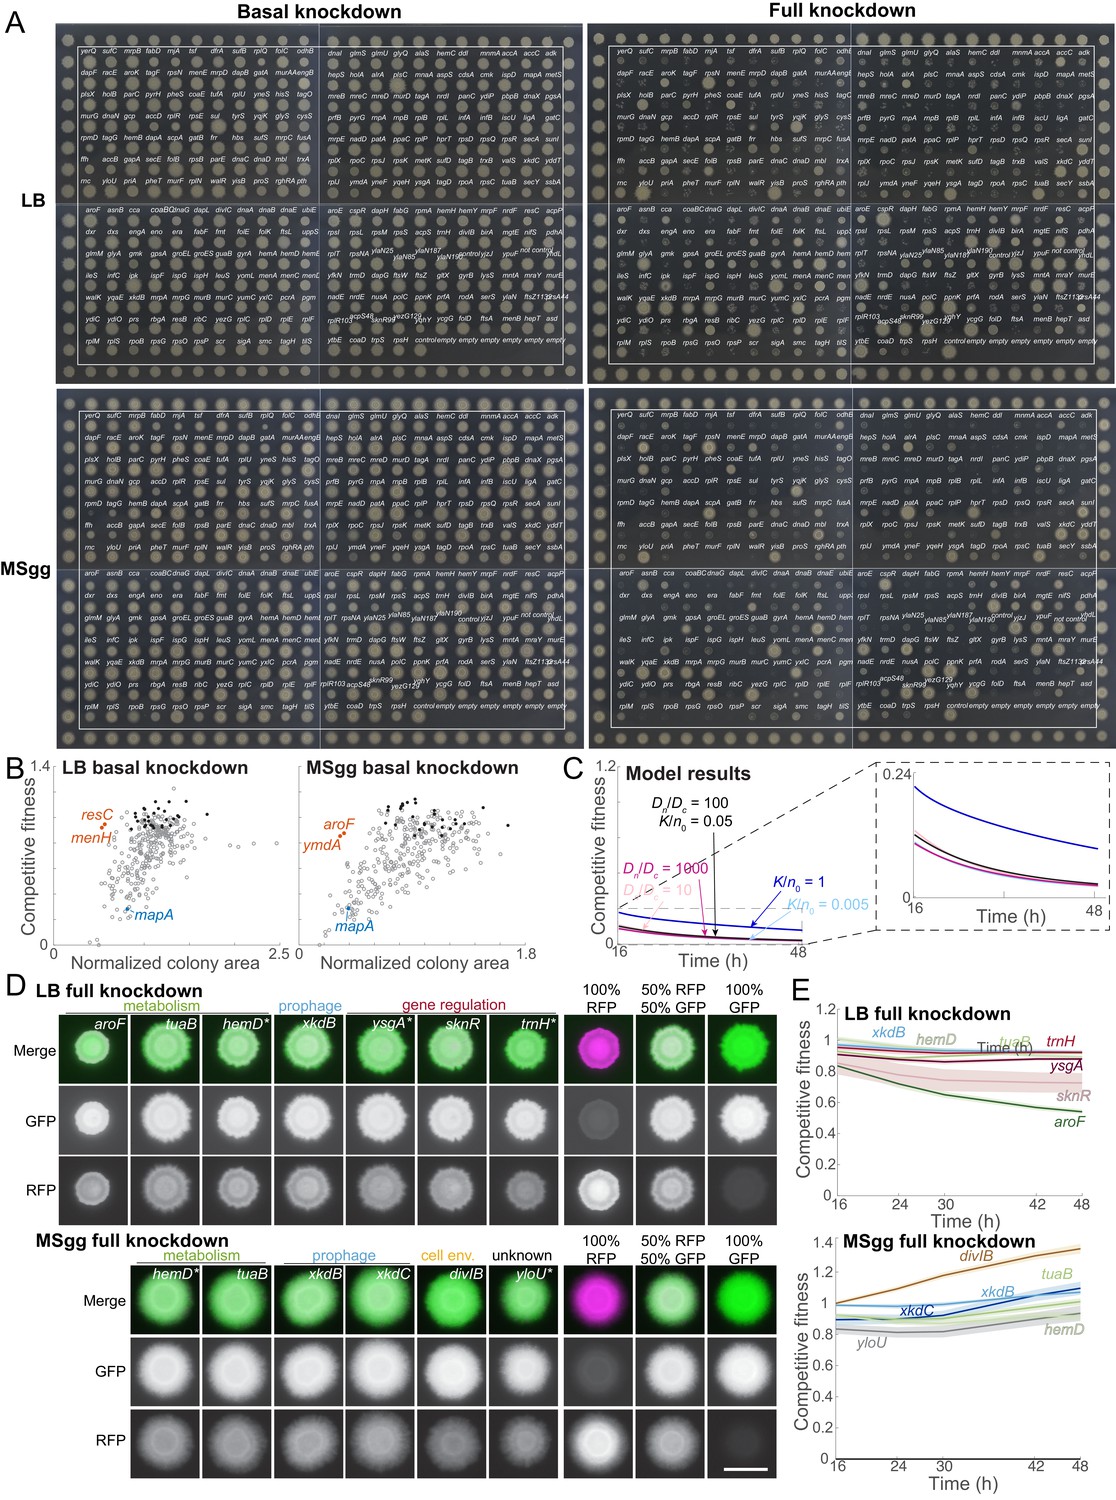
Monoculture colony size screen, and analysis of knockdowns with low and high competitive fitness.
(A) Monoculture colonies on MSgg agar (basal knockdown) exhibited more variation in size than monoculture colonies on LB agar after 16 hr of growth. With full knockdown, there were many monoculture colonies with small size relative to controls on LB and on MSgg after 16 hr. The CRISPRi library is within the white boxes, and colonies outside of the boxes are parent-GFP controls. The distance between the centers of neighboring colonies is 9 mm. Data for colony areas is in Supplementary file 2. (B) A few knockdowns exhibited high competitive fitness in co-culture despite having reduced colony sizes in monoculture in basal knockdown conditions (orange), and one non-essential gene knockdown in the library had reduced competitive fitness (blue). The rest of the strains are in gray, and the controls are in black. (C) A reaction-diffusion model of colony growth (Materials and methods) recapitulates competitive fitness when DC = 0.003 mm2 hr−1; competitive fitness is not strongly perturbed by 10-fold changes in K/n0 and Dn/DC. Parameters M1 = 0.0175 min−1, M1/M2 = 0.8, r0 = 1 mm, and C0/(n0/b)=0.001 are estimates from experimental data. The black line shows the simulated competitive fitness corresponding to the colony in the inset of Figure 2E in which both competitive fitness and colony size data were recapitulated with K/n0 = 0.05 and Dn/DC = 100. Competitive fitness was largely unchanged if Dn/DC = 1000 (dark pink, partly beneath black line) or Dn/DC = 10 (light pink, partly beneath black line), or if K/n0 = 1.0 (dark blue) or K/n0 = 0.005 (light blue, partly beneath dark pink line). (D) Strains that competed well at full knockdown included genes related to metabolism, gene regulation, prophage, and cell envelope (divIB), along with yloU, a gene of unknown function. Merged images show the parent-RFP false-colored in magenta and the knockdown strain false-colored in green. The 100% parent-RFP, 50% parent-RFP+50% parent-GFP, and 100% parent-GFP controls are shown to the right of the knockdowns. Scale bar: 5 mm. (E) Competitive fitnesses of the knockdowns with the highest fitness values at 16 hr were mostly stable over time with full CRISPRi induction. Curves are means, and shaded regions represent one standard error of the mean (n = 3 biological replicates).
Figure 3 with 1 supplement
Some media-specific differences in competitive fitness can be directly attributed to the nutrient composition of the media.
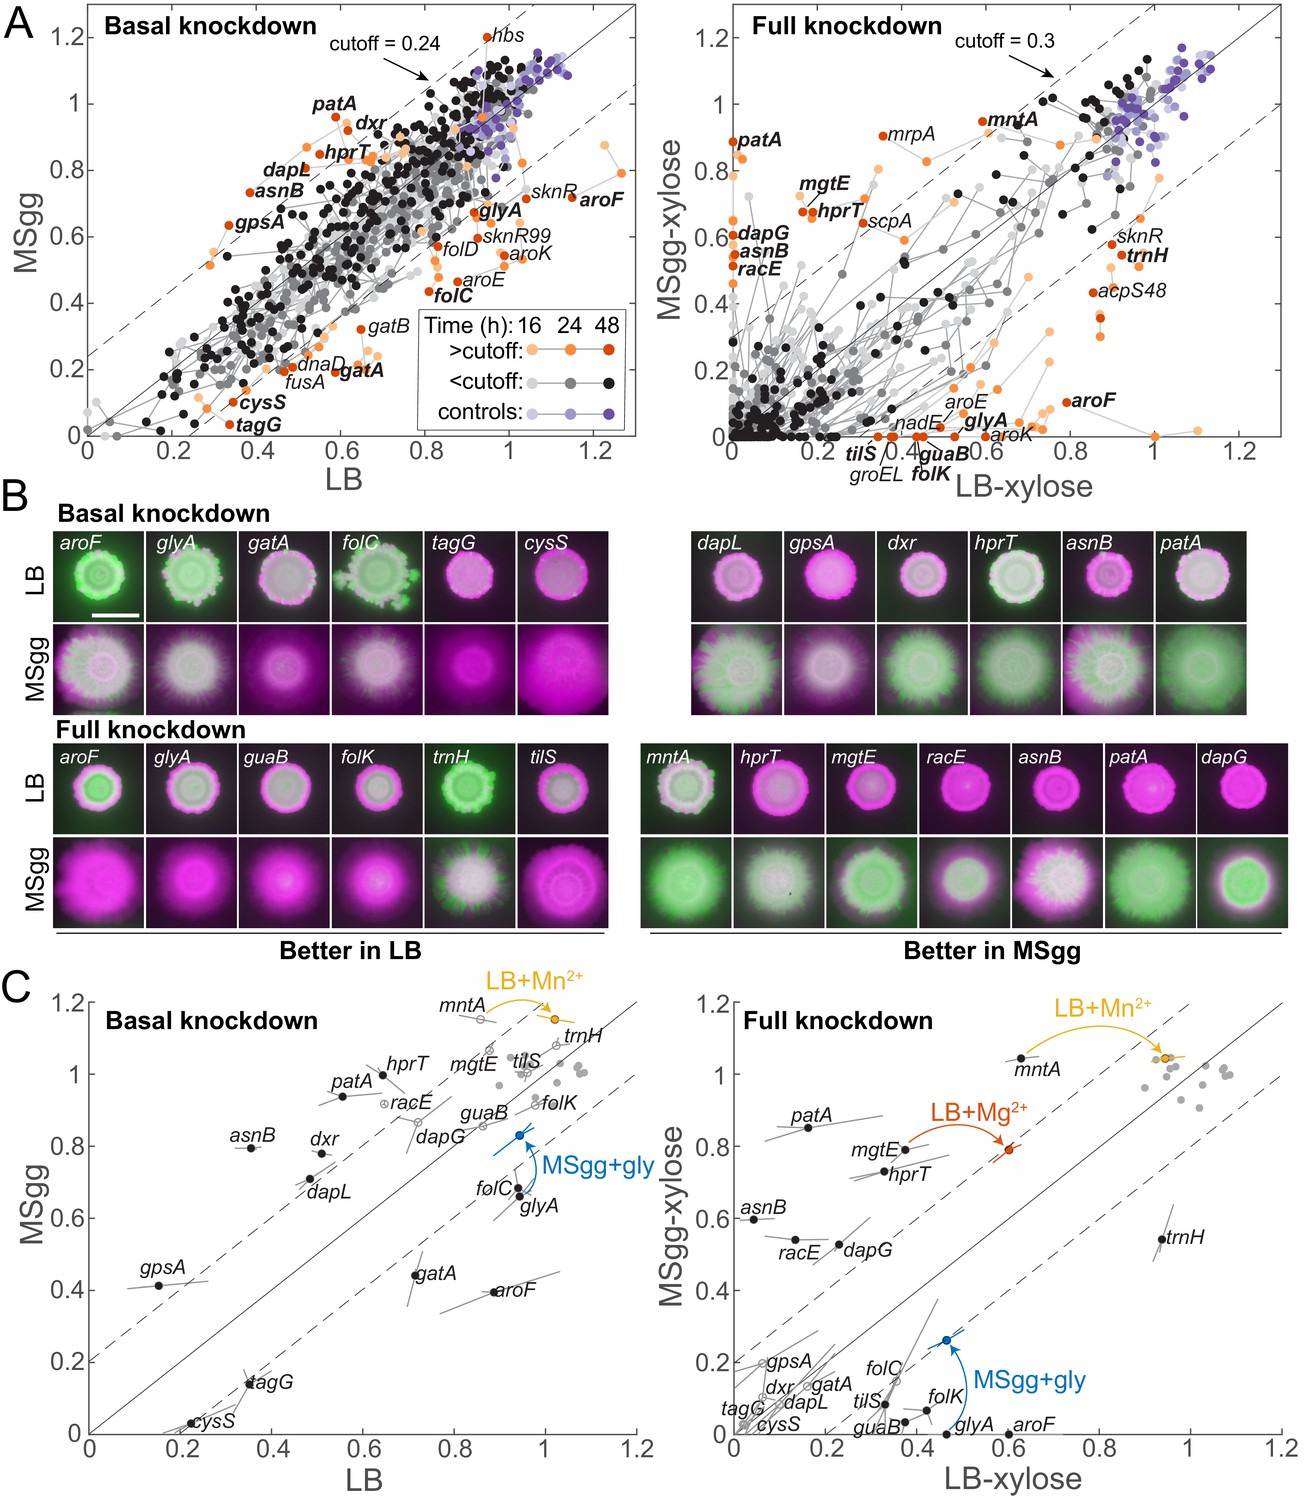
(A) Although most knockdowns had similar fitness on LB and MSgg agar, a subset of knockdowns had higher competitive fitness on LB agar than on MSgg agar, or vice versa. Genes with fitness difference >0.24 at 24 hr or >0.3 at 48 hr are annotated and colored in orange shades, while those below the cutoff are in grayscale and parent-RFP+parent-GFP co-culture controls are in shades of purple. Genes labeled in bold were selected for follow-up studies. Data are from the sacA::gfp library at 16, 24, and 48 hr. The solid line is y=x, and the dotted lines represent the chosen cutoff. (B) Images of colonies of the bolded genes in A after 48 hr that illustrate the differential competitive fitness between LB and MSgg. Green and magenta represent fluorescence from the gene knockdown and parent, respectively. Scale bar: 5 mm. (C) Addition of specific nutrients to the medium with lower competitive fitness rescued fitness for the mntA, glyA, and mgtE knockdowns. Means (circles) of triplicates (shown at the end of lines extending from the circle) are displayed. Filled black circles represent gene knockdowns that had substantially different competitive fitness in LB and MSgg. Open gray circles represent other genes tested that were not identified as different in that condition. Parent-RFP+parent-GFP controls are shown as gray filled circles. Data from addition experiments (LB+manganese, LB+magnesium, and MSgg+glycine for mntA, mgtE, and glyA, respectively) are shown as colored circles and lines at the ends of arrows. All changes marked with arrows are significant after correcting for multiple hypotheses with the Benjamini–Hochberg method (p<0.01, Student’s unpaired t-test). Genes without a colored circle and arrow indicate that the fitness of that knockdown did not change upon addition of any of the nutrients tested (Figure 3—figure supplement 1).
Figure 3—figure supplement 1
Many nutrients do not impact the competitive fitness of knockdowns with different phenotypes between MSgg agar and LB agar.
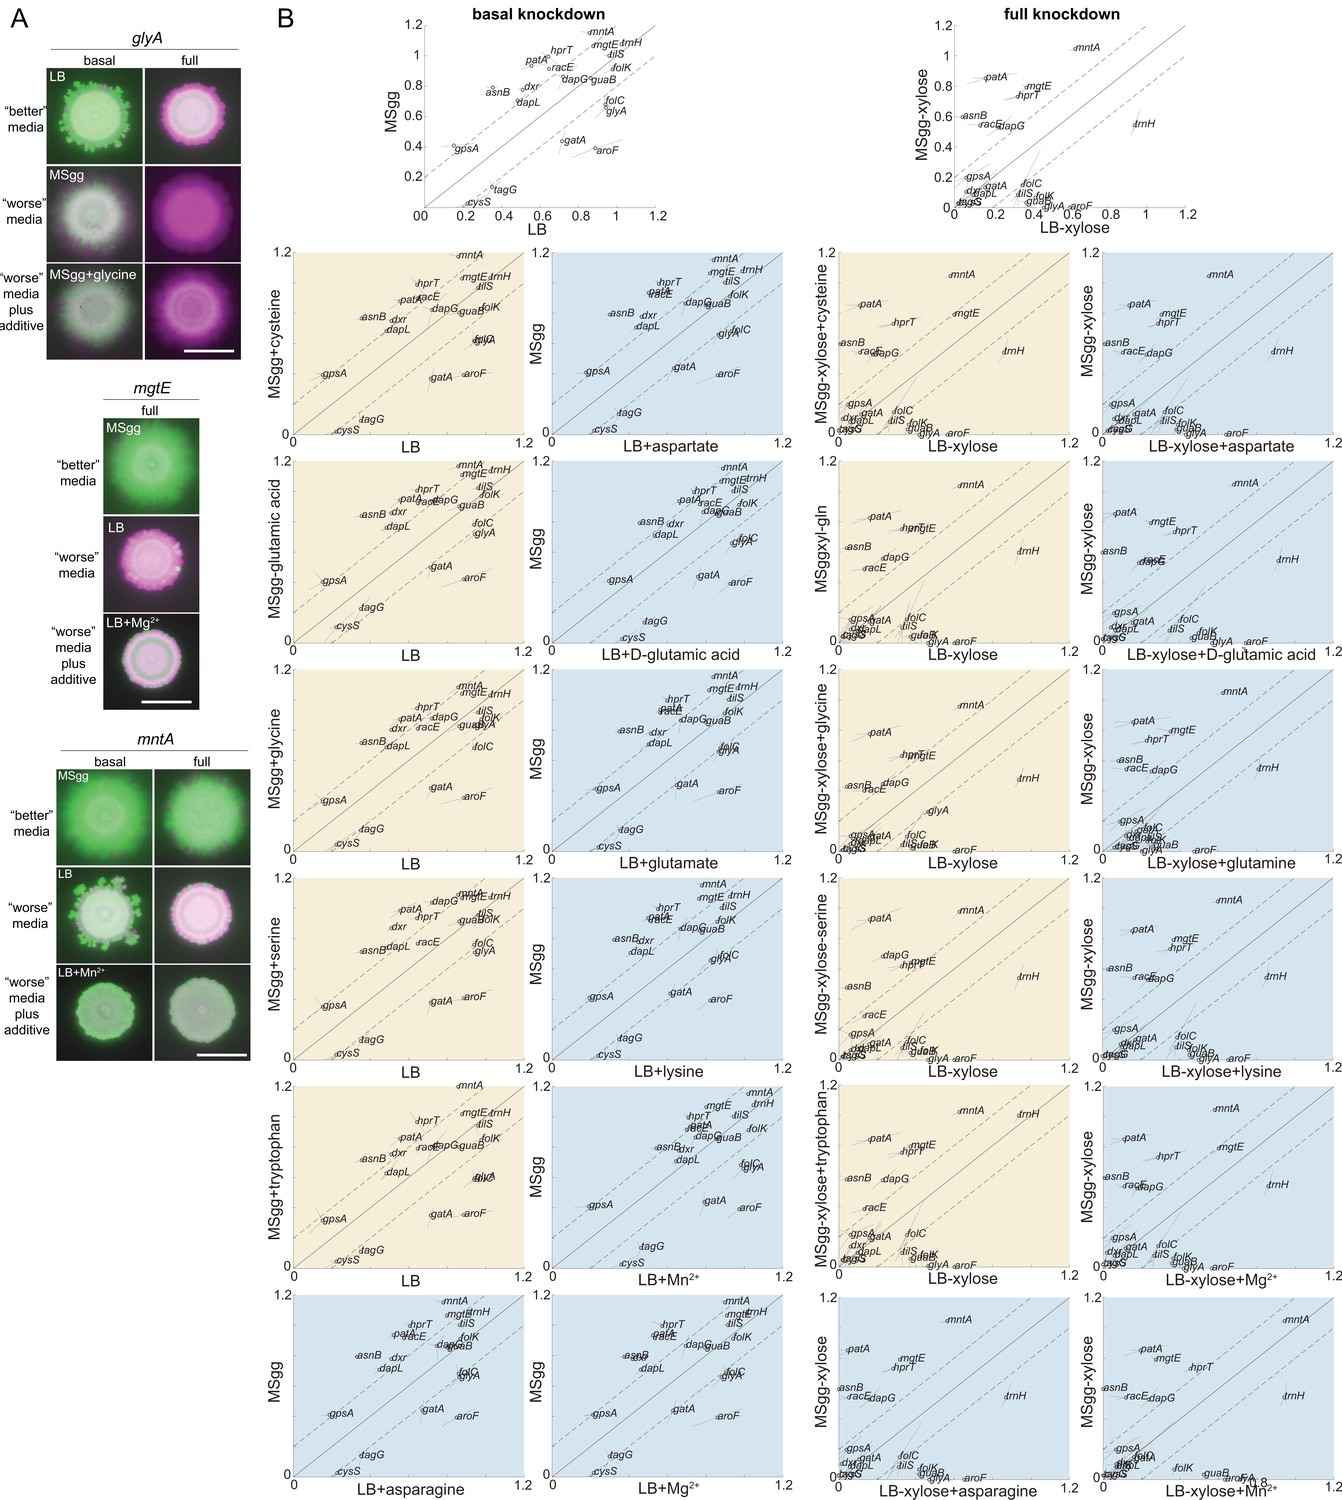
(A) The competitive fitness of glyA, mgtE, and mntA knockdowns improved when glycine was added to MSgg agar, Mg2+ was added to LB agar, or Mn2+ was added to MSgg agar, respectively. Images are merges of fluorescence from the knockdown (false-colored in green) and the parent-RFP (false-colored in magenta) after 48 hr. Scale bar: 5 mm. (B) Many nutrients did not alter competitive fitness. Baseline competitive fitness values (top row) versus when a nutrient was added to MSgg agar (yellow) or LB agar (blue). Means are displayed as black circles, with each replicate at the end of lines extending from the circle. Data are from the 48 hr time point.
Figure 4 with 1 supplement

Full knockdown of alrA is rescued by D-alanine nutrient sharing in a biofilm colony, but not in liquid culture.
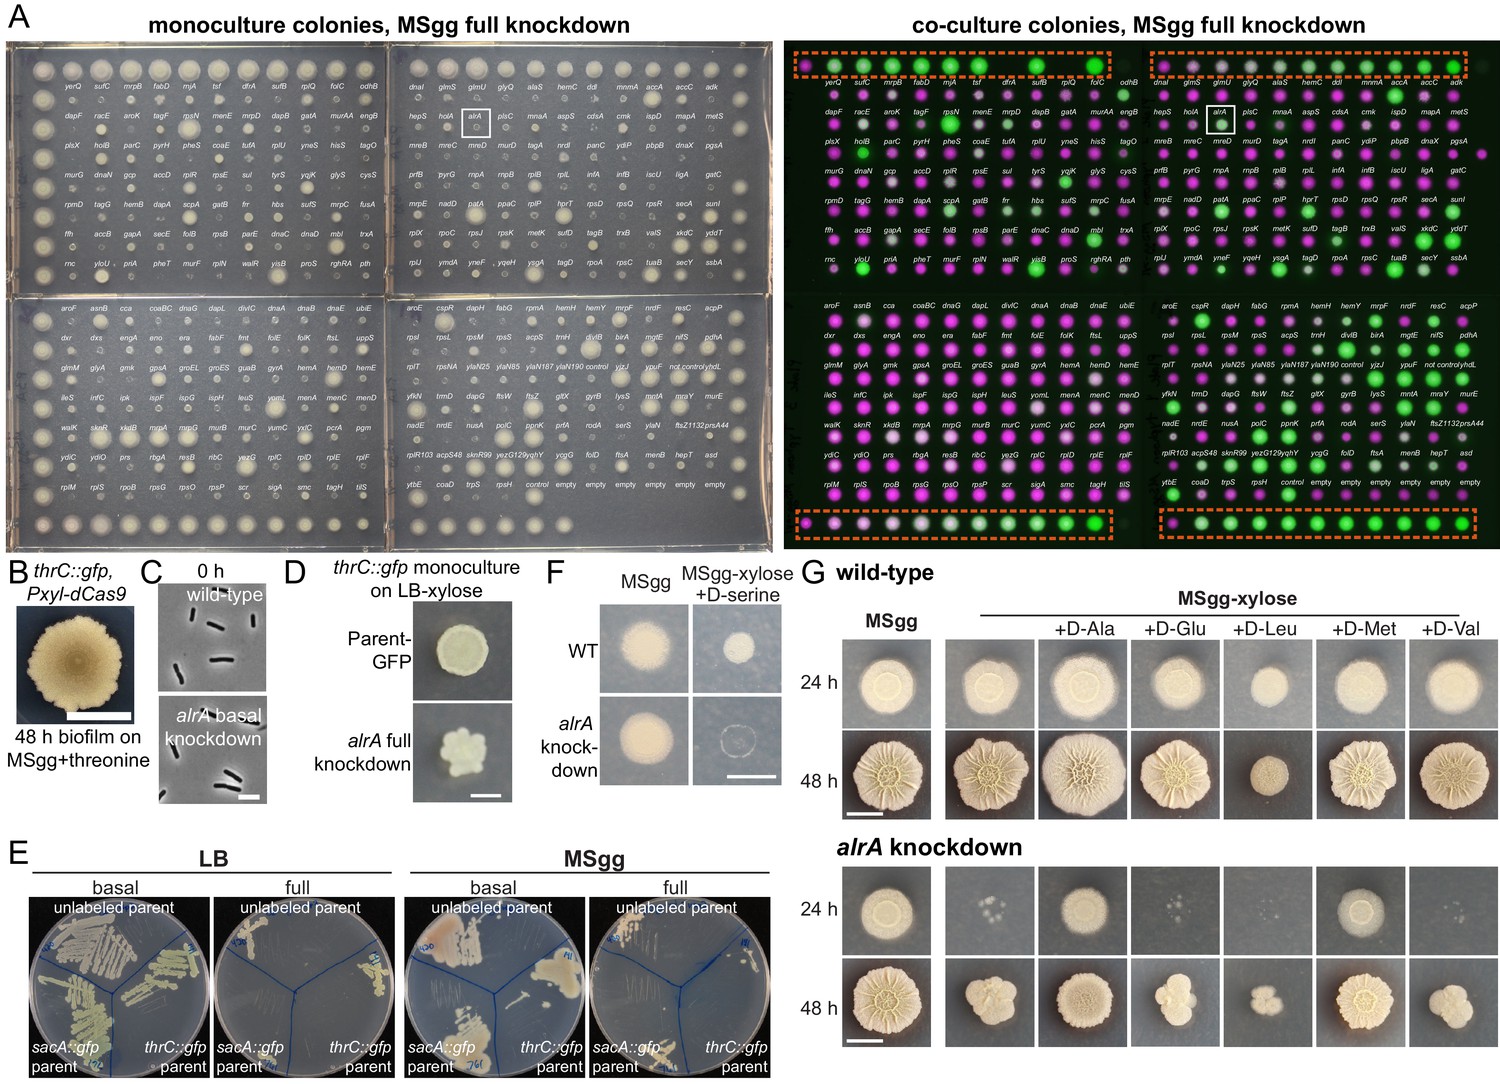
(A) Left: the sacA::gfp alrA knockdown under full knockdown was rescued by growth with the parent-RFP strain under biofilm-promoting conditions (MSgg-xylose agar). The alrA knockdown expanded beyond the boundaries of the original inoculum (dashed circle) when grown in co-culture with the parent-RFP strain. Right: the control co-culture of parent-RFP with parent-GFP preserved both strains at approximately equal proportions. Images were acquired at 24 hr. In merged images, GFP from the alrA knockdown is false-colored green and RFP from the parent-RFP strain is false-colored magenta. Scale bar: 5 mm. (B) AlrA is a racemase that converts L-alanine to D-alanine. D-alanine is critical for cell wall cross-linking. (C) Full knockdown of alrA caused cells to bulge, signifying cell wall defects. Cells were cultured for 6 hr in liquid MSgg with xylose to fully inhibit alrA expression. Arrowheads indicate bulging cells. Scale bar: 5 μm. (D) Full knockdown of alrA was rescued by exogenous D-alanine. Cultures were grown in liquid LB to an OD600 ~1 and then 1 μL was spotted on MSgg xylose agar alone or supplemented with 0.04 mg/mL D-alanine or D-methionine. Cells from alrA monocultures mostly died (left); the small colonies represent suppressors present in the initial inoculum. By contrast, addition of D-alanine (middle) or D-methionine (right) resulted in comparable growth to wild type. Images are of an unlabeled alrA knockdown (HA420) and were acquired after 24 hr of growth. Scale bar: 5 mm. (E) Full knockdown of alrA was not rescued when co-cultured with the parent-RFP strain in liquid. For the co-culture, parent and alrA knockdown cultures were mixed 1:1 and back-diluted 1:100 into liquid MSgg with xylose to fully deplete alrA. For the alrA knockdown monoculture, the culture was diluted 1:200 into liquid MSgg with xylose so that the starting inoculum of the alrA strain was equivalent to that of the co-culture. CFU/mL of the alrA knockdown were not significantly different between the monoculture (dark red) and co-culture (gray) throughout the course of the experiment (p-values from each time point range from 0.21 to 0.66, student’s unpaired t-test). The black line is the total CFU/mL of the parent/alrA knockdown co-culture. n = 3, error bars represent one standard error of the mean.
Figure 4—figure supplement 1
Under full knockdown, the alrA knockdown dies as a monoculture colony but grows when co-cultured with the wild-type-like parent.
(A) A screen under full CRISPRi knockdown for strains that die as monoculture colonies (left) but survive in co-culture (right) highlighted alrA (white box). Left: monoculture colonies of the thrC::gfp library on MSgg-xylose; outer colonies are thrC::gfp parent controls. Right: merged images of co-cultures of the thrC::gfp CRISPRi library (false-colored in green) with the parent-RFP strain (false-colored in magenta). The titration row is indicated by the box. The distance between the centers of two neighboring colonies is 9 mm. (B) The thrC::gfp parent strain did not form wrinkles. One microliter of an LB liquid culture (OD600 ~1) was spotted onto an MSgg-threonine plate and incubated at 30°C for 48 hr. Scale bar: 5 mm. (C) Cells with basal knockdown of alrA are rod-shaped, similar to wild type. Images were taken directly before adding xylose to fully deplete cells of alrA for 6 hr, as shown in Figure 4C. Scale bar: 5 μm. (D) Full knockdown of alrA in the thrC::gfp background resulted in petal-like outward projections from the initial spot on LB-xylose agar. The parent-GFP is shown for comparison. Scale bar: 2 mm. (E) Full knockdown of alrA resulted in a growth defect. Cultures were grown and struck onto LB and MSgg plates with and without xylose to qualitatively observe growth under basal and full knockdown. A standard (100 mm) cell culture dish is shown. (F) D-serine inhibited the growth of wild-type colonies and did not rescue growth of the alrA knockdown. The colony was imaged through agar (to avoid having the objective contact the colony) after 24 hr. D-serine was supplemented at 0.04 mg/mL. Scale bar: 5 mm. (G) Most D-amino acids did not restore the growth of alrA-depleted cells. D-leucine inhibited the growth of wild-type colonies (top). Only D-alanine and D-methionine restored growth of full alrA knockdown (bottom). D-amino acids were supplemented at 0.04 mg/mL. We did not test D-isoleucine, D-phenylalanine, D-threonine, or D-tyrosine. Scale bar: 5 mm.
Figure 5 with 1 supplement
Mutualisms emerge when a nutrient-deficient mutant is the sole provider of extracellular matrix.
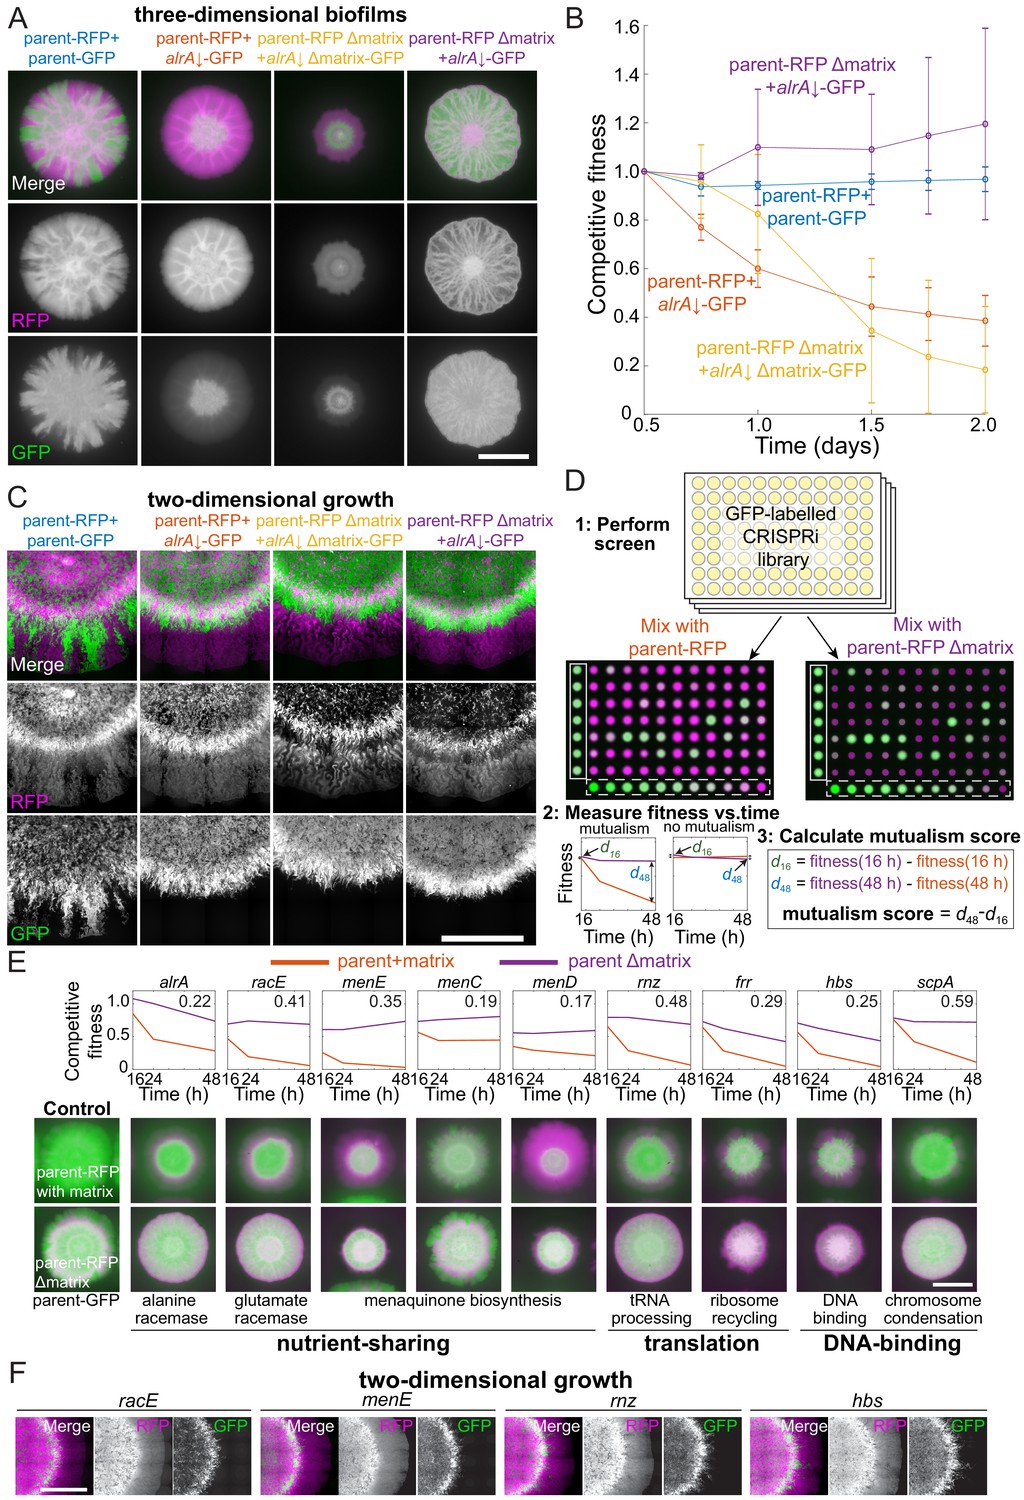
(A) Extracellular matrix is not required for alrA rescue (third column), and rescue is enhanced when the alrA full knockdown is combined with a matrix-deficient parent strain (fourth column). In the left column, the parent-GFP strain is false-colored in green, and in the other columns the alrA knockdown strain is green. The parent-RFP strain is false-colored in magenta. In the first two columns, both strains express matrix proteins. In the third column, both strains lack epsH and tasA, which encode key matrix components. In the fourth column, epsH and tasA are deleted from the parent-RFP strain while the alrA knockdown produces matrix. Images were acquired after 48 hr of growth. Scale bar: 5 mm. (B) Competitive fitness of the alrA full knockdown decreased over time when both strains or neither produced matrix, while fitness remained 1 (equal proportions of the two strains) and stable over time in co-cultures when the parent was matrix-deficient. The matrix-deficient parent-RFP+alrA knockdown (purple) and the parent-RFP+parent-GFP control (blue) data were not significantly different (p>0.2 at all time points); nor were the parent-RFP+alrA knockdown (orange) and the matrix-deficient parent-RFP+matrix-deficient alrA knockdown (yellow) data (p>0.07, Student’s t-test). The matrix-deficient parent-RFP+alrA knockdown (purple) fitness data were significantly higher than the parent-RFP+alrA knockdown (orange) at all time points after 0.5 days (p<0.014). Data were normalized to fitness at 0.5 days. Curves are means, and error bars represent one standard deviation (n = 2–3 biological replicates). Statistical analysis: Student’s unpaired t-test with a Benjamini–Hochberg multiple-hypothesis correction. (C) Cells with full knockdown of alrA were outcompeted by the parent-RFP strain during two-dimensional growth. Co-cultures were spotted on a MSgg-xylose agar pad and limited to growth in a layer with thickness one cell by applying a cover slip over the cells. Images were acquired after 24 hr of growth. Scale bar: 0.4 mm. (D) Design of screen to identify mutants that exhibit an increase in fitness when co-cultured with a matrix-deficient parent on MSgg-xylose agar. The sacA::gfp library was used in this screen; plate 3 from the 16 hr time point is shown. The distance between the centers of each colony is 9 mm. White box, controls; white dashed box, titration row. (E) Full knockdowns that exhibited mutualism generally involve genes related to nutrient sharing, translation, and DNA binding. Top: competitive fitness of co-cultures with the wild-type parent-RFP (purple) and matrix production-deficient parent (red) at 16, 24, and 48 hr. Numbers in the top right indicate the mutualism score. Bottom: merged images of biofilm colony co-cultures on MSgg-xylose agar at 48 hr. Scale bar: 5 mm. (F) Full knockdowns that exhibited mutualism in three-dimensional biofilm colonies were outcompeted by the matrix-deficient parent-RFP strain when growth was limited to two dimensions as in C. Images were acquired after 24 hr of growth. Scale bar: 0.4 mm. For (A, C–F), GFP is false-colored in green and RFP is false-colored in magenta.
Figure 5—figure supplement 1

A mutualism screen reveals full knockdowns with improved growth in co-culture when the parent is deficient in production of extracellular matrix.
(A) The matrix-deficient parent-RFP+matrix-proficient parent-GFP co-culture did not form sectors in a three-dimensional colony (left), but did at the edge of a two-dimensional colony (right). Merges show the parent-GFP and parent-RFP strains false-colored in green and magenta, respectively. Left scale bar: 5 mm; right scale bar: 0.4 mm. (B) The leading edge of a co-culture grown between agar and a coverslip is one cell thick. One microliter of cell culture was spotted onto an MSgg agar pad, and a coverslip was applied to limit growth to two dimensions. The culture was incubated for 24 hr, and the colony edge was imaged. Scale bar: 50 μm. (C) Results from a mutualism screen comparing the competitive fitness of knockdown strains co-cultured with a matrix-proficient (left) or matrix-deficient (right) parent. Control parent-RFP+parent-GFP co-cultures are located on the right and left edges of the library, and the titration row is shown on the top and bottom rows. The distance between the centers of neighboring colonies is 9 mm. GFP (from parent-GFP or knockdown strains) and RFP (from parent-RFP) fluorescence signals are false-colored in green and magenta, respectively. (D) The library exhibited a wide range of mutualism scores, with 11 full knockdowns exhibiting a mutualism score >2 standard deviations higher than the mean across all strains (>0.22). The library is shown in blue, and controls are shown in gray. (E) Representative controls of the parent-RFP strain grown with the parent-GFP strain showing the final composition of RFP and GFP in the colonies. In merged images, the parent-RFP and parent-GFP are false-colored in magenta and green, respectively. These controls are from the mutualism screen at 48 hr (and are the same as the controls shown in Figure 5E). (F) Five non-essential gene knockdowns exhibited mutualism. Top: competitive fitness of co-cultures with the wild-type-like parent-RFP (magenta) and the matrix production-deficient parent (red) at 16, 24, and 48 hr. Numbers in top right indicate the mutualism score. Bottom: merged images of biofilm colony co-cultures on MSgg-xylose agar at 48 hr. Scale bar: 5 mm.
Tables
Key resources table
| Reagent type (species) or resource | Designation | Source or reference | Identifiers | Additional information |
|---|---|---|---|---|
| Strain, strain background (Bacillus subtilis) | Bacillus subtilis strain NCIB 3610 | Daniel B. Kearns laboratory | NCIB 3610 or 3610 | trpC+, rapP+, sfp+, epsC+,swrA+, degQ+, pBS32 |
| Strain, strain background (Bacillus subtilis) | Parent-RFP | This work | HA12 | Genotypes listed in table S1 |
| Strain, strain background (Bacillus subtilis) | Parent-GFP (sacA) | This work | HA773 | Genotypes listed in table S1 |
| Strain, strain background (Bacillus subtilis) | sacA::gfp CRISPRi library | This work | See table S1 | Genotypes listed in table S1 |
| Strain, strain background (Bacillus subtilis) | Parent-GFP (thrC) | This work | HA49 | Genotypes listed in table S1 |
| Strain, strain background (Bacillus subtilis) | thrC::gfp CRISPRi library | This work | See table S1 | Genotypes listed in table S1 |
| Strain, strain background (Bacillus subtilis) | rfp CRISPRi knockdown | This work | HA13 | Genotypes listed in table S1 |
| Strain, strain background (Bacillus subtilis) | alrA CRISPRi knockdown | This work | HA420 | Genotypes listed in table S1 |
| Strain, strain background (Bacillus subtilis) | alrA CRISPRi knockdown Δmatrix | This work | HA827 | Genotypes listed in table S1 |
| Strain, strain background (Bacillus subtilis) | Parent-RFP Δmatrix | This work | HA825 | Genotypes listed in table S1 |
| Genetic reagent (SPP1 phage) | SPP1 phage | Daniel B. Kearns laboratory | ||
| Recombinant DNA reagent | pDG1731-gfp | This work | Pveg-sfGFP in a thrC integration construct | |
| Recombinant DNA reagent | pDG1731 | Bacillus genetic stock center | ||
| Sequence-based reagent | sfGFP fw | This work | tcctagaagcttatcgaattcCTTATTAACGTTGATATAATTTAAATTTTATTTGACAAAAATGGGCTCGTGTTGTACAATAAATGTAACTACTAGTACATAAGGAGGAACTACTATGAGCAAAGGAGAAGAACTTTTC | |
| Sequence-based reagent | sfGFP rev | This work | ttaagcaccggtttattaTTTGTAGAGCTCATCCATGCC | |
| Chemical compound, drug | LB lennox medium | RPI | L24066-1000.0 | |
| Software, algorithm | Matlab | MathWorks | R2018a | Some scripts were written in earlier versions of Matlab, but all are compatible with R2018a |
| Software, algorithm | Adobe Photoshop | Adobe, Inc | CS6 | |
| Software, algorithm | FIJI | ImageJ | 2.0.0-rc-44/1.50e | |
| Software, algorithm | DAVID functional annotation tool | https://david.ncifcrf.gov | ||
| Software, algorithm | Custom scripts for growth and image analysis | This work | Data Dryad: doi:10.5061/dryad.79cnp5htm |
Additional files
-
Supplementary file 1
Strains used in this study.
- https://cdn.elifesciences.org/articles/64145/elife-64145-supp1-v3.xlsx
-
Supplementary file 2
All data from systems-level competitive fitness screens.
- https://cdn.elifesciences.org/articles/64145/elife-64145-supp2-v3.xlsx
-
Supplementary file 3
Gene knockdowns that have different competitive fitness in LB versus MSgg.
- https://cdn.elifesciences.org/articles/64145/elife-64145-supp3-v3.xlsx
-
Supplementary file 4
Competitive fitness data of select gene knockdowns with media additives.
- https://cdn.elifesciences.org/articles/64145/elife-64145-supp4-v3.xlsx
-
Supplementary file 5
A list of gene knockdowns that display mutualism.
- https://cdn.elifesciences.org/articles/64145/elife-64145-supp5-v3.xlsx
-
Transparent reporting form
- https://cdn.elifesciences.org/articles/64145/elife-64145-transrepform-v3.docx
Download links
A two-part list of links to download the article, or parts of the article, in various formats.
Downloads (link to download the article as PDF)
Open citations (links to open the citations from this article in various online reference manager services)
Cite this article (links to download the citations from this article in formats compatible with various reference manager tools)
Three-dimensional biofilm colony growth supports a mutualism involving matrix and nutrient sharing
eLife 10:e64145.
https://doi.org/10.7554/eLife.64145


