Confinement discerns swarmers from planktonic bacteria
- Department of Physics, Brown University, United States
- Department of Medicine, Albert Einstein College of Medicine, United States
Figures
Figure 1
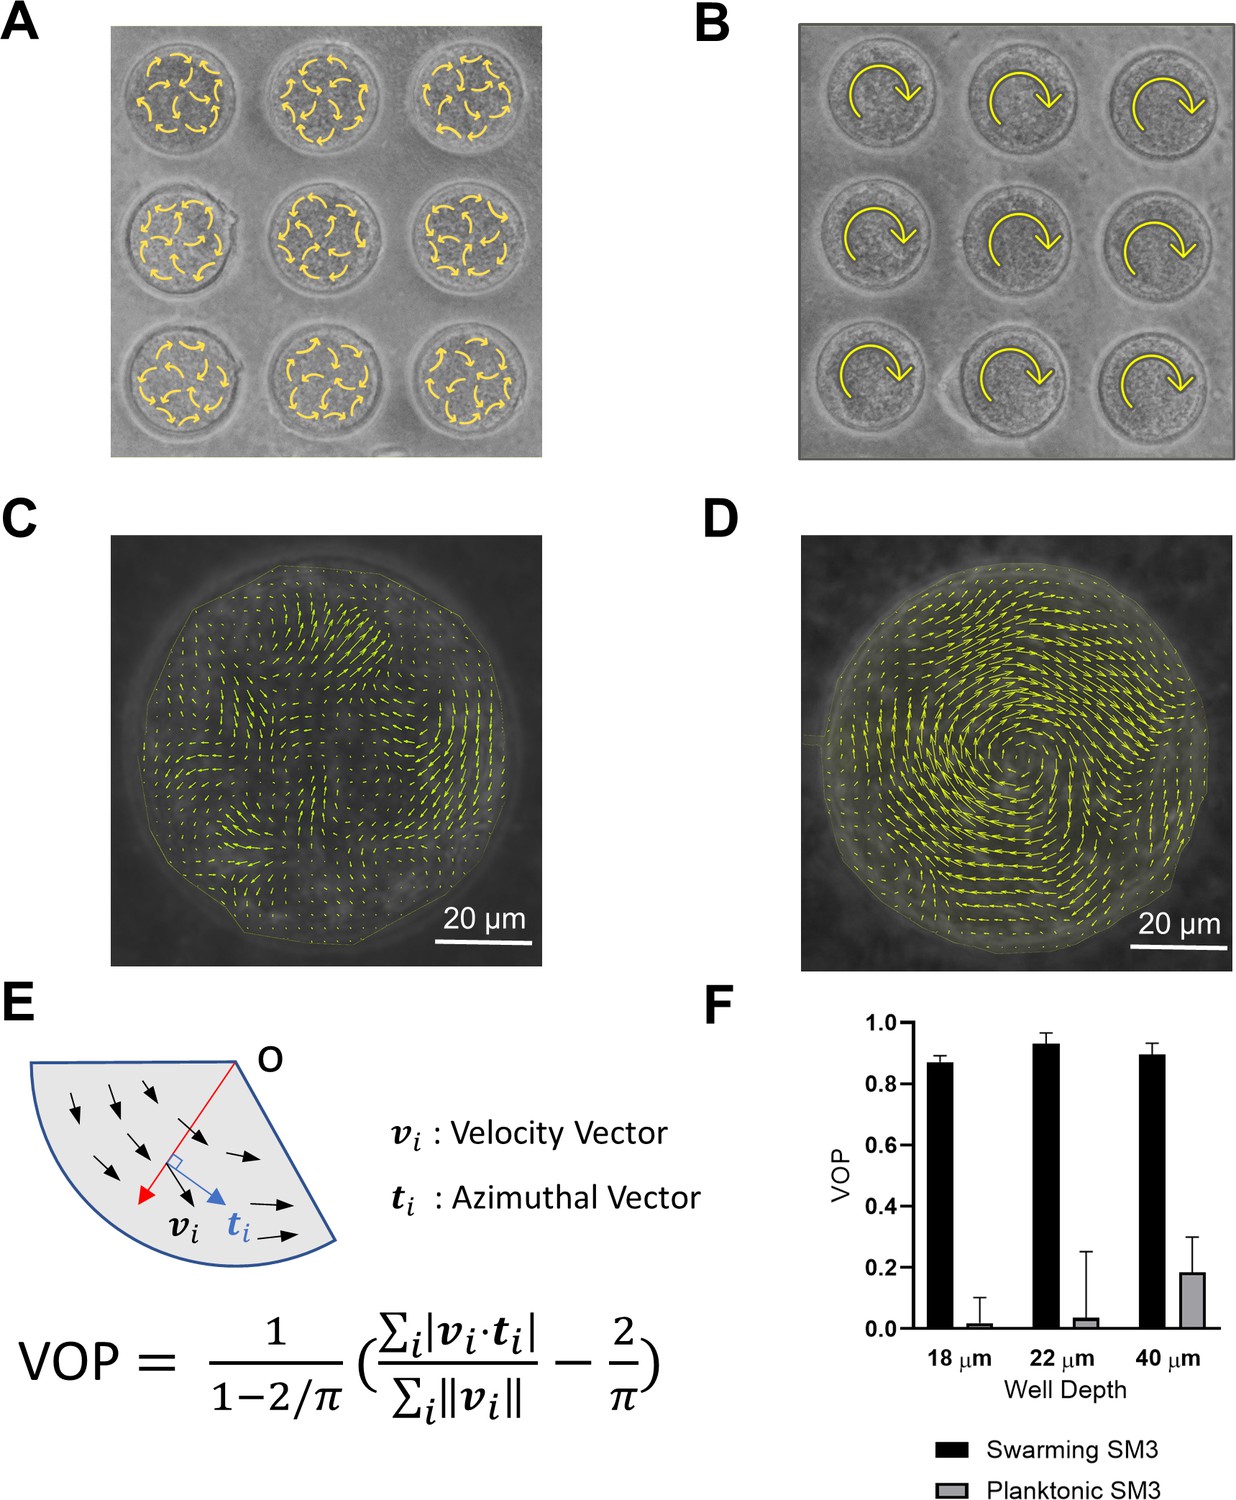
Swirls of Enterobacter sp SM3 under circular confinement.
(A and B) Motion patterns of concentrated planktonic (A) and swarming (B) SM3 in the PDMS microwells of 74 μm in diameter. Circular arrows indicate the direction of bacterial collective motion. (C and D) Velocity field of concentrated planktonic (C) and swarming (D) SM3 in a single microwell. (E) Illustration of how vortex order parameter (VOP) is defined. |·| denotes the absolute value while ||·|| denotes the Euclidean norm. (F) VOP of swarming and swimming SM3 in 74 μm microwells of three different depths. The sample size n = 5 for each group and the values are represented as mean and standard deviation (± SD).
Figure 2
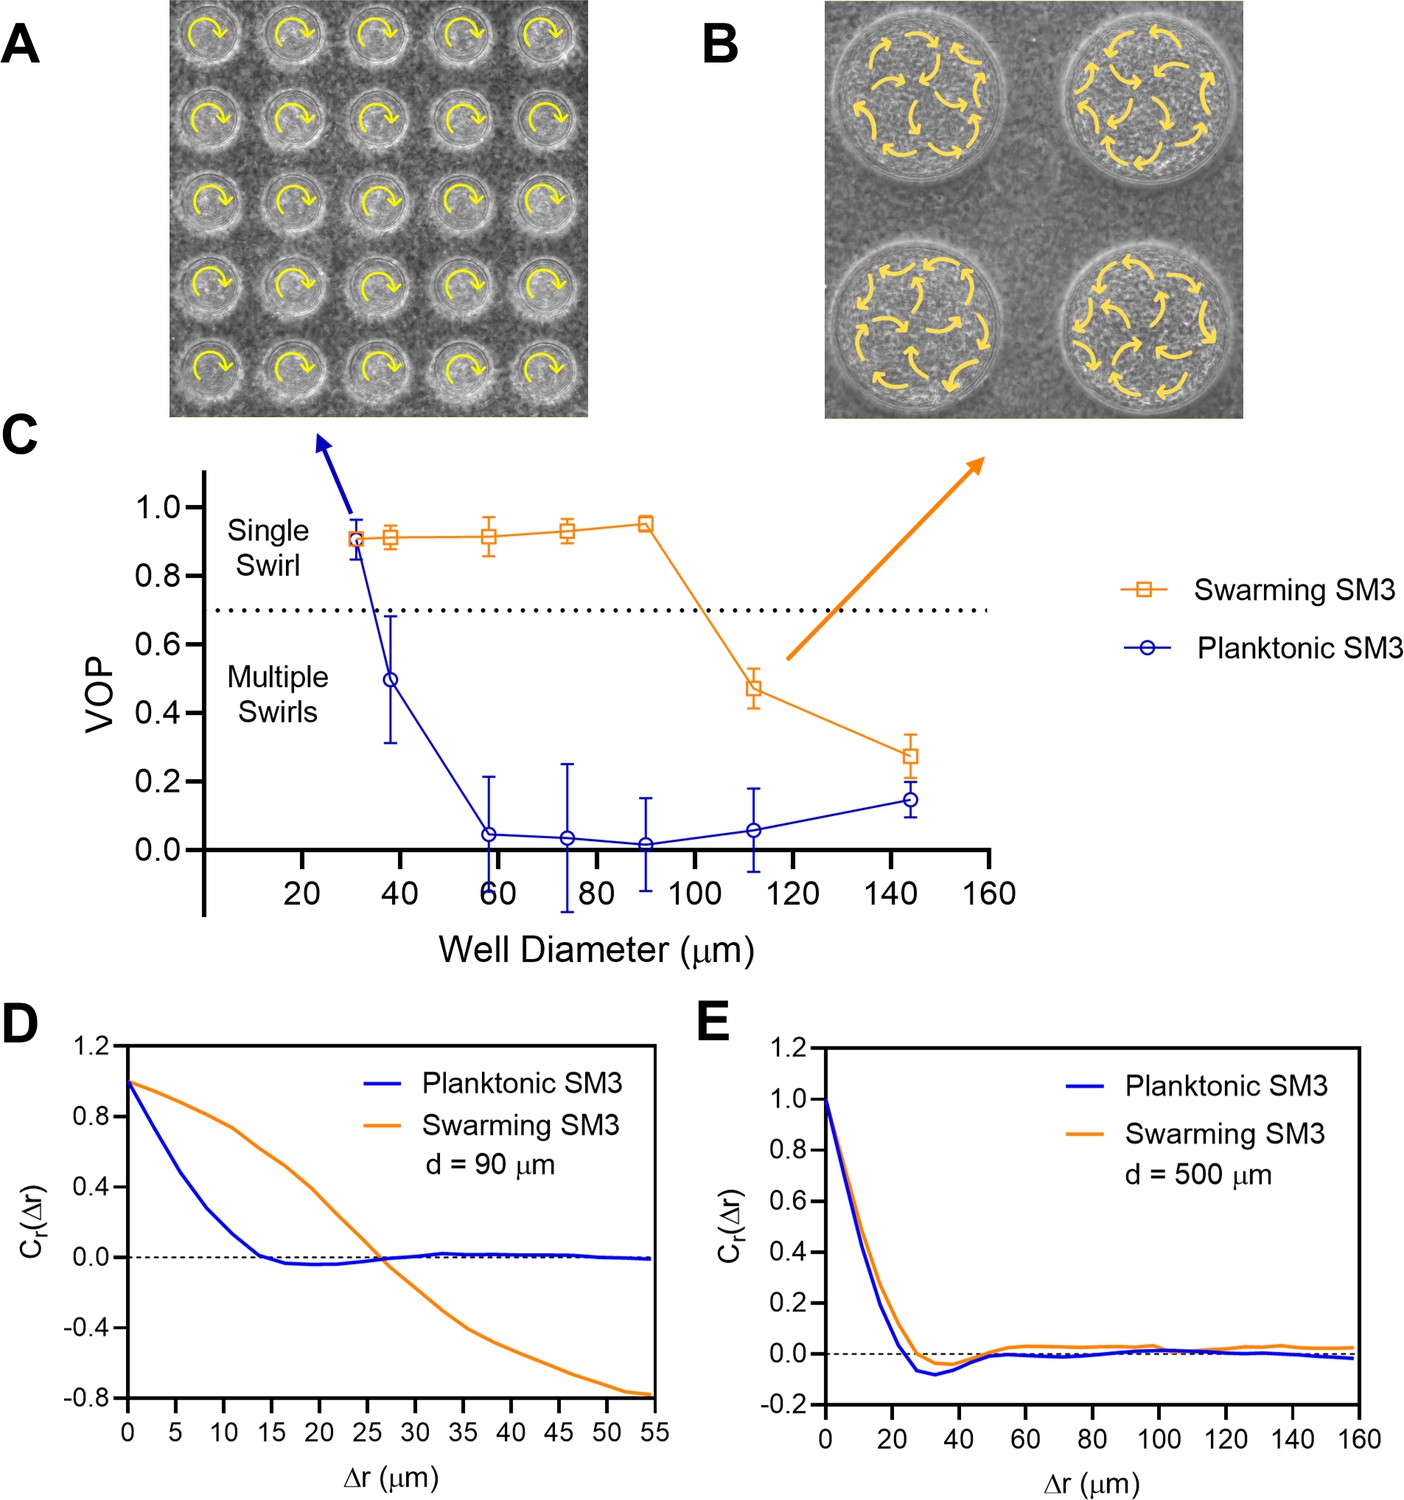
The effect of well diameter on confined Enterobacter sp SM3 motility patterns.
(A and B) Motion pattern of concentrated planktonic SM3 confined in 31 μm (A) and swarming SM3 confined in 112 μm (B) diameter microwells. (C) VOP of swarming and concentrated planktonic SM3 as a function of well diameter. The error bars represent standard deviations (± SD), and the sample size is n = 5. (D and E) Spatial autocorrelations of the bacterial velocity field in the well diameters of 90 μm (D) and 500 μm (E). The depth of the wells was 22 μm for all well diameters shown in this figure.
Figure 3
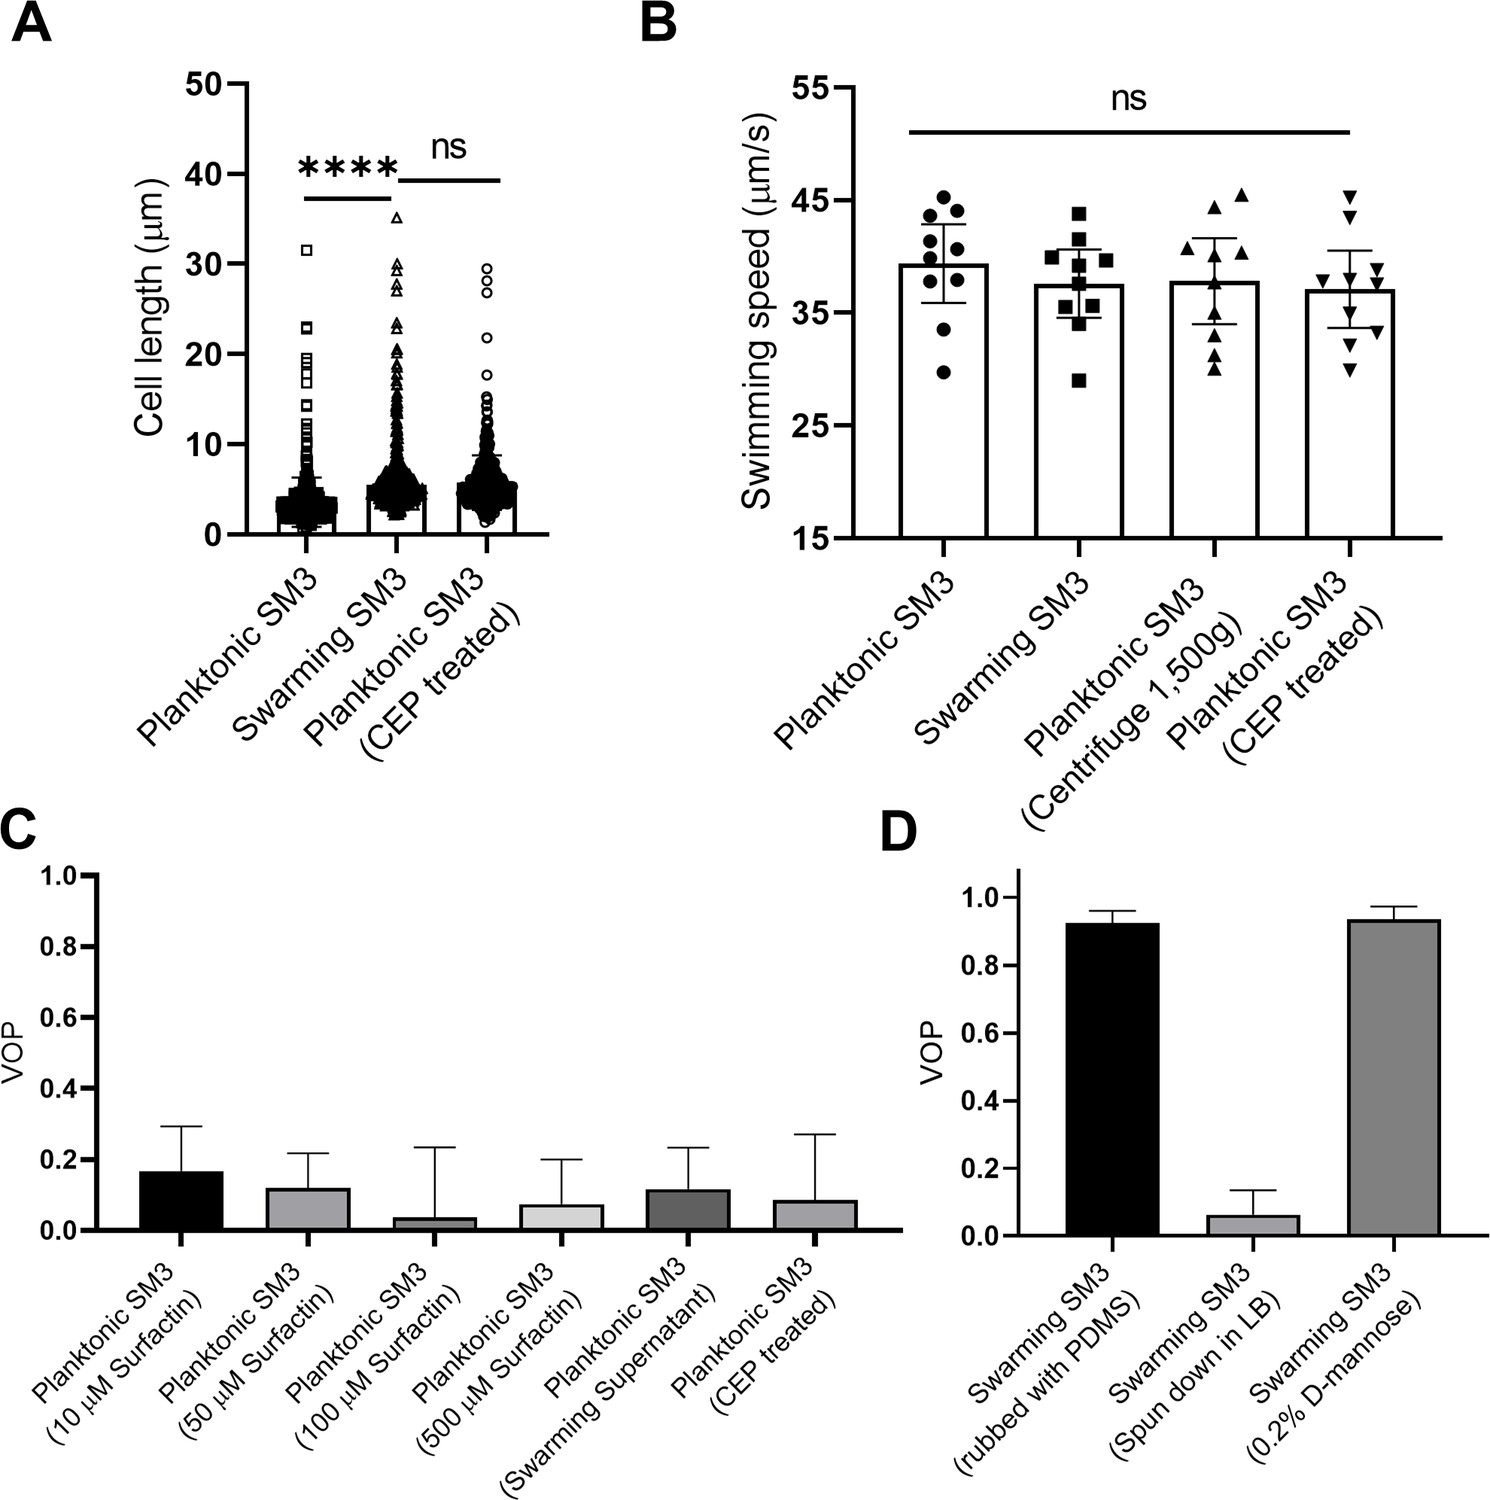
Factors that possibly influence the bacterial motion pattern in the well.
(A) Bacterial cell length of planktonic, swarming, and cephalexin (CEP) treated planktonic SM3, n = 500 for each group. Data are represented as median and interquartile range. **** indicates p<0.0001. ns indicates not significant, with p=0.8755 (Kruskal–Wallis test). (B) Bacterial cell speed of swimming, swarming, centrifuged, and CEP-treated swimming SM3, n = 10 for each group. p=0.7375, as determined by one-way ANOVA followed by Tukey’s post hoc test; ns, not significant. (C) VOP of swimming SM3 under 74 μm diameter confinement with different treatments, n = 5 for each group. (D) VOP of swarming SM3 under 74 μm diameter confinement with different treatments, n = 5 for each group. B–D, Data are shown as means with standard deviation (± SD) indicated. All statistical tests were performed using GraphPad Prism v8.4.3.
Figure 4
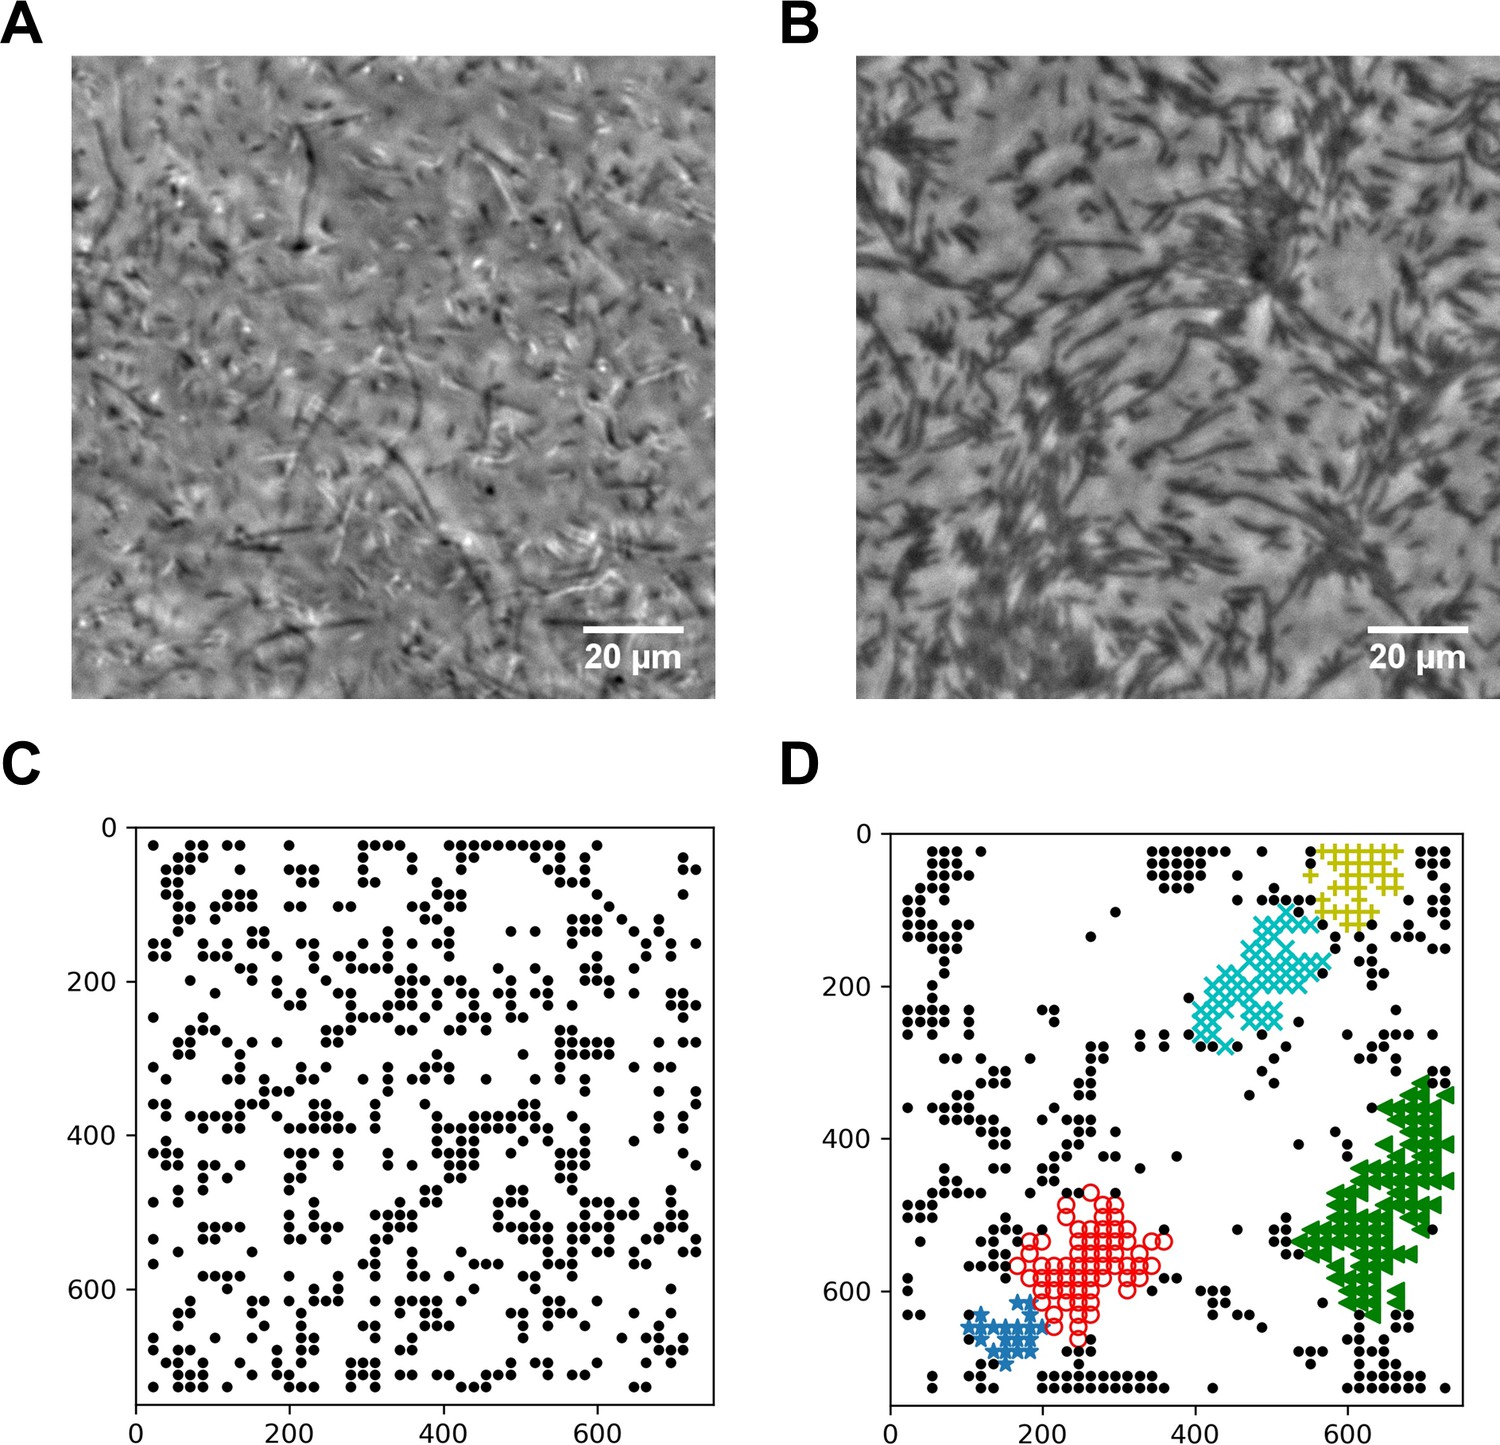
Spatial distribution of swarming and swimming SM3 cells.
(A and B) Snapshots showing diluted swarming SM3 (A) and planktonic SM3 (B) on a soft agar surface, respectively. (C and D) DBSCAN clustering analysis of diluted swarming SM3 (C) and planktonic SM3 (D). Black dots represent moving bacterial cells and colored markers show cells in clusters, as determined by the program. The numbers on the axes correspond to pixels on the images.
Figure 5 with 1 supplement

Numerical simulations of planktonic and swarming SM3 in confinement and open space.
(A) VOP of swarming and concentrated planktonic SM3 as a function of well diameter. The error bars represent standard deviations (± SD), and the sample size is n = 5. The circles on the right show representative motion patterns of swarmers and concentrated planktonic cells in the confinement size of 90 μm. (B and C) Spatial autocorrelations of the bacterial velocity field in the well diameters of 90 μm (B) and 500 μm (C), respectively. (D and E) Diluted swarmer cells (D) and diluted planktonic cells (E) with the same cell density in a space of periodic boundary condition.
Figure 5—figure supplement 1
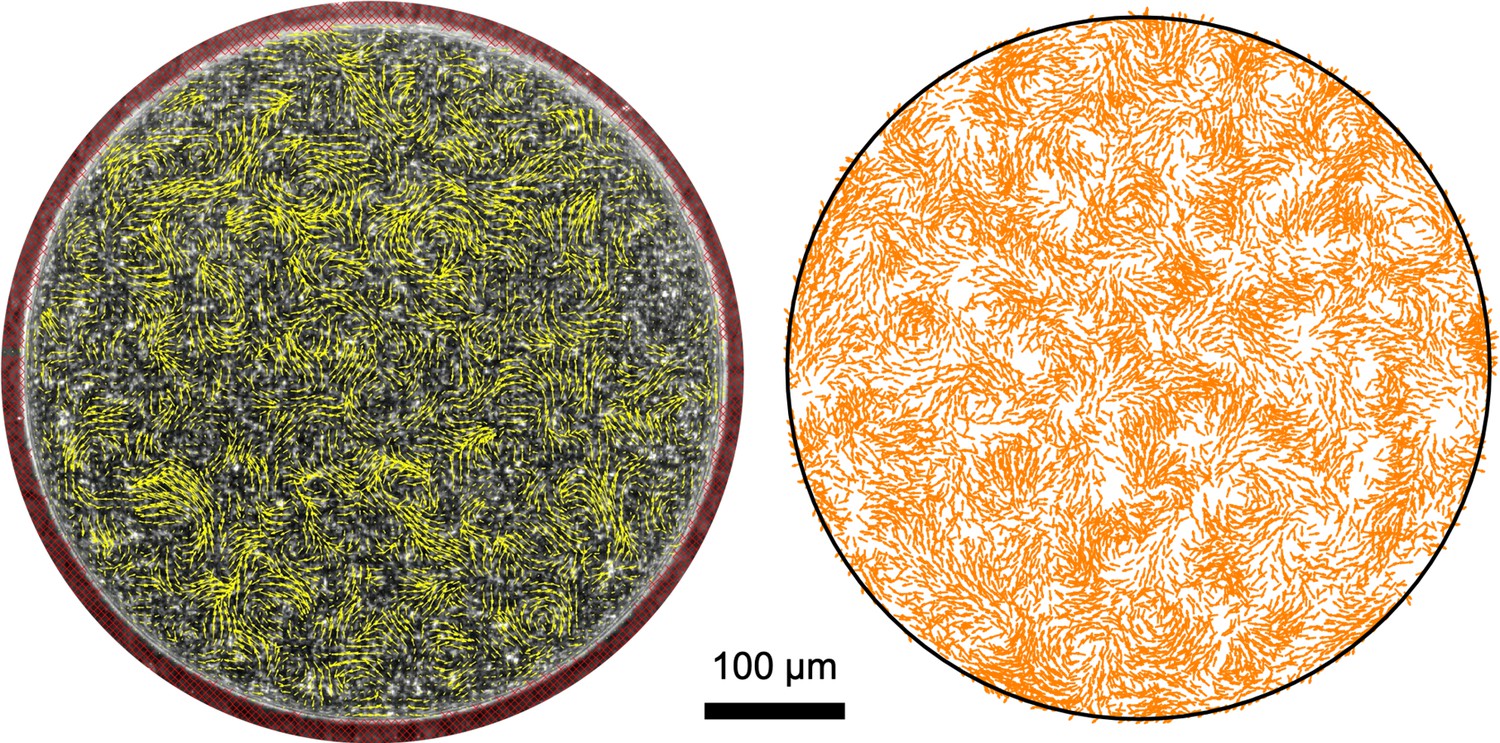
Velocity field of swarming SM3 in 500 μm diameter confinement.
Left: experimental result; Right: numerical simulation. Experimental details are described in the Materials and methods section. Simulation parameters are based on the values summarized in Appendix 2—table 1.
Figure 6
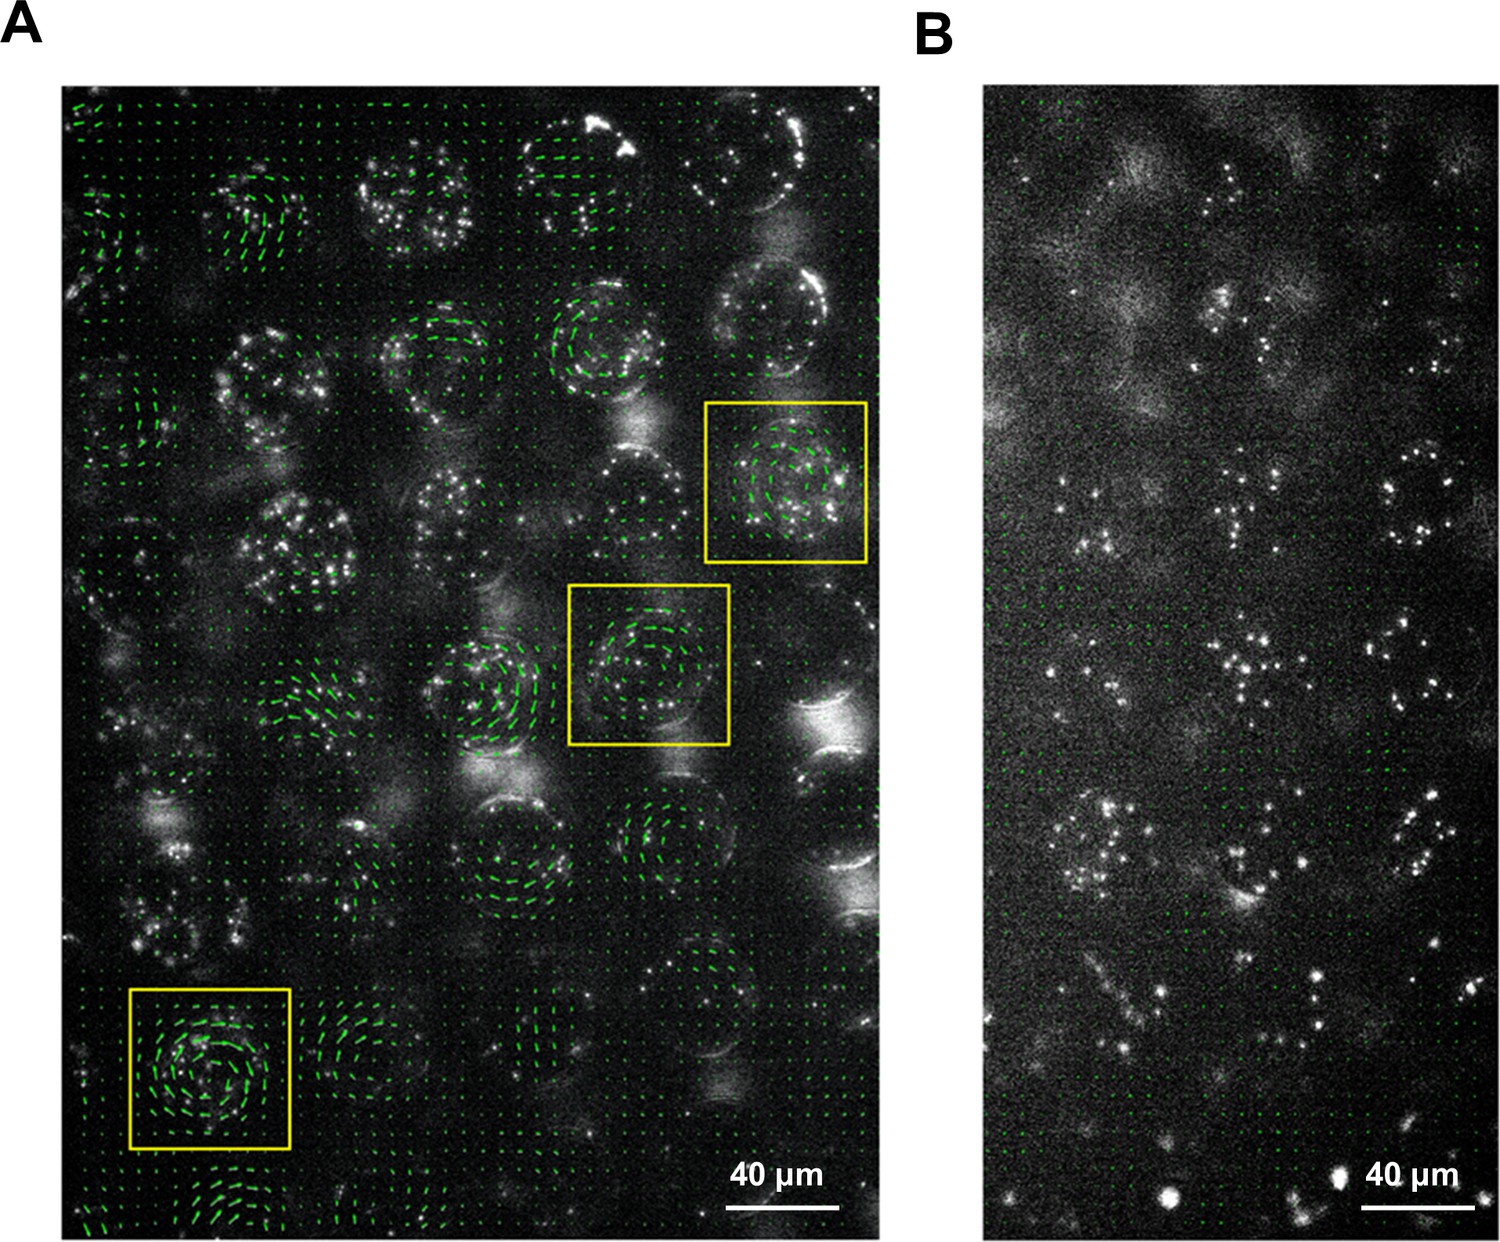
Motion of fluorescent beads in microwells mounted on murine tissues.
PDMS chips were coated with 0.5 μm fluorescent beads and mounted on SM3 inoculated colitic (A) or non-colitic (B) mice intestinal tissue surfaces. The beads' motion was measured after 4.5 hr incubation. Average velocity field was calculated by tracing the beads' motion using PIV toolkit. (A) On colitic tissue, wells with VOP > 0.7 were found and marked with yellow squares. In these wells, the single swirl motion pattern of the beads was powered by the confined swarming bacteria. Since the tissue surface was not as smooth as on agar surface, the motion of the beads in some wells did not form a complete vortex, yet jets indicating partial vortices were discernable. (B) On a normal tissue lacking swarming bacteria, the average velocity of the beads in the wells due to random motion was close to zero, giving rise to uniformly small VOP values. We could infer that the confined SM3 in these wells were predominantly swimming rather than swarming.
Figure 7
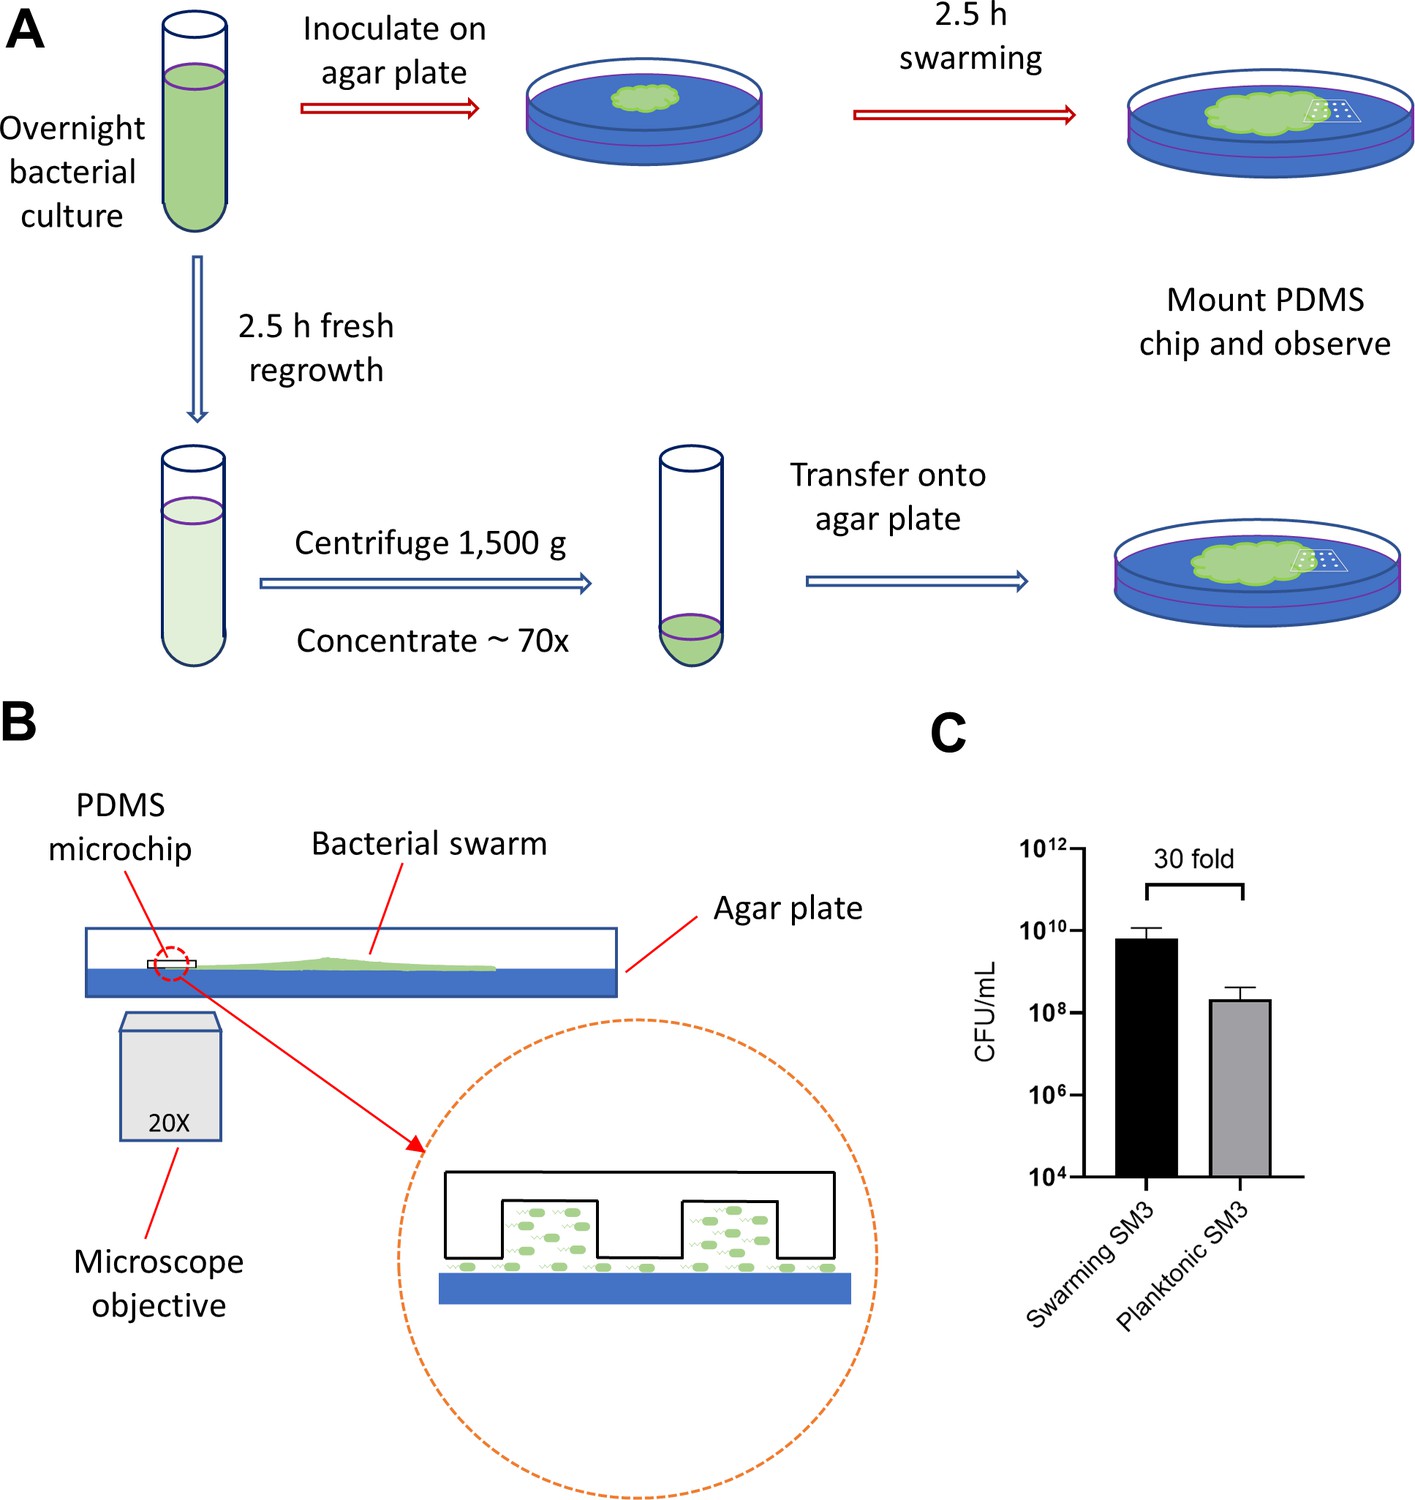
Illustration of experimental procedure.
(A) Schematic of sample preparation procedure. Red arrows represent the assay procedure for swarming bacteria. Blue arrows represent the assay procedure for swimming planktonic bacteria. (B) Schematic diagram of the experimental device (side view). The gap of a few microns between the PDMS chip and the agar surface, illustrated in magnified view, allows the bacteria under the chip to spread. (C) Cell density measured by colony forming unit (CFU/mL) of swarming SM3 and swimming, planktonic SM3. Swarming SM3 cell density is measured after SM3 swarming on an agar surface for 2.5 hr while swimming SM3 cell density is measured for overnight SM3 culture being regrown in fresh Lysogeny Broth (LB) for 2.5 hr. Since cell density of swarming SM3 was higher than that of planktonic SM3, the latter was concentrated to acquire comparable cell density before being applied on the agar plate.
Appendix 1—figure 1
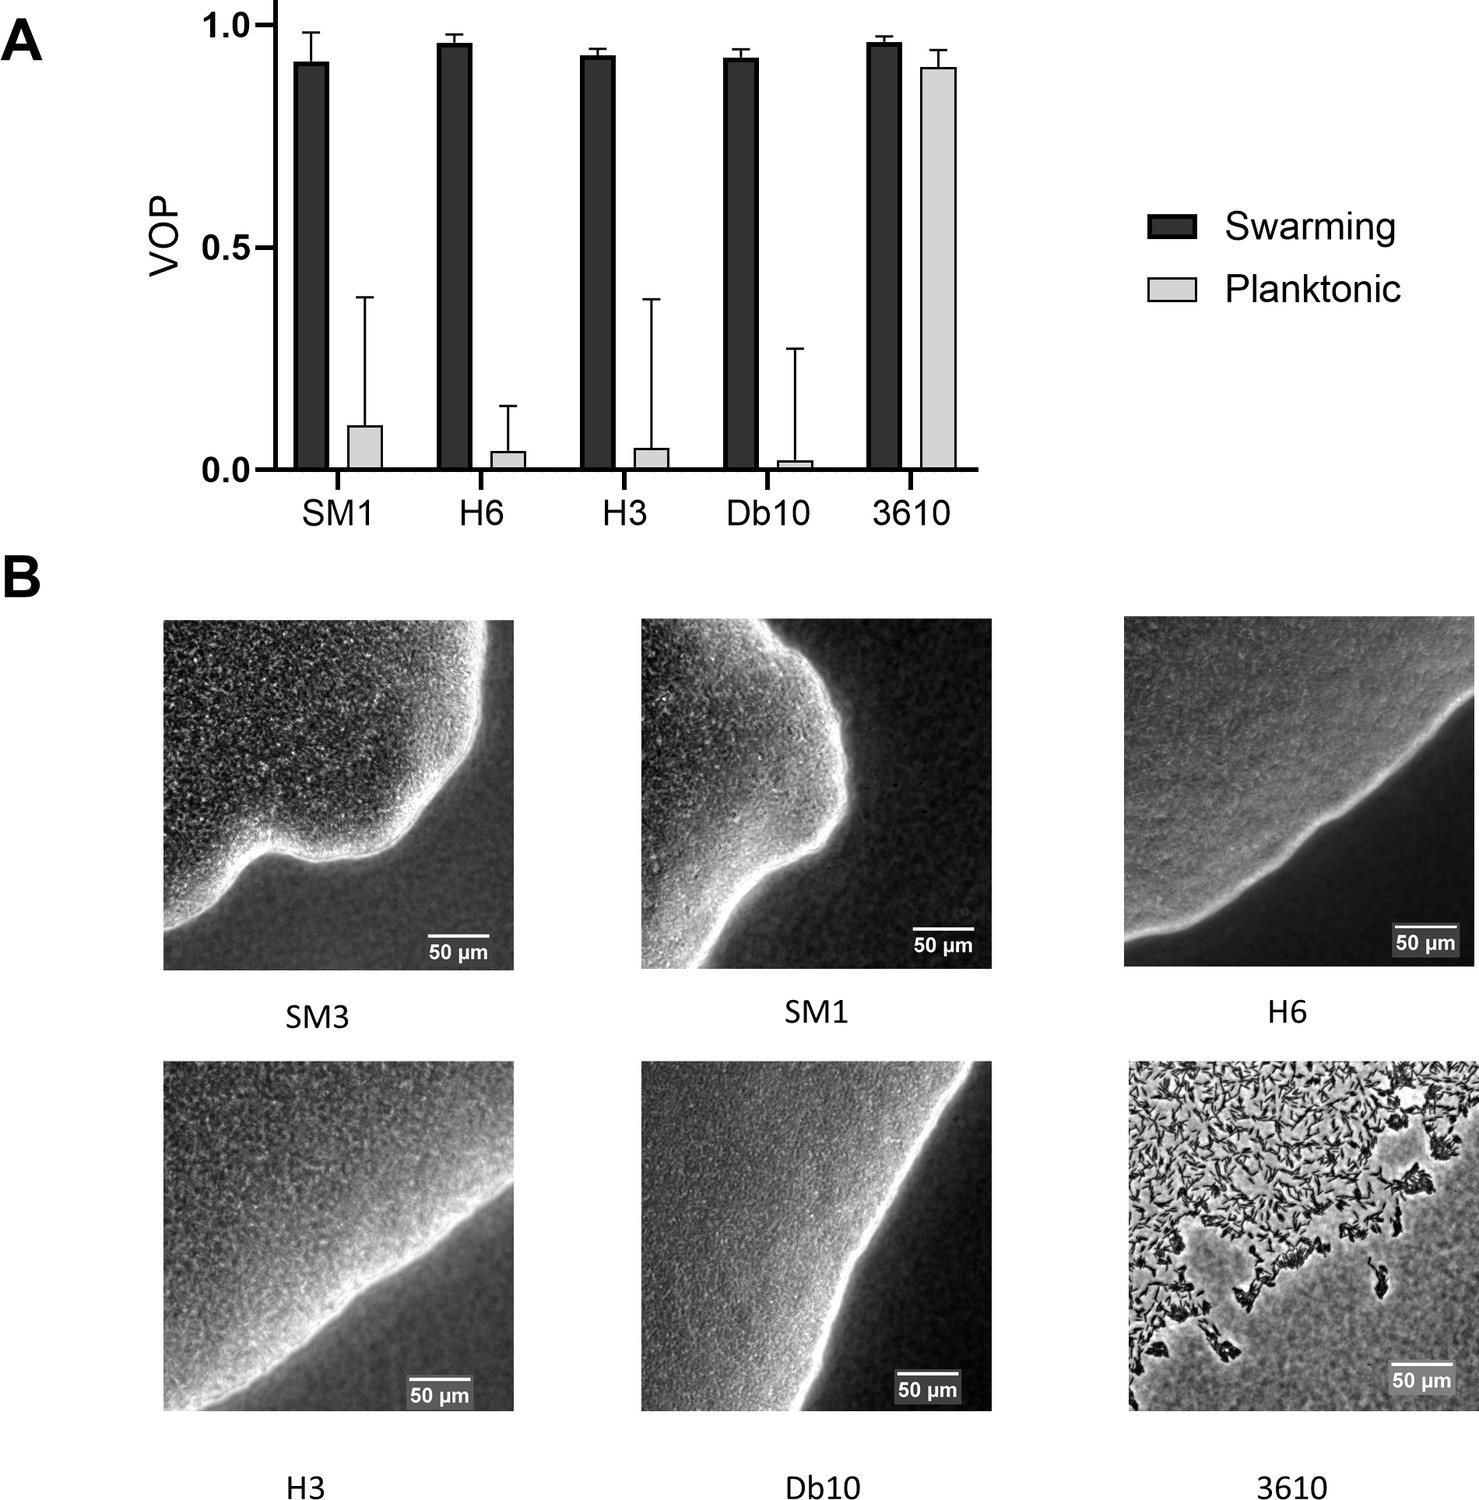
Comparisons of vortex order parameter (VOP) under confinement and swarm front among several species of bacteria.
(A) VOP of concentrated planktonic and swarming Enterobacter sp. SM1, Citrobacter koseri (H6), Serratia marcescens (H3), Serratia marcescens (Db10), and Bacillus subtilis 3610 confined in the PDMS microwells of 58 μm in diameter and 22 μm in depth. The bars indicate averages with standard deviation (+ SD) over five microwells. (B) Swarm front of the tested bacteria. B. subtilis 3610 forms a monolayer, loose swarming colony whereas all the other bacterial strains form multilayer, compact swarming colonies.
Appendix 2—figure 1

Schematic of the zonal pair-wise interaction model showing anti-alignment, alignment, and repulsion zones with the corresponding interaction radii raa, ra, and rr.
Appendix 2—figure 2

Representative patterns at different sizes of the bounded domain.
Top row: Swarming; Bottom row: Planktonic. The corresponding domain sizes and VOP values are marked as filled symbols. The particle density is kept constant as the area of the simulated region increases. Simulation parameters are based on the values summarized in Appendix 2—table 1.
Videos
Video 1
Confined swarming SM3 showing a single-swirl motion pattern.
Swarming SM3 cells were confined in 74 µm diameter PDMS wells. Video plays in real-time.
Video 2
Confined concentrated planktonic SM3 showing a turbulent motion pattern.
Swimming, planktonic SM3 cells were confined in 74 µm diameter PDMS wells. Video plays in real-time.
Video 3
Diluted swarming SM3 colony.
The swarming SM3 colony edge was diluted by adding a 50 µL water droplet. Clusters of bacterial cells formed rafts. Video plays in real-time.
Video 4
Diluted swimming SM3 suspension.
Concentrated sample of planktonic SM3 spread on agar was diluted by adding a 50 µL water droplet near the edge. Cells in the diluted region were observed to swim independently without clustering. Video plays in real-time.
Video 5
Numerical simulations of circularly confined SM3.
Swarming SM3 (left) and concentrated planktonic SM3 were simulated in the well size of 90 μm. The video shows a representative confined motion pattern. Arrows indicate the moving direction of the particles. Video plays in real-time.
Video 6
Numerical simulations of SM3 cells in open space.
Diluted swarming SM3 (left) and planktonic SM3 were simulated without confinement, but with a periodic boundary condition. In both cases, cell density is ρ = 0.025 μm−2 (~10 cells in a 20 μm × 20 μm area) and the arrows indicate the moving directions of the particles. Video plays in real-time.
Video 7
Fluorescent beads' motion on DSS induced colitic mouse intestine tissue.
The unidirectional rotation motion in 38 µm diameter wells indicates the presence of swarming SM3 on the tissue surface. Video was taken in 20 fps and compressed to play in 30 fps.
Video 8
Fluorescent beads' motion on normal mouse intestine tissue.
The random motion in 38 µm diameter wells indicates predominantly planktonic SM3 on the normal mice tissue surface. Video was taken in 20 fps and compressed to play in 30 fps.
Tables
Key resources table
| Reagent type (species) or resource | Designation | Source or reference | Identifiers | Additional information |
|---|---|---|---|---|
| Strain, strain background (Enterobacter sp. SM3) | Wild Type SM3 | https://doi.org/10.1101/759886 | Novel Strain | |
| Chemical compound, drug | D-mannose | Research Product International | Cas No. 3458-28-4 | |
| Chemical compound, drug | Cephalexin | Sigma-Aldrich | C4895 | |
| Chemical compound, drug | Surfactin | Sigma-Aldrich | S3523 | |
| Software, algorithm | ImageJ | NIH (https://imagej.nih.gov/ij/) | Version: v1.59e | |
| Software, algorithm | Python: DBSCAN | https://scikit-learn.org/stable/index.html | Version: 0.24.1 | |
| Software, algorithm | MATLAB | Mathworks | Version: R2019b | |
| Software, algorithm | PIVlab toolkits | Mathworks | Version: 2.39 | |
| Software, algorithm | Prism | GraphPad Software | Version: 8.4.3 |
Appendix 2—table 1
Simulation parameters used for swarming and planktonic cases.
| Swarming | Planktonic | ||
|---|---|---|---|
| Repulsion | kr (rad/s) | 5 | 5 |
| rr (μm) | 6 | 6 | |
| Alignment | μ+ (rad/s) | 0.3 | 0.3 |
| ra (μm) | 20 | 15 | |
| Anti-alignment | μ- (rad/s) | 0.1 | 0.1 |
| raa (μm) | 30 | 30 | |
Additional files
-
Source code 1
Main program of the simulation with initial inputs of the parameters.
- https://cdn.elifesciences.org/articles/64176/elife-64176-code1-v2.zip
-
Source code 2
Functions called in the main program that describe particle interactions.
- https://cdn.elifesciences.org/articles/64176/elife-64176-code2-v2.zip
-
Transparent reporting form
- https://cdn.elifesciences.org/articles/64176/elife-64176-transrepform-v2.pdf
Download links
A two-part list of links to download the article, or parts of the article, in various formats.
Downloads (link to download the article as PDF)
Open citations (links to open the citations from this article in various online reference manager services)
Cite this article (links to download the citations from this article in formats compatible with various reference manager tools)
Confinement discerns swarmers from planktonic bacteria
eLife 10:e64176.
https://doi.org/10.7554/eLife.64176


