In vivo imaging of retrovirus infection reveals a role for Siglec-1/CD169 in multiple routes of transmission
- Department of Microbial Pathogenesis, Yale University School of Medicine, United States
- Division of Biology and Biological Engineering, California Institute of Technology, United States
- Department of Internal Medicine, Section of Infectious Diseases, Yale University School of Medicine, United States
Figures
Figure 1
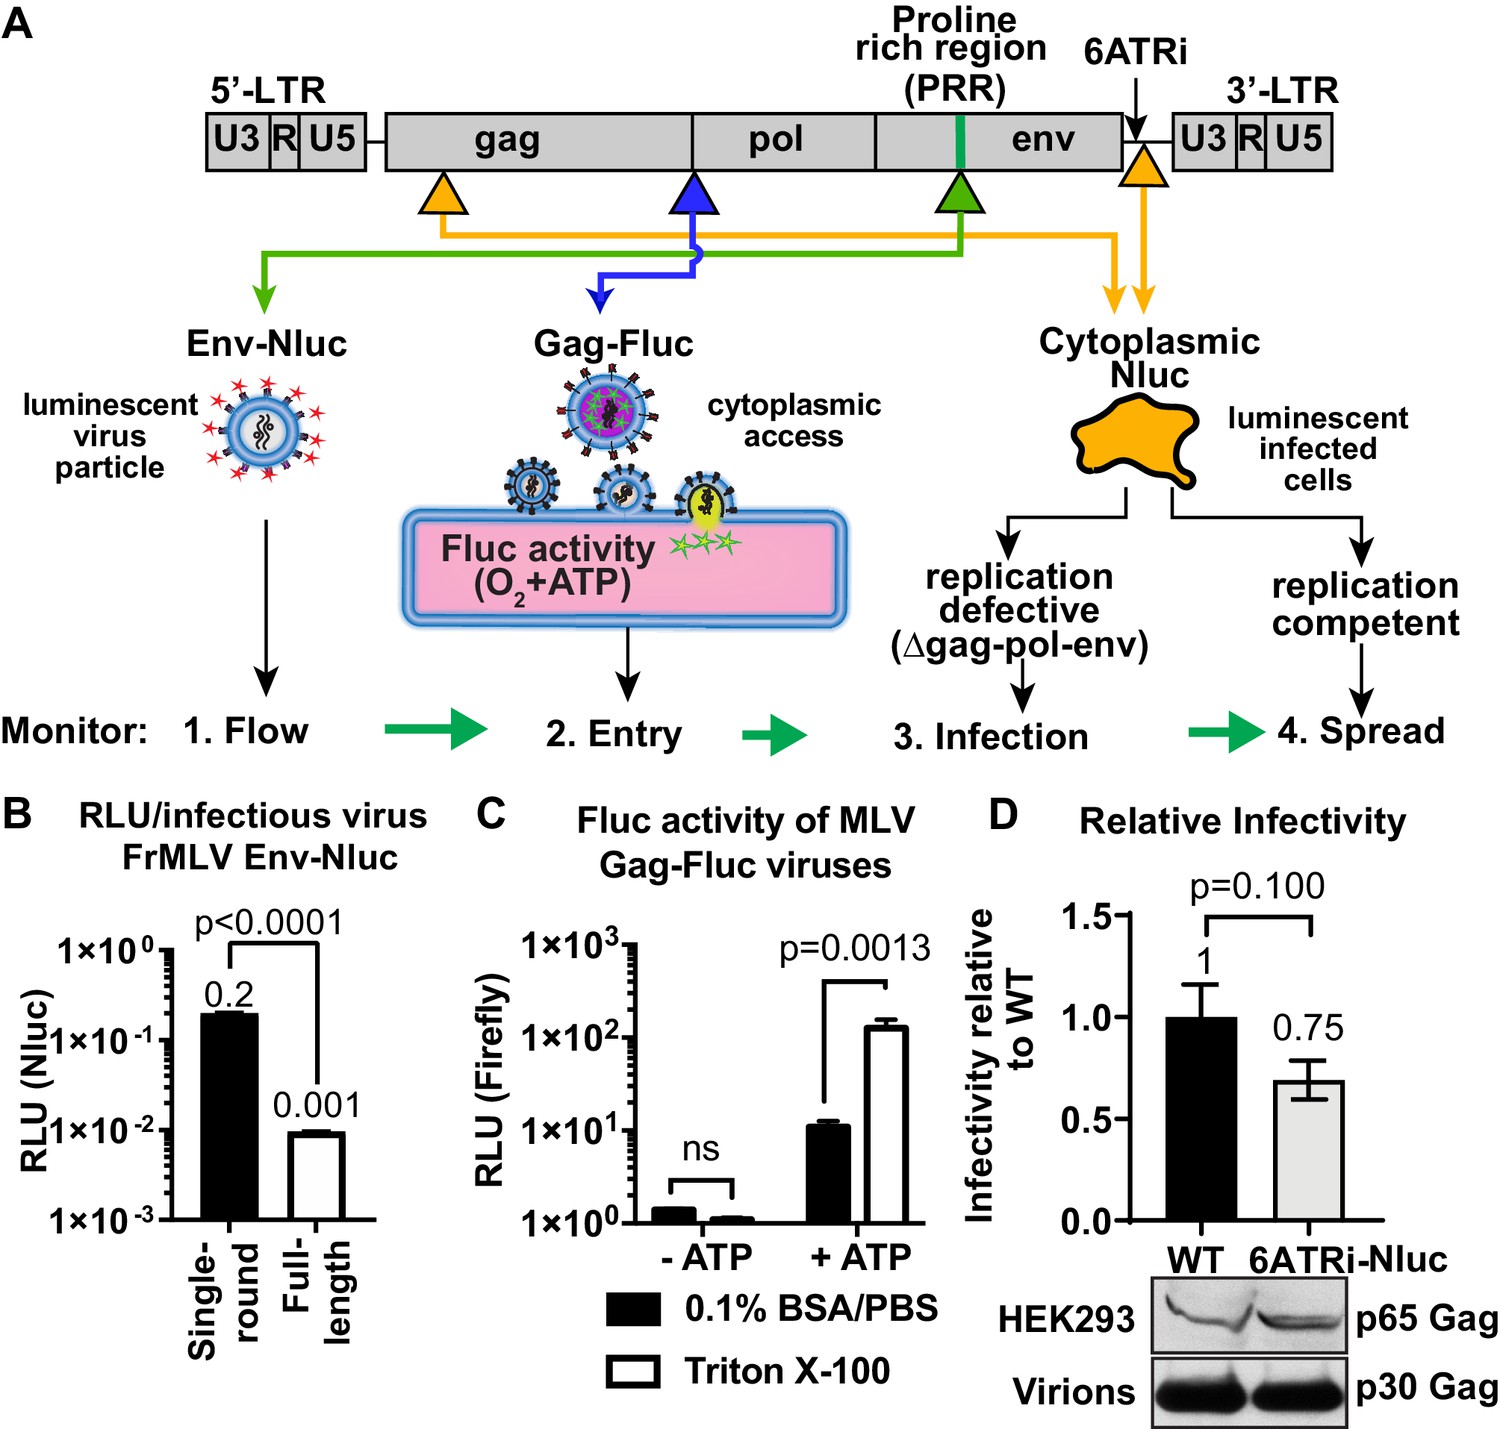
Construction and characterization of reporter viruses for visualizing individual stages of the retrovirus life cycle in vivo.
(A) A scheme denoting the location of inserted reporters into unique sites in the Friend murine leukemia virus (FrMLV) genome. (1) To monitor particle flow, Nluc was inserted in-frame into the proline-rich region (PRR) of envelope. (2) To monitor virus entry into the cytoplasm of cells, Gag-Firefly luciferase (MLV Gag-Fluc; ∆Pro-Pol) was employed as Fluc requires both oxygen and ATP in the presence of substrate D-luciferin for its activity. (3) To monitor infection, Nluc was expressed in the cytoplasm using a viral LTR-driven construct (single round; ∆gag-pol-env). (4) To monitor spreading infection, Nluc was expressed from a short internal ribosome entry site (IRES) element (6ATRi) downstream of the envelope gene that resulted in replication-competent virus. (B) A graph comparing brightness (relative light units [RLU]) per infectious unit of full-length FrMLV Env-Nluc viruses with single-round MLV generated using gag-pol, env-Nluc, and LTR-GFP constructs. Infectious units for both viruses were estimated using DFJ8 cells followed by flow cytometry. RLU per infectious virion was determined by measuring Nluc activity in sedimented virus. The error bars denote standard deviations between triplicate samples. p values derived from Student’s t-test. (C) A graph showing detectable Fluc activity in intact (0.1% BSA/PBS) or lysed (0.1% BSA/PBS, Triton X-100) MLV Gag-Fluc virions in the presence or absence of ATP and substrate D-luciferin (15 mg/mL in PBS). The error bars denote standard deviations between triplicate samples. p values derived from Student’s t-test; ns: not significant. (D) A graph comparing released infectivity of replication-competent FrMLV Nluc reporter virus (6ATRi-Nluc) and WT FrMLV (WT). Viruses were produced by transfecting equal amounts of virus-encoding plasmids into HEK293 cells in triplicate. 48 hr post-transfection released infectivity in culture supernatants was determined using DFJ8 target cells followed by flow cytometry with antibodies to MLV GlycoGag to enumerate infected cells. Released infectivity of WT FrMLV was set to 1. The error bars denote standard deviations between triplicate samples. Western blot analyses of sedimented virus from culture supernatants and HEK293 cell lysates for a similar experiment as shown in the graph above using antibodies to MLV Gag.
Figure 2 with 2 supplements
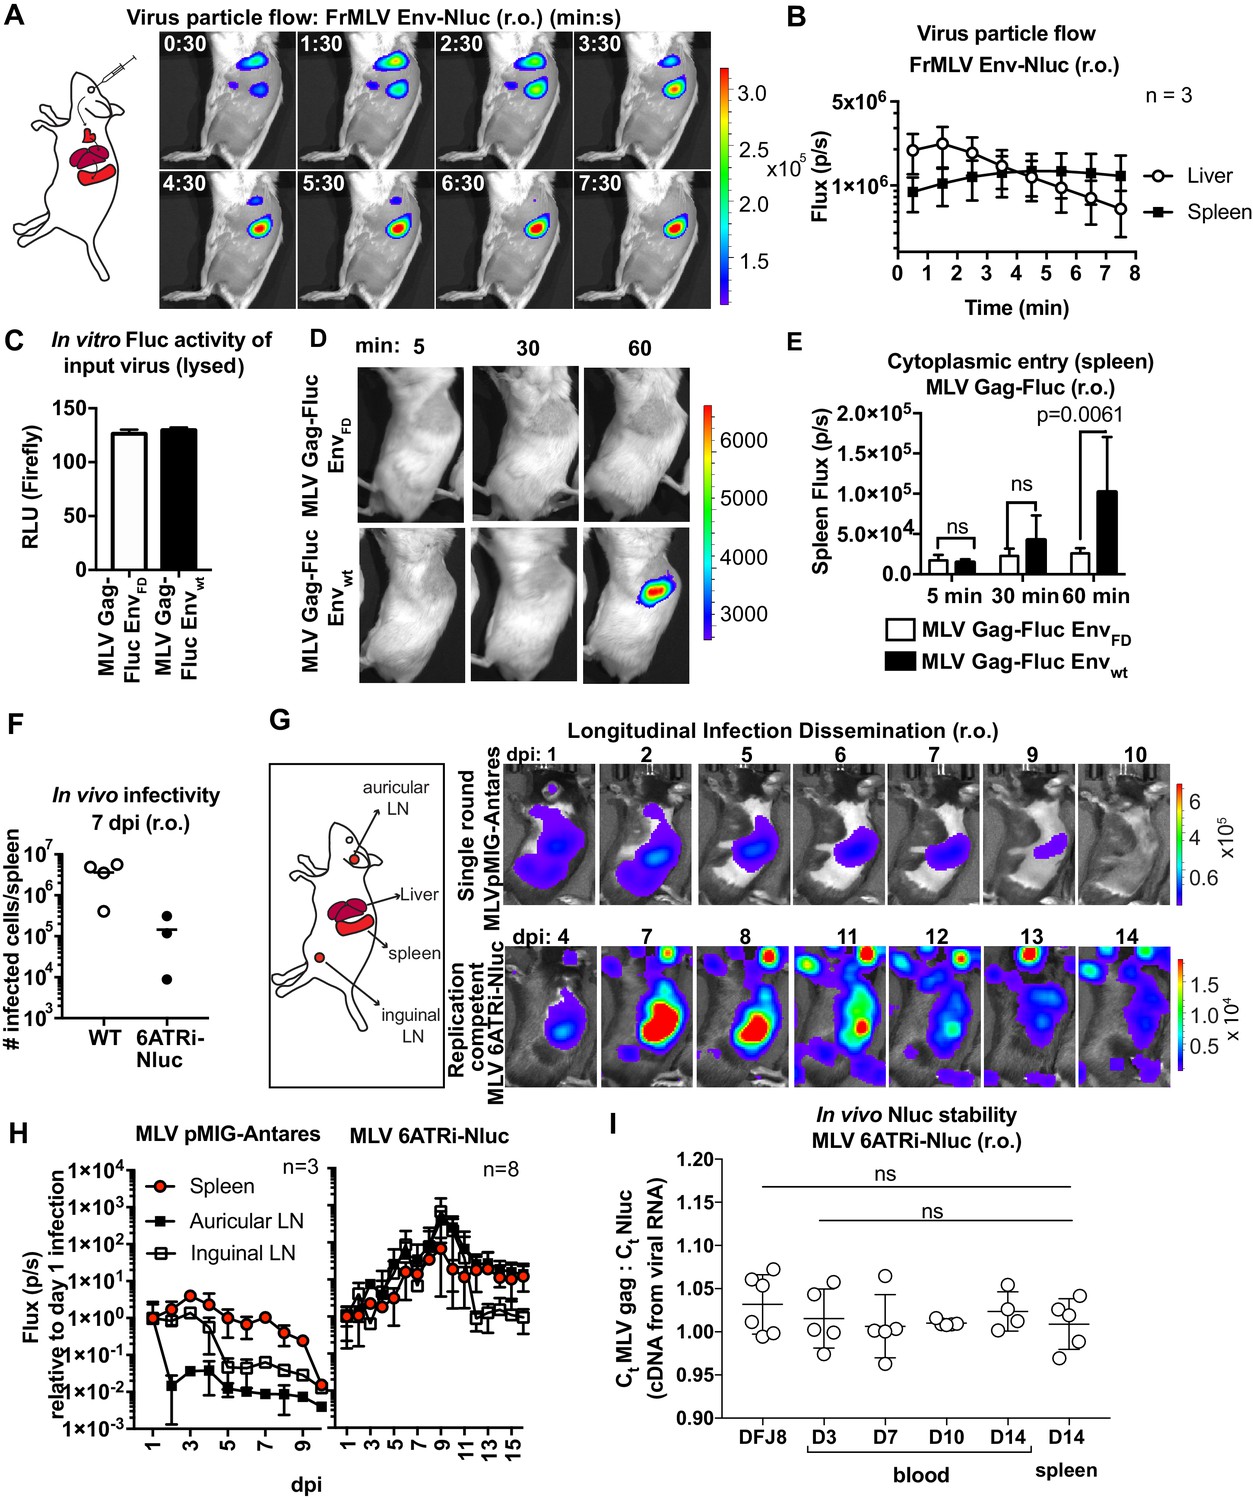
Real-time visualization of individual steps of retrovirus infection in vivo during retroorbital challenge.
(A) A scheme showing the path of murine leukemia virus (MLV) Env-Nluc particles after intravenous retroorbital (r.o.) challenge. Furimazine (Nluc substrate)-administered mice were challenged retroorbitally with 1 × 10⁵ IU of MLV Env-Nluc and monitored using IVIS at 30 s (s) intervals. Images from one representative experiment from three biological replicates (n = 3) are shown. (B) Quantification of MLV Env-Nluc bioluminescent signal in the spleen and liver, displayed as photon flux (photons/s) in each organ following r.o. challenge from the experiment described in (A). Curves represent mean flux over time, and error bars denote standard deviation. (C) A plot showing Fluc activity (relative light units [RLU]) associated with MLV Gag-Fluc EnvWT or MLV Gag-FLuc EnvFD (fusion defective) inocula after lysis. Mice were subsequently inoculated with 2 × 10⁴ RLU of indicated unlysed virus preparations. Error bars denote standard deviations from mean. (D) Representative images of MLV Gag-Fluc EnvWT entry into the target cell cytoplasm at the spleen observed via BLI at the indicated time points following r.o. infection. Mice challenged similarly with MLV Gag-Fluc EnvFD served as negative controls for determination of background signals. Images from one representative experiment from 4 to 7 biological replicates are shown. (E) Quantification of MLV cytoplasmic entry in the spleens (photon flux/s) of mice (n = 4–7) following r.o. infection with MLV Gag-Fluc EnvWT or MLV Gag-Fluc EnvFD at indicated time points from the experiment as in (D). p values derived from non-parametric Mann–Whitney test; ns: not significant; bars represent mean values and error bars denote standard deviations from mean. (F) A plot showing total number of infected cells per spleen of B6 mice (n = 3–4) challenged with 5 × 10⁵ IU of FrMLV (WT) and replication-competent reporter FrMLV (MLV 6ATRi-Nluc) at 7 days post infection (dpi) (r.o). Infected cells in single-cell suspensions of spleen were determined using flow cytometry with antibodies to MLV GlycoGag. Horizontal lines represent mean values. (G) Mice were infected r.o. with 5 × 10⁵ IU of replication-competent reporter FrMLV (MLV 6ATRi-Nluc or single-round MLV pMIG-Antares) as a control for tracking dissemination of transduced infected cells. Dissemination of viral infection was monitored via bioluminescence imaging (BLI) at the indicated time points. Infected organs are indicated in the schematic. Images from one representative experiment are shown. (H) Quantification of virus dissemination in indicated organs is displayed as photon flux in mice infected with MLV 6ATRi-Nluc or MLV pMIG-Antares for the experiment described in (G). Antares, n = 3; 6ATRi-Nluc, n = 8. Images in (G) are from one representative experiment. Symbols represent mean values, and error bars denote standard deviations from mean. Scale bars that accompany the images showing luminescence denote radiance in photons per second per square centimeter per steradian (p/s/cm2/sr). (I) In vivo longitudinal stability of Nluc within the MLV 6ATRi-Nluc genome was determined via RT2-qPCR in B6 mice. RNA extracted from blood or spleen of mice (n = 5) r.o. infected with MLV 6ATRi-Nluc (2 × 10⁶ IU) at the indicated time points. Infected spleens were harvested at 14 dpi. RNA from DFJ8-infected cells (MLV 6ATRi-Nluc; 2 × 10⁵ IU) and uninfected cells served as positive and negative controls for PCR. RT2-qPCR was performed on viral RNA extracted from infected samples using primers for Nluc and MLV gag. Stability of Nluc within the viral genome was determined by ratios of gag:Nluc Ct values over time.
Figure 2—figure supplement 1
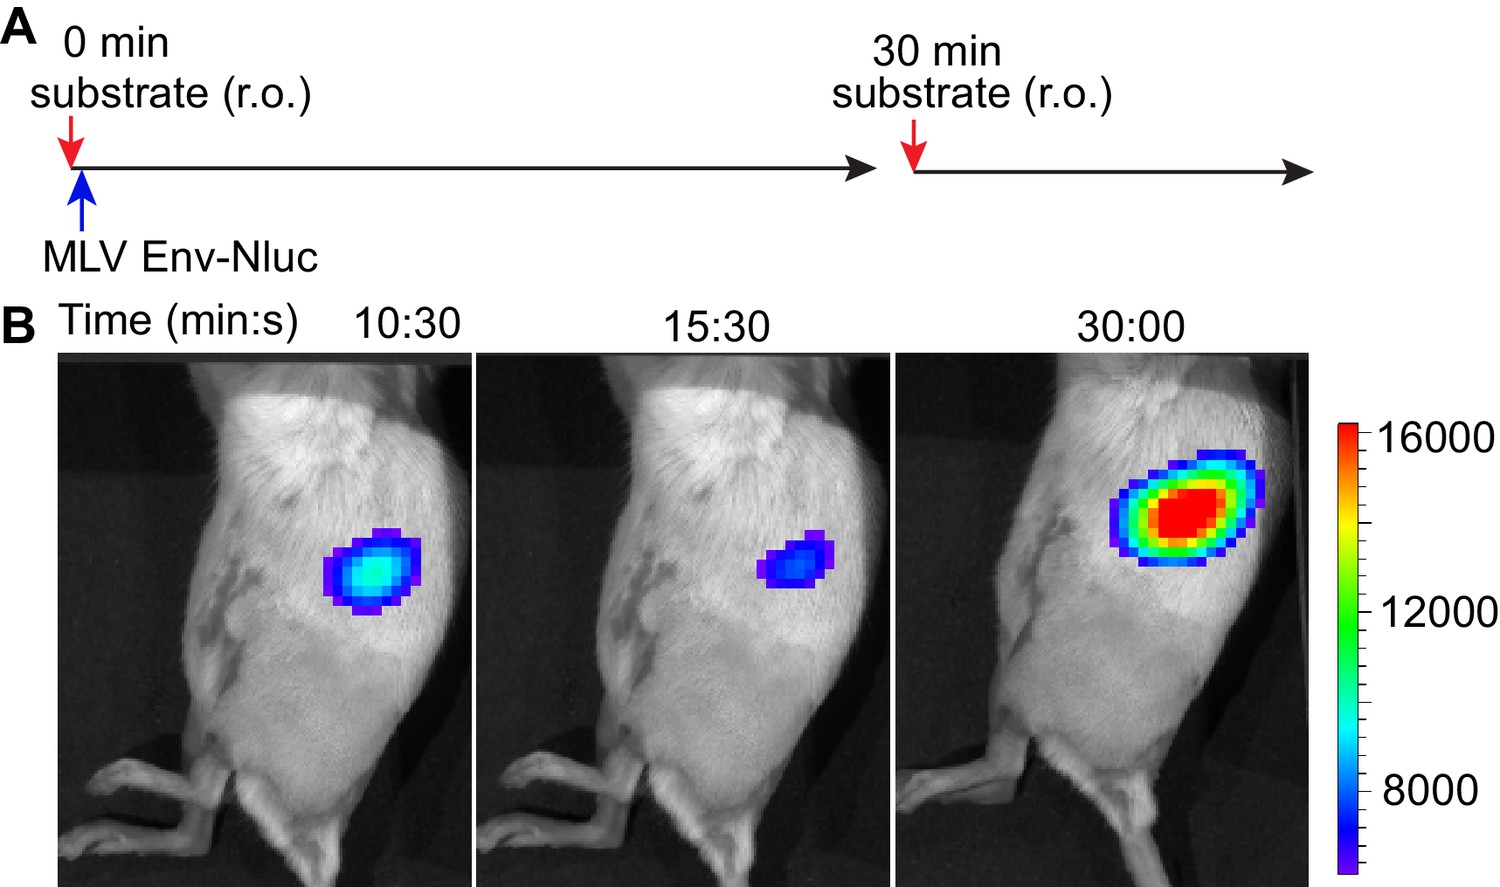
Stable retention of murine leukemia virus (MLV) Env-Nluc in the spleen demonstrated by readministration of furimazine substrate after retroorbital (r.o.) challenge.
(A) Timeline of r.o. substrate administration (red arrows) in mice infected with 1 × 10⁵ IU (blue arrow; r.o.) of MLV Env-Nluc. (B) Images demonstrating waning and resurgence of luminescent signal in mice for an experiment shown in (A) before and after substrate readministration at indicated time points. Scale bars that accompany the images showing luminescence denote radiance in photons per second per square centimeter per steradian (p/s/cm2/sr).
Figure 2—video 1
Murine leukemia virus (MLV) particle flow through the liver and spleen in the retroorbital infection route.
Virus particle flow was monitored via bioluminescence imaging immediately following retroorbital infection with 1 × 10⁵ IU of MLV Env-Nluc. Mice were continuously imaged at 1 min intervals starting at 30 s post-challenge.
Figure 3 with 2 supplements
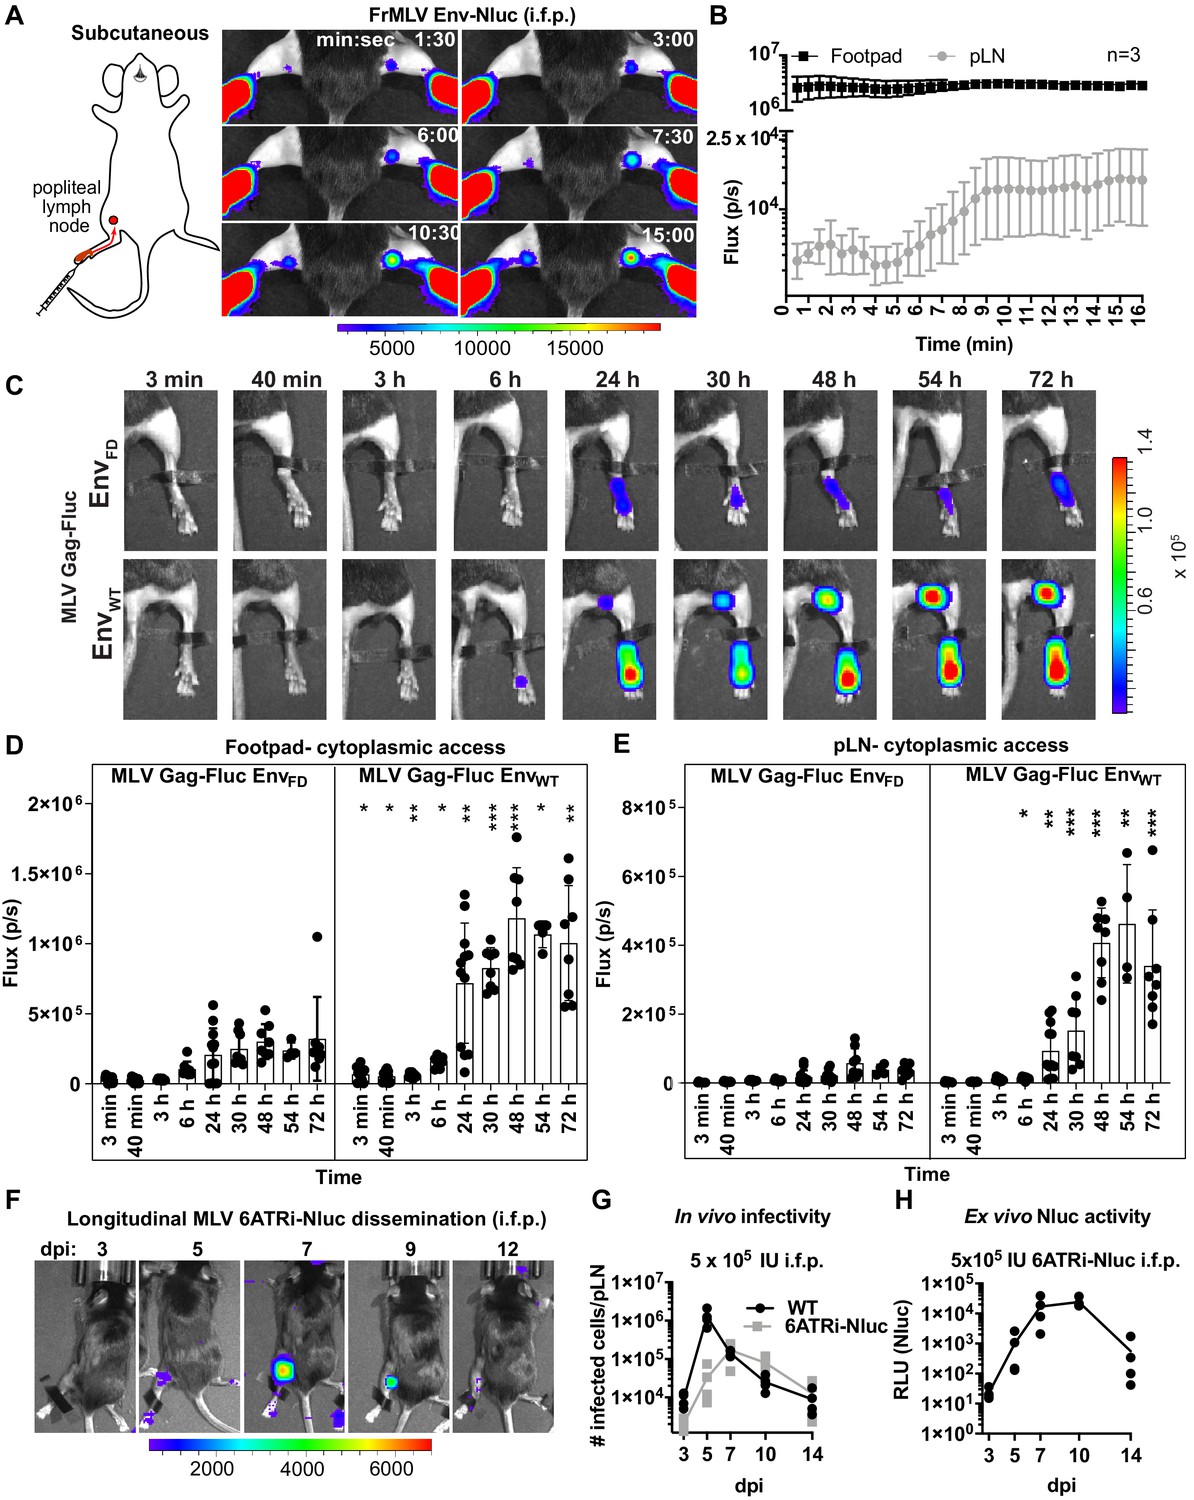
Real-time visualization of individual steps of retrovirus infection in vivo during subcutaneous challenge.
(A) A scheme showing the path of murine leukemia virus (MLV) Env-Nluc from footpad to draining popliteal lymph node (pLN) after subcutaneous (intrafootpad [i.f.p.]) challenge in mice. Furimazine (Nluc substrate)-administered mice were challenged i.f.p. with 1 × 10⁵ IU of MLV Env-Nluc and monitored using IVIS at 30 s (s) intervals. Images from one representative experiment from three biological replicates (n = 3) are shown. (B) Quantification of MLV accumulation in footpad and pLN, displayed as photon flux (photons/s) at each site following i.f.p. inoculation with MLV Env-Nluc (n = 3), from the experiment described in (A). Curves represent mean flux over time, and error bars denote standard error from mean. (C) Representative images of MLV Gag-Fluc EnvWT entry into the target cell cytoplasm at the footpad and pLN observed by bioluminescence imaging (BLI) at the indicated time points following i.f.p. infection. Mice challenged similarly with MLV Gag-Fluc EnvFD (fusion-defective envelope) served as negative controls for determination of background signals. Fluc activity was measured for both virus preparations after detergent lysis and equivalent amounts (2 × 10⁶relative light units [RLU]) were delivered i.f.p. before imaging using IVIS. Images from one representative experiment from 8 to 10 biological replicates are shown. (D, E) Quantification of MLV cytoplasmic entry in footpads (D) and pLNs (E) (photon flux/s) of mice (n = 8–10) following i.f.p. infection with MLV Gag-Fluc EnvWT or MLV Gag-Fluc EnvFD at indicated time points from the experiment as in (C). p values derived from non-parametric Mann–Whitney test of MLV EnvWT- vs. MLV EnvFD-infected mice; ∗p<0.05; ∗∗p<0.01; ∗∗∗p<0.001; ∗∗∗∗p<0.0001; mean values ± SD are depicted. (F) Mice were infected with 4 × 10⁵ IUs of replication-competent reporter FrMLV (MLV 6ATRi-Nluc [i.f.p.]). Dissemination of viral infection was monitored via BLI at the indicated time points days post infection (dpi). Images from one representative experiment are shown. (G) A plot showing total number of infected cells per pLNs of B6 mice (n = 3–4) challenged with 4 × 10⁵ IU of FrMLV (WT) (i.f.p.) and replication-competent reporter FrMLV (MLV 6ATRi-Nluc) at indicated days post infection (dpi). Infected cells in single-cell suspensions of pLNs were determined using flow cytometry with antibodies to MLV GlycoGag. Connecting lines representing mean values along with individual data points are shown. (H) A plot showing ex vivo Nluc activity in cells isolated from pLNs of mice infected with MLV 6ATRi-Nluc-infected from the experiment shown in (F). Individual data points along with connecting lines (mean values) are shown. Scale bars that accompany the images denote radiance in photons per second per square centimeter per steradian (p/s/cm2/sr).
Figure 3—figure supplement 1
Characterization of murine leukemia virus (MLV) infection during footpad challenge.
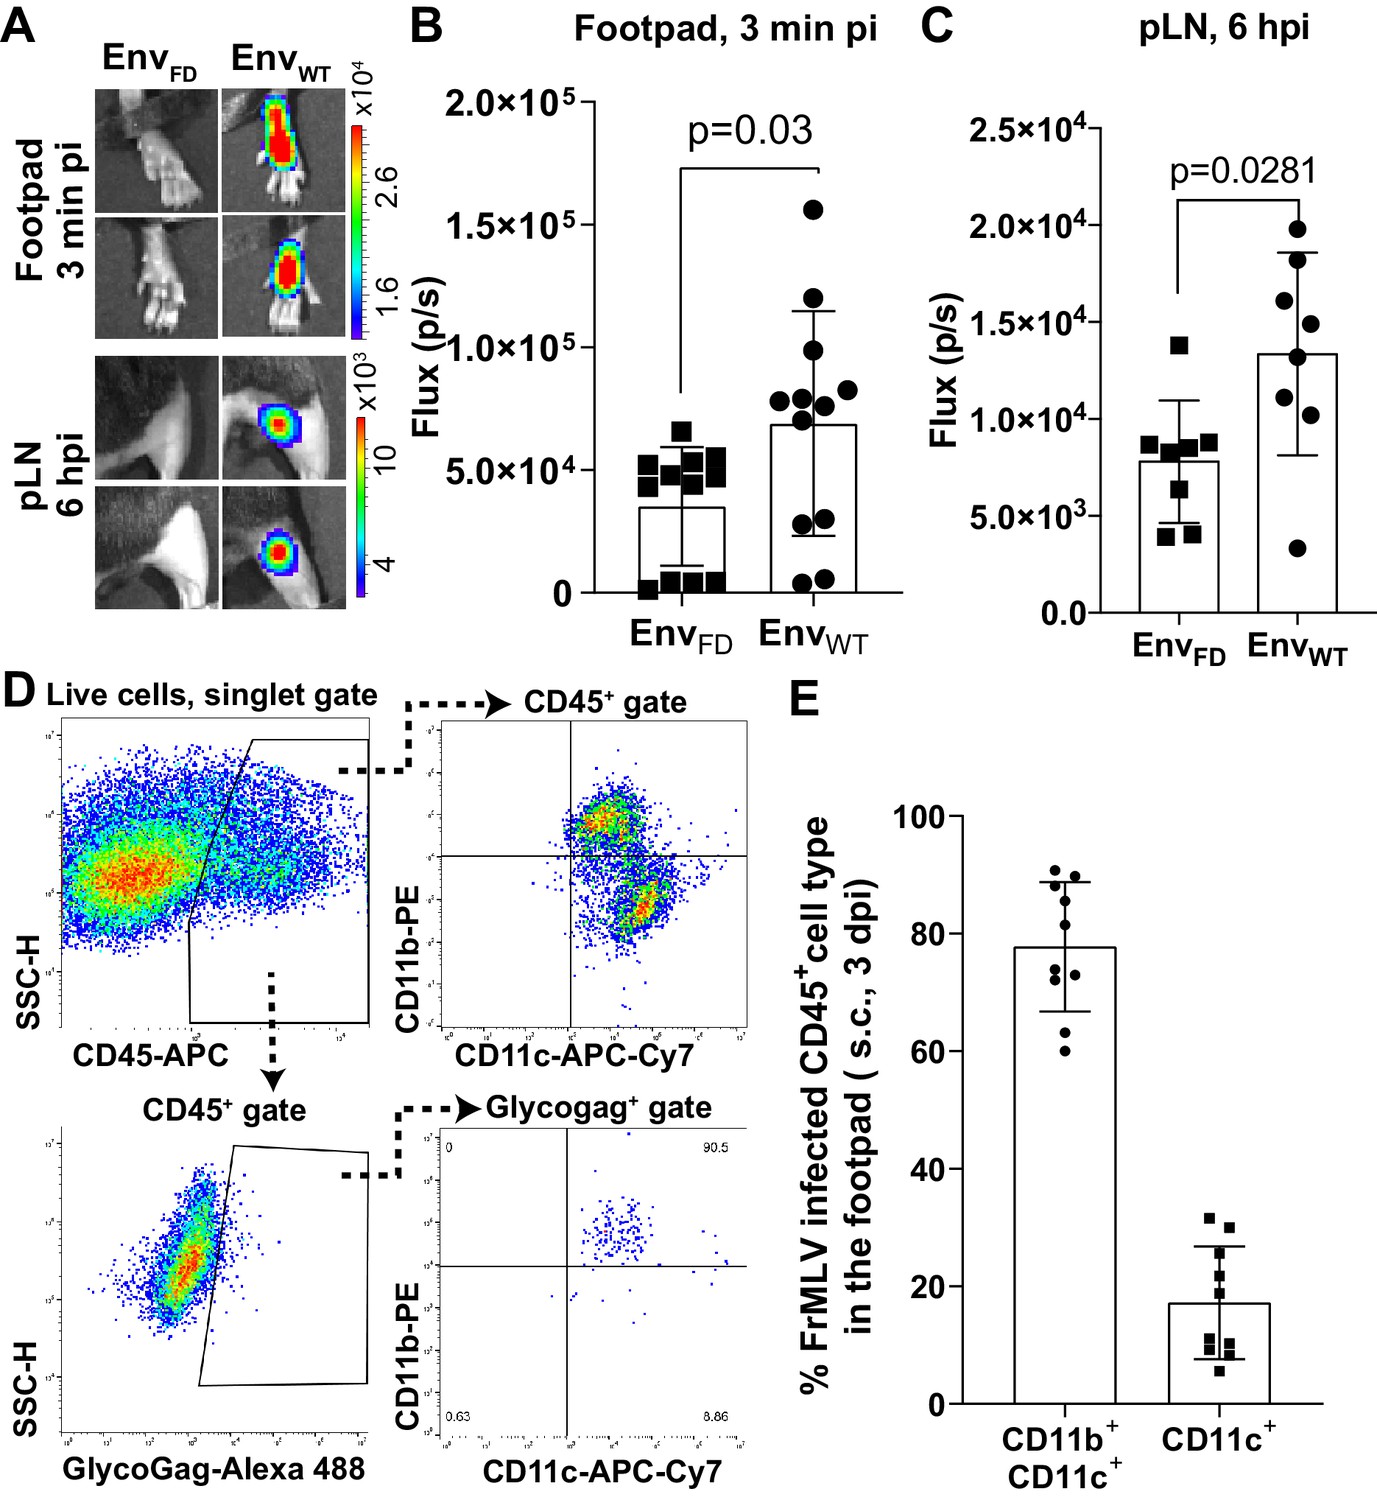
(A) MLV enters target cell cytoplasm in the footpad and popliteal lymph node (pLN) by 3 min and 6 hr post infection (hpi), respectively. Mice were infected with MLV Gag-Fluc EnvWT or EnvFD via intrafootpad (i.f.p.) route and monitored by NBLI as in Figure 3C. Images from one representative experiment are shown. Scale bars that accompany the images denote radiance in photons per second per square centimeter per steradian (p/s/cm2/sr). (B) Quantification of MLV entry into target cell cytoplasm in the footpad at 3 min pi from the experiment described in (A), displayed as photon flux (p/s/) (n = 12). (C) Quantification of MLV entry into target cell cytoplasm in the pLN at 6 hpi from the experiment described in (A), displayed as photon flux (p/s/) (n = 12). (D, E) Characterization of target cell types in the footpads of mice infected with FrMLV (2 × 10⁵ IU; i.f.p.) at 3 days post infection (dpi). (D) Gating strategy to characterize CD45+ MLV-infected cells (GlycoGag+) using flow cytometry of single-cell suspensions isolated from footpad tissue using indicated markers. (D) Quantification of infected cell types in footpads at 3 dpi (n = 5 mice).
Figure 3—video 1
Murine leukemia virus (MLV) particle flow to the popliteal lymph node following intrafootpad (i.f.p.) inoculation.
Mice were infected via the i.f.p. route with 1 × 10⁵ IU MLV Env-Nluc. MLV particle flow was monitored by bioluminescence imaging starting at 30 s post-challenge. Images were acquired at 30 s intervals for 16 min. Mice were subsequently imaged at 60 min post-challenge.
Figure 4 with 2 supplements
Sentinel macrophages mediate capture of incoming viruses at the injection site during subcutaneous challenge.
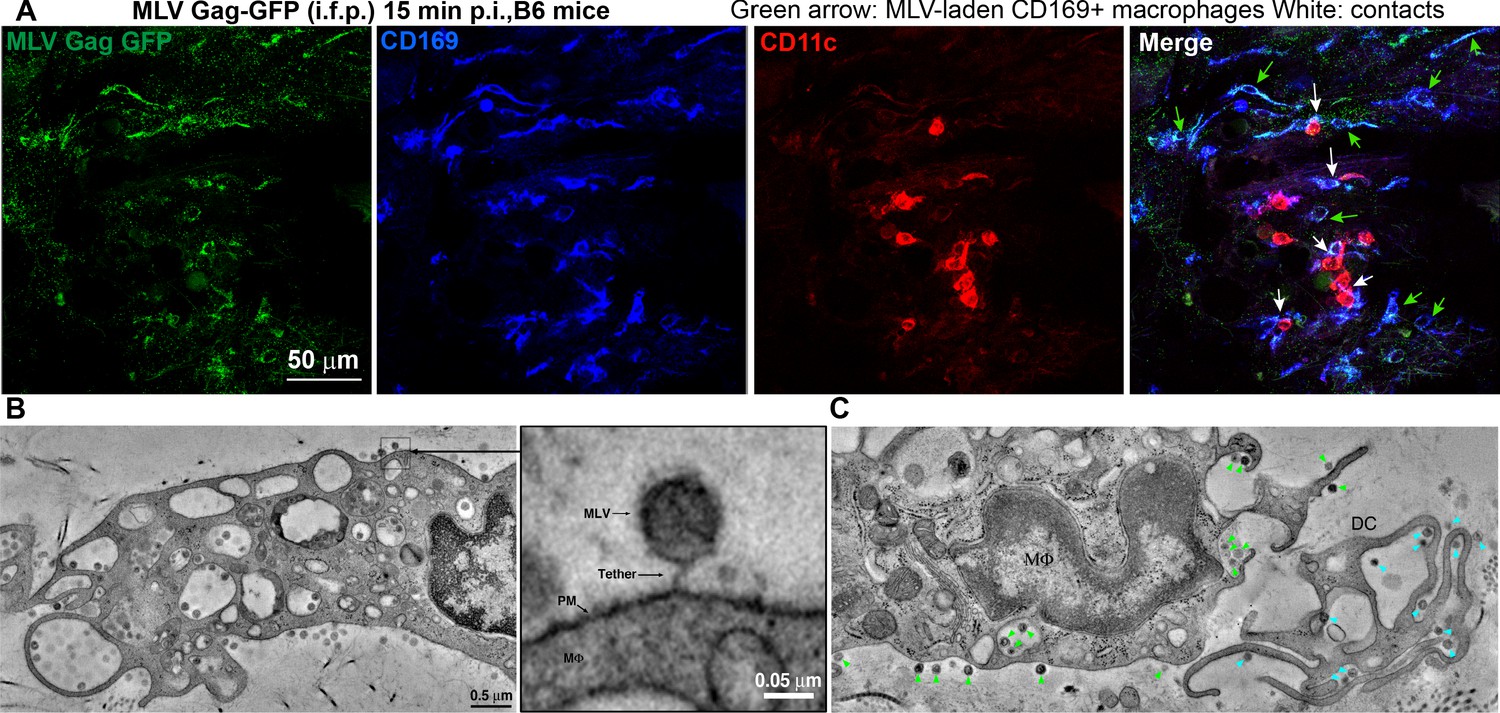
(A) Images of footpad cryosections from B6 mice 15 min after intrafootpad (i.f.p.) administration of murine leukemia virus (MLV) Gag-GFP virus particles (green). Macrophages and dendritic cells (DCs) were identified using antibodies to CD169 (blue) and CD11c (red), respectively. Green arrows denote MLV-laden CD169+ macrophages, and white arrows denote contacts between CD169+ macrophages and DCs. (B) Electron tomography of footpads from B6 mice prepared 15 min post-challenge with WT FrMLV. MLV virions can be seen associated with plasma membranes (PM) invaginations of macrophages (mΦ) as well as via a presumed CD169 tether in the magnified inset. (C) Electron tomography showing synaptic, MLV-containing contacts between macrophages and DCs in footpads of B6 mice at 15 min post-challenge (i.f.p.) WT FrMLV. Green arrowheads indicate macrophage-associated MLV particles, and blue arrowheads indicate DC-associated MLV particles. Scale bars as indicated.
Figure 4—figure supplement 1
Murine leukemia virus (MLV) primarily associates with sentinel macrophages in the footpad.
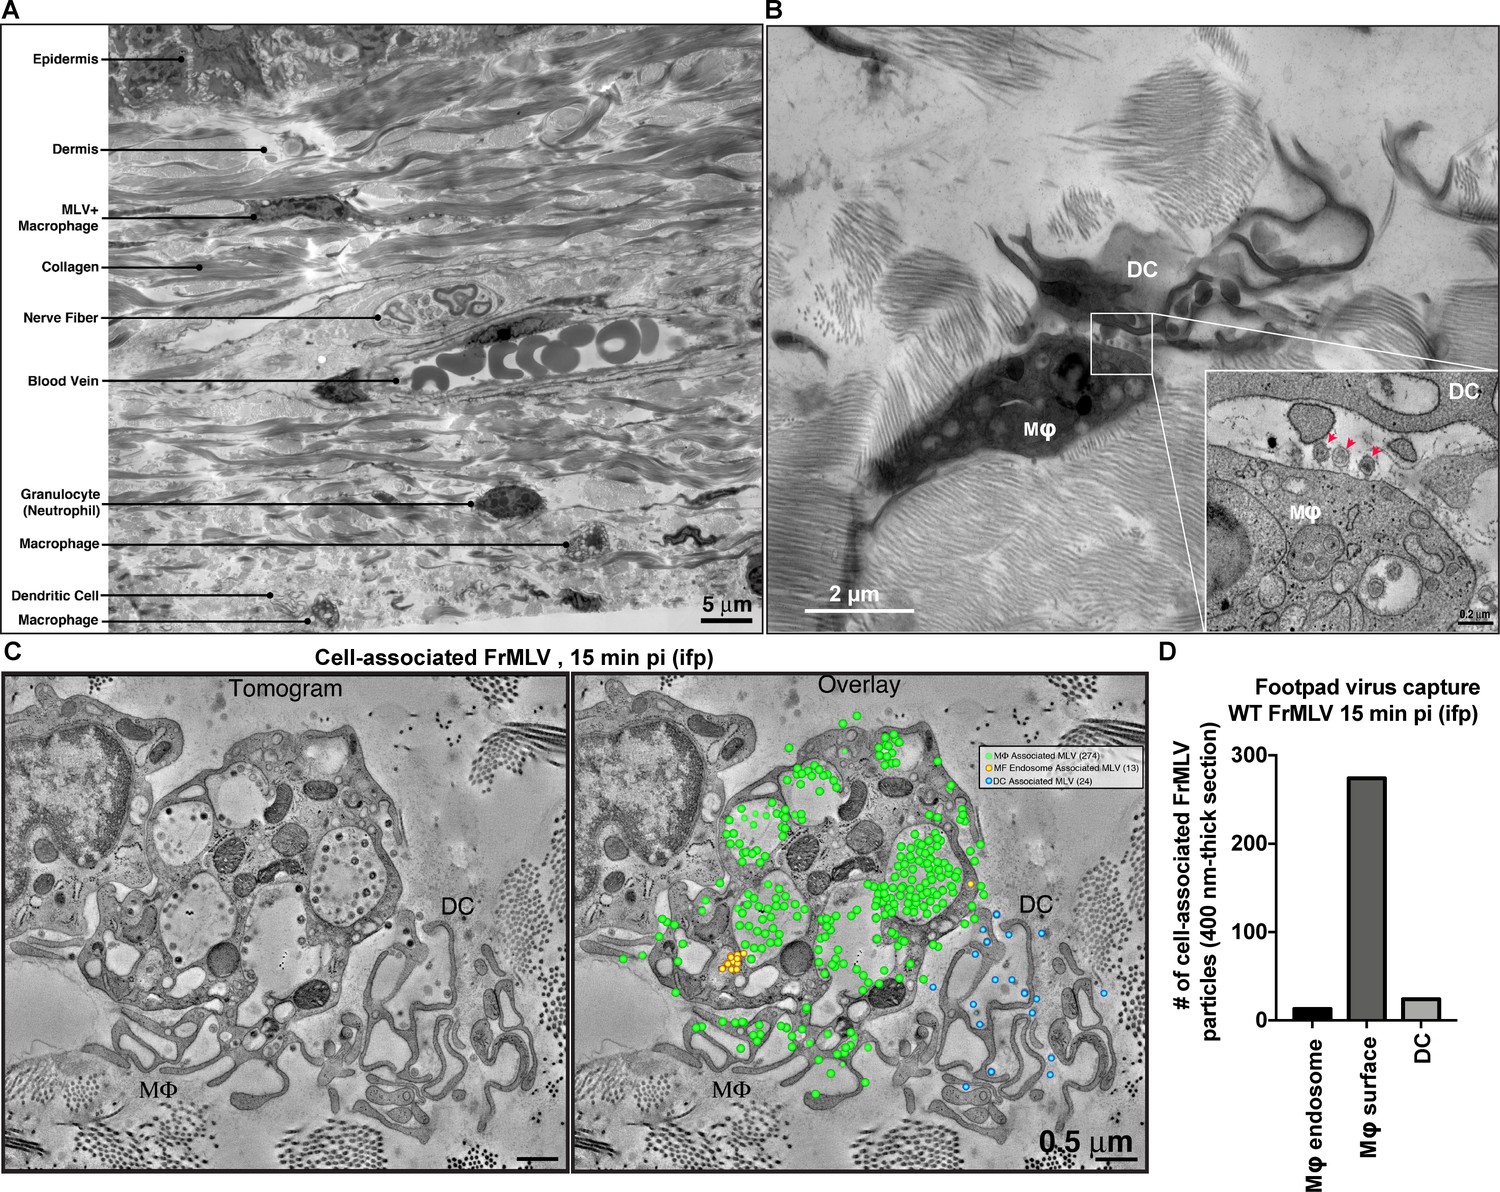
(A) Montaged EM overview of mouse footpad tissue in cross-section with resident structures and cell types labeled. (B) Overview image showing a macrophage (Mɸ) and dendritic cell (DC) in synaptic contact in footpads subcutaneously challenged with WT FrMLV (15 min post-challenge; intrafootpad [i.f.p.]). Inset: tomographic detail of the synapse zone between Mɸ and DC. Red arrows indicate three MLV particles associated with the macrophage cell surface. (C) Tomogram and quantification of MLV particles associated with each cell type in a synaptic contact 15 min post-challenge. Green dots indicate virus particles on the macrophage surface, yellow dots indicate virus particles present in macrophage endosomes, and blue dots indicate DC-associated viruses. The majority (287) of virus particles present in the volume are associated with the macrophage while few (24) are associated with the DC. (D) A graph showing quantification of FrMLV associated with macrophages and DCs for an experiment shown in (C). All cell-associated viruses within a 400-nm-thick section of footpad tissue were quantified. Scale bars as indicated.
Figure 4—video 1
Murine leukemia virus (MLV) is captured by footpad macrophages following subcutaneous virus challenge.
Mice were infected via the intrafootpad (i.f.p.) route with WT FrMLV. Footpads were processed for electron tomography at 15 min pi. Tomograms show MLV-capturing footpad macrophages. Captured, tethered virus particles are present in macrophage membrane invaginations.
Figure 5 with 1 supplement
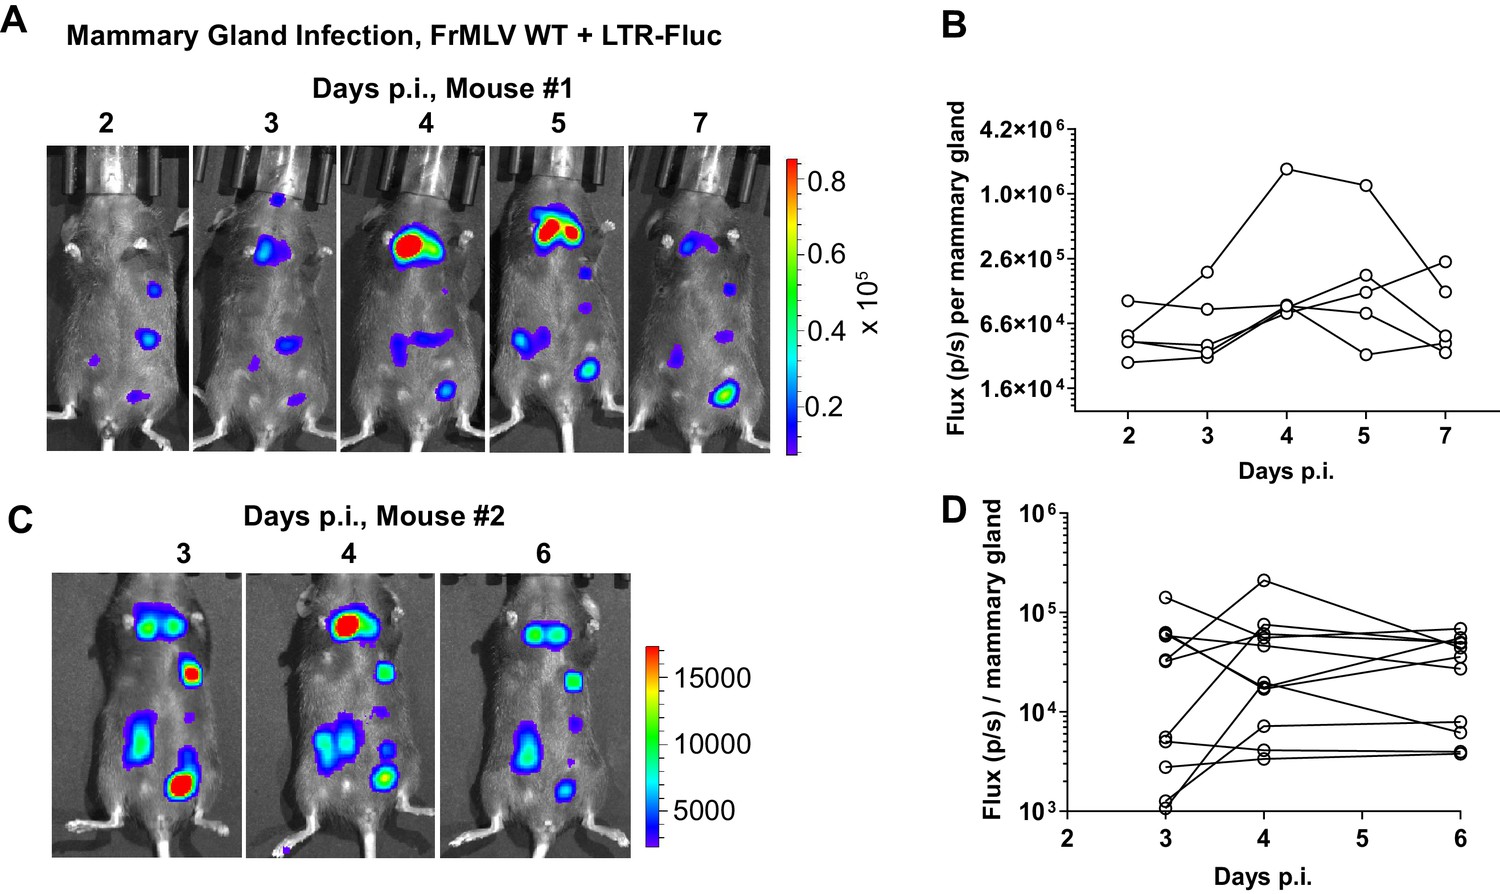
Visualization of murine leukemia virus (MLV) transmission from mother to offspring.
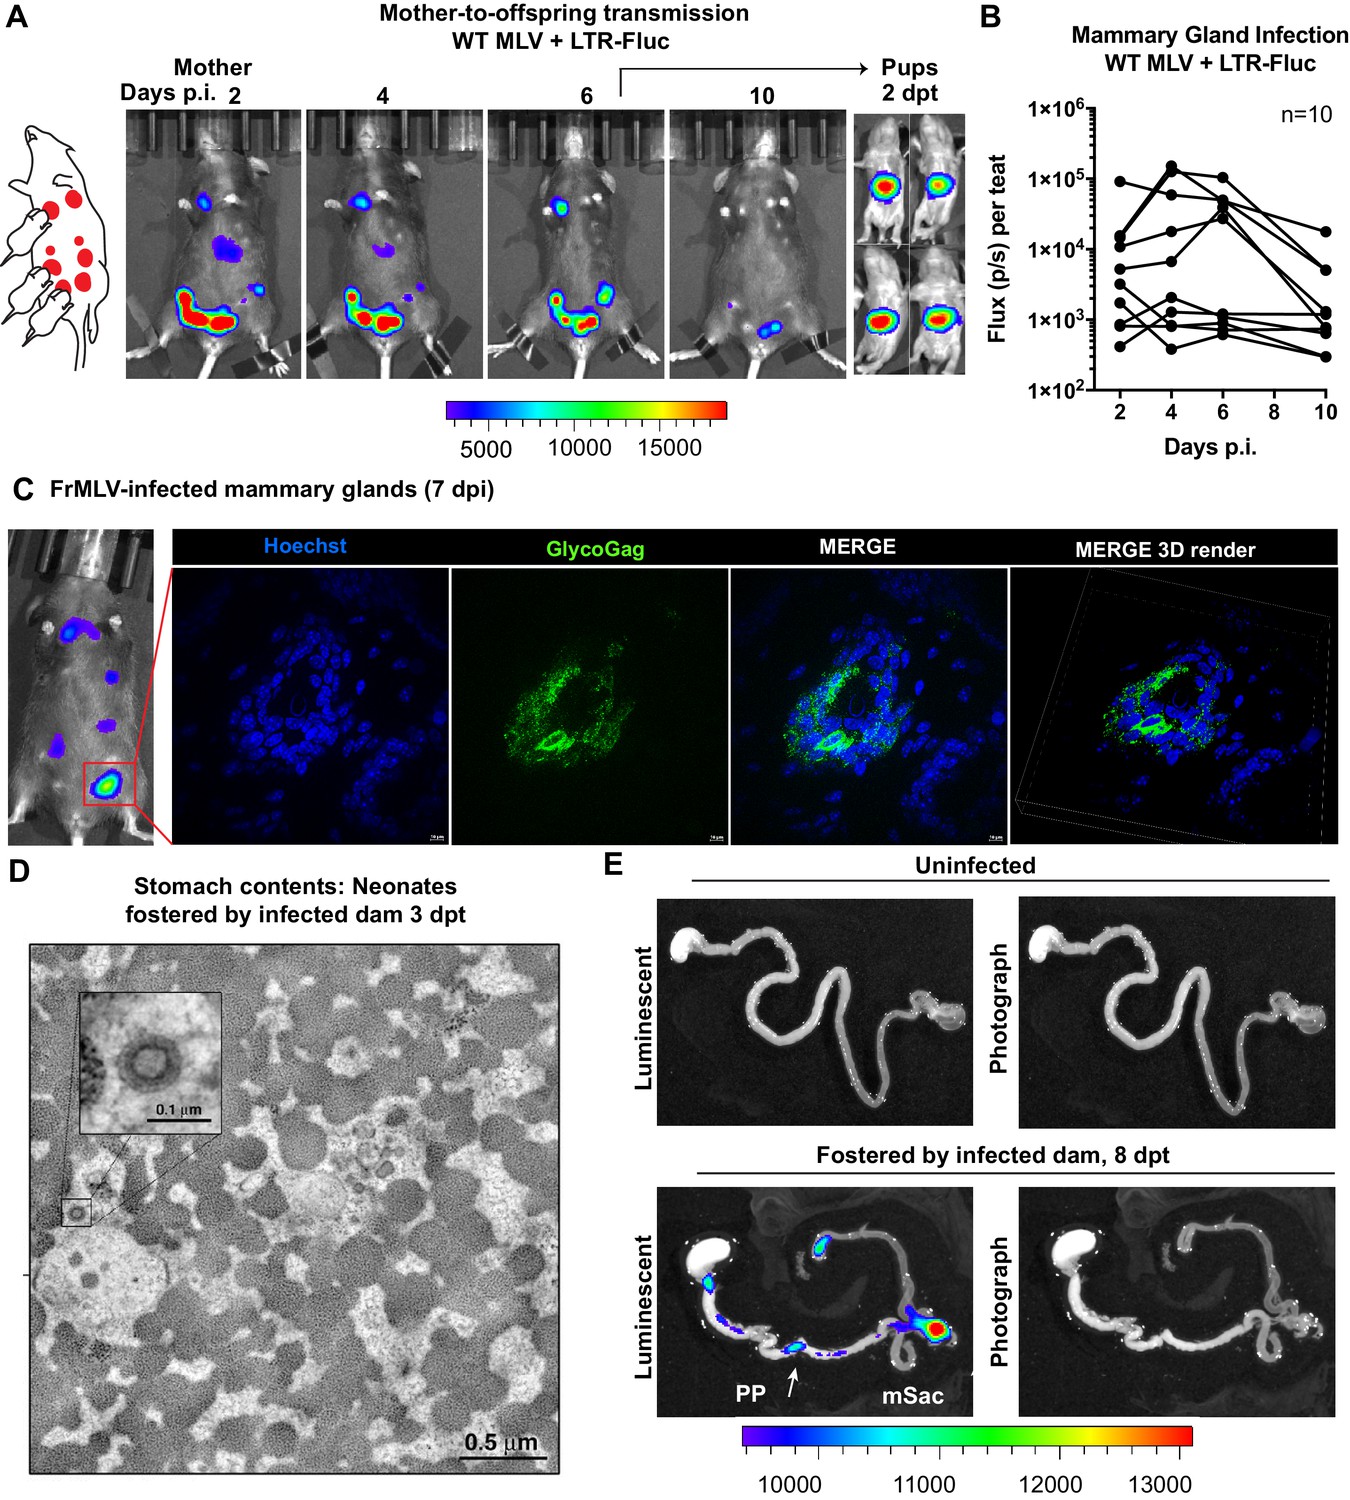
(A) A scheme showing MLV-infected dam fostering pups. 1 × 10⁷ IU of WT FrMLV carrying MLV LTR-Fluc were inoculated by distribution in mammary glands of a lactating dam. Virus replication in the dam was monitored longitudinally via NBLI. At 6 days post infection (dpi), neonatal mice from a separate litter were provided to foster and successful MLV transmission from dam to pups was visualized 2 days post-transfer (dpt) by NBLI. (B) Fluc activity indicating virus replication in infected teats was measured longitudinally and plotted as photon flux (p/s); flux from individual teats is shown. (C) Immunostained images of cryosections obtained from indicated mammary gland of a lactating dam infected as in (A) (7 dpi). MLV-infected epithelial cells (green) in the teats were identified using antibodies to MLV GlycoGag and nuclei were stained using Hoechst 3342 (blue). 3-D volume-rendered images were generated from z-planes images taken 0.3 µm apart. (D) Electron tomography of stomach contents at 3 dpt from an infected neonate for an experiment as in (A), revealing free viruses in the stomach. Inset: Details of a single cell-free MLV particle within the sample volume. Scale bars as indicated. (E) Merged luminescence and photographs gastrointestinal (GI) tract from an uninfected neonatal mouse or from a neonatal mouse that was allowed to feed for 8 days (8 dpt) from infected dam for an experiment as in (A) showing luminescent signal in Peyer’s patches (PP) and mesenteric LN (mLN). Scale bars shown for bioluminescence imaging denote radiance in photons per second per square centimeter per steradian (p/s/cm2/sr).
Figure 5—figure supplement 1
Murine leukemia virus (MLV) replication in mammary glands of infected, lactating dams.
(A, C) Lactating dams were infected subcutaneously in the mammary glands with FrMLV WT + LTR-Fluc (1 × 10⁷ IU) and monitored longitudinally via NBLI showing asynchronous replication of MLV in individual teats. Scale bars shown for bioluminescence imaging denote radiance in photons per second per square centimeter per steradian (p/s/cm2/sr). (B, D) Quantification of virus replication in individual teats from the experiment described in (A, C), displayed as photon flux (p/s).
Figure 6 with 1 supplement
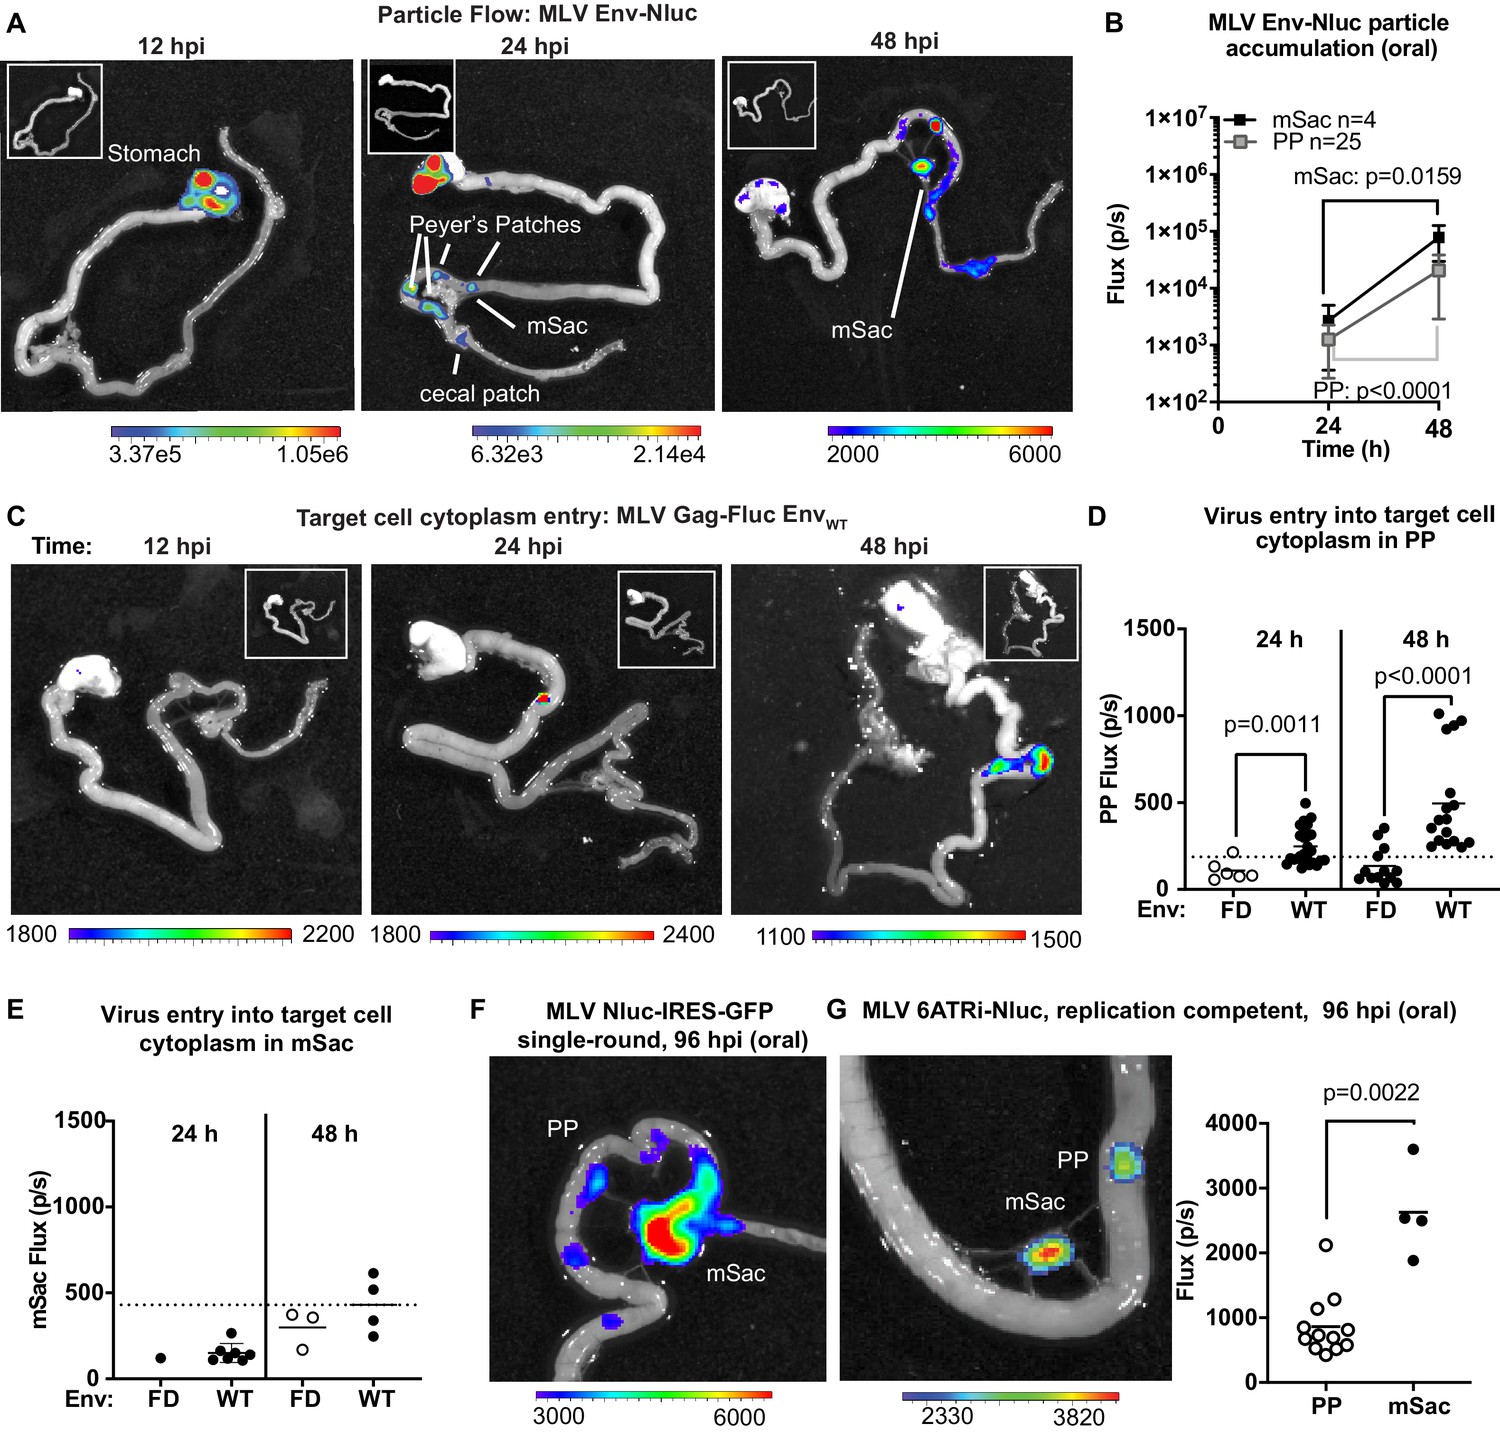
Real-time visualization of individual steps of retrovirus infection in vivo during oral challenge.
(A) Overlaid bioluminescence images of gastrointestinal tract from neonatal B6 mice orally challenged with 1 × 10⁶ IU of replication-defective, luciferase-labeled Env-Nluc murine leukemia virus (MLV) particles at 3 days of age. Mice were sacrificed at the indicated time points and their gastrointestinal tracts were subjected to bioluminescence imaging (BLI) for monitoring the sequential flow of incoming virus particles through stomach, and developing Peyer’s patches (PP), mesenteric sac (mSac), and cecal patch. (B) Temporal accumulation of orally challenged MLV Env-Nluc displayed as Flux (photons/s) for an experiment as in (A), in PP (n = 25) and mSacs (n = 4). Error bars denote standard deviation. (C) Overlaid bioluminescence images of gastrointestinal tract from neonatal B6 mice orally challenged with 2 × 10⁴ relative light units (RLU) of MLV Gag-Fluc EnvWT at 3 days of age. Mice were sacrificed at the indicated time points, and their gastrointestinal tracts were subjected to BLI for monitoring virus entry and access to target cell cytoplasm. (D, E) Quantification of MLV cytoplasmic entry at indicated times in PP (D; n = 6–19) and mSacs (F; n = 1–8) displayed as Flux (photons/s) from the experiment described in (C). Neonatal B6 mice orally challenged with 2 × 10⁴ RLU of MLV Gag-Fluc EnvFD were used as control. Dotted lines indicate three standard deviations above background (uninfected mice) means at each location. (F, G) Overlaid bioluminescence images of gastrointestinal tract from neonatal B6 mice orally challenged with 1 × 10⁶ IU of single-round MLV pMIG-Nluc-IRES-GFP (G) or full-length replication-competent MLV 6ATRi-Nluc at 3 days of age. Mice were sacrificed at 96 hr post infection, and their gastrointestinal tracts were subjected to BLI for visualizing infection in PP and mSacs. The plot shows quantification of signal at PP and mSac for an experiment as in accompanying image. p values were derived from non-parametric Mann–Whitney test; mean values are denoted by horizontal line. Scale bars shown for BLI denote radiance in photons per second per square centimeter per steradian (p/s/cm2/sr).
Figure 6—figure supplement 1
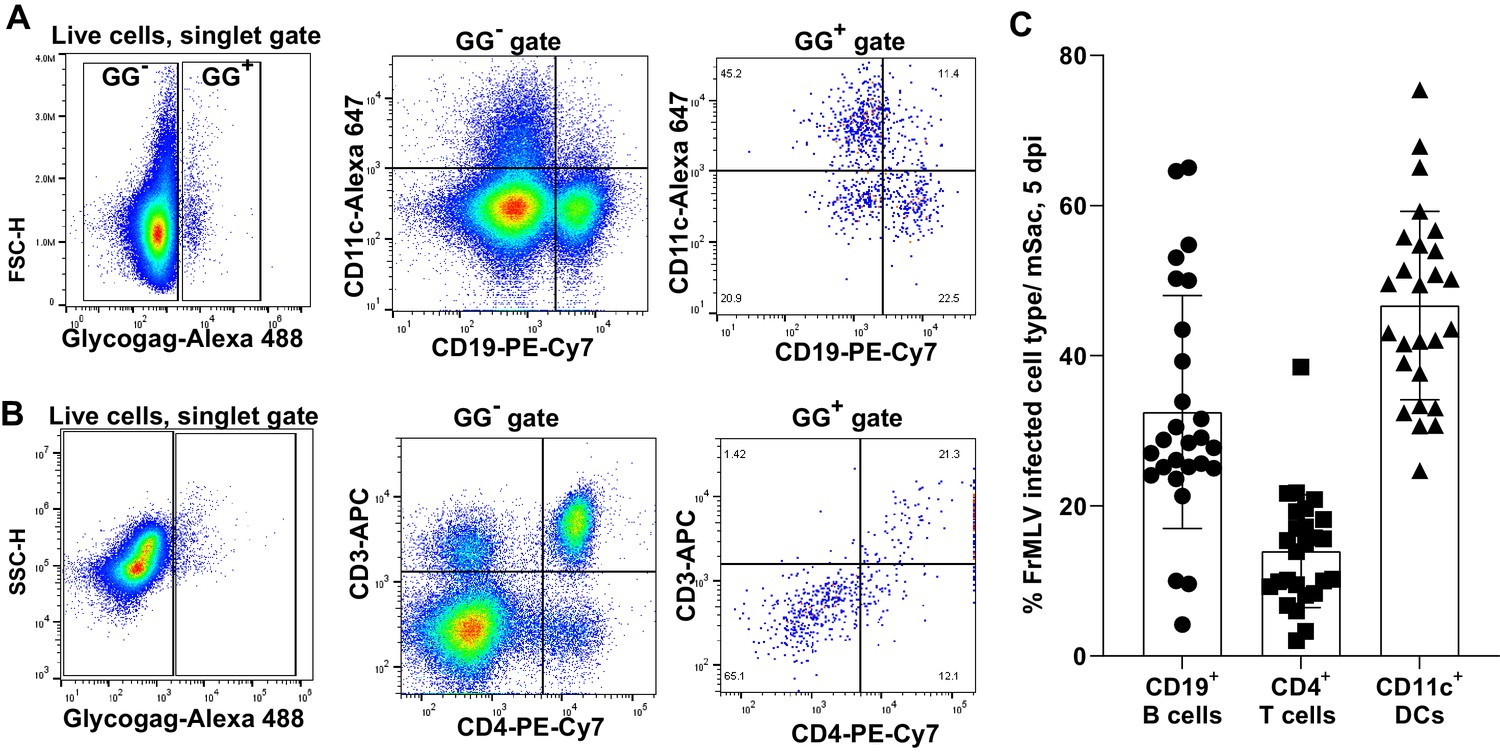
Characterization of infected cells in the mesenteric sacs (mSacs) of neonatal mice.
(A, B) Gating strategy and representative flow cytometry plots to characterize murine leukemia virus (MLV)-infected cells (GlycoGag+) using indicated antibodies in single-cell suspensions isolated from mSacs of neonatal mice orally challenged with WT FrMLV (1 × 10⁶ IU) at 5 days post infection. (C) A plot showing the percentages of FrMLV infected cells for an experiment as in (A) (n = 25; three litters).
Figure 7

Murine leukemia virus (MLV) infiltrates intestinal Peyer’s patches (PP) and can be found in endosomes of microfold (M) cells after oral challenge.
(A) Bioluminescence imaging (BLI) of gastrointestinal tract isolated from a neonatal B6 mice 48 hr after oral challenge with 1 × 10⁶ IU of MLV Env-Nluc at 3 days of age, showing luciferase-positive PP and mesenteric sac (mSac). Scale bars shown for BLI denote radiance in photons per second per square centimeter per steradian (p/s/cm2/sr) (B) EM tomogram and magnified insets of BLI-identified PP as in (A), showing MLV within endosomes of M cells. Scale bars as indicated.
Figure 8
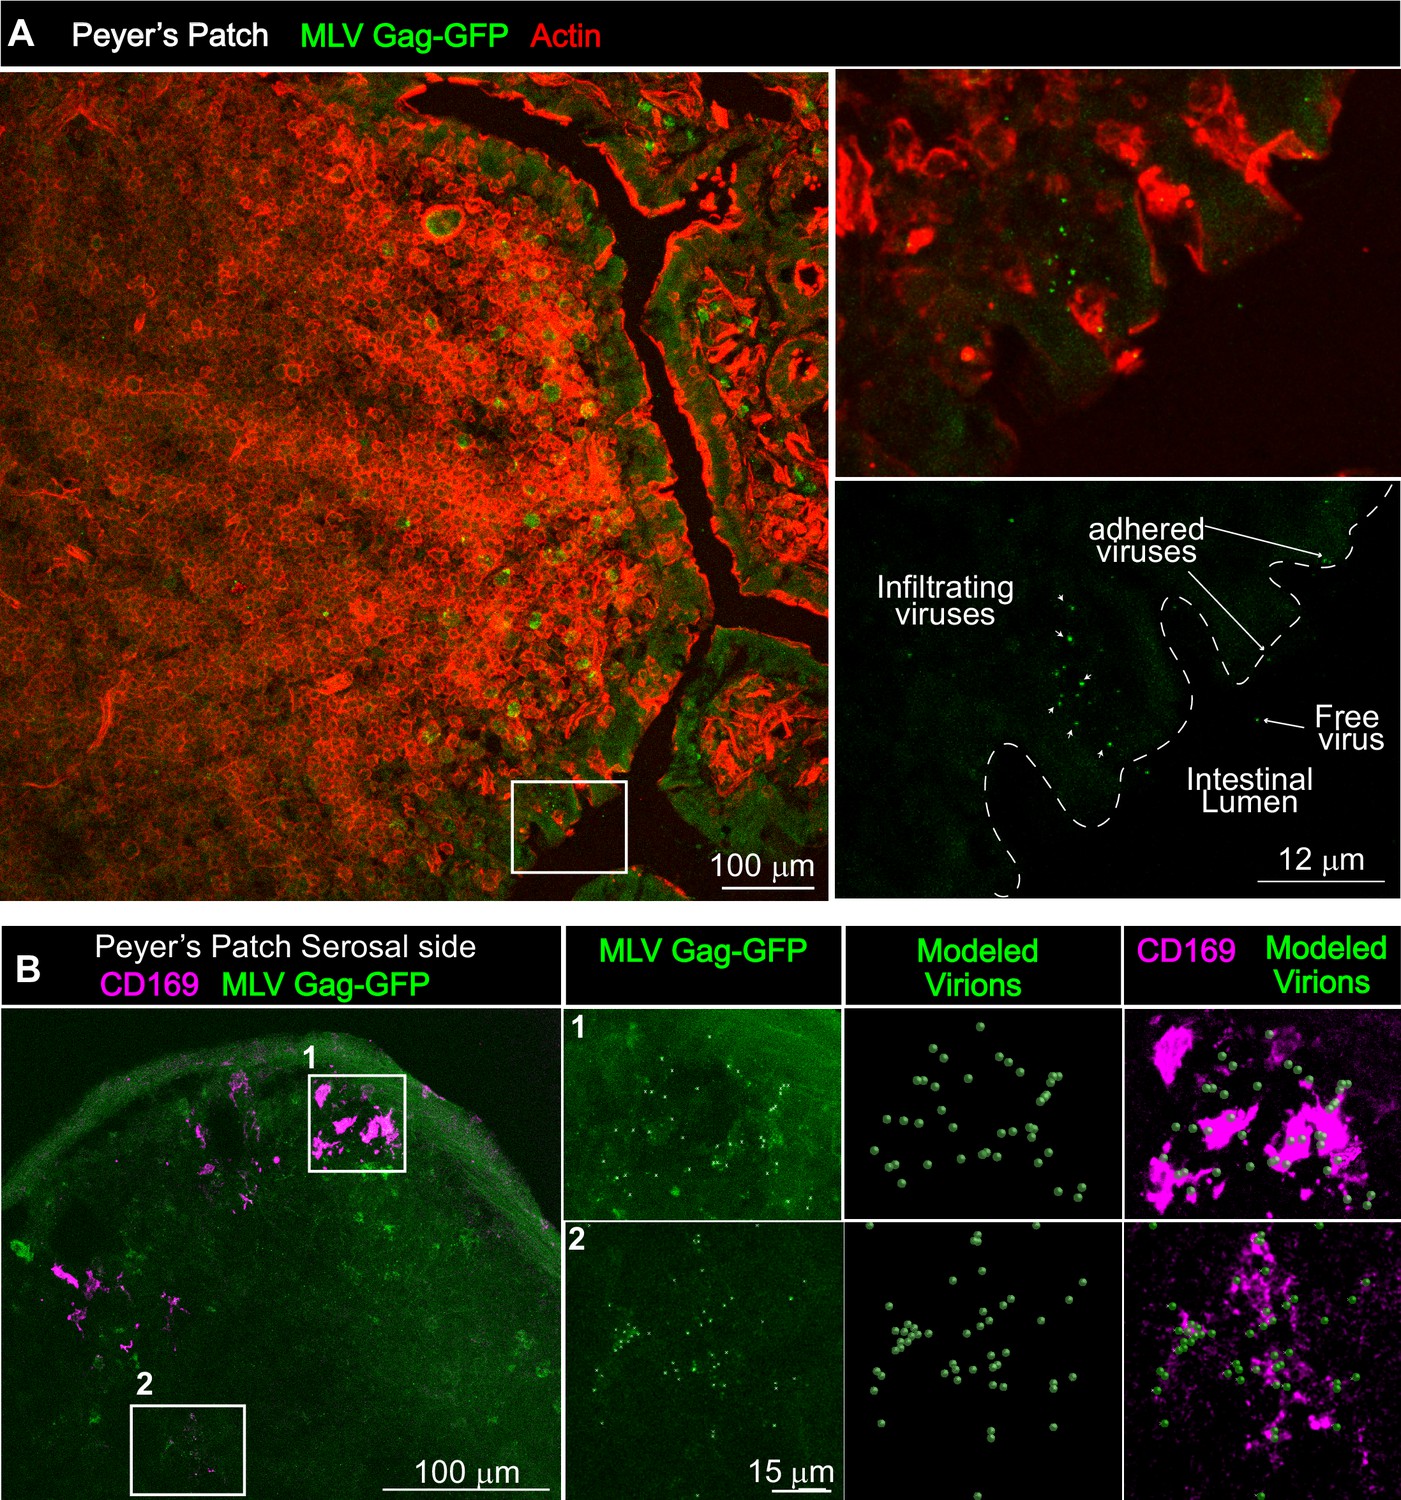
Gut-infiltrating murine leukemia virus (MLV) is captured by Peyer’s patch (PP)-resident CD169+ macrophages.
(A) Images of cryosections from ligated gut tissue containing a PP from B6 mice that was challenged for 1 hr with MLV Gag-GFP (green) corresponding to 1–4 × 10⁵ IU based on comparative western blot analyses with antibodies to Gag with equivalent amounts of WT FrMLV. Tissue sections were stained with phalloidin (red) to visualize actin in the PP tissue structure. Dotted lines demarcate the epithelium from intestinal lumen. Free, adhered, and infiltrating MLV Gag-GFP particles are as indicated with arrows. (B) Images of cryosections from PP for an experiment as in (A). Macrophages identified using antibodies to CD169 (magenta) were predominantly located at the serosal side of PP. MLV Gag-GFP (green) viruses within marked insets of PP were identified and modeled into spheres (modeled virions), which were then merged to depict close association with CD169+ macrophages. Scale bars as indicated.
Figure 9
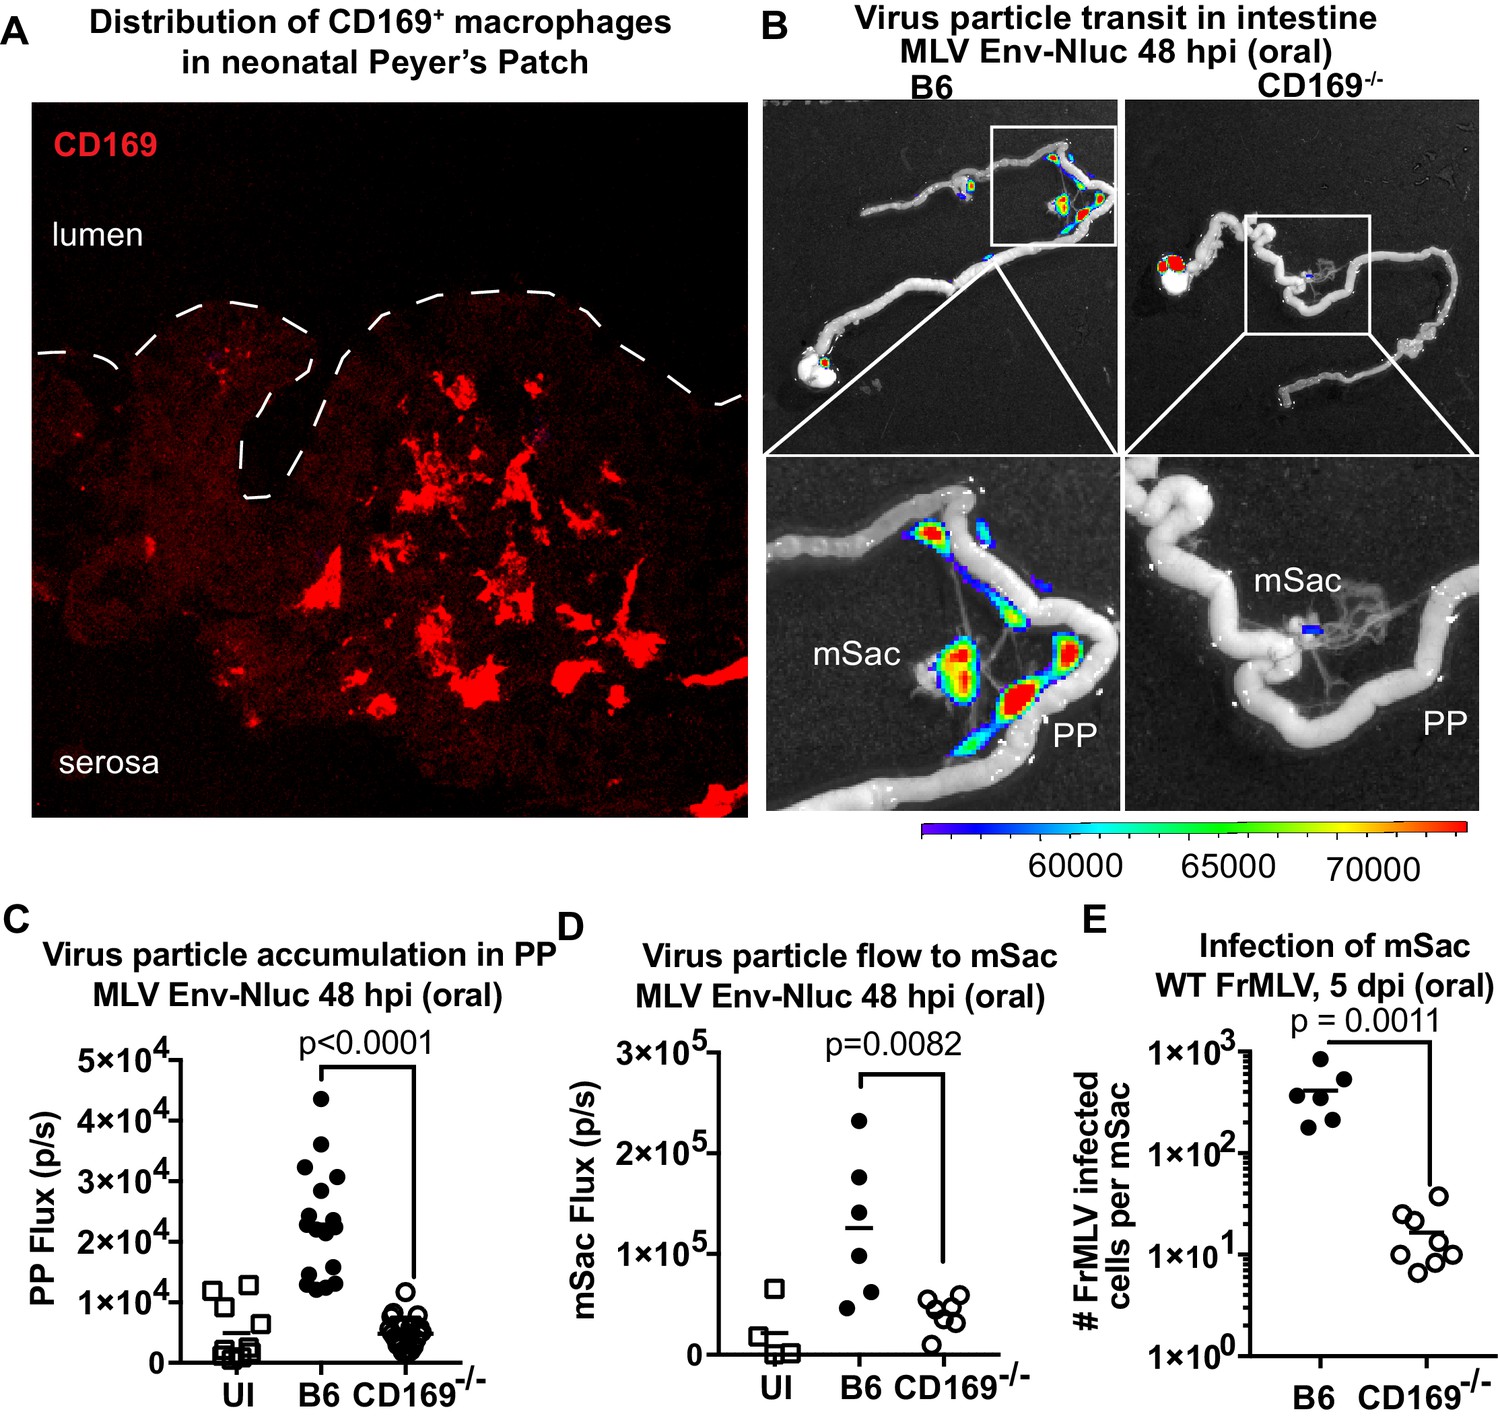
CD169 contributes to retrovirus particle acquisition and establishment of infection during oral challenge.
(A) Image of a Peyer’s patch (PP) cryosection from a 3-day-old neonatal B6 mouse. Macrophages in the developing follicle were identified using antibodies to surface marker CD169 (red), and dotted lines demarcate the epithelium from intestinal lumen. (B) Representative images of gastrointestinal tracts isolated from a neonatal B6 and CD169-/- mice 48 hr after oral challenge with 1 × 10⁶ IU of murine leukemia virus (MLV) Env-Nluc at 3 days of age to show comparative accumulation of bioluminescent viruses in PP and mesenteric sac (mSac). Scale bars shown for bioluminescence imaging denote radiance in photons per second per square centimeter per steradian (p/s/cm2/sr). (C, D) Quantification of virus transit to PP (C) and mSacs (D) at 48 hr post infection (hpi) in B6 and CD169-/- mice from the experiment described in (B). Virus transit was quantified as Nluc photon flux (photons/s). (E) FrMLV-infected cells 5 dpi (oral., 1 × 10⁶ IU) in mSac (n = 6–8) from neonatal B6 and CD169−/− mice challenged at 3 days of age. Single-cell suspensions of cells from individual mSacs were obtained at 5 dpi and processed for flow cytometry. Infection levels were determined using antibodies to FrMLV GlycoGag. p values derived from non-parametric Mann–Whitney test; mean values denoted by horizontal line.
Tables
Key resources table
| Reagent type (species) or resource | Designation | Source or reference | Identifiers | Additional information |
|---|---|---|---|---|
| Antibody | Fc block anti mouse-CD16/CD32 (Rat monoclonal) | BioLegend | Cat # 101302 RRID:AB_312801 | FACS (1:100) |
| Antibody | Anti-MLV Glycogag (mab34) (Rat monoclonal) | Santiago Lab/ Bruce Chesebro | Recognizes MLV GlycoGag | (1:2000) |
| Antibody | AF647 or A488 anti-MLV GlycoGag (mab34) (Rat monoclonal) | Purified from hybridoma | Antibody labeled using commercial kit | FACS (1:2000) IF (1:300 µl) |
| Antibody | PE/Cy7 anti-mouse CD19(6D5) (Rat monoclonal) | BioLegend | Cat # 115507 RRID:AB_313654 | FACS (1:1000) |
| Antibody | PE/Cy7 anti-mouse CD4 (GK1.5) (Rat monoclonal) | BioLegend | Cat # 100421 RRID:AB_312706 | FACS (1:1000) |
| Antibody | APC anti-mouse CD3(145–2 C11) (Hamster monoclonal) | BioLegend | Cat # 100312 RRID:AB_312677 | FACS (1:500) |
| Antibody | PE anti-mouse/human CD11b (M1/70) (Rat monoclonal) | BioLegend | Cat # 101208 RRID:AB_312791 | FACS (1:500) |
| Antibody | AF647 anti-mouse CD169 (3D6.112) (Rat monoclonal) | BioLegend | Cat # 142407 RRID:AB_2563620 | FACS (1:500) |
| Antibody | AF594 anti-mouse CD169 (3D6.112) (Rat monoclonal) | BioLegend | Cat # 142416 RRID:AB_2565620 | IF (1 in 300 µl) |
| Antibody | AF647 anti-mouse CD11c (N418) (Hamster monoclonal) | BioLegend | Cat # 117314 RRID:AB_492850 | FACS (1:500) |
| Antibody | APC Rat anti-mouse CD45 (30-F11) (Rat monoclonal) | BD-Pharmingen | Cat # 559864 RRID:AB_398672 | FACS (1:500) |
| Antibody | Alexa Fluor 594 anti-mouse CD11c Antibody (Hamster monoclonal) | BioLegend | Cat # 117346 RRID:AB_2563323 | IF (1 in 300 µl) |
| Antibody | APC-Cy7 anti-mouse CD11c (N418) (Hamster monoclonal) | BioLegend | Cat #117324 RRID:AB_830649 | FACS (1:500) |
| Chemical compound, drug | Liberase TL Research Grade | Sigma-Aldrich | Cat# 5401020001 | 0.2 mg/ml |
| Chemical compound, drug | DNAse I recombinant, RNAse-free | Roche | Ref # 04716728001 | 20 μg/ml |
| Chemical compound, drug | RBC Lysis Buffer (10X) | BioLegend | Cat # 420301 | |
| Chemical compound, drug | Bovine serum albumin (BSA) | Sigma-Aldrich | Cat# A9647-100G CAS: 9048-46-8 | |
| Chemical compound, drug | Accutase | BioLegend | Cat # 423201 | |
| Chemical compound, drug | Gelatin (Teleostean gelatin) Type A | Sigma-Aldrich | Cat # G7041 CAS: 9000-70-8 | |
| Chemical compound, drug | Triton-X 100 t-octyl phenoxy polyethoxyethanol | American Bioanalytical | Cat # AB02025-00500 CAS: 9002-93-1 | |
| Chemical compound, drug | L-lysine Monohydrochloride | Sigma-Aldrich | Cat # L1262 | |
| Chemical compound, drug | Sodium (meta)periodate | Sigma-Aldrich | Cat # 30323–100G CAS: 7790-28-5 | |
| Chemical compound, drug | Tissue-Tek O.C.T Compound | Sakura | Cat # 4583 | |
| Chemical compound, drug | Fc receptor blocker | Innovex | Cat # NB335-5 | |
| Chemical compound, drug | ProLong Gold antifade reagent | Invitrogen | Cat # P36934 | |
| Chemical compound, drug | Glutaraldehyde | Electron Microscopy Sciences | Cat # 16220 CAS: 111-30-8 | |
| Chemical compound, drug | Sodium cacodylate trihydrate | Electron Microscopy Sciences | Cat #12300 | |
| Chemical compound, drug | Ficoll | Sigma-Aldrich | Cat #F2878-100g | |
| Chemical compound, drug | Osmium tetroxide | Electron Microscopy Sciences | Cat #19110 | |
| Chemical compound, drug | Uranyl acetate | Electron Microscopy Sciences | Cat #22400 | |
| Chemical compound, drug | Acetone, EM-Grade, Glass-Distilled | Electron Microscopy Sciences | Cat #10015 | |
| Chemical compound, drug | Epon-Araldite resin | Electron Microscopy Sciences | Cat #13940 | |
| Chemical compound, drug | Lead citrate | Electron Microscopy Sciences | Cat #17800 CAS: 512-26-5 | |
| Chemical compound, drug | Gold beads (10 nm) | Ted Pella, Inc | Cat. #15703-1 | |
| Chemical compound, drug | Dimethyl sulfoxide (DMSO) | Sigma-Aldrich | Cat # D2650-5X5ML CAS: 67-68-5 | |
| Chemical compound, drug | Sodium azide | Sigma-Aldrich | Cat # S-8032 EC No: 247-852-1 | |
| Chemical compound, drug | Passive lysis buffer (5X) | Promega | Cat # E194A | |
| Chemical compound, drug | D-Luciferin, Potassium Salt (Proven and Published) | Gold Biotechnology | Cat #LUCK-3G | 15 mg/ml solution 5 µl/g body weight |
| Chemical compound, drug | Hoechst 33342 | Invitrogen | Cat # H3570 | |
| Commercial assay or kit | Mix-n-Stain CF 488A Antibody Labeling Kit (50–100 μg) | Sigma-Aldrich | Cat # MX488AS100 SIGMA | |
| Commercial assay or kit | Mix-n-Stain CF 647 Antibody Labeling Kit (50–100 μg) | Sigma-Aldrich | Cat # MX647S100 SIGMA | |
| Commercial assay or kit | Nano-Glo Luciferase Assay System | Promega | Cat # N1120 | Diluted (1:40) in 1X PBS, 5 µl/g body weight |
| Commercial assay or kit | KAPA SYBR FAST qPCR Master Mix (2X) Kit | KAPA Biosystems | Cat # KK4600 and KK4601 | |
| Commercial assay or kit | RNeasy Mini Kit (50) | Qiagen | Cat #/ID 74104 | |
| Commercial assay or kit | Gibson Assembly Kit | NEB | Cat #E5520S | |
| Commercial assay or kit | iQ Multiplex Powermix | Bio-Rad | Cat # 1725848 | |
| Commercial assay or kit | iScript cDNA Synthesis Kit | Bio-Rad | Cat # 95047-100 | |
| Cell line (Homo sapiens) | HEK293 | ATCC | Cat # CRL-1573 RRID:CVCL_0045 | |
| Cell line (Gallus gallus domesticus) | DFJ8 | Mothes Lab | From Jim Cunningham, Dana Farber; target cells for determining MLV titer | |
| Sequence-based reagent | Nluc_F | This work, Figure 2 | PCR primers | GGAGGTGTGTCCAGTTTGTT |
| Sequence-based reagent | Nluc_R | This work, Figure 2 | PCR primers | ATGTCGATCTTCAGCCCATTT |
| Sequence-based reagent | FrMLV Gag_ F | This work, Figure 2 | PCR primers | GAGAGAGGGGAGGTTTAGGGT |
| Sequence-based reagent | FrMLV Gag_ R | This work, Figure 2 | PCR primers | AAGGCGCTGGGTTACATTCT |
| Recombinant DNA reagent | pLRB303-FrMLV-6ATRI-Nluc | This work, Figures 1, 2, 3 , 6 and 9 | Mothes Lab, used for monitoring virus replication and dissemination; see Materials and methods | |
| Recombinant DNA reagent | pLRB303-FrMLV-Env-PRR-Nluc | This work, Figure 1 | Mothes Lab, used for monitoring virus particle flow; see Materials and methods | |
| Recombinant DNA reagent | pLRB303-FrMLV-Gag-Fluc-Envwt | This work, Figures 1, 2, 3 and 6 | Mothes Lab, used for monitoring virus fusion; see Materials and methods | |
| Recombinant DNA reagent | pLRB303-FrMLV-Gag-Fluc-EnvFD (SFFV gp55) | This work, Figures 1, 2, 3 and 6 | Mothes Lab, control for monitoring virus fusion; see Materials and methods | |
| Recombinant DNA reagent | pLRB303-FrMLV-Gag-GFP | Mothes Lab Sewald et al., 2015 | Mothes Lab, for labeling and visualizing MLV virions | |
| Recombinant DNA reagent | pcDNA3.1 FrMLV Env PRR-Nluc | This work Figures 1, 2, 3, 6, 7 and 9 | Mothes Lab, used for monitoring virus particle flow; see Materials and methods | |
| Recombinant DNA reagent | pMIG-Antares | This work, Figure 2 | Mothes Lab, for co-packaging Antares reporter in MLV; see Materials and methods | |
| Recombinant DNA reagent | pGL4.32[luc2P NF-kB-RE] | Promega, Madison, WI | Cat # E8491 | Template to amplify Fluc |
| Recombinant DNA reagent | pNL1.1 | Promega, Madison, WI | RRID:Addgene_141285 | Template to amplify Nluc |
| Recombinant DNA reagent | pMMP-LTR-GFP | Mothes Lab | From Jim Cunningham, Dana Farber; for co-packaging GFP reporter in MLV | |
| Recombinant DNA reagent | pMIG-Nluc-IRES-GFP | Mothes Lab Ventura et al., 2019 | ||
| Recombinant DNA reagent | pMIG-Fluc-IRES-mCherry | Addgene | RRID:Addgene_75020 | |
| Recombinant DNA reagent | pNCS-Antares | Addgene | RRID:Addgene_74279 | |
| Recombinant DNA reagent | pMIG-w | Addgene | RRID:Addgene_12282 | |
| Software, algorithm | Accuri CSampler | BD Biosciences | RRID:SCR_014422 | Analyses of flow cytometric data |
| Software, algorithm | FlowJo | Treestar | RRID:SCR_008520 | Analyses of flow cytometric data |
| Software, algorithm | Nikon-Elements AR Analysis v4.13 and Acquisition v4.5 | Nikon | Image analyses | |
| Software, algorithm | CFX Maestro | Bio-Rad Inc | RRID:SCR_017251 | qPCR analyses |
| Software, algorithm | Living Image v4.7.3 | PerkinElmer | RRID:SCR_014247 | Analyzes software for bioluminescence imaging |
| Software, algorithm | GraphPad Prism v9.0.1 | GraphPad Software | RRID:SCR_002798 | https://www.graphpad.com/ |
| Software, algorithm | IMOD | David N. Mastronarde, University of Colorado Boulder | RRID:SCR_003297 | https://bio3d.colorado.edu/imod/ |
| Software, algorithm | SerialEM | David N. Mastronarde, University of Colorado Boulder | RRID:SCR_017293 | https://bio3d.colorado.edu/SerialEM/ |
| Other | TriStar LB 941 Multimode Microplate Reader and Luminometer | Berthold Technologies GmbH and Co. KG | ||
| Other | BD Biosciences C6 Accuri Flow Cytometer | BD Biosciences | RRID:SCR_019591 | Flow cytometer |
| Other | PerkinElmer IVIS Spectrum In-Vivo Imaging System | PerkinElmer | RRID:SCR_018621 | Yale University ABSL-3 and ABSL-2 facility |
| Other | XGI-8 Gas Anesthesia System | Perki Elmer | Yale University ABSL-3 and ABSL-2 facility | |
| Other | Leica Cryostat CM1950 | Leica | RRID:SCR_018061 | CM1950 (Akiko Iwasaki Lab) |
| Other | Nikon CSU-W1 Spinning Disk Confocal microscope | Nikon Instruments Inc, Americas | Yale West Campus Imaging Core | |
| Other | Leica TCS DMi8 SP8 microscope | Leica | CCMI Yale Central Facility | |
| Other | Transmission electron microscope | Tecnai | TF30ST-FEG | |
| Other | C1000 Touch thermal cycler | Bio-Rad | Cat # 1851148 | PCR machine |
| Other | CFX Connect Real-Time PCR Detection System | Bio-Rad | Cat # 1855201 | Real-time PCR machine |
Additional files
Download links
A two-part list of links to download the article, or parts of the article, in various formats.
Downloads (link to download the article as PDF)
Open citations (links to open the citations from this article in various online reference manager services)
Cite this article (links to download the citations from this article in formats compatible with various reference manager tools)
In vivo imaging of retrovirus infection reveals a role for Siglec-1/CD169 in multiple routes of transmission
eLife 10:e64179.
https://doi.org/10.7554/eLife.64179


