Estimating SARS-CoV-2 seroprevalence and epidemiological parameters with uncertainty from serological surveys
- Department of Computer Science, University of Colorado Boulder, United States
- BioFrontiers Institute, University of Colorado Boulder, United States
- Department of Statistics, Colorado State University, United States
- Department of Applied Mathematics, University of Colorado Boulder, United States
- IQ Biology Program, University of Colorado Boulder, United States
- Department of Immunology and Infectious Diseases, Harvard T.H. Chan School of Public Health, United States
- Department of Ecology and Evolutionary Biology and the Woodrow Wilson School, Princeton University, United States
- Department of Epidemiology, Harvard T.H. Chan School of Public Health, United States
- Center for Communicable Disease Dynamics, Harvard T.H. Chan School of Public Health, United States
Figures
Figure 1
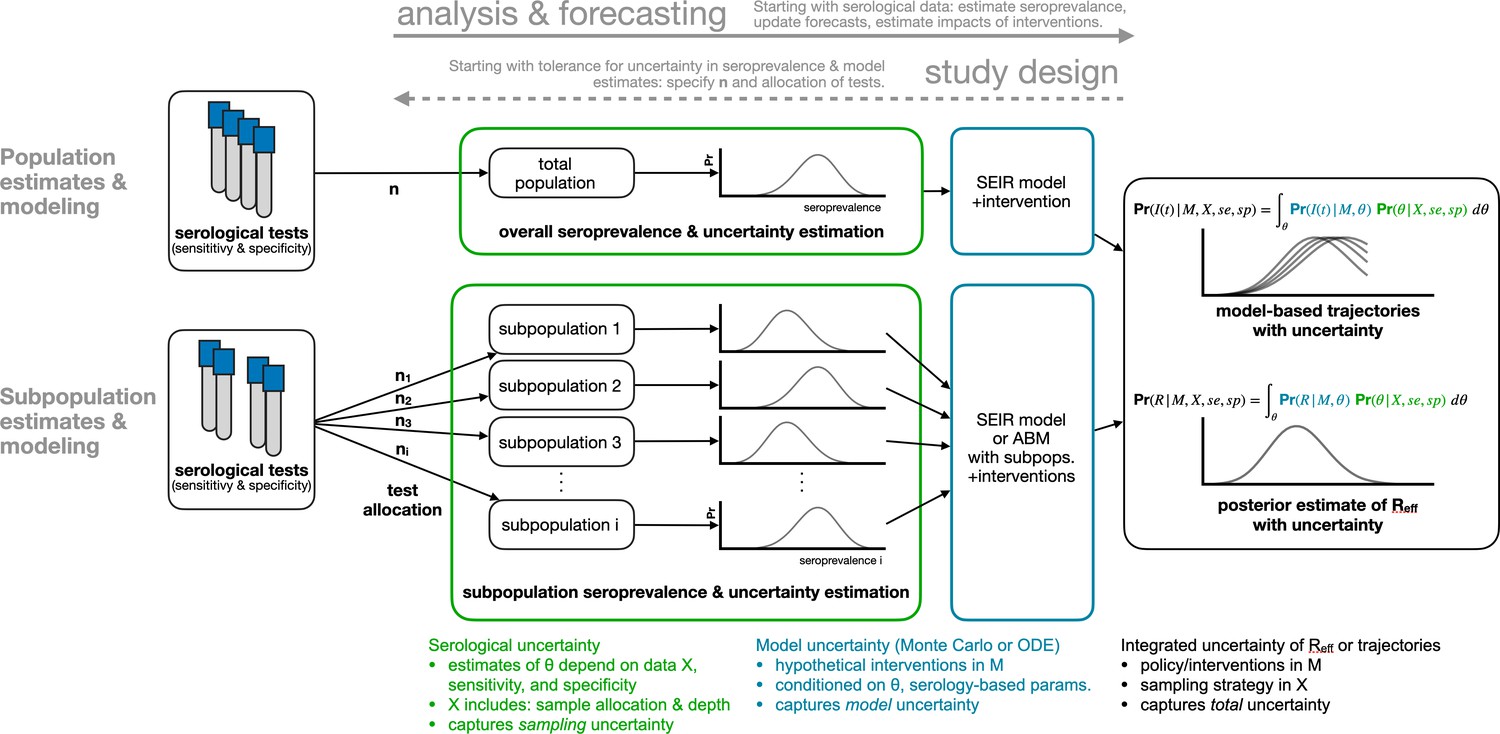
Framework for estimating seroprevalence and epidemiological parameters and the associated uncertainty, and for designing seroprevalence studies.
Figure 2 with 1 supplement

Uncertainty of population seroprevalence estimates as a function of number of samples and true population rate.
Uncertainty, represented by the width of 95% credible intervals, is presented as ± seroprevalence percentage points in (A) a contour plot and (B) for selected seroprevalence values, based on a serological test with 90% sensitivity and >99.9% specificity (Figure 2—figure supplement 1 depicts results for other sensitivity and specificity values). In total, 5000 samples are sufficient to estimate any seroprevalence to within a worst-case tolerance of ±1.4 percentage points (e.g., 20% ± 1.4% = [18.6%, 21.4%]), even with the imperfect test studied. Each point or pixel is averaged over 250 stochastic draws from the specified seroprevalence with the indicated sensitivity and specificity.
Figure 2—figure supplement 1

Uncertainty of population seroprevalence estimates as a function of number of samples and true population rate.
Uncertainty, represented by the width of 95% credible intervals, is presented as ± seroprevalence percentage points in contour plots and for selected seroprevalence values, ranging from 1% to 50%, based on a serological test with (A, B) 96.6% sensitivity and >99.9% specificity, matching the claims of the Roche IgG test (U.S. Food and Drug Administration, 2021), (C, D) 95.0% sensitivity and >99.9% specificity, matching the claims of the Abbott Architect IgG test (U.S. Food and Drug Administration, 2021), and (E, F) 100% sensitivity and specificity, representing an ideal test, complementing the results for a test with 90% sensitivity and >99.9% specificity, matching the claims of the Euroimmun IgG test (U.S. Food and Drug Administration, 2021) shown in Figure 2. See Supplementary file 1 for details on serological test kits.
Figure 3 with 1 supplement
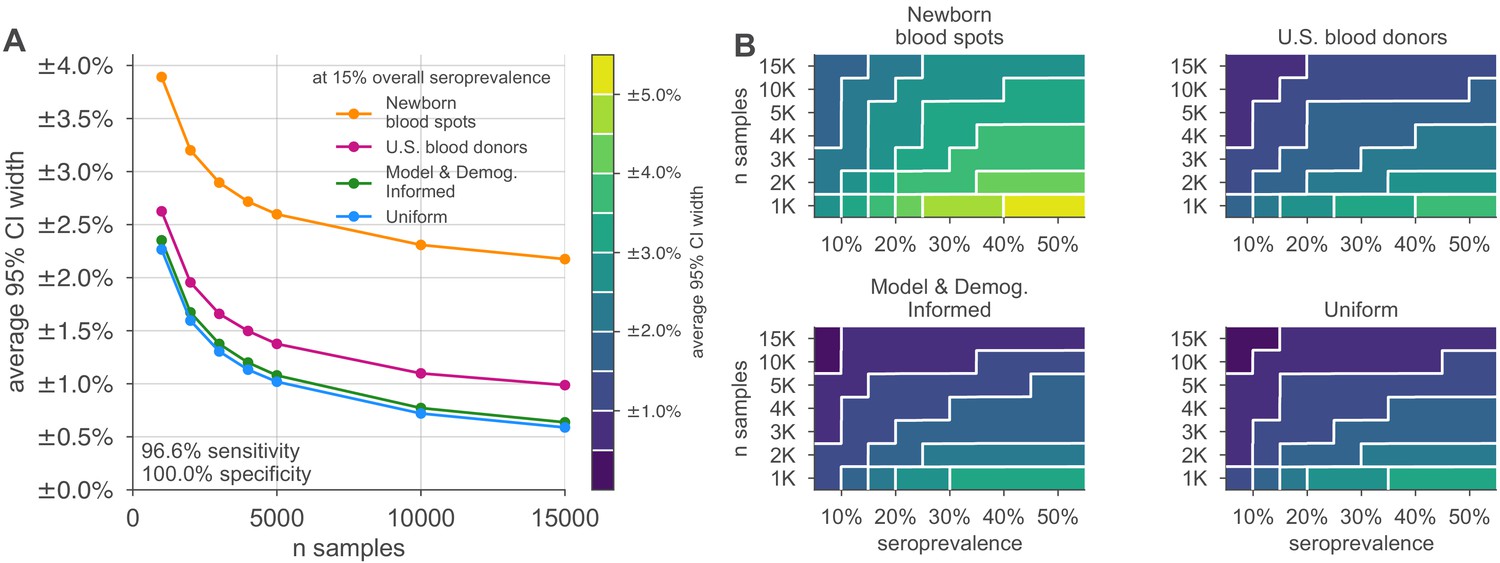
Uncertainty of overall seroprevalence estimates from convenience and formal sampling strategies.
Uncertainty, represented by the width of 95% credible intervals, is presented as ± seroprevalence percentage points, based on a serological test with 90% sensitivity and >99.9% specificity (Figure 3—figure supplement 1 depicts results for other sensitivity and specificity values). (A) Curves show the decrease in average CI widths for 15% seroprevalence, illustrating the advantages of using uniform and model and demographics informed (MDI) samples over convenience samples. (B) Contour plots show average CI widths for various total sample counts and overall seroprevalence ranging from 5% to 50%. Convenience samples derived from newborn blood spots (reflecting the age demographics of mothers) or U.S. blood donors improve with additional sampling but retain baseline uncertainty due to demographics not covered by the convenience sample. For the estimation of overall seroprevalence, uniform sampling is marginally superior to this example of the MDI sampling strategy, which was designed to optimize estimation of the effective reproductive number . Each point or pixel is averaged over 250 stochastic draws from the specified seroprevalence with the indicated sensitivity and specificity.
Figure 3—figure supplement 1

Uncertainty of overall seroprevalence estimates from convenience and formal sampling strategies.
Uncertainty, represented by the width of 95% credible intervals, is presented as ± seroprevalence percentage points, based on a serological test with (A, B) 96.6% sensitivity and >99.9% specificity, matching the claims of the Roche IgG test (U.S. Food and Drug Administration, 2021), (C, D) 95.0% sensitivity and >99.9% specificity, matching the claims of the Abbott Architect IgG test (U.S. Food and Drug Administration, 2021), and (E, F) 100% sensitivity and specificity, representing an ideal test, complementing the results for a test with 90% sensitivity and >99.9% specificity, matching the claims of the Euroimmun IgG test (U.S. Food and Drug Administration, 2021) shown in Figure 3. (A, C, E) Curves show the decrease in average CI widths for 15% seroprevalence, illustrating the advantages of using uniform and model and demographics informed (MDI) samples over convenience samples. (B, D, F) Contour plots show average CI widths for various total sample counts and overall seroprevalence. Convenience samples derived from newborn blood spots or U.S. blood donors improve with additional sampling but retain baseline uncertainty due to demographics not covered by the convenience sample. For the estimation of overall seroprevalence, uniform sampling is marginally superior to this example of the MDI sampling strategy, which was designed to optimize estimation of . Each point or pixel is averaged over 250 stochastic draws from the specified seroprevalence, ranging from 5% to 50%, with the indicated sensitivity and specificity.
Figure 4 with 1 supplement
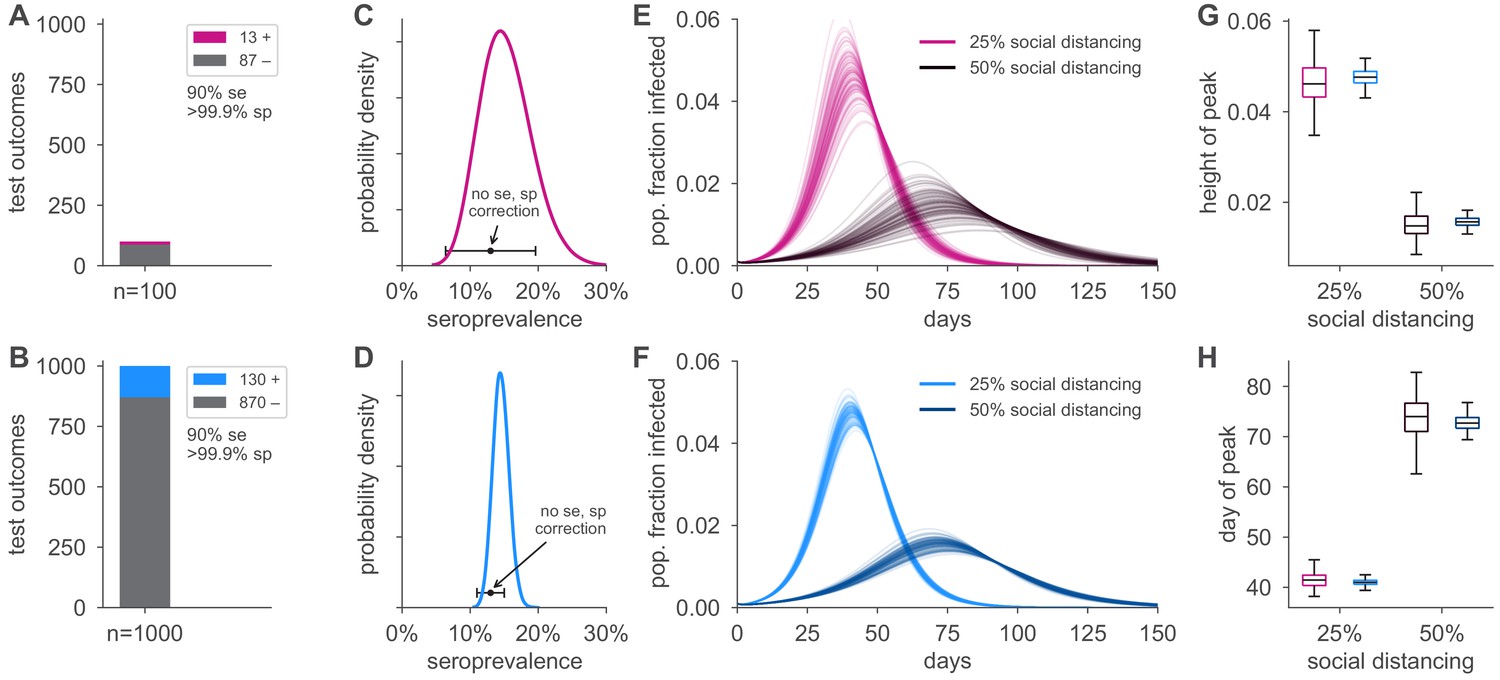
Uncertainty in serological data produces uncertainty in simulated epidemic peak height and timing.
Serological test outcomes for tests (A; red) and tests (B; blue) produce (C, D) posterior seroprevalence estimates with quantified uncertainty with posterior means of 15.2% and 14.6%, respectively; estimates uncorrected for assay performance bias: 13.0% and 13.0%. (E, F) Samples from the seroprevalence posterior produce a distribution of simulated epidemic curves for scenarios of 25% and 50% social distancing (see Materials and methods), leading to uncertainty in (G) epidemic peak and (H) timing, which is mitigated in the sample scenario. Boxplot whiskers span 1.5× IQR, boxes span central quartile, lines indicate medians, and outliers were suppressed. se, sensitivity; sp, specificity.
Figure 4—figure supplement 1
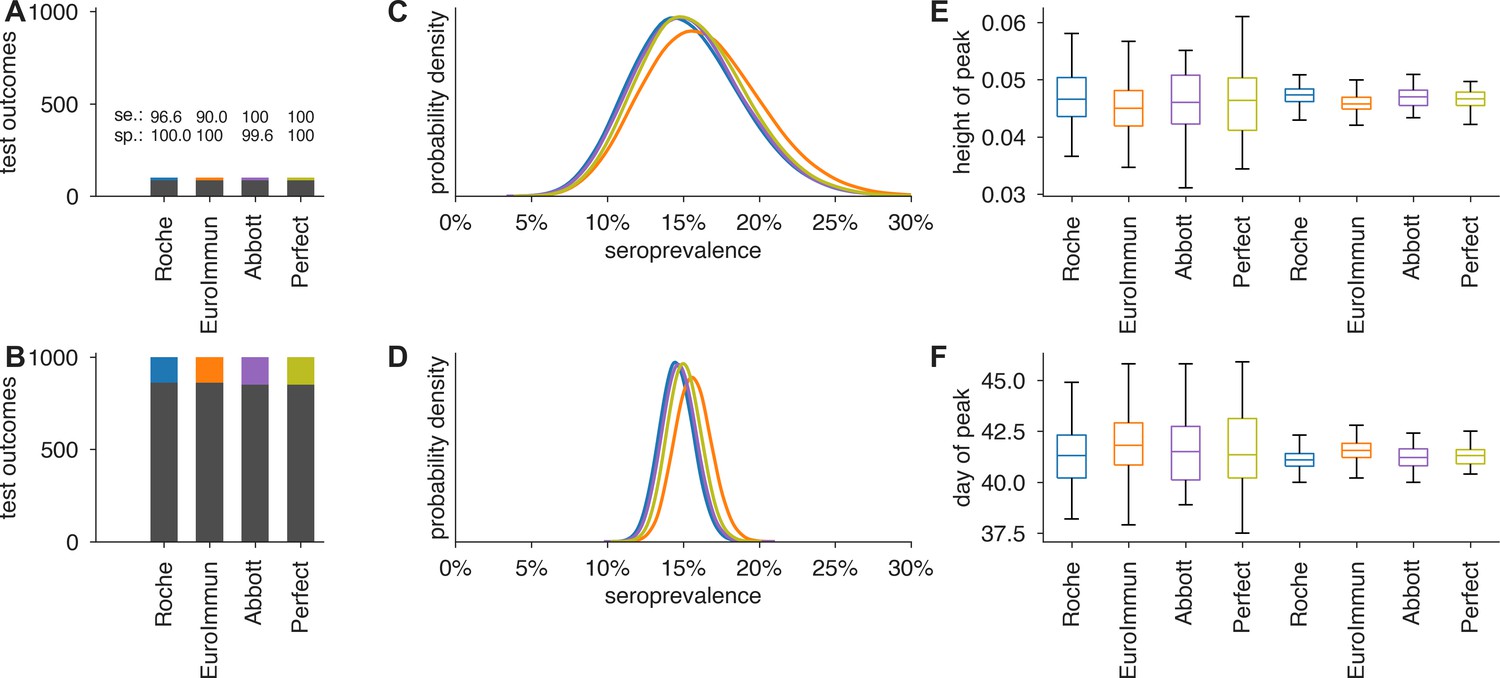
Uncertainty in serological data produces uncertainty in estimates of epidemic peak height and timing, even when the test has perfect sensitivity and specificity.
Serological test outcomes for (A) tests and (B) tests are shown as bar graphs for four tests with sensitivity and specificity values as indicated. Serological test samples were not generated stochastically but instead according to expectation to highlight how sensitivity and specificity affect inference. Posterior seroprevalence estimates for (C) and (D) scenarios reveal that Bayesian estimate places posteriors over the correct values (15%) but with uncertainty that depends on n (compare C to D) and test characteristics (compare peak heights of yellow and purple to blue and orange). Samples from the seroprevalence posterior produce a distribution of epidemic curves for scenarios of 25% and 50% social distancing (see Materials and methods), leading to uncertainty in (E) height of epidemic peak and (F) timing of epidemic peak. Uncertainty is mitigated but not eliminated in the scenario, just as uncertainty is mitigated but not eliminated using a perfect serological test. Boxplots reflect 100 samples from SEIR dynamics; whiskers span 1.5×IQR, boxes span central quartile, lines indicate medians, and outliers not shown.
Figure 5 with 4 supplements
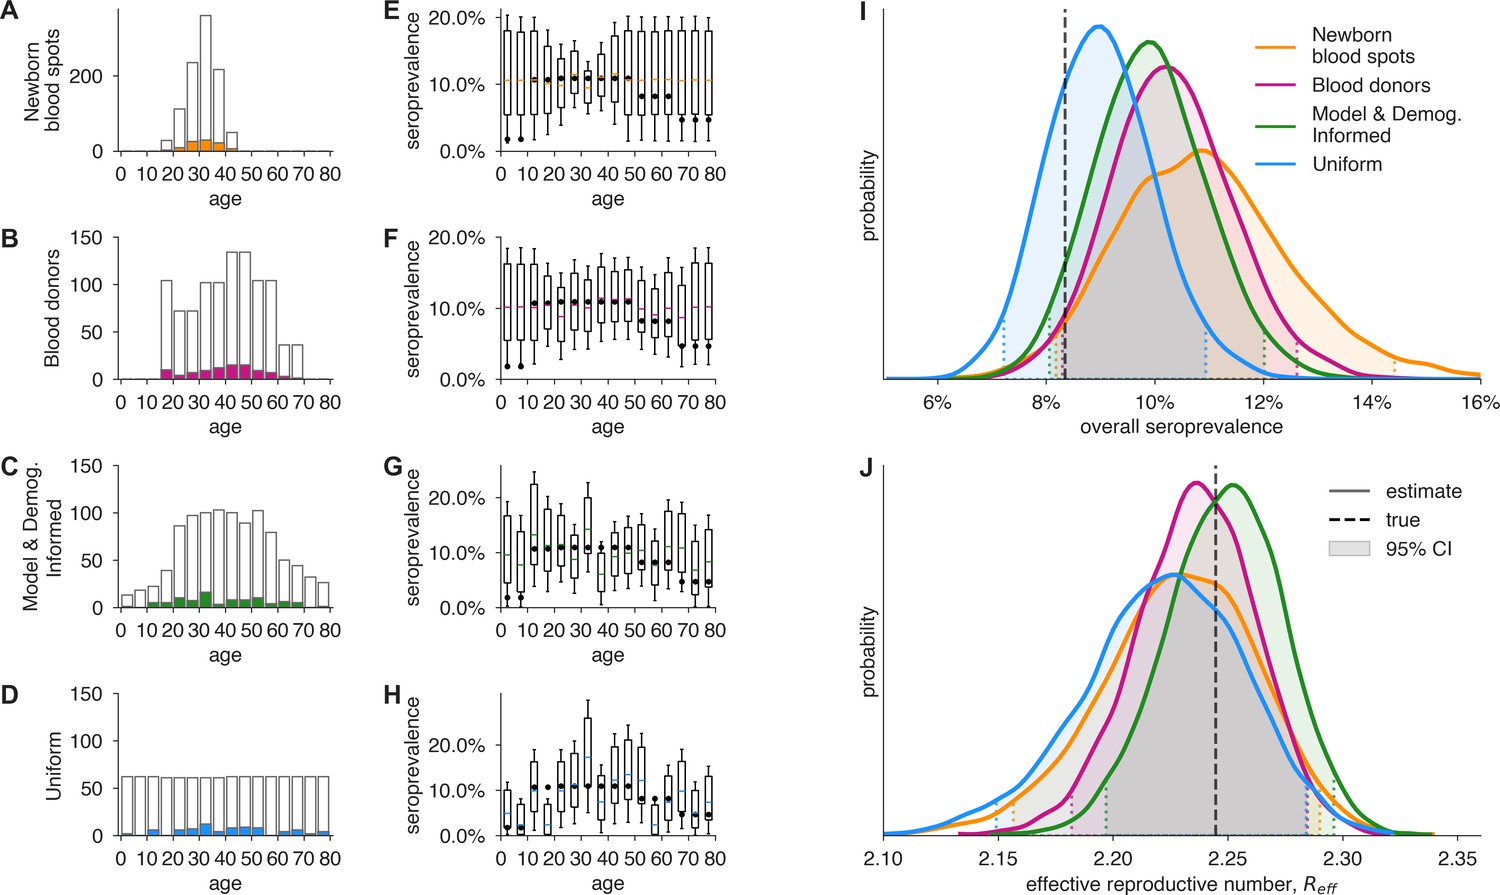
Convenience and formal samples provide serological and epidemiological parameter estimates.
(A–D) For four sampling strategies, tests were allocated to age groups with negative tests (gray outlines) and positive tests (colors) as shown, drawn stochastically based on seroprevalence estimates reflecting SARS-CoV-2 serosurvey outcomes from Geneva, Switzerland, as of May 2020 (Stringhini et al., 2020) for a test with 90% sensitivity and >99.9% specificity. The model and demographics informed (MDI) strategy shown was designed to optimize estimation of . (E–H) Age-group seroprevalence estimates are shown as boxplots (boxes 90% CIs, whiskers 95% CIs); dots indicate the true values from which data were sampled (Stringhini et al., 2020). Note the decreased uncertainty for boxes with higher sampling rates. (I) Age-group seroprevalences were weighted by Swiss population demographics to produce overall seroprevalence estimates, shown as probability densities with 95% credible intervals shaded and highlighted with dashed lines. (J) Age-group seroprevalences were used to estimate the effective reproductive number () from an age-stratified transmission model under status quo ante contact patterns, shown as probability densities with 95% credible intervals shaded and highlighted with dashed lines, based on a basic reproductive number in the absence of population immunity (R0) of 2.5. Dashed lines indicate true values from which the data were sampled. Each distribution depicts inference outcomes from a single set of stochastically sampled data; no averaging is done. Note that although uniform and MDI sample allocation produces equivalently confident estimates of overall seroprevalence, MDI produces a more confident estimate of because it allocates more samples to age groups most relevant to model dynamics.
Figure 5—figure supplement 1
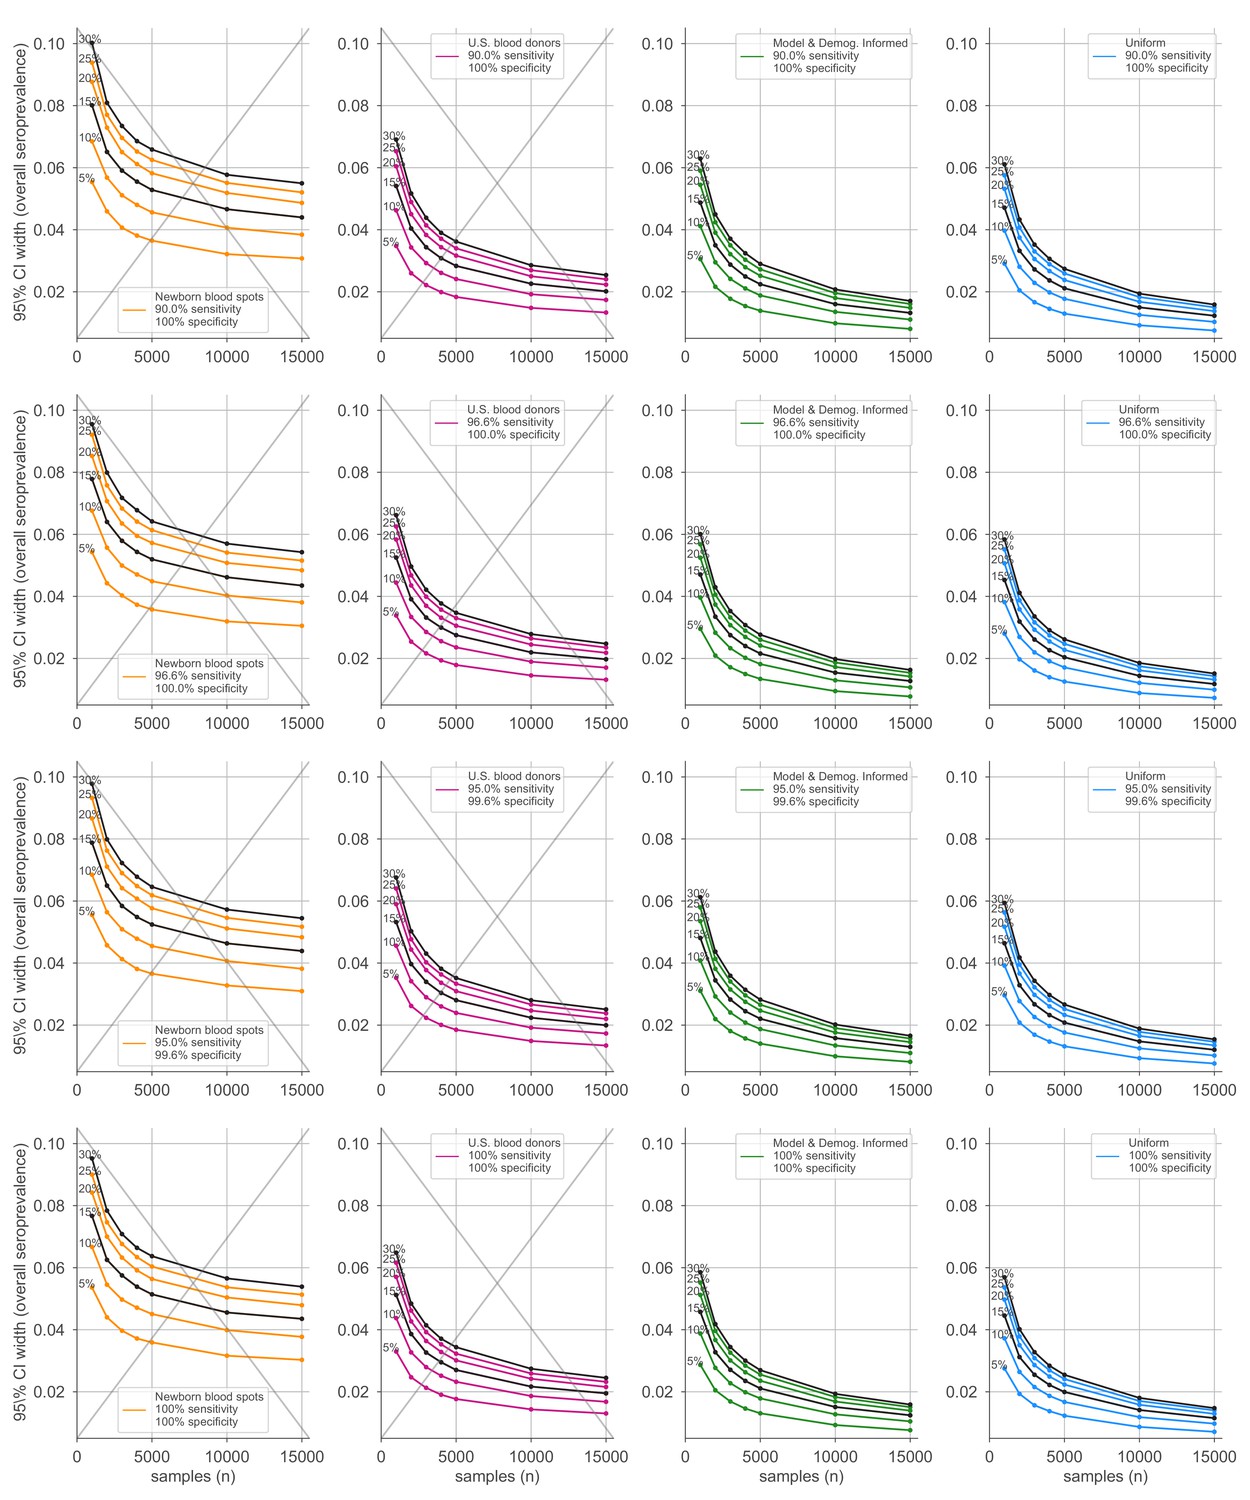
Average credible interval width for overall seroprevalence estimates using four sampling strategies and four serological test kits.
Credible intervals were calculated for data generated according to four sampling strategies (columns, colors) and four test kits (rows), with sensitivity and specificity values as indicated; see legends. Each point represents the average width of the intervals for the indicated overall seroprevalence value (see annotations on plots) at the specified number of serological samples n out of a total of 250 independent trials. Some seroprevalence values are plotted in black simply to guide the eye. The model and demographics informed strategy shown was designed to optimize estimation of . Sampling strategies that resulted in posterior credible intervals with inaccurate coverage are crossed out to indicate that estimates in these regimes should be interpreted with caution.
Figure 5—figure supplement 2

Average credible interval width for estimates using four sampling strategies and four serological test kits.
Credible intervals were calculated for data generated according to four sampling strategies (columns, colors) and four test kits (rows), with sensitivity and specificity values as indicated; see legends. Each point represents the average width of the intervals for the indicated overall seroprevalence value (see annotations on plots) at the specified number of serological samples n out of a total of 250 independent trials. Some seroprevalence values are plotted in black simply to guide the eye. The model and demographics informed strategy shown was designed to optimize estimation of .
Figure 5—figure supplement 3
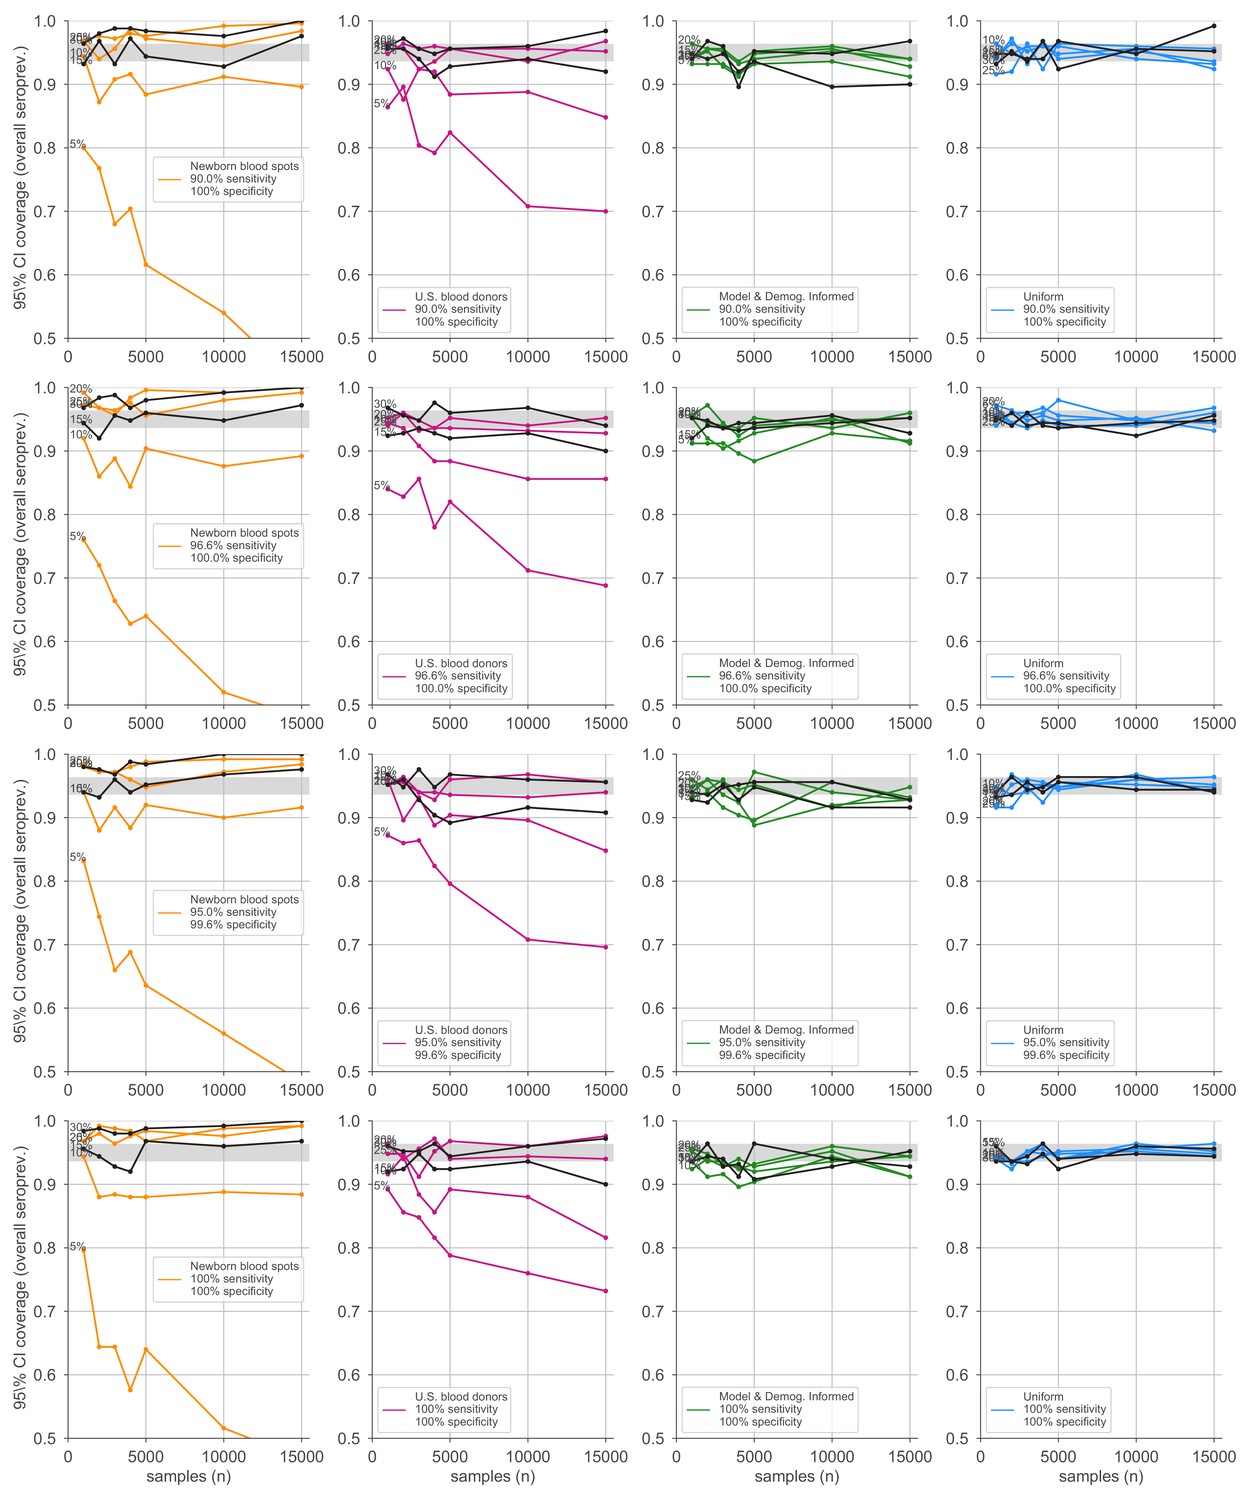
Credible interval coverage for overall seroprevalence estimates using four sampling strategies and four serological test kits.
Credible interval coverage, defined as the fraction of posterior credible intervals that covered the true parameter used to generate the data, is shown for four sampling strategies (columns, colors) and four test kits (rows), with sensitivity and specificity values as indicated; see legends. Each point represents the fraction of credible intervals that covered the planted value for the indicated overall seroprevalence value (see annotations on plots) at the specified number of serological samples n out of a total of 250 independent trials. The estimated coverage from a perfectly calibrated posterior will have coverage fractions within 0.9 ± 0.37 (gray bands) 95% of the time. Some seroprevalence values are plotted in black simply to guide the eye. The model and demographics informed strategy shown was designed to optimize estimation of .
Figure 5—figure supplement 4
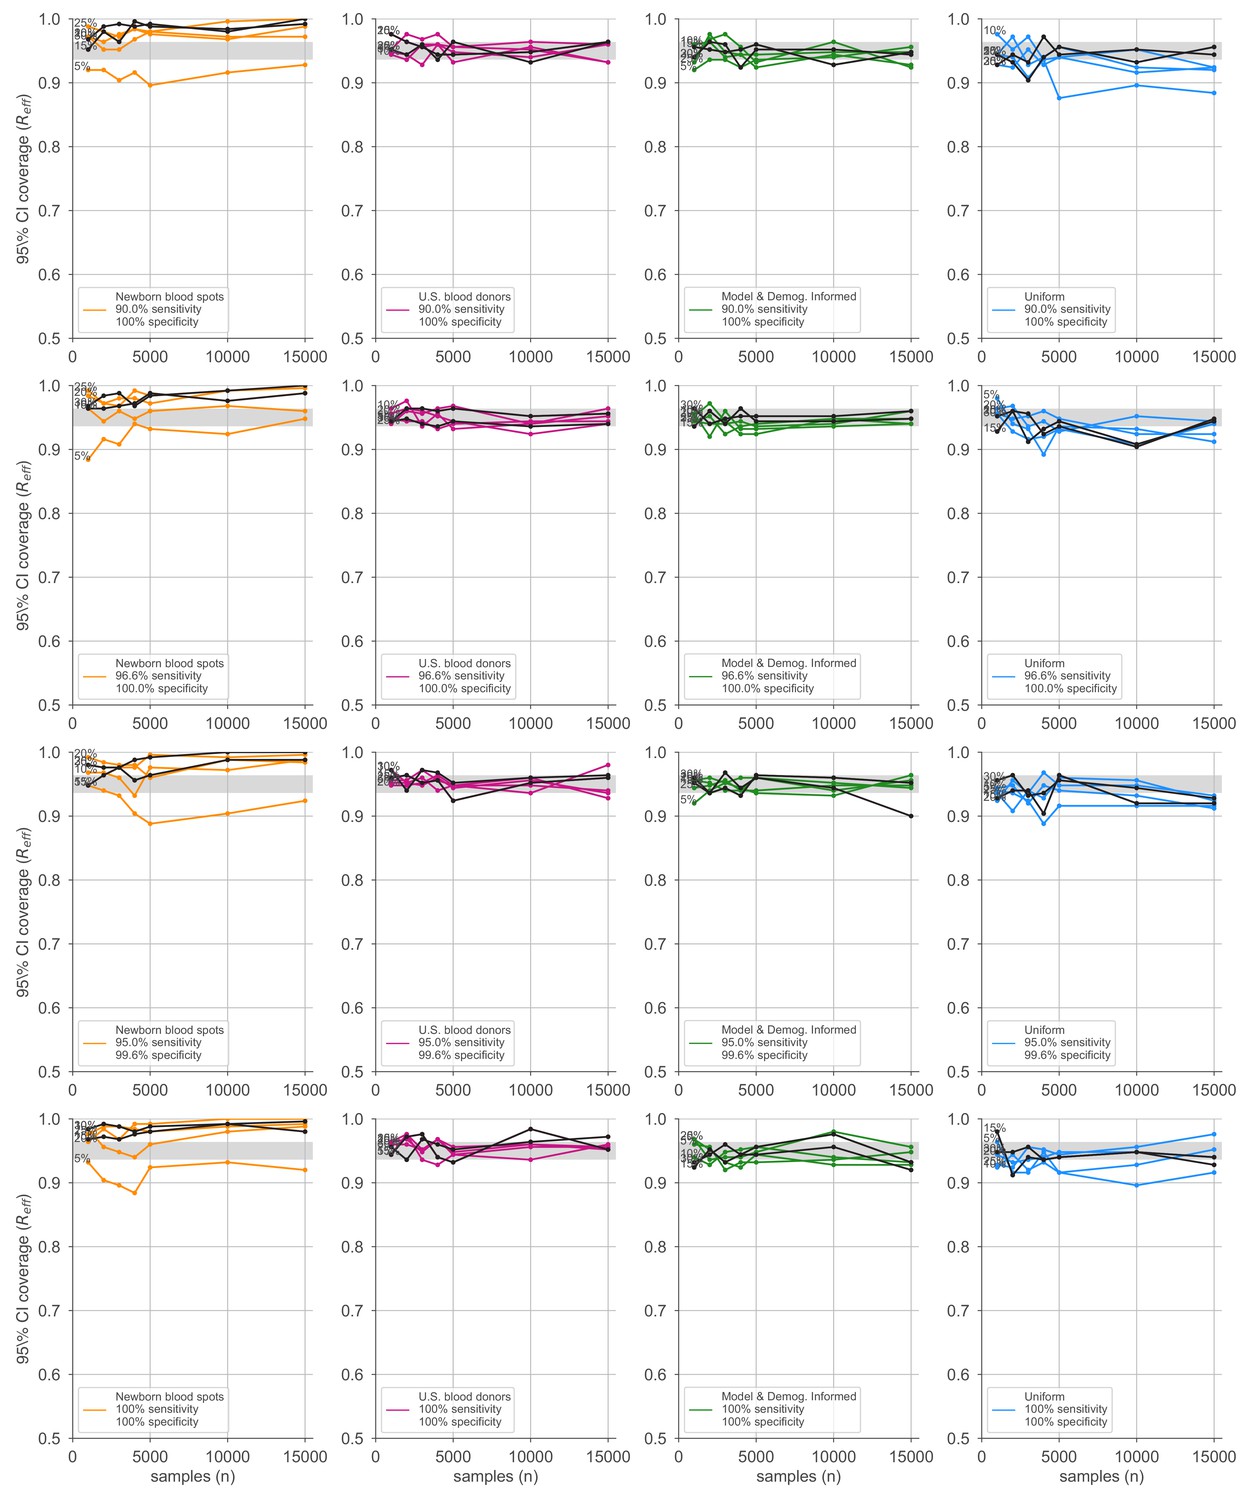
Credible interval coverage for estimates using four sampling strategies and four serological test kits.
Credible interval coverage, defined as the fraction of posterior credible intervals that covered the true parameter used to generate the data, is shown for four sampling strategies (columns, colors) and four test kits (rows), with sensitivity and specificity values as indicated; see legends. Each point represents the fraction of credible intervals that covered the planted value for the indicated overall seroprevalence value (see annotations on plots) at the specified number of serological samples n out of a total of 250 independent trials. The estimated coverage from a perfectly calibrated posterior will have coverage fractions within 0.9 ± 0.37 (gray bands) 95% of the time. Some seroprevalence values are plotted in black simply to guide the eye. The model and demographics informed strategy shown was designed to optimize estimation of .
Figure 6
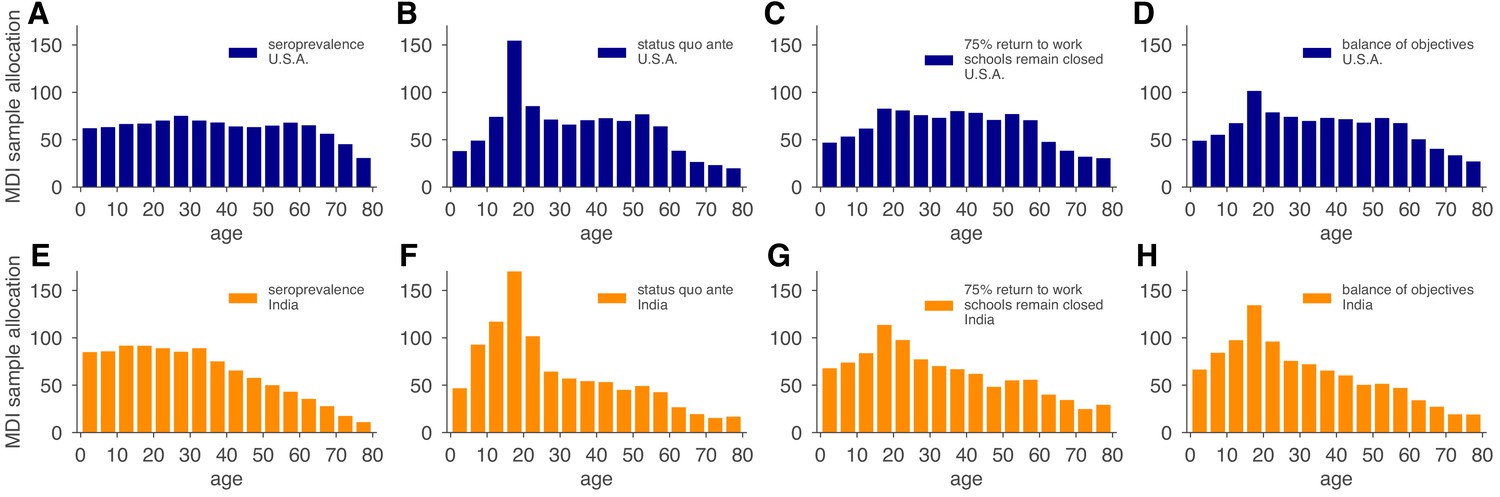
Model and demographics informed (MDI) sample allocations vary by demographics and modeling needs.
Bar charts depict recommended sample allocation for three objectives, reducing posterior uncertainty for (A, E) estimates of overall seroprevalence, (B, F) predictions from an age-structured model with status quo ante contact patterns, (C, G) predictions from an age-structured model with modified contacts representing, relative to pre-crisis levels, a 20% increase in home contact rates, closed schools, a 25% decrease in work contacts, and a 50% decrease of other contacts (Mossong et al., 2008; Prem et al., 2017), and (D, H) averaging the other three MDI recommendations to balance competing objectives. Data for both the U.S. (blue; A–D) and India (orange; E–H) illustrate the impact of demography and contact structure on strategic sample allocation. These sample allocation strategies assume no prior knowledge of subpopulation seroprevalences .
Additional files
-
Supplementary file 1
Serological tests and performance characteristics considered in this study.
Sensitivity and specificity values were taken from manufacturer’s claims as of February 2021 as filed with the U.S. Food and Drug Administration, 2021.
- https://cdn.elifesciences.org/articles/64206/elife-64206-supp1-v3.pdf
-
Supplementary file 2
Parameter values used in dynamical models and numerical experiments.
This table is divided into four sections. The top two sections correspond to the parameters of the single-population modeling. The bottom two sections correspond to the parameters used in the age-structured modeling. Sections corresponding to and are separated to indicate that their values were used in synthetic data experiments to assess performance of the Bayesian inference methods on varying seroprevalence levels, to separate them from SEIR model parameters. Contact matrices used in this article were, in particular, those corresponding to the U.S., India, and Switzerland. Equations for models can be found in the Appendix. Test kit sensitivity and specificity values are provided in Supplementary file 1. Subpopulation seropositivity values were synthetically generated to accommodate moderate variation between subpopulations as well as the ability for mean seropositivity to be easily adjusted (used in Figure 3, or were generalized to 5-year age bins from the age-stratified serosurvey of Stringhini et al., 2020) based in Geneva, Switzerland, as shown (used in Figure 5).
- https://cdn.elifesciences.org/articles/64206/elife-64206-supp2-v3.pdf
-
Transparent reporting form
- https://cdn.elifesciences.org/articles/64206/elife-64206-transrepform-v3.docx
Download links
A two-part list of links to download the article, or parts of the article, in various formats.
Downloads (link to download the article as PDF)
Open citations (links to open the citations from this article in various online reference manager services)
Cite this article (links to download the citations from this article in formats compatible with various reference manager tools)
Estimating SARS-CoV-2 seroprevalence and epidemiological parameters with uncertainty from serological surveys
eLife 10:e64206.
https://doi.org/10.7554/eLife.64206


