Dynamic interactions between the RNA chaperone Hfq, small regulatory RNAs, and mRNAs in live bacterial cells
- Department of Biochemistry and Molecular Biology, The University of Chicago, United States
- RNA Group, Department of Biochemistry, University of Sherbrooke, Canada
- Institute for Biophysical Dynamics, The University of Chicago, United States
Figures
Figure 1 with 3 supplements
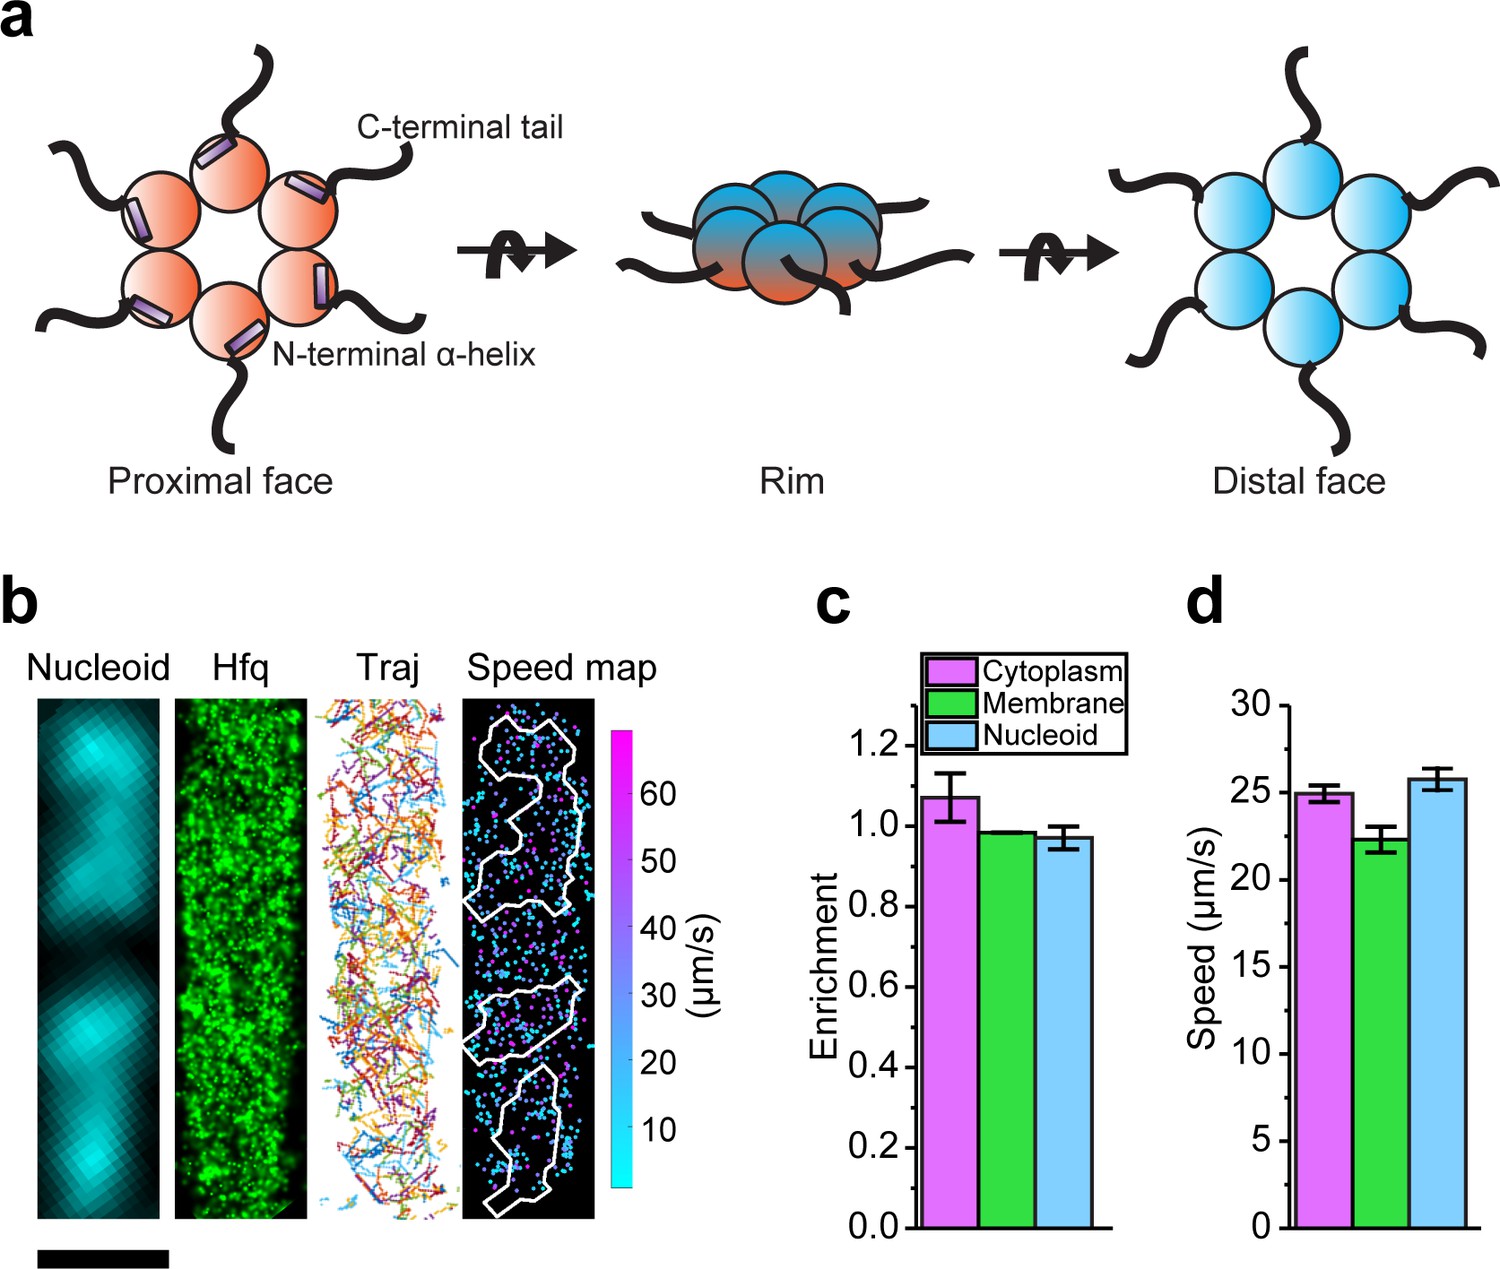
Diffusion and localization of Hfq during exponential growth.
(a) Schematic representation of Hfq with three RNA binding faces indicated. (b) A representative example of WT Hfq-mMaple3 in WT rne background in a single cell during exponential growth under no treatment (NT) condition. Nucleoid is stained with Hoechst in live cells. 2D reconstructed image of Hfq-mMaple3 is shown in the black background. Different diffusion trajectories from tracking algorithm are shown in different colors (‘Traj’). One-step displacement (osd) speed map (unit: µm/s) is shown as a scatter plot where different colors represent different speeds at each position, and the white curves represent the nucleoid regions detected by Hoechst staining. The scale bar represents 1 µm. (c) Enrichment of Hfq localization is calculated for cytoplasm, membrane, and nucleoid regions under NT condition. (d) Average osd speed of Hfq within the cytoplasm, membrane, and nucleoid regions under NT condition. Error bars in all plots represent the standard deviation (s.d.) from two experimental replicates, with each data set containing ~20,000 trajectories from ~80 cells.
-
Figure 1—source data 1
Single cell speed (b) and average enrichment and osd speed (c and d).
- https://cdn.elifesciences.org/articles/64207/elife-64207-fig1-data1-v2.xlsx
Figure 1—figure supplement 1
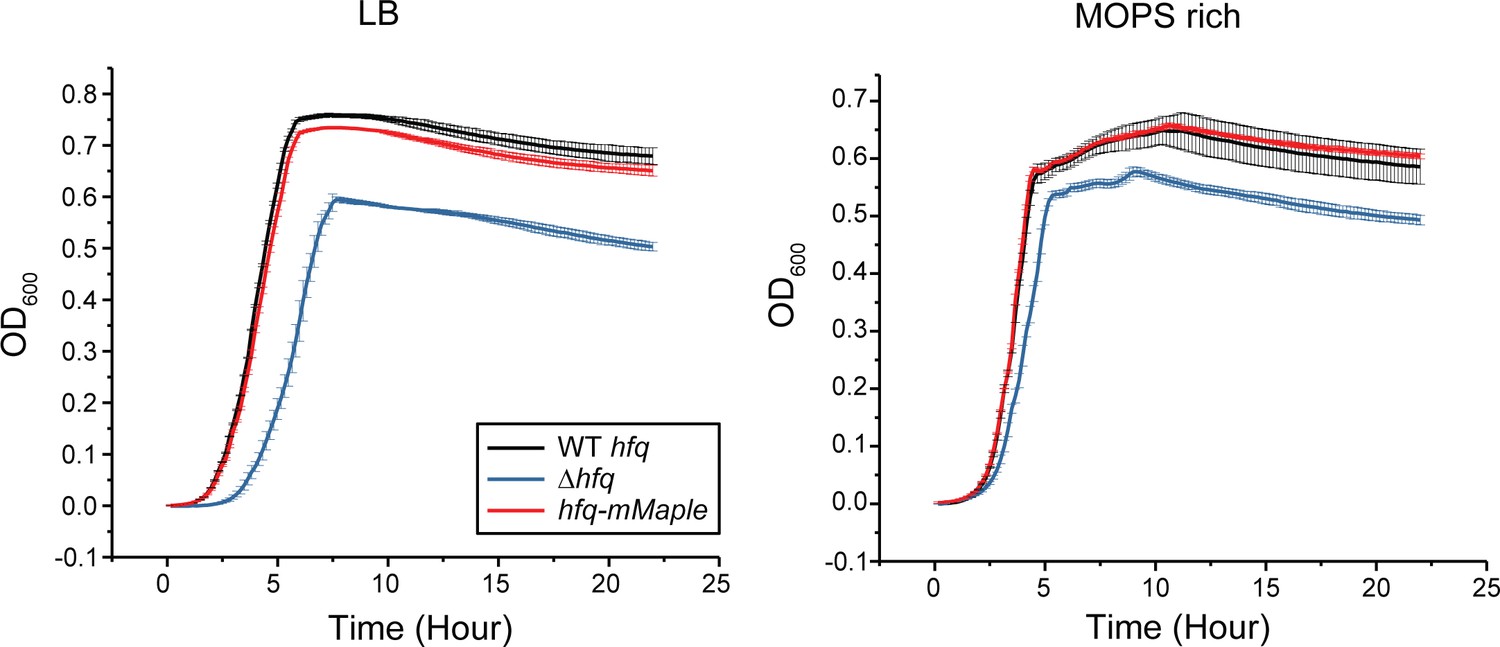
mMaple3 tag on Hfq does not affect growth rate.
Growth curves of WT hfq, Δhfq, and hfq-mMaple3 strains grown in LB or MOPS EZ-rich medium containing 0.2% glucose. Data were obtained using a microplate spectrophotometer reader (BioTek). Error bars report the mean and standard deviation (s.d.) from three independent measurements.
-
Figure 1—figure supplement 1—source data 1
Growth curves.
- https://cdn.elifesciences.org/articles/64207/elife-64207-fig1-figsupp1-data1-v2.xlsx
Figure 1—figure supplement 2
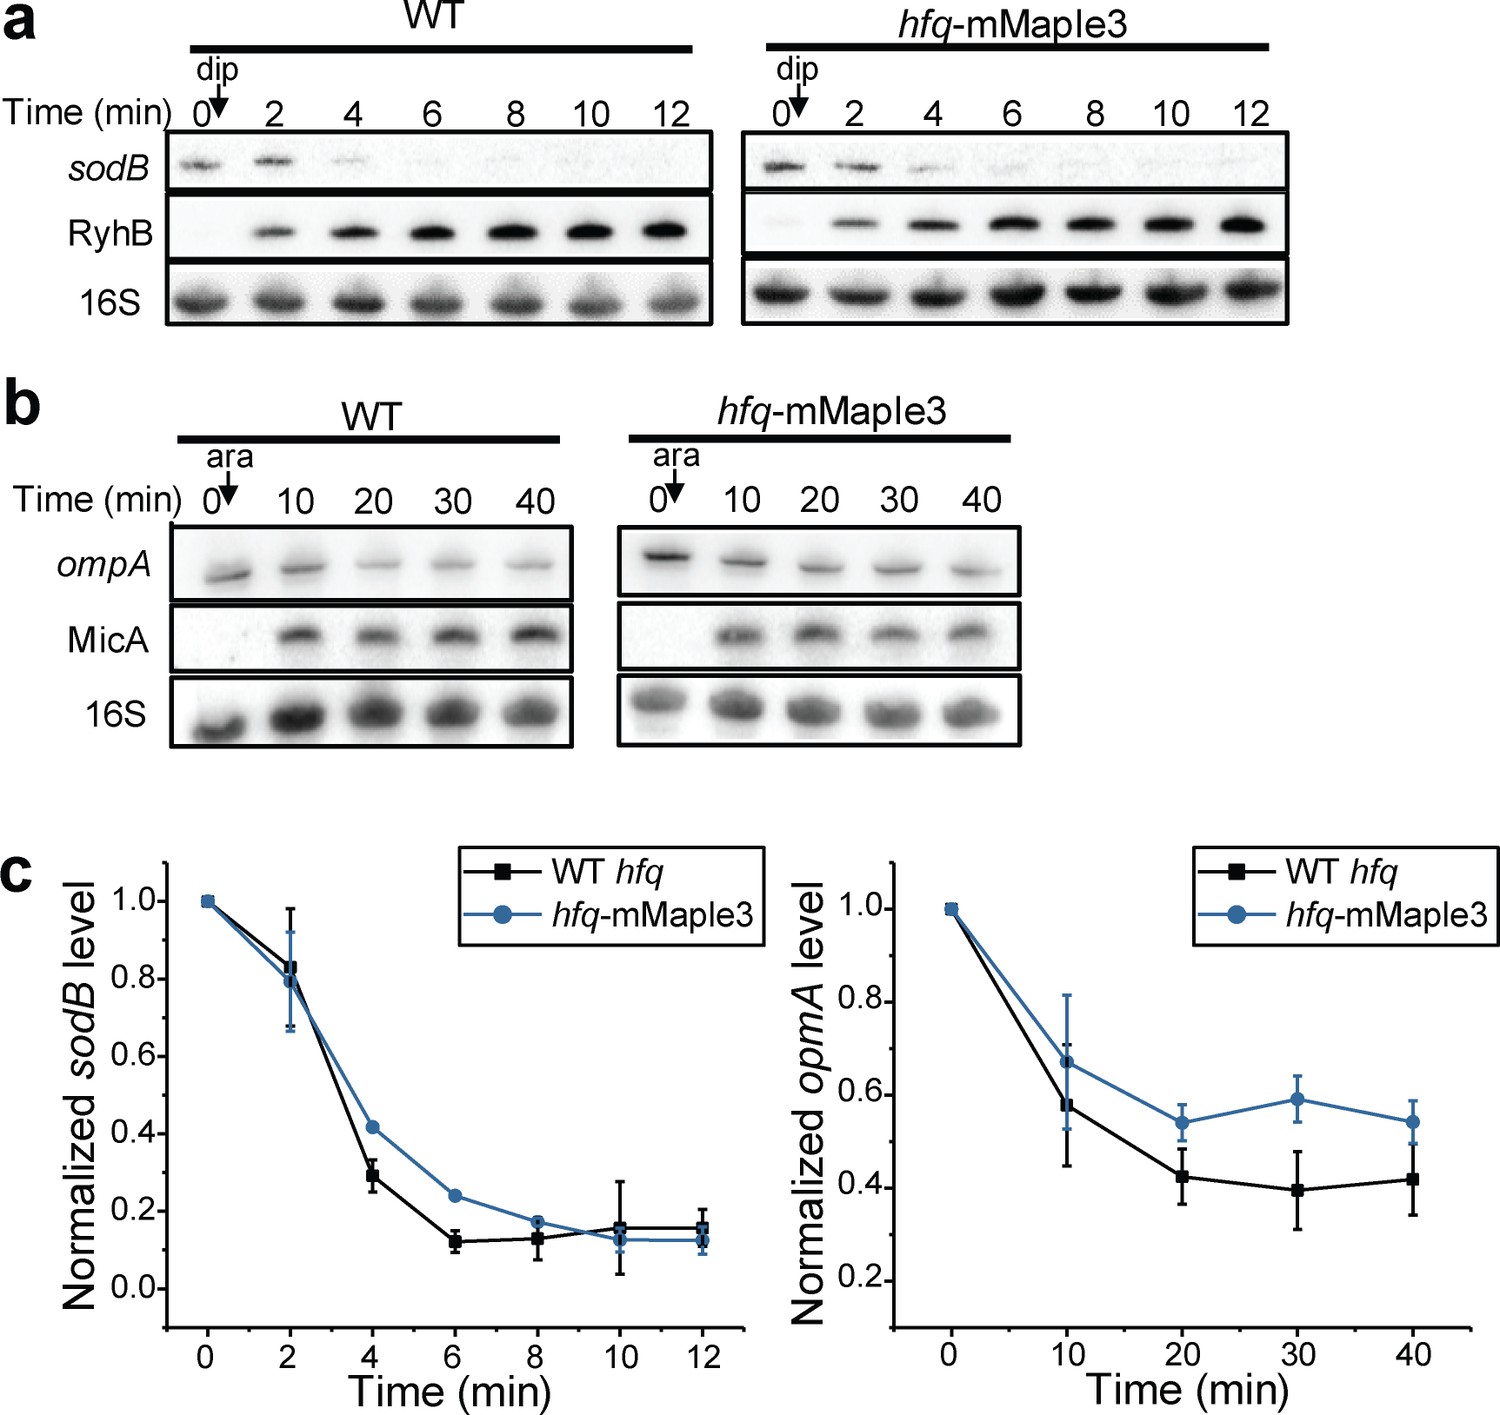
mMaple3 tag on Hfq does not affect mRNA degradation by sRNA.
(a) RyhB was induced by addition of 250 µM 2.2′-dipyridyl (dip) in a WT or in an hfq-mMaple3 background when OD600 reached 0.5 in LB medium. At indicated time points, total RNA was extracted. Specific sodB and RyhB probes were used for northern blot analysis. (b) MicA was expressed from pBAD-micA by addition of 0.1% arabinose (ara) in a ΔmicA or in a ΔmicA hfq-mMaple3 background, when OD600 reached 0.5 in LB medium. At indicated time points, total RNA was extracted. Specific ompA and MicA probes were used for northern blot analysis. For a and b, 16S rRNA was used as loading control. (c) Densitometry analysis of sodB and ompA RNA levels obtained by northern blots. Data was normalized to 16S at each time point to eliminate sample loading variation and normalized to the level at time 0 (before induction). Error bars report the mean and s.d. from two to four replicates.
-
Figure 1—figure supplement 2—source data 1
Densitometry analysis of northern blots (c).
- https://cdn.elifesciences.org/articles/64207/elife-64207-fig1-figsupp2-data1-v2.xlsx
Figure 1—figure supplement 3
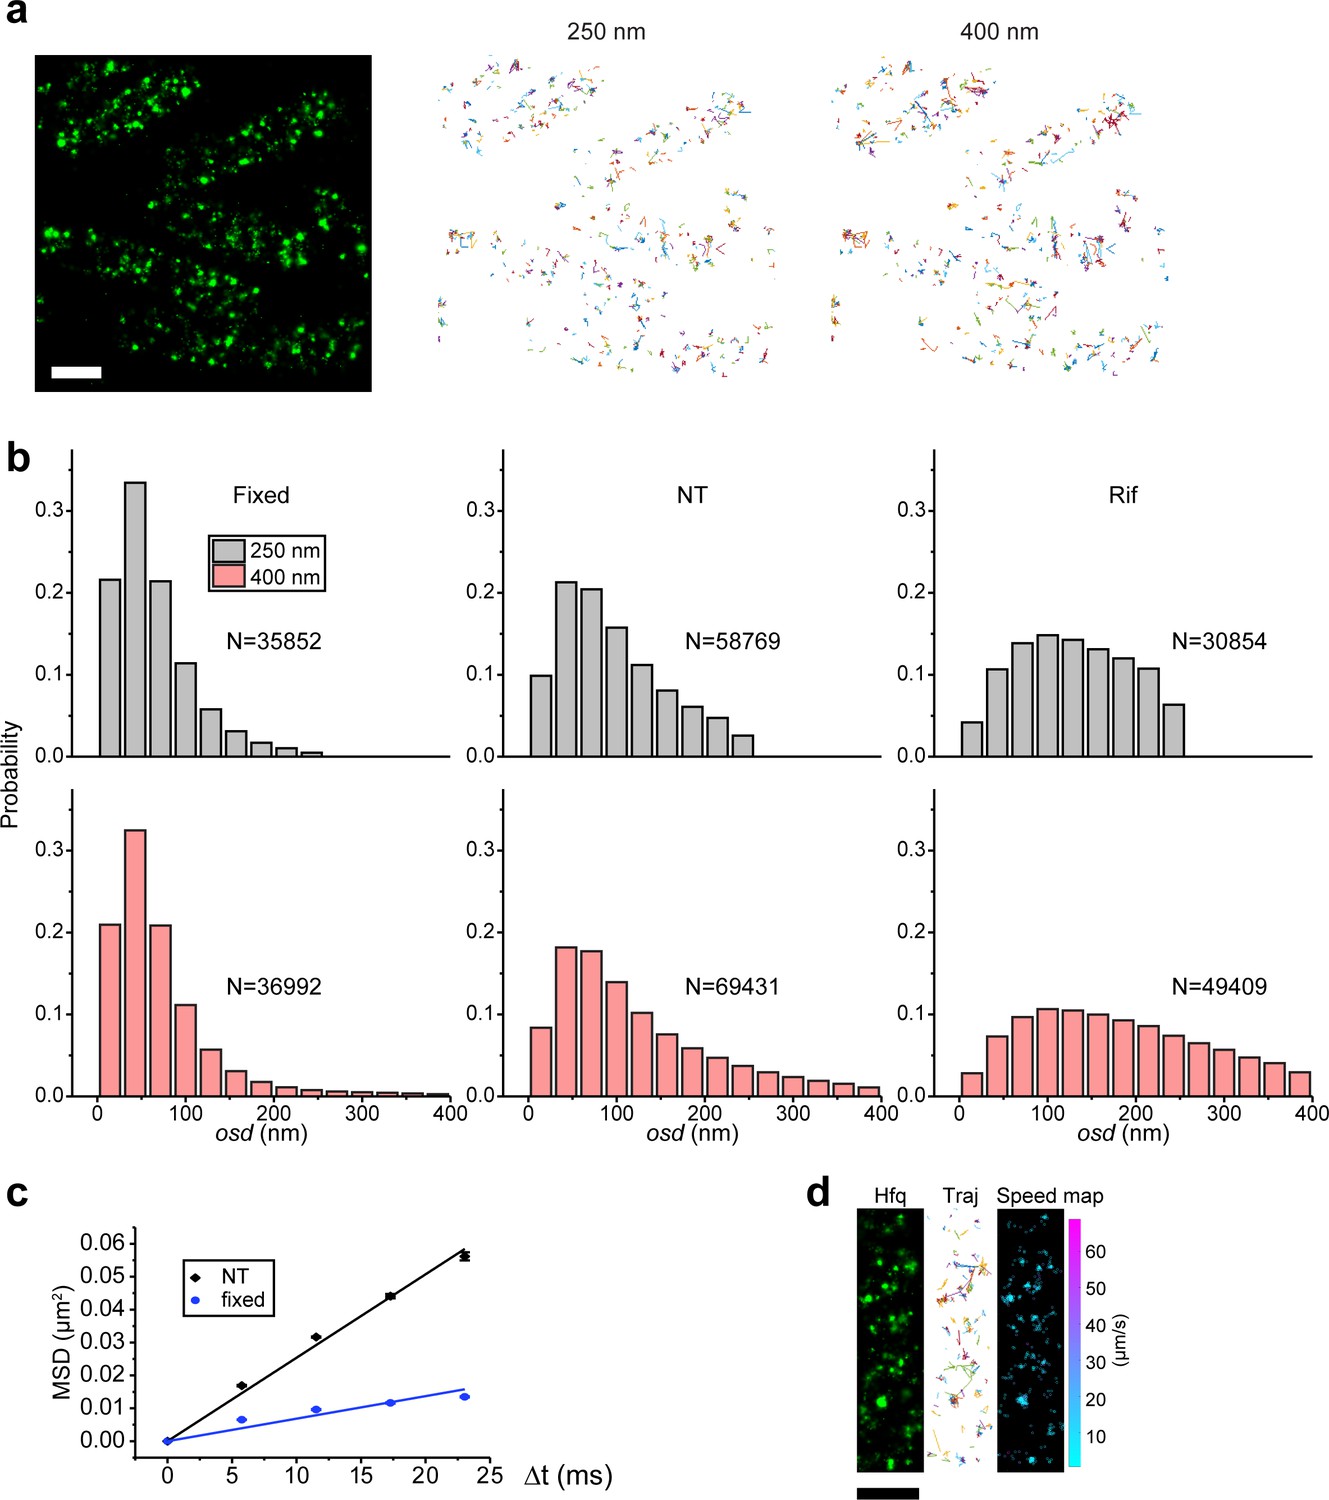
Fixed cells as the stationary control for tracking analysis.
(a) A representative area with multiple fixed cells (hfq-mMaple3 in WT rne background) under NT case is shown on the left. Distance cutoff of 250 nm (middle) or 400 nm (right) between neighboring frames is applied to the same image area to generate trajectories. (b) Histograms of one-step displacement (osd) for fixed cell (left), no treatment in live cell (center), and rifampicin treatment in live cell (right) cases, with 250 nm or 400 nm distance cutoff. For each histogram, trajectories from two or three experimental replicates are combined. N represents the total number of trajectories in the histogram. (c) Mean squared displacement (MSD) is plotted against time lag (Δt) for the fixed cells (blue) and no treatment live cells (black), and lines represent the linear fitting. Error bars represent the s.d. from two or three experimental replicates, each containing ~5,000 trajectories from ~100 cells. (d) A representative example of fixed Hfq-mMaple3 in a single cell. 2D reconstructed image of Hfq-mMaple is shown in the black background. Different diffusion trajectories from tracking algorithm are shown in different colors (‘Traj’). Osd speed map (unit: µm/s) is shown as a scatter plot where different colors represent different speeds at each position. The scale bar represents 1 µm.
-
Figure 1—figure supplement 3—source data 1
Osd speed distribution (b), MSD plots (c), and osd speed of a single cell (d).
- https://cdn.elifesciences.org/articles/64207/elife-64207-fig1-figsupp3-data1-v2.xlsx
Figure 2 with 2 supplements
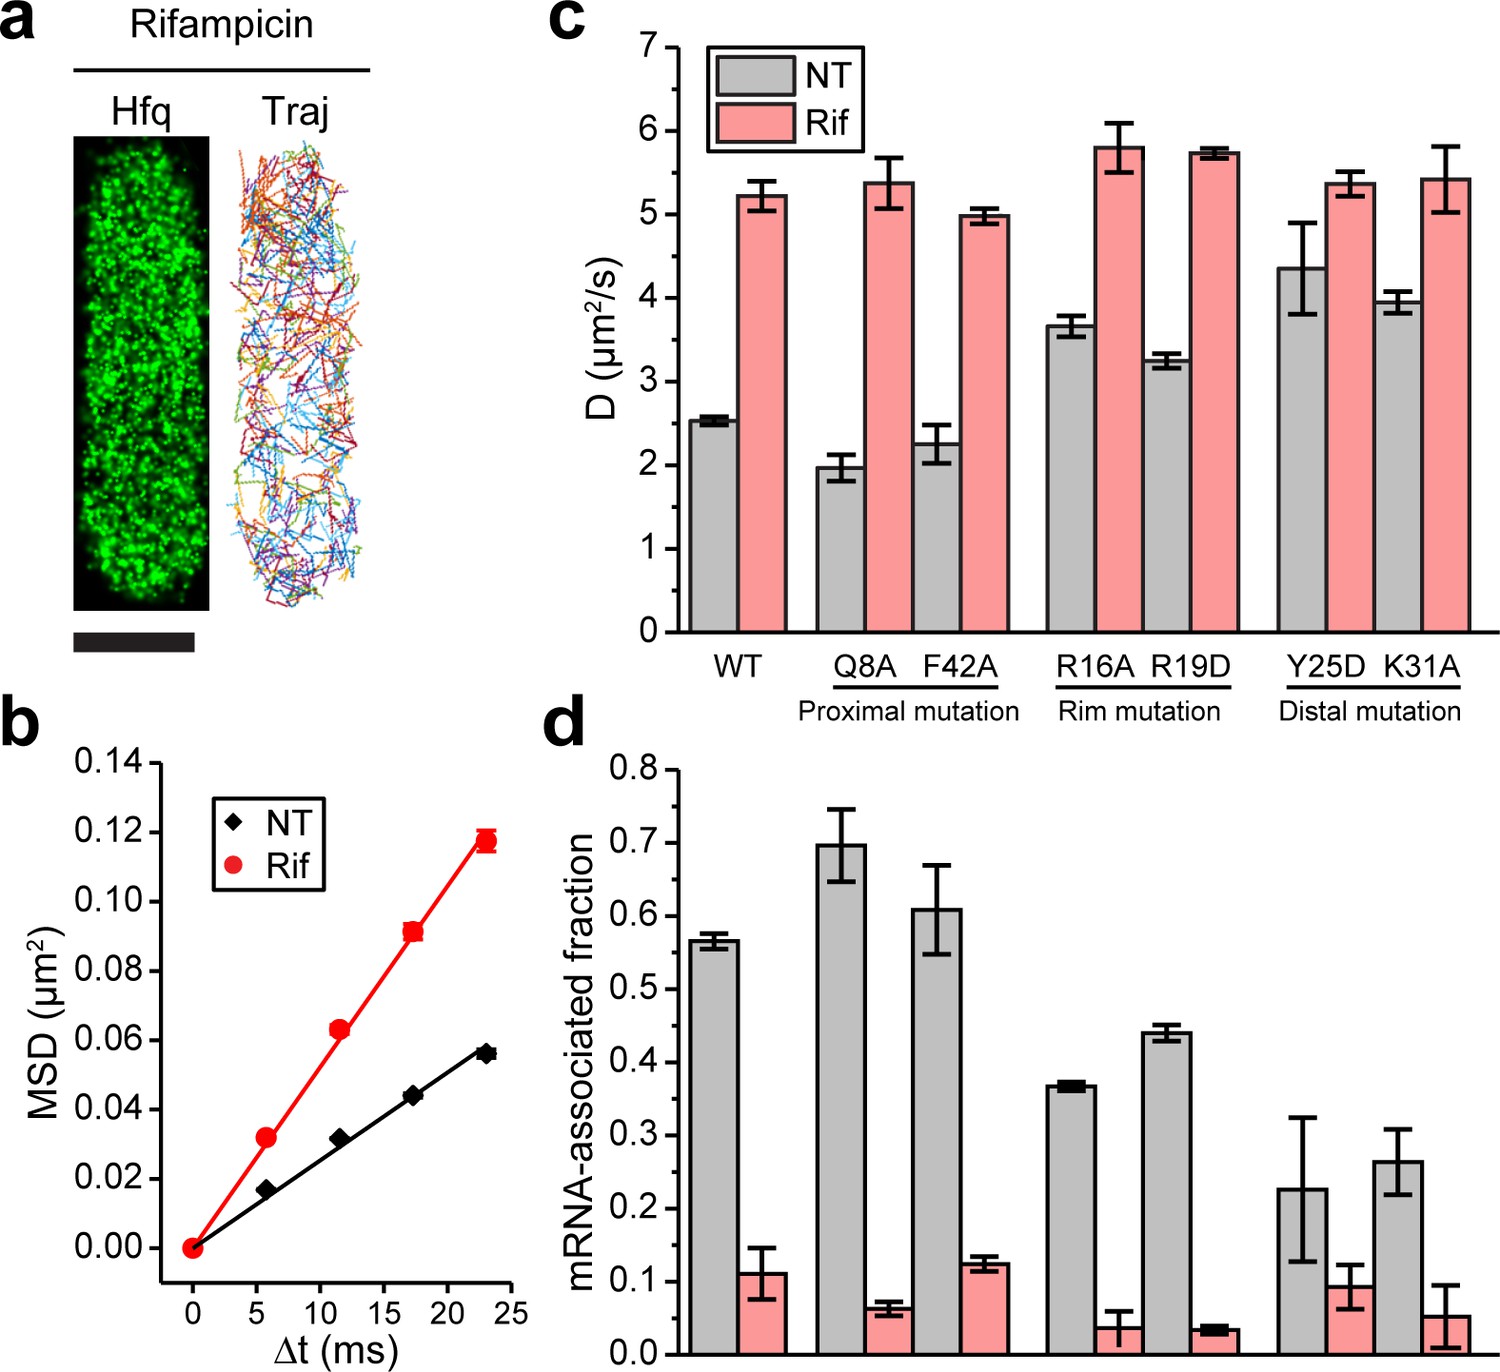
Binding of mRNAs to Hfq decreases its diffusivity primarily through the distal face of Hfq.
(a) A representative example of Hfq-mMaple3 with rifampicin treatment (Rif) in a single cell. 2D reconstructed image is shown in the black background (left), and different diffusion trajectories are shown in different colors (right). The scale bar represents 1 µm. (b) Mean squared displacement (MSD) is plotted against the time lag (Δt) for Hfq-mMaple3 under NT and Rif cases. The linear fitting lines are shown. (c) Ensemble diffusion coefficients are plotted for WT and six mutants of Hfq-mMaple3 under NT and rifampicin treatment conditions. (d) mRNA-associated fraction for WT and six mutants of Hfq under NT and Rif conditions. Error bars in all plots represent the s.d. from two or three experimental replicates, with each data set containing ~5,000 trajectories (for D value calculation) or ~20,000 trajectories (for mRNA-associated fraction calculation) from ~100 cells. All fitting results are reported in Supplementary file 1.
-
Figure 2—source data 1
Mean squared displacement (MSD) plot for NT and Rif (b).
- https://cdn.elifesciences.org/articles/64207/elife-64207-fig2-data1-v2.xlsx
Figure 2—figure supplement 1

Diffusivities of different mMaple3 controls are not affected by treatment with rifampicin.
(a) Representative images of control cells that express free mMaple3, sAB-70-mMaple3, and scFv-GCN4-mMaple3 under NT and rifampicin treatment (Rif) conditions. The scale bar represents 1 µm. (b) Mean squared displacement (MSD) is plotted against the time interval (Δt) for free mMaple3, sAB-70-mMaple3, and scFv-GCN4-mMaple3 under NT and Rif conditions. The linear fitting lines are shown. (c) Ensemble diffusion coefficients of free mMaple3, sAB-70-mMaple3, and scFv-GCN4-mMaple3 from linear fitting to MSD. Error bars in all plots represent the s.d. from two experimental replicates, each containing ~500 trajectories from ~100 cells.
-
Figure 2—figure supplement 1—source data 1
Mean squared displacement (MSD) plots for mMaple3 controls (b).
- https://cdn.elifesciences.org/articles/64207/elife-64207-fig2-figsupp1-data1-v2.xlsx
Figure 2—figure supplement 2
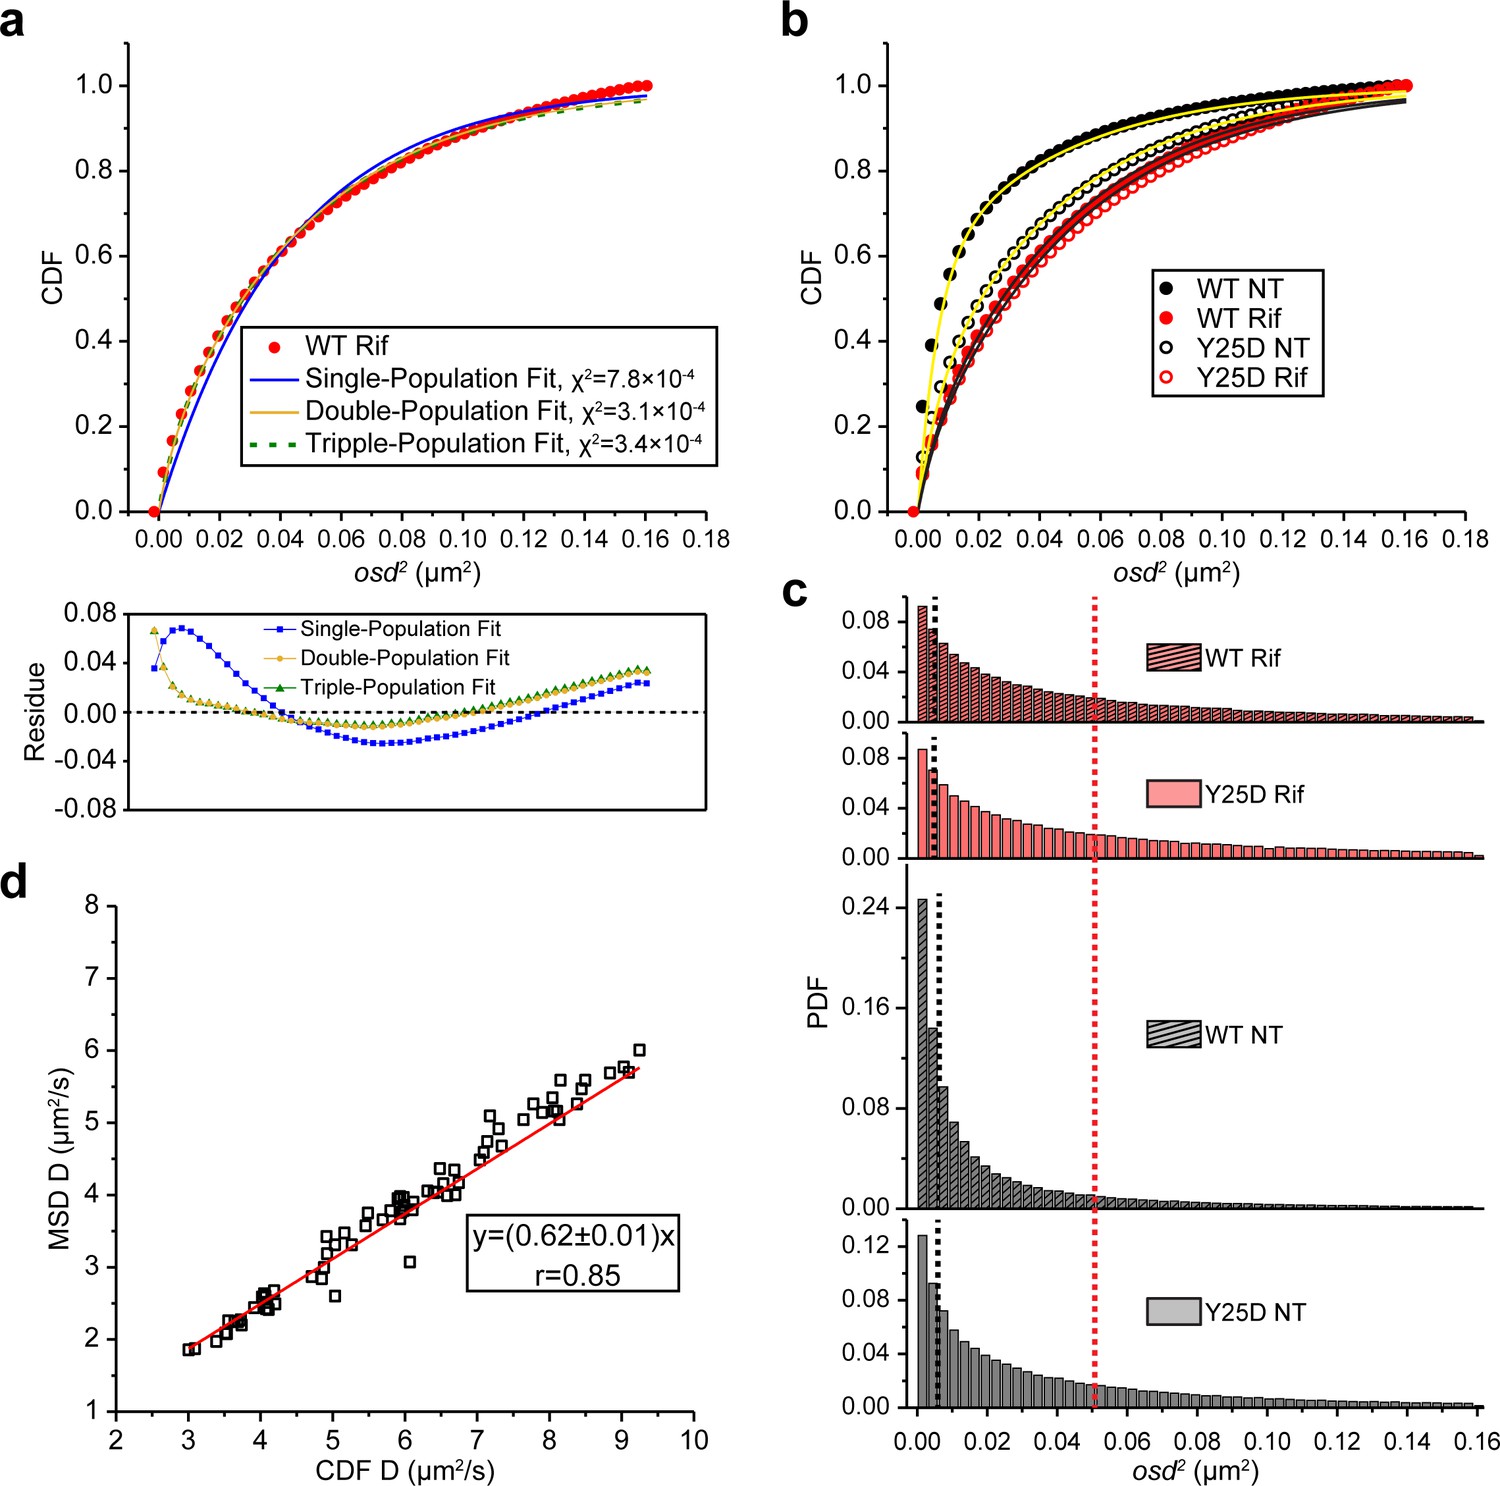
Estimation of mRNA-associated Hfq fraction.
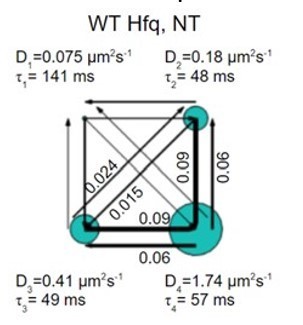
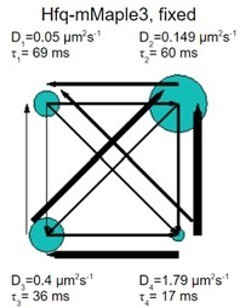
(a) Representative fitting of the cumulative probability density function (CDF) of osd2 distribution for WT Hfq-mMaple3 under rifampicin treatment. CDF is fit better by a double-population model (yellow) than a single population (blue), as also demonstrated by the residue (data-fitting). Fitting by a triple-populations model (green) does not give a better fit as its chi-square is larger than fitting by double populations. (b) CDF of osd2 distribution for WT Hfq-mMaple3 (filled circles) and Hfq-mMaple3 Y25D (hollow circles) under NT and rifampicin treatment cases and corresponding double-population fitting (solid curves). (c) Probability density function (PDF) of osd2 for the four cases in (b). The osd2 values of fast-diffusing state are marked as the vertical red line, and osd2 values for the slow-diffusing state are marked as vertical black lines. Details of the population analysis are described in Materials and methods. (d) Comparison of the ensemble diffusion coefficients from the linear fitting of the MSD vs. Δt curve, with the weighted average of one-step diffusion coefficients of the fast- and slow-diffusing states from the population analysis. The red line represents a linear fitting of the data, and the correlation coefficient, r, is reported.
-
Figure 2—figure supplement 2—source data 1
CDFs, PDFs, and fits of osd2 of Hfq (a, b, and c) and comparison of osd D and mean squared displacement (MSD) D (d).
- https://cdn.elifesciences.org/articles/64207/elife-64207-fig2-figsupp2-data1-v2.xlsx
Figure 3 with 2 supplements
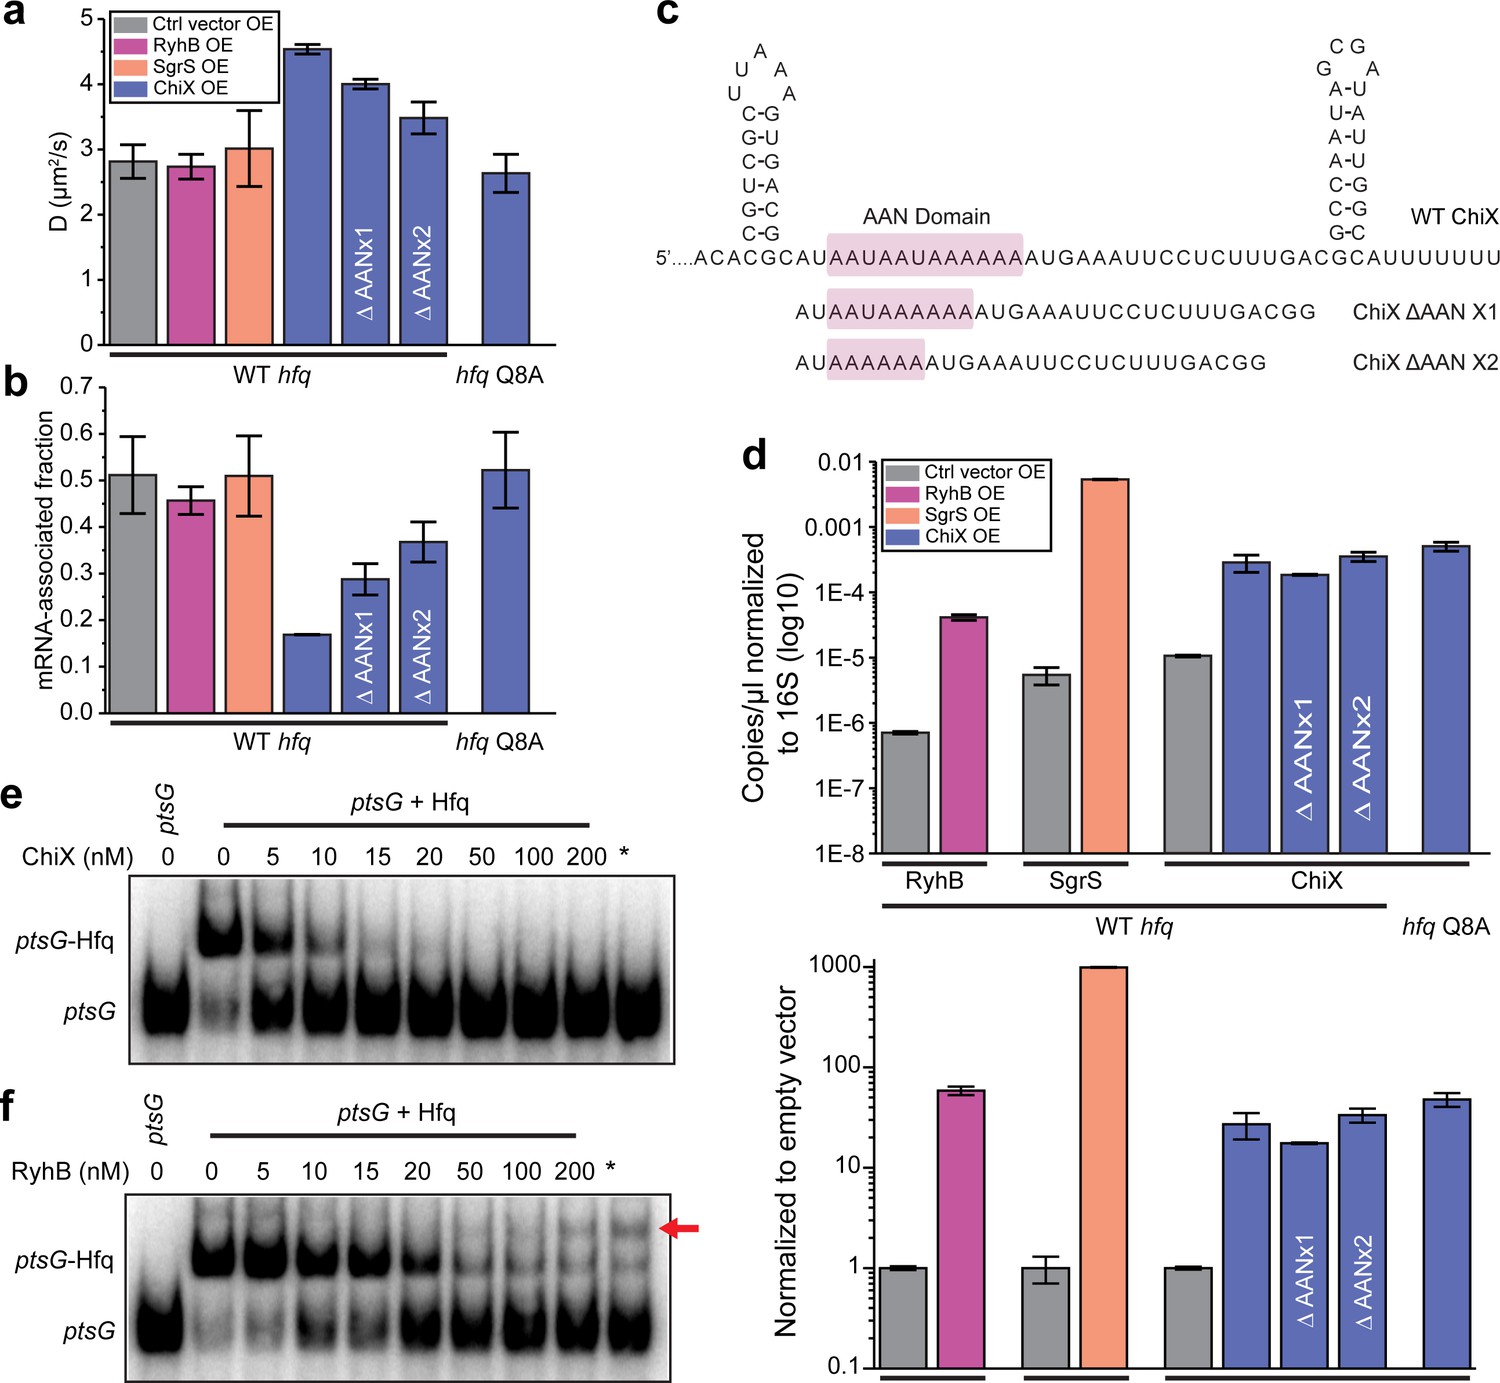
sRNAs can displace mRNA from Hfq in a face-dependent way.
(a) Diffusion coefficients of WT Hfq-mMaple3 with control vector, RyhB, SgrS, WT ChiX, two ChiX mutants (with one or two AAN motif deleted) overexpressed, or Hfq Q8A-mMaple3 with WT ChiX overexpressed. All sRNAs were produced from an IPTG inducible promoter. (b) mRNA-associated fraction of Hfq, for the same cases as in (a). Error bars in all plots represent the s.d. from two experimental replicates, with each data set containing ~5,000 trajectories (for D value calculation) or ~20,000 trajectories (for mRNA-associated fraction calculation) from ~100 cells. (c) Sequences of WT ChiX and two ChiX mutants (with one or two AAN motif deleted). (d) ddPCR measurement of the abundance of RyhB, SgrS, WT ChiX, and ChiX ΔAANx1-2 mutants in the WT hfq-mMaple3 and WT ChiX in the hfq Q8A-mMaple3 background. The abundance of each sRNA is either normalized to the 16S rRNA (top) or to the control vector (bottom). Competition of (e) ChiX and (f) RyhB for mRNA-associated Hfq. 20 nM of a ptsG RNA fragment was pre-incubated with 100 nM Hfq before addition of increasing concentration of ChiX or RyhB sRNA. * marks the cases in which Hfq (100 nM) and ChiX or RyhB (100 nM) were simultaneously added to 20 nM ptsG fragment. Data is representative of three independent experiments. All fitting results are reported in Supplementary file 1.
-
Figure 3—source data 1
ddPCR plots (d).
- https://cdn.elifesciences.org/articles/64207/elife-64207-fig3-data1-v2.xlsx
Figure 3—figure supplement 1

Determination of Kd values for Hfq interaction with RNAs.
20 nM radiolabeled (γ) RNAs was incubated with increasing concentration of Hfq (20–2000 nM) (a) γ-ptsG, (b) γ-RyhB, and (c) γ-ChiX. Fraction bound was determined by densitometry of two independent experiments. To determine Kd, data was fitted using nonlinear sigmoidal regression on GraphPad Prism.
-
Figure 3—figure supplement 1—source data 1
Quantification of electrophoretic mobility shift assay (EMSA) results.
- https://cdn.elifesciences.org/articles/64207/elife-64207-fig3-figsupp1-data1-v2.xlsx
Figure 3—figure supplement 2
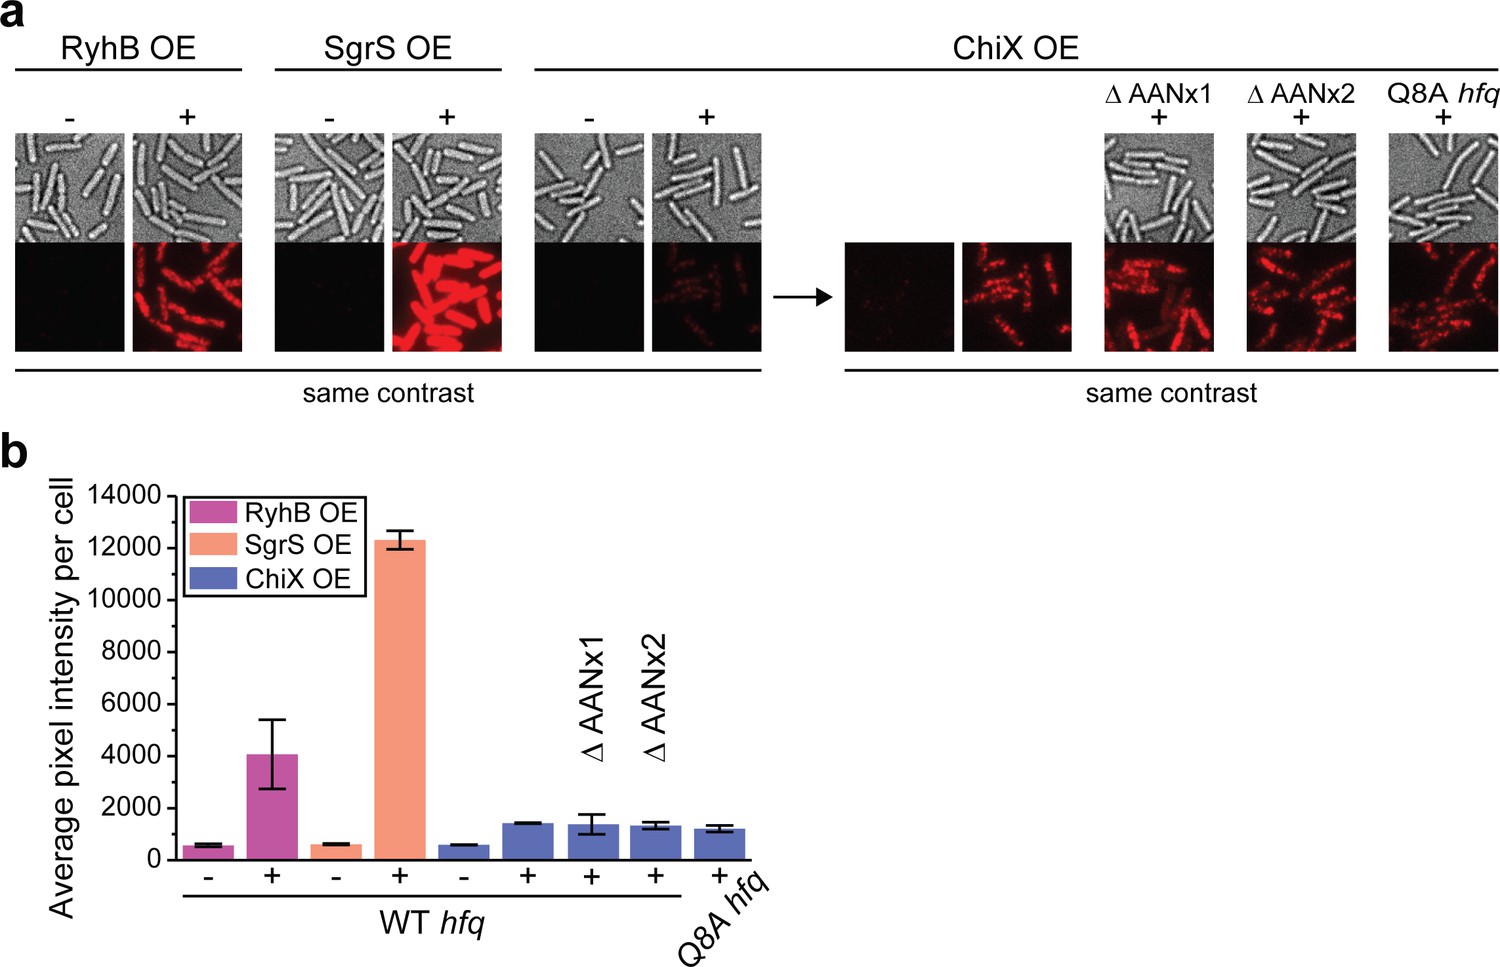
Quantification of sRNA expression by FISH.
(a) Representative FISH images of SgrS, RyhB, WT, and mutant ChiX. Each sRNA was labeled with three FISH probes. Each sRNA was expressed from pET15b plasmid (Supplementary file 2), induced by IPTG 1 mM for 50 min in MOPS EZ-rich medium with 0.2% fructose. IPTG was added when OD600 reached ~0.2. (b) Quantification of expressed sRNAs. The staining efficiency of ChiX is the lowest, consistent with ChiX being more protected by Hfq. Error bars in all plots represent the s.d. from two experimental replicates, with each data set containing ~500 cells.
-
Figure 3—figure supplement 2—source data 1
Quantification of FISH results (b).
- https://cdn.elifesciences.org/articles/64207/elife-64207-fig3-figsupp2-data1-v2.xlsx
Figure 4
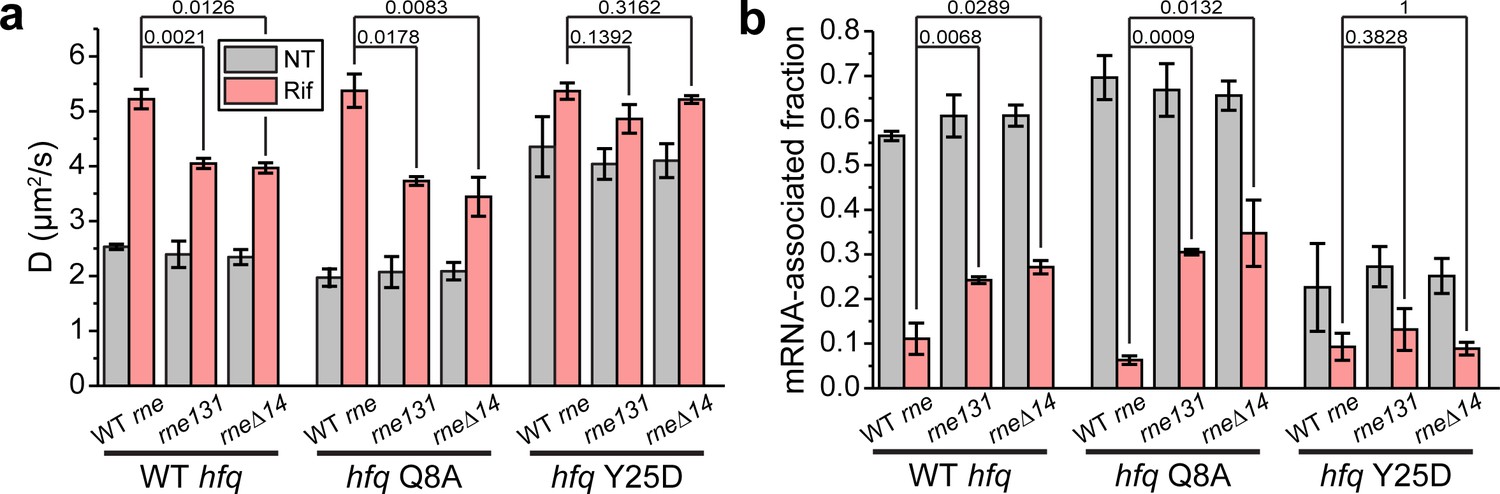
Hfq-RNase E interaction contributes to the recycling of Hfq from the mRNA-associated form to the mRNA-free form.
(a) Diffusion coefficients are plotted for WT, Q8A, and Y25D Hfq-mMaple3 in the rne131 and rneΔ14 backgrounds under NT and Rif conditions. (b) mRNA-associated fraction of Hfq, for the same cases in (a). p-values are reported between WT rne and rne mutants under Rif condition. Error bars in all plots represent the s.d. from two experimental replicates, with each data set containing ~5,000 trajectories (for D value calculation) or ~20,000 trajectories (for mRNA-associated fraction calculation) from ~100 cells. All fitting results are reported in Supplementary file 1.
-
Figure 4—source data 1
Diffusion coefficients and mRNA-bound fractions of Hfq in the backgrounds of RNase E mutants.
- https://cdn.elifesciences.org/articles/64207/elife-64207-fig4-data1-v2.xlsx
Figure 5 with 1 supplement
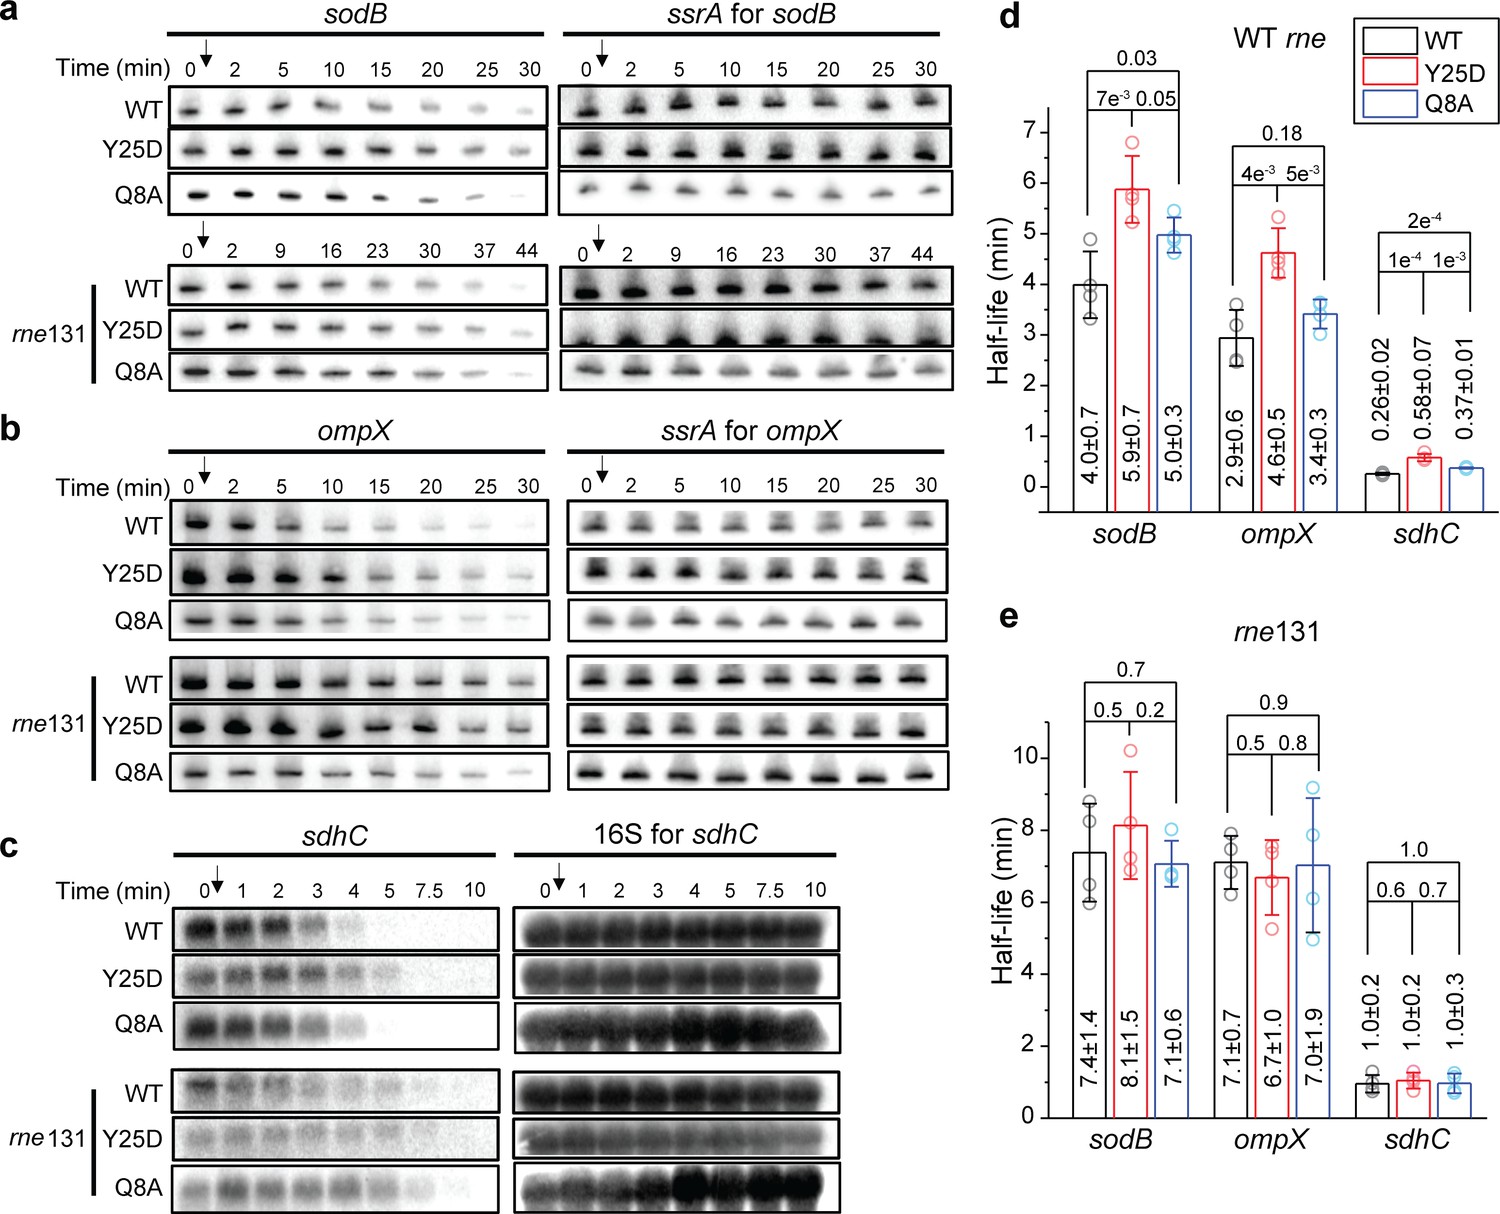
Hfq-RNase E interaction contributes to the regulation of mRNA degradation.
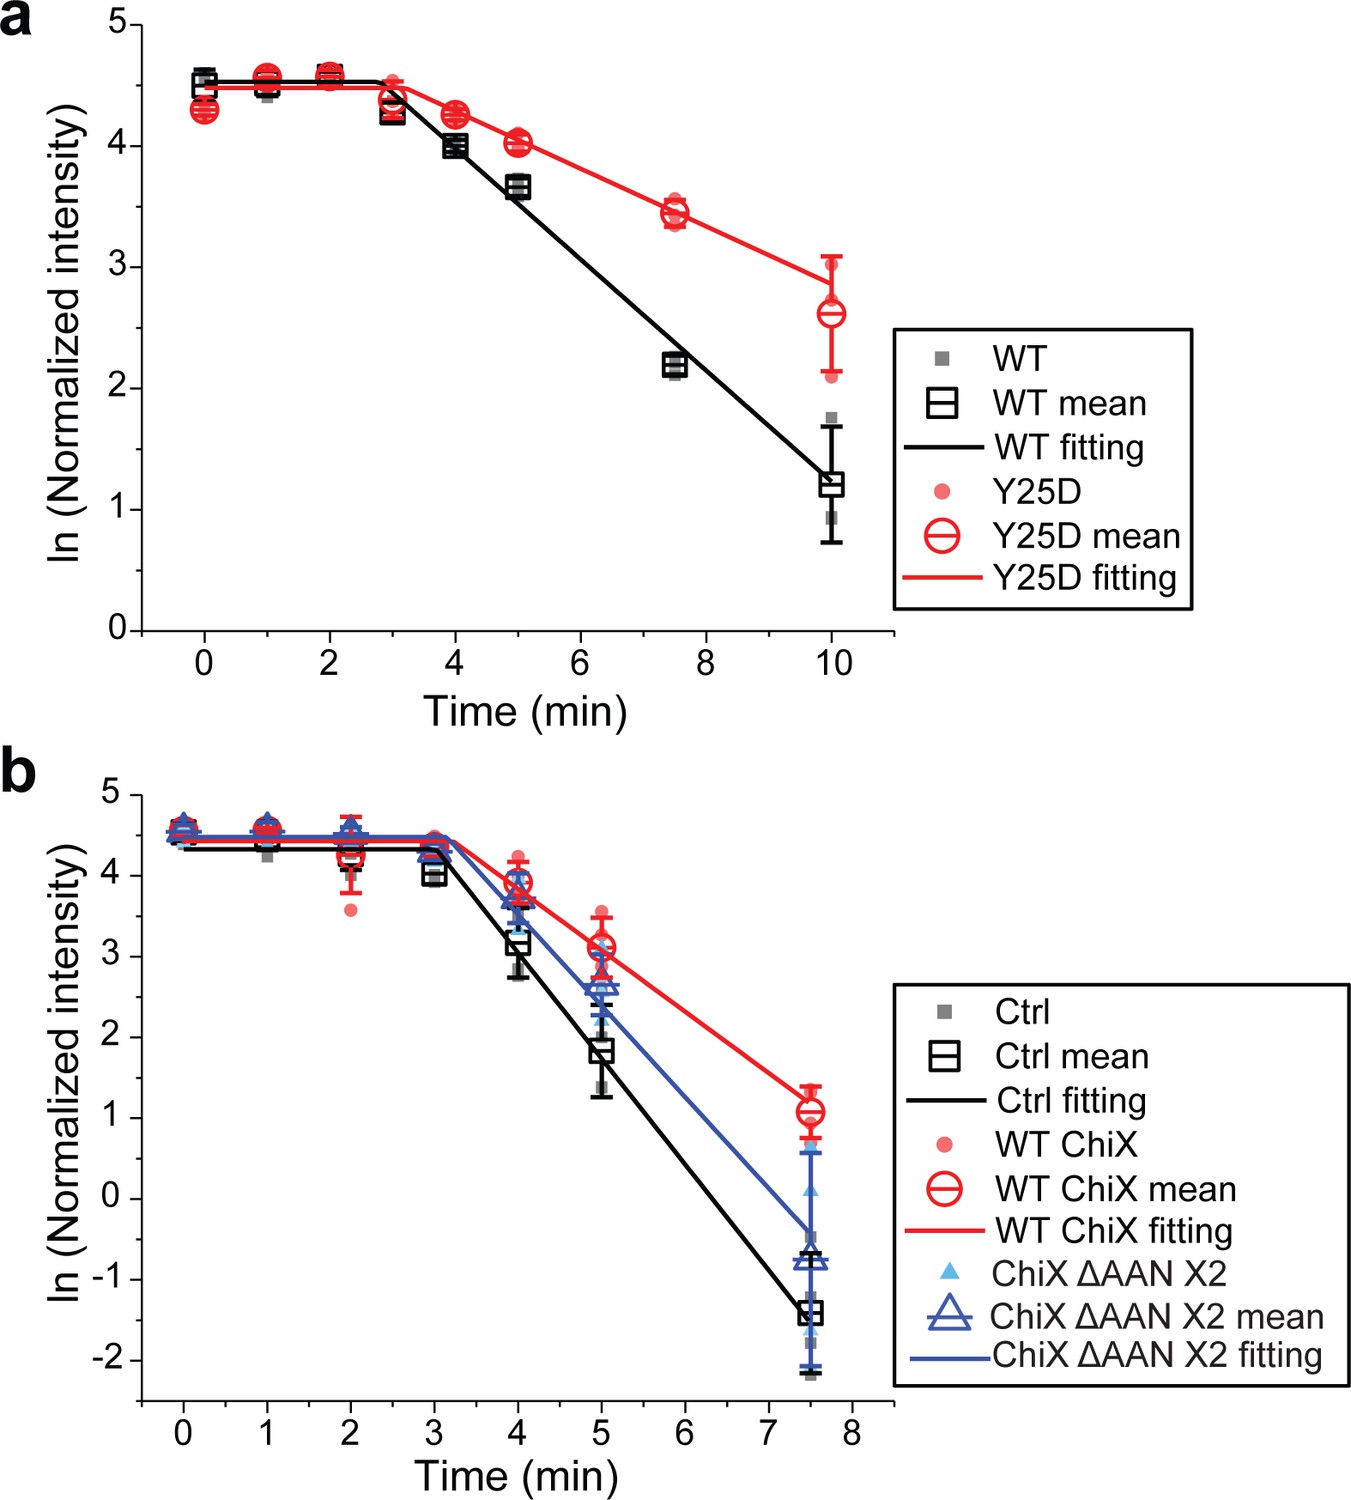
The abundance of (a) sodB, (b) ompX, and (c) sdhC mRNA in the presence of WT Hfq, Hfq Y25D, or Hfq Q8A in the WT rne or rne131 background. Corresponding sRNAs were knocked out for each of the mRNAs (ΔryhBΔfnrS for sodB, ΔcyaRΔmicA for ompX, and ΔryhBΔspfΔrybB for sdhC). Strains were grown in MOPS EZ-rich medium containing 0.2% glucose until OD600 = 0.5. Rifampicin was added as indicated by the arrow and total RNA was extracted at specific time points. ssrA, or 16S rRNA was used as loading controls. Relative abundance of mRNA quantified by densitometry as a function of time is presented in Figure 5—figure supplement 1. (d and e) Half-lives of the mRNAs determined from (a) to (c). Scatter plot represents the data points from individual replicates, and bar graph with error bars represents the mean and s.d. of four biological replicates. p-values from t-test are reported for each pairwise comparison.
-
Figure 5—source data 1
Decay rates and half-lives of mRNAs.
- https://cdn.elifesciences.org/articles/64207/elife-64207-fig5-data1-v2.xlsx
Figure 5—figure supplement 1
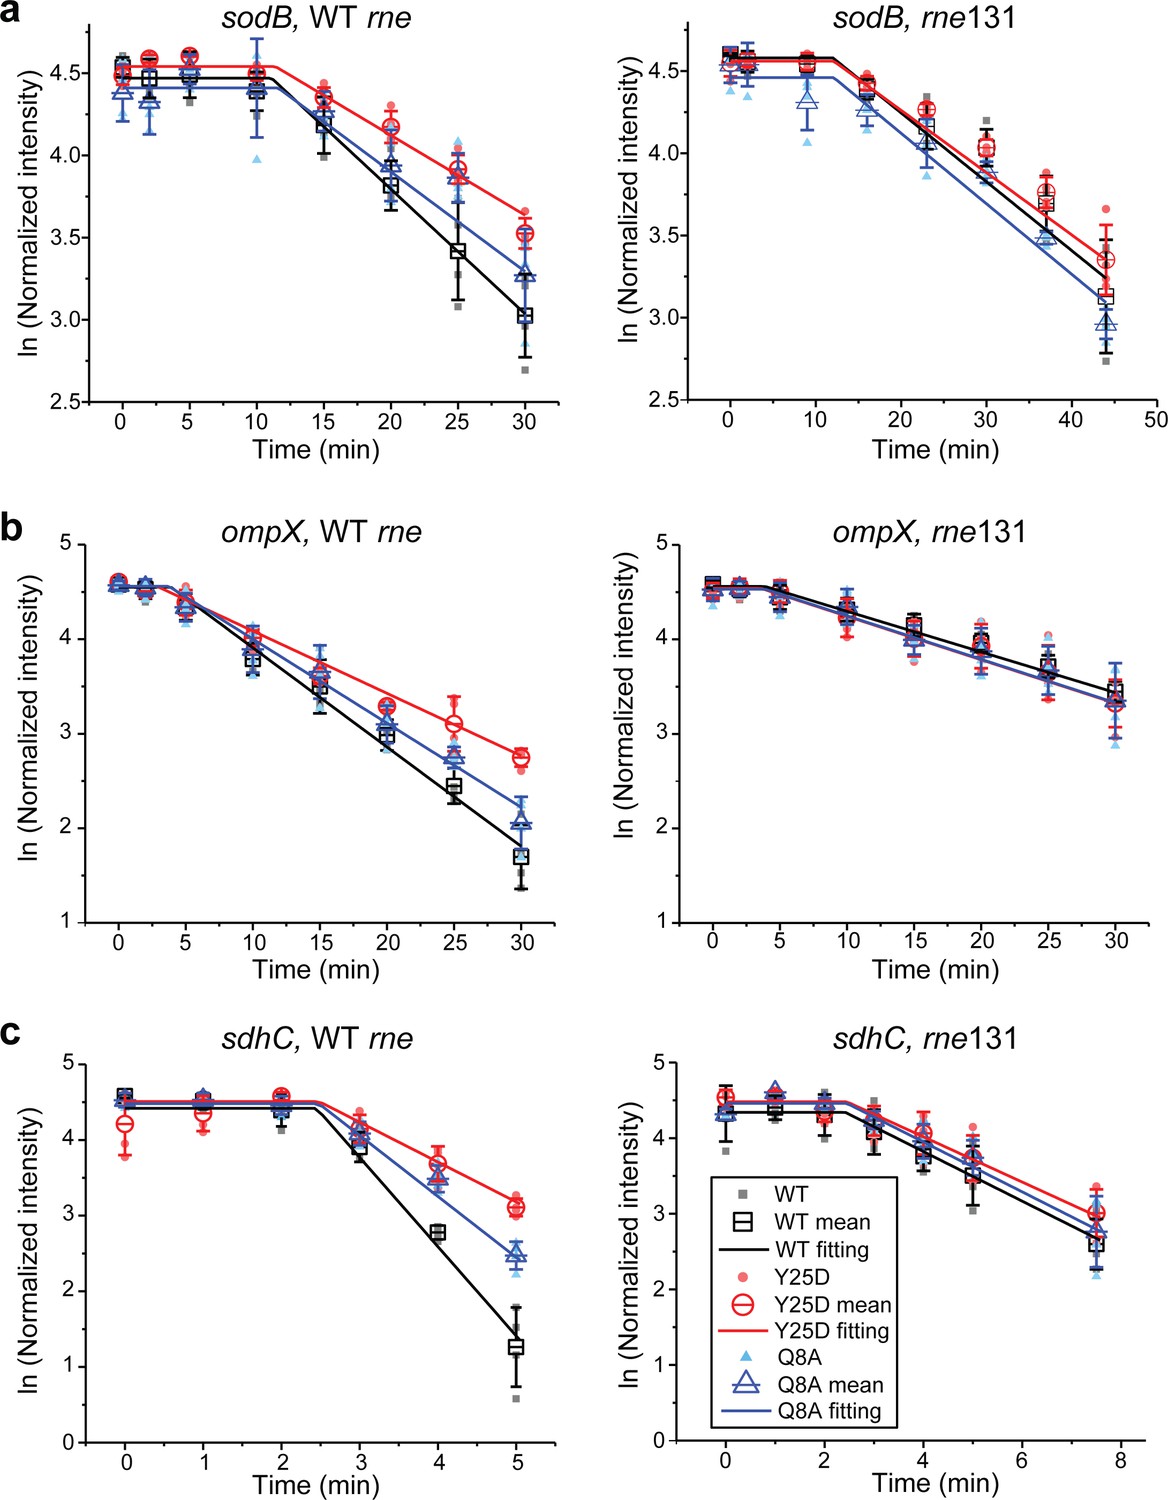
Quantification of northern blot.
Relative abundance of mRNA quantified by densitometry as a function of time based on the northern blot images from (a) to (c) of Figure 5. The data at each time point from all replicates, as well as the mean and s.d. are shown as scatter plots. Solid curves represent the fitting using piecewise function in the log space.
Figure 6 with 1 supplement
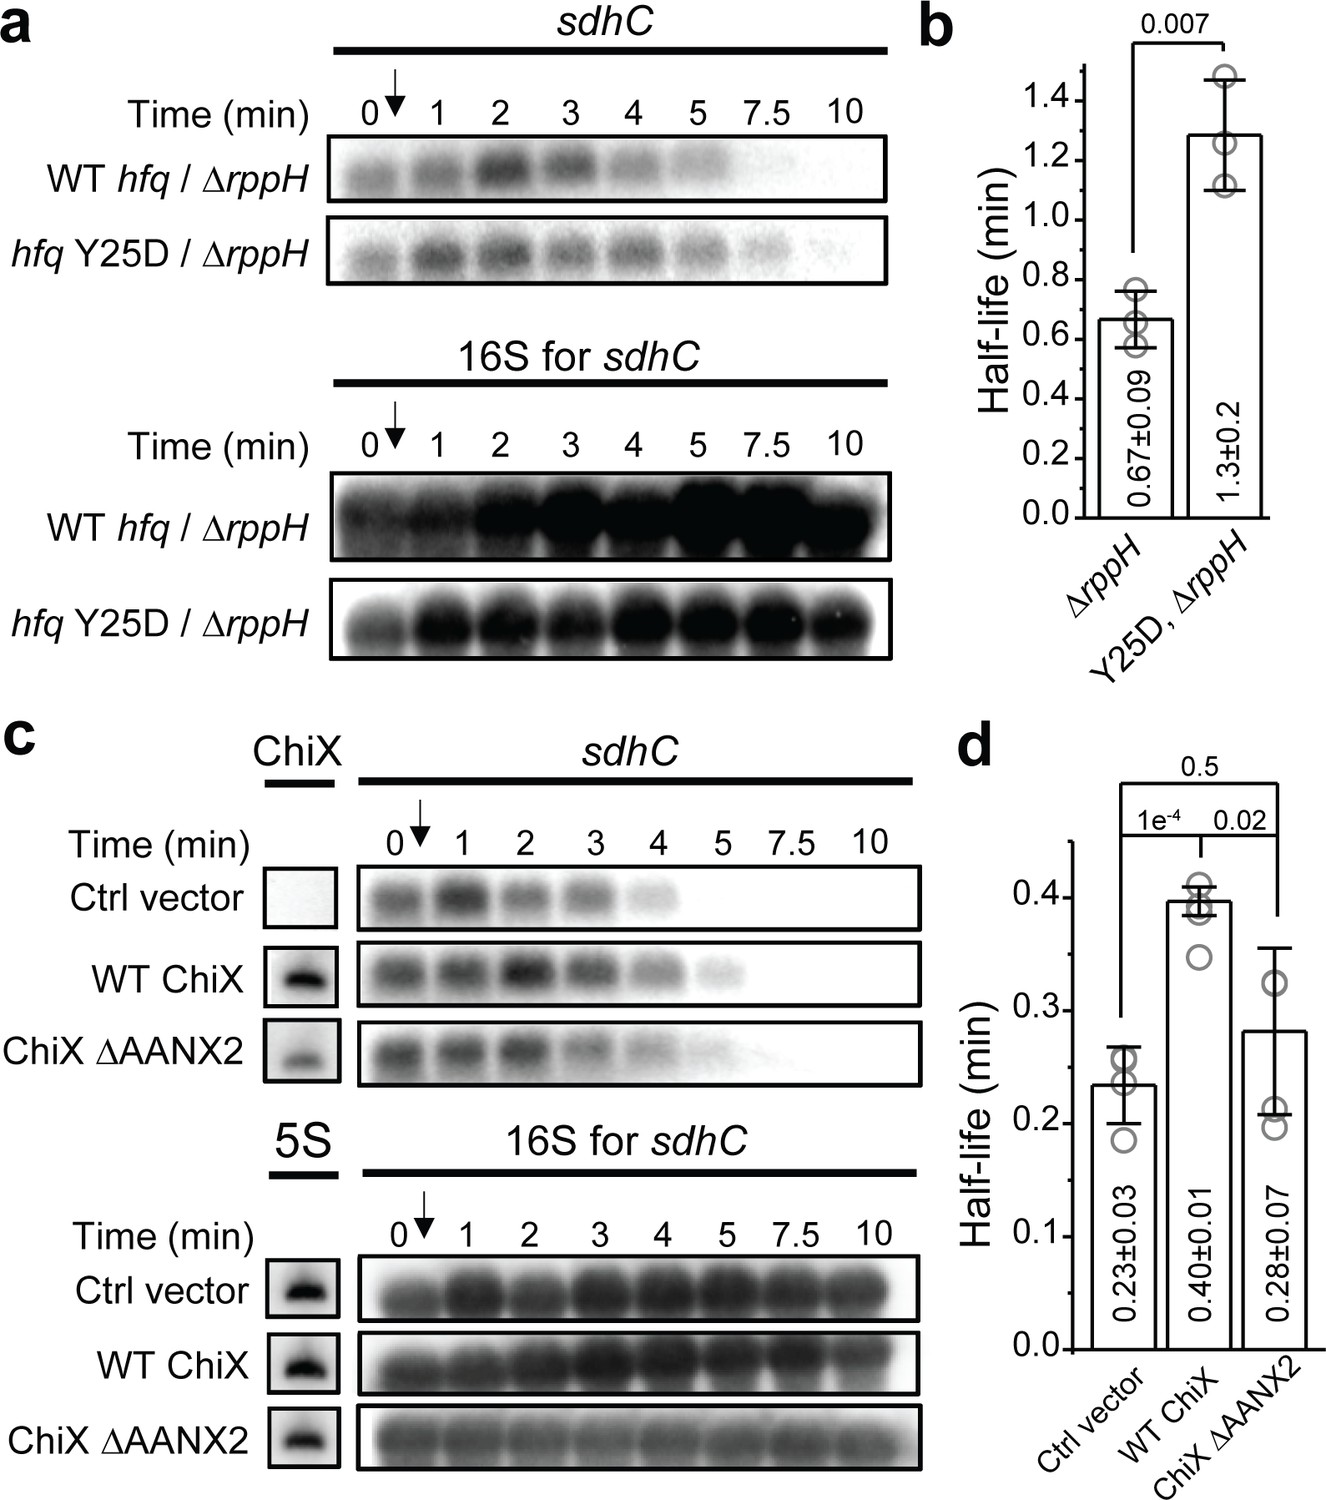
Effect of RppH and ChiX on Hfq-mediated regulation on mRNA degradation.
(a) The abundance of sdhC mRNA in the presence of WT Hfq or Hfq Y25D in the ΔryhBΔspfΔrybBΔrppH background. Strains were grown in MOPS EZ-rich medium containing 0.2% glucose and rifampicin was added at OD600 = 0.5. (b) Half-life of sdhC mRNA determined from (a). (c) The abundance of sdhC mRNA in the presence of control vector, WT ChiX, and mutant ChiX with two AAN motif deleted. Strains were grown in MOPS EZ-rich medium containing 0.2% fructose and 1 mM IPTG was added at OD600 = 0.1 to induce ChiX for 1 hr before addition of rifampicin. (d) Half-life of sdhC mRNA determined from (c). Scatter plot represents the data points from individual replicates, and bar graph with error bars represents the mean and s.d. of three to four biological replicates. p-values from t-test are reported for each pairwise comparison.
-
Figure 6—source data 1
Decay rates and half-lives of mRNAs.
- https://cdn.elifesciences.org/articles/64207/elife-64207-fig6-data1-v2.xlsx
Figure 6—figure supplement 1
Quantification of northern blot.
Relative abundance of mRNA quantified by densitometry as a function of time based on the northern blot images from (a) (in the background of ΔsRNAΔrppH) and (b) (with ChiX overexpression) of Figure 6. The data at each time point from all replicates, as well as the mean and s.d. are shown as scatter plots. Solid curves represent the fitting using piecewise function in the log space.
Figure 7
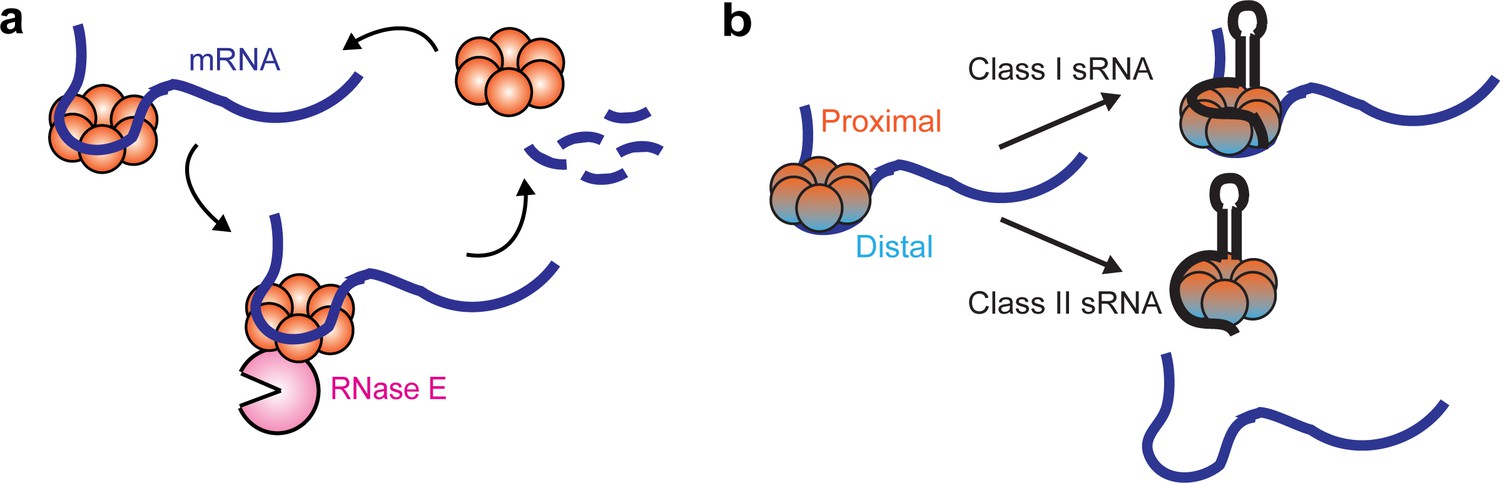
Dynamic interactions between Hfq and cellular RNAs.
(a) Hfq facilitates the degradation of certain Hfq-bound mRNAs through the recruitment of RNase E. (b) Class I or Class II sRNAs can get access of mRNA-associated Hfq through co-occupying different binding sites of Hfq simultaneously, or displacing mRNA from the distal face of Hfq respectively.
Author response image 1
Author response image 2
Author response image 3
Author response image 4
Tables
Key resources table
| Reagent type (species) or resource | Designation | Source or reference | Identifiers | Additional information |
|---|---|---|---|---|
| Chemical compound, drug | a-a'-dipyridyl crystalline | Fisher Scientific | Catalog #: D95-5 | |
| Chemical compound, drug | D-fructose | Bioshop | Catalog #: FRC180 | |
| Chemical compound, drug | IPTG (for in vitro study) | Bioshop | Catalog #: IPT001 | |
| Chemical compound, drug | IPTG (for microscopy imaging) | Goldbio | 367-93-1 | |
| Chemical compound, drug | L(+)-arabinose | Bioshop | Catalog #: ARB222 | |
| Chemical compound, drug | Rifampicin (for in vitro study) | Bioshop | Catalog #: RIF222 | |
| Chemical compound, drug | Rifampicin (for microscopy imaging) | Sigma-Aldrich | R3501-1G | |
| Commercial assay, kit | 2× QX200 ddPCR EvaGreen Supermix | Bio-Rad | RRID:SCR_019707 | Catalog #: 1864034 |
| Other | EZ-rich define media | Teknova | Catalog #: M2105 Bacterial growth media | |
| Other | HiTRAP Heparin column HP (resin) | GE Healthcare Life Sciences | Catalog #: 17-0406-01 Protein purification column | |
| Peptide, recombinant protein | Transcriptor reverse transcriptase | Roche | Catalog #: 3531317001 | |
| Software, algorithm | GraphPad Prism | GraphPad Prism | RRID:SCR_002798 | Version 8.2.1 |
| Software, algorithm | Image studio lite | Li-COR | RRID:SCR_013715 | Version 5.2 |
| Software, algorithm | MATLAB | MathWorks | Version R2019b | |
| Software, algorithm | NIS-Element | Nikon | Version 4.51 | |
| Software, algorithm | QuantaSoft | Bio-Rad | Catalog #: 1864011 |
Additional files
-
Source code 1
MATLAB scripts for tracking analysis and MSD/osd2 calculation.
- https://cdn.elifesciences.org/articles/64207/elife-64207-code1-v2.zip
-
Supplementary file 1
List of all tracking data sets used to extract mRNA-associated fractions in this study.
- https://cdn.elifesciences.org/articles/64207/elife-64207-supp1-v2.xlsx
-
Supplementary file 2
List of all strains and plasmids used in this study.
- https://cdn.elifesciences.org/articles/64207/elife-64207-supp2-v2.xlsx
-
Supplementary file 3
List of all oligonucleotides used in this study.
- https://cdn.elifesciences.org/articles/64207/elife-64207-supp3-v2.xlsx
-
Transparent reporting form
- https://cdn.elifesciences.org/articles/64207/elife-64207-transrepform-v2.pdf
Download links
A two-part list of links to download the article, or parts of the article, in various formats.
Downloads (link to download the article as PDF)
Open citations (links to open the citations from this article in various online reference manager services)
Cite this article (links to download the citations from this article in formats compatible with various reference manager tools)
Dynamic interactions between the RNA chaperone Hfq, small regulatory RNAs, and mRNAs in live bacterial cells
eLife 10:e64207.
https://doi.org/10.7554/eLife.64207


