The molecular coupling between substrate recognition and ATP turnover in a AAA+ hexameric helicase loader
- Department of Biophysics and Biophysical Chemistry, Johns Hopkins School of Medicine, United States
- Saul Ewing Arnstein & Lehr, LLP, Centre Square West, United States
- Department of Biomolecular Chemistry, University of Wisconsin School of Medicine and Public Health, United States
Figures
Figure 1 with 1 supplement
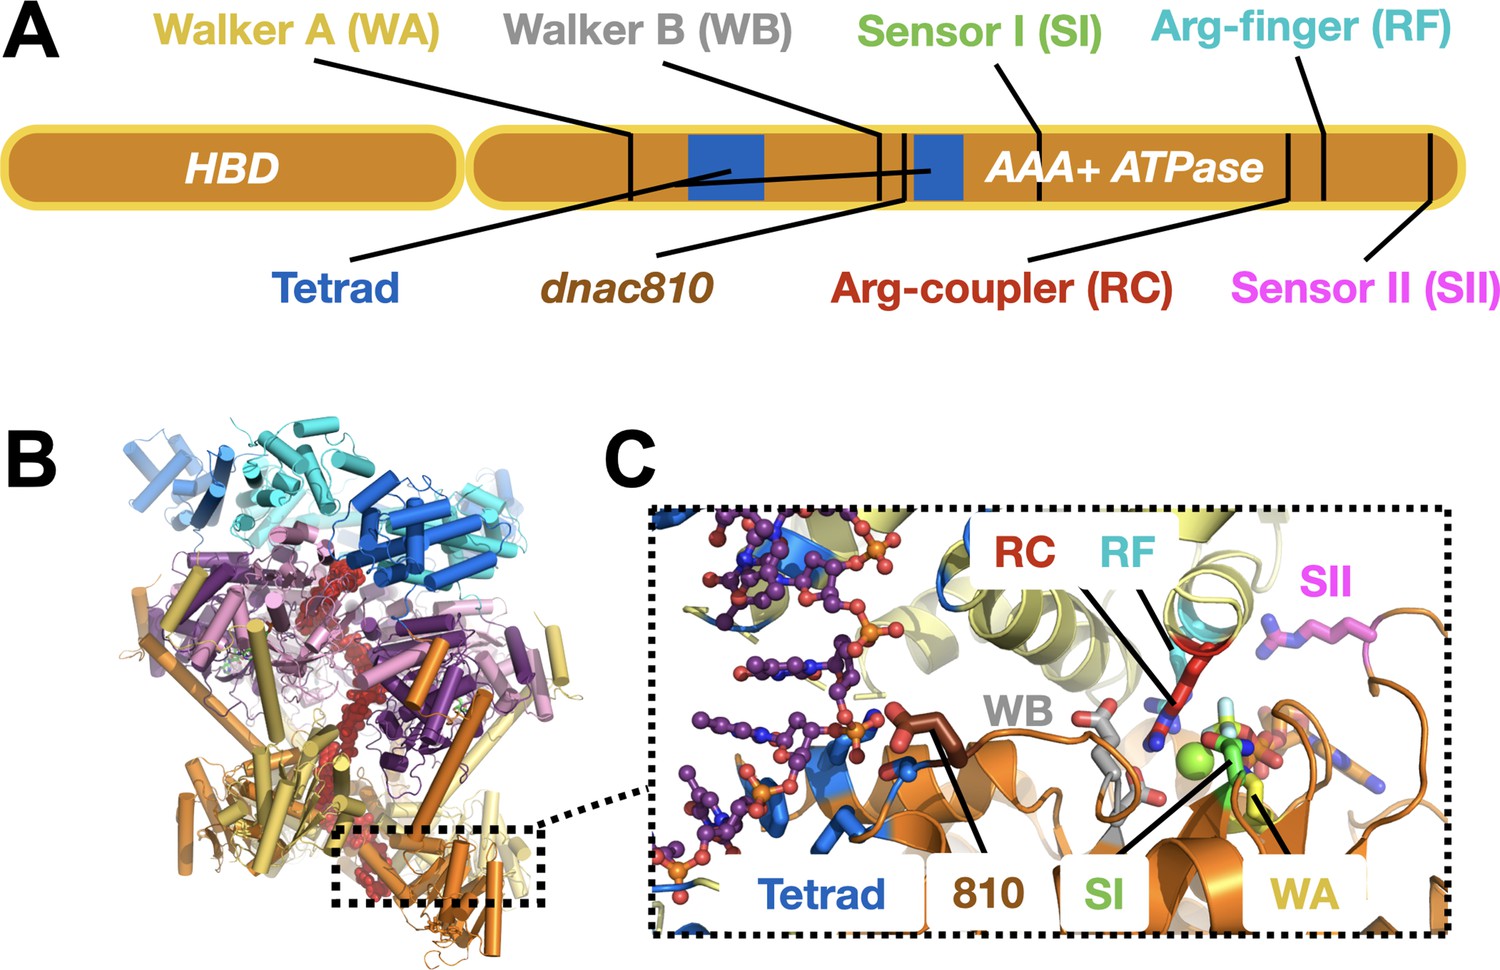
DnaC functional elements.
(A) Domain organization of DnaC. The helicase-binding domain (HBD) spans residues 1–75 of the full-length protein. (B) Structure of a single-stranded DNA-bound DnaBC complex from E. coli shown as a cartoon view (Arias-Palomo et al., 2019). DnaB is colored blue (NTD) and purple (RecA ATPase domain), DnaC subunits are alternatingly orange and yellow, and ssDNA is red. (C) Close-up cartoon view of the DnaC active site showing elements mutated in this study. One protomer is colored orange, the other yellow; DNA is red. Motifs: WA – Walker A (Lys112); WB – Walker B (E170); SI – Sensor I (Asn203); RC – Arginine Coupler (Arg216); RF – Arginine Finger (Arg220); SII – Sensor II; 810 – Glu176; Tetrad (ssDNA-binding locus) – Lys143, Phe146, Ser177, Tyr179.
Figure 1—video 1
Morph movie going from Apo (DNA-free) to DNA-bound states of DnaB-bound DnaC, showing a close-up of the DnaC ATPase site and the movement of the Arg-coupler.
Conserved catalytic amino acids colored as per Figure 1C.
Figure 2 with 1 supplement
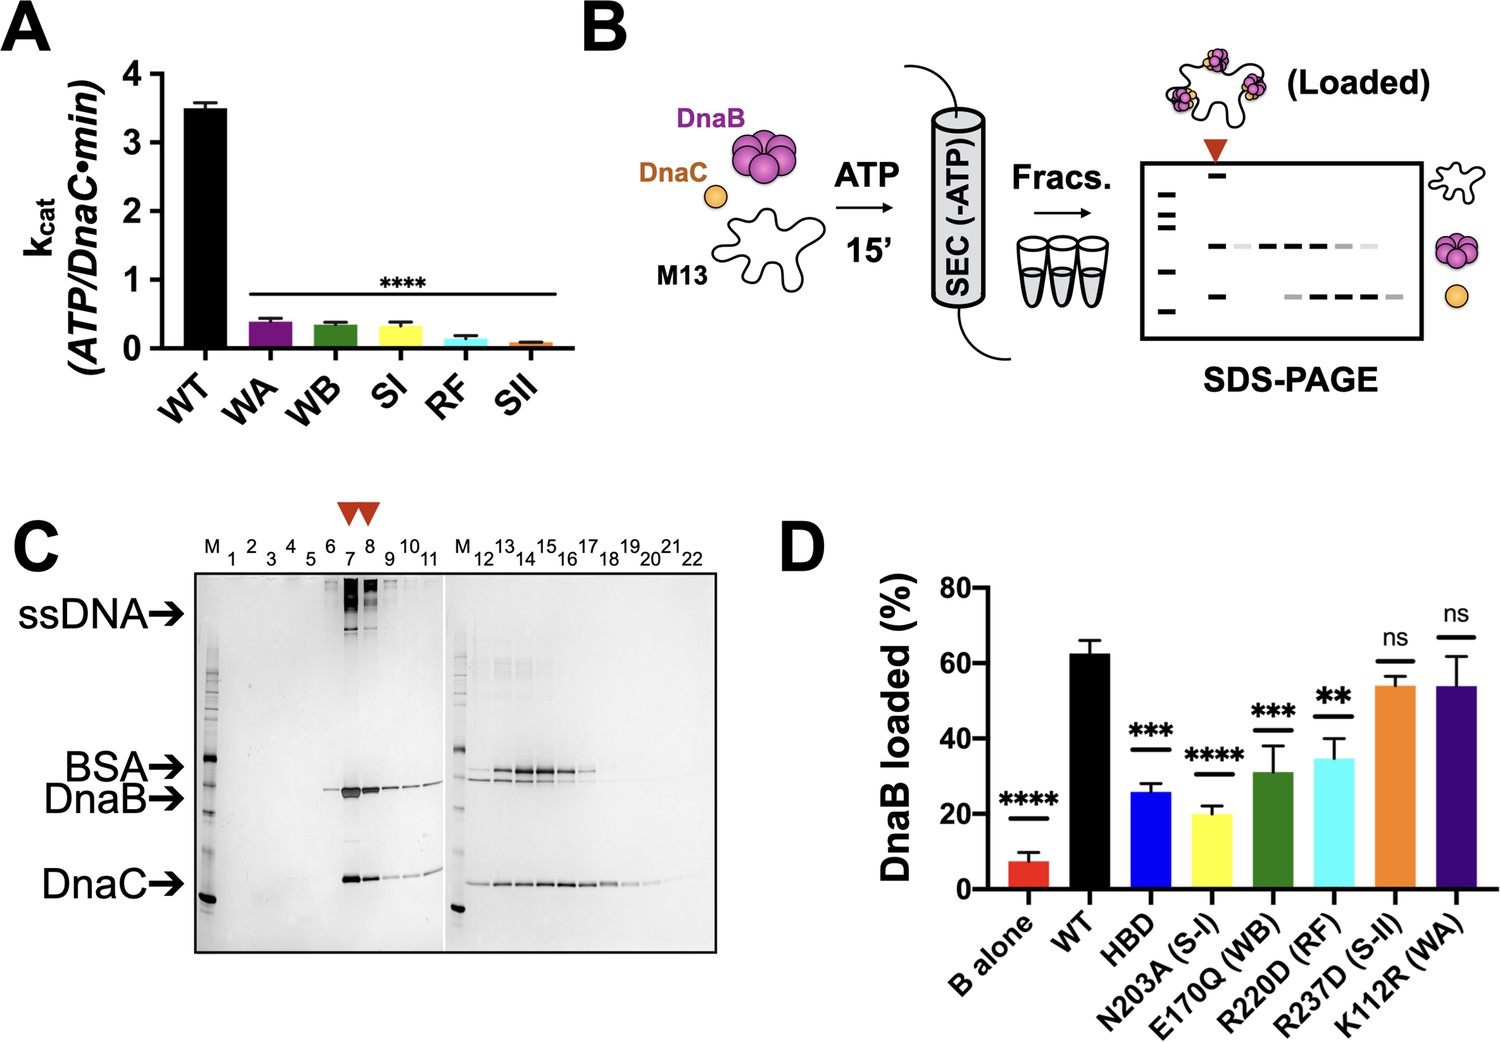
Effects of AAA+ motif mutations on DnaC ATPase and DnaB loading activities.
(A) Comparison of ATPase activity between wild-type DnaC and Walker-A (WA), Walker-B, Sensor I (WB), Arg-finger (RF), Sensor I (SI), and Sensor II (SII) mutants. Assays were carried out in the presence of ssDNA and an ATPase-defective mutant (KAEA) of DnaB. (B) Schematic of DnaB loading assay. Nucleotide is generally omitted from the running buffer for the size-exclusion column. (C) Silver-stained sodium dodecyl sulphate-polyacrylamide gel electrophoresis (SDS-PAGE) analysis of fractions (lane numbers) from a representative loading reaction containing wild-type DnaB, DnaC, and M13 ssDNA that has been passed over a sizing column. Lanes where DnaB co-migrates with DNA (red arrowheads) indicate loading. Some DnaC remains bound to loaded DnaB under these conditions. ‘M’ – sizing marker. (D) Comparison of loading efficiencies for wild-type DnaB in the presence of different DnaC ATPase mutants. HBD – helicase-binding domain of DnaC. Error bars on this and all other bar graphs reflect the standard deviation in loading from three independent experimental replicates. Asterisks on this and all other bar graphs correspond to p-values from one-way ANOVA tests of all mutants against WT DnaC: ****p<0.0001; ***p<0.001; **p<0.01; *p<0.05; ‘ns’ – not significant.
-
Figure 2—source data 1
Image of full WT loading assay gel and ATPase data.
- https://cdn.elifesciences.org/articles/64232/elife-64232-fig2-data1-v2.zip
Figure 2—figure supplement 1
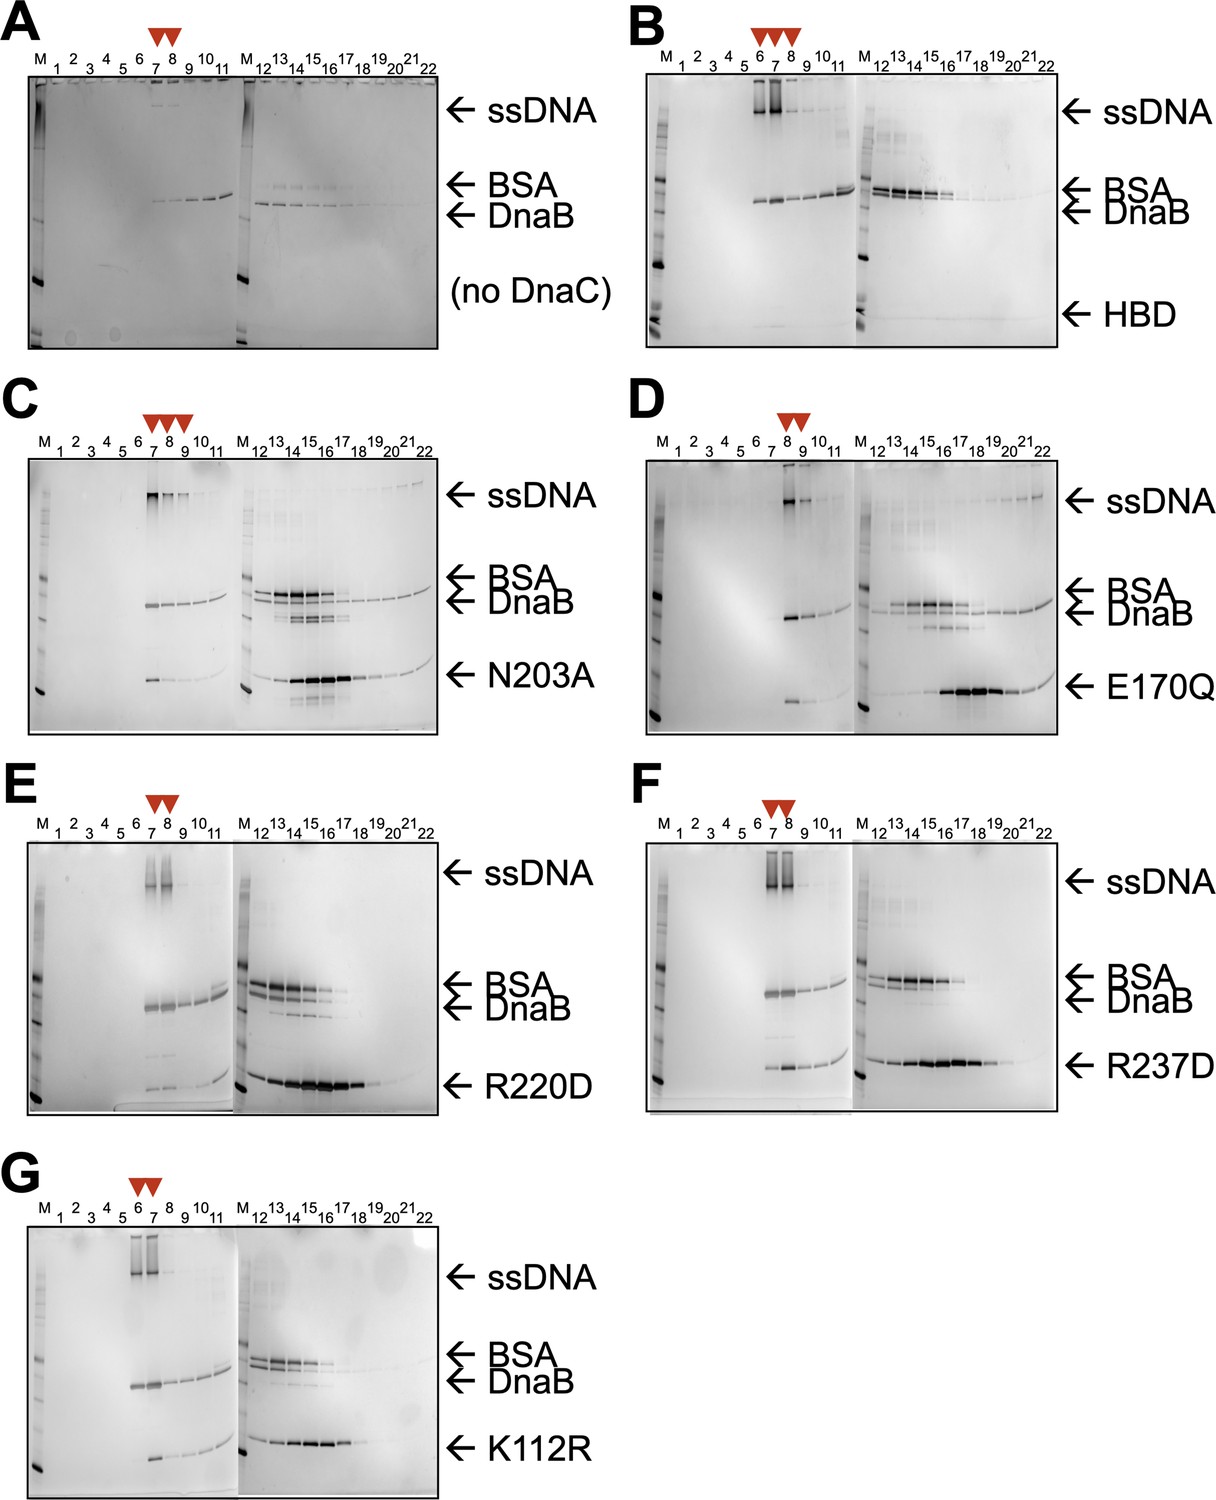
SDS-PAGE analysis of sizing-column fractions from DnaB loading reactions containing.
(A) No DnaC, (B) the DnaC HBD, (C) a DnaC SI mutant, (D) a DnaC WB mutant, (E) a DnaC RF mutant, (F) a DnaC SII mutant, and (G) a DnaC WA mutant. Red arrowheads indicate early fractions where DnaB co-migrates with ssDNA, indicating loading.
-
Figure 2—figure supplement 1—source data 1
Images of full loading assay gels shown in Figure 2—figure supplement 1.
- https://cdn.elifesciences.org/articles/64232/elife-64232-fig2-figsupp1-data1-v2.zip
Figure 3 with 1 supplement
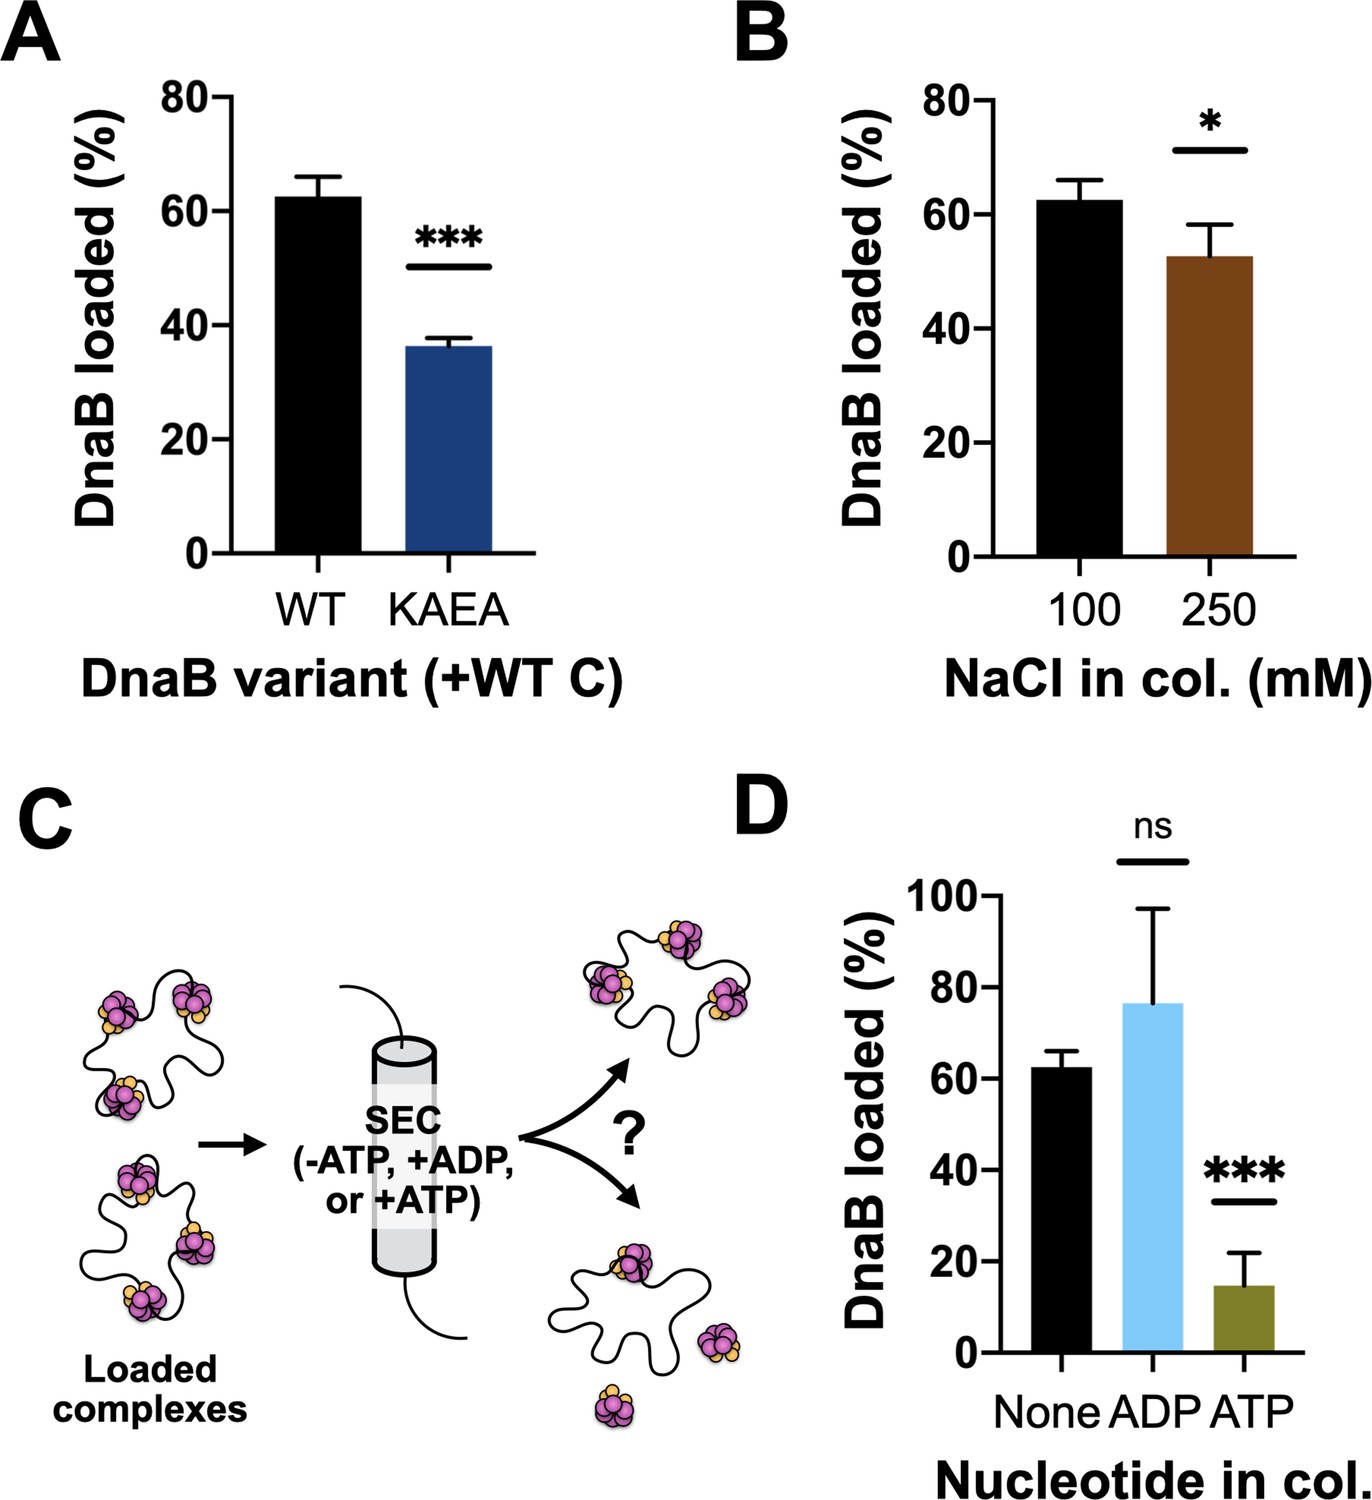
DnaB loading is impacted by helicase ATPase status and can be reversed by DnaC.
(A) DnaB loading is compromised in an ATPase-deficient mutant of DnaB. (B) DnaB loaded on M13 ssDNA was largely salt resistant, consistent with structural studies showing that the helicase ring topologically closes around DNA in the presence of DnaC. (C) Schematic of helicase unloading assay in which different nucleotides are added to the column running buffer. (D) DnaC can actively unload DNA in an ATP-dependent manner. The inclusion of ATP in the column running buffer reverses stable DnaB loading, whereas ADP does not.
-
Figure 3—source data 1
Images and quantification of full loading assay gels shown in Figure 3.
- https://cdn.elifesciences.org/articles/64232/elife-64232-fig3-data1-v2.zip
Figure 3—figure supplement 1
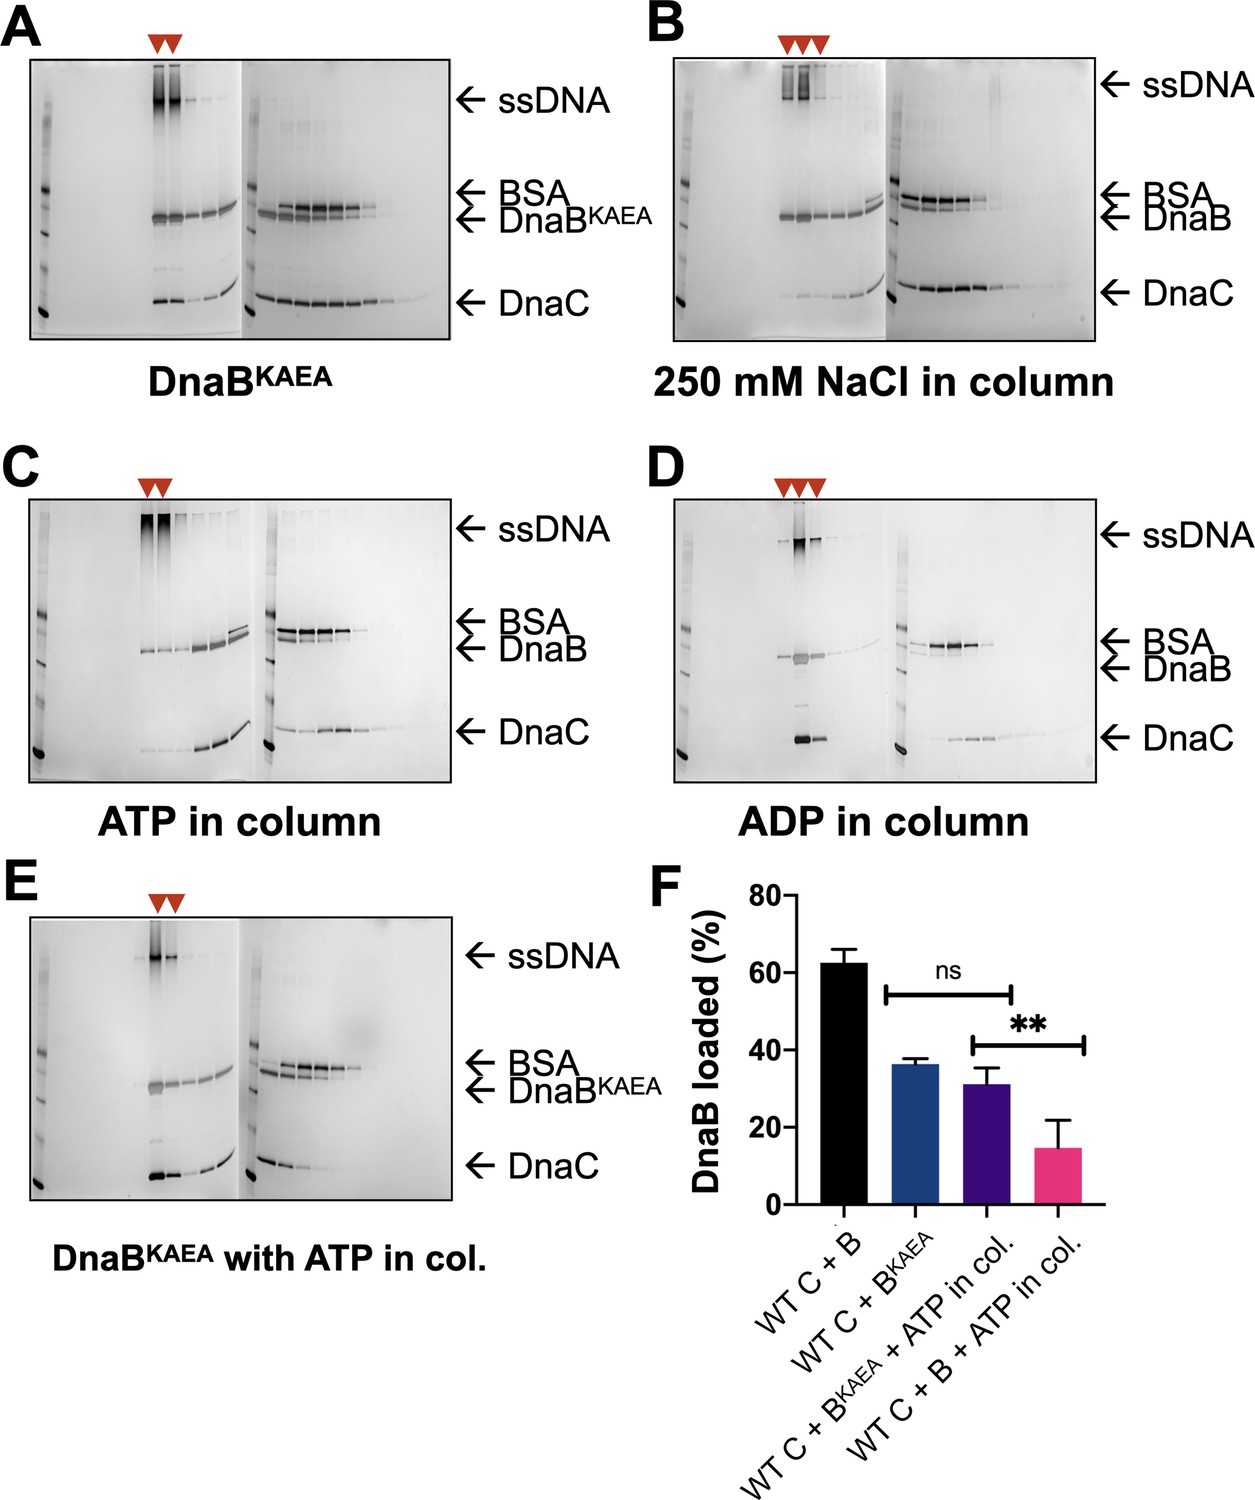
Representative loading assay gels for DnaC AAA+ mutants.
SDS-PAGE analysis of representative sizing-column fractions (lane numbers) from DnaB loading reactions containing (A) WT DnaC and an ATPase-deficient (KAEA) mutant of DnaB, (B) WT DnaB and DnaC, but where 250 mM NaCl was used in the column running buffer, (C) WT DnaB and DnaC, but where ATP was added to the column running buffer, (D) WT DnaB and DnaC, but where ADP was added to the column running buffer, and (E) WT DnaC and the KAEA ATPase-deficient mutant of DnaB, but where ATP was added to the column running buffer. All gels except that shown in (B) reflect experiments where columns were run in 100 mM NaCl. Red arrowheads mark where DnaB co-migrates with DNA, indicating loading. ‘M’ – sizing marker.
-
Figure 3—figure supplement 1—source data 1
Images and quantification of full loading assay gels shown in Figure 3—figure supplement 1.
- https://cdn.elifesciences.org/articles/64232/elife-64232-fig3-figsupp1-data1-v2.zip
Figure 4 with 1 supplement
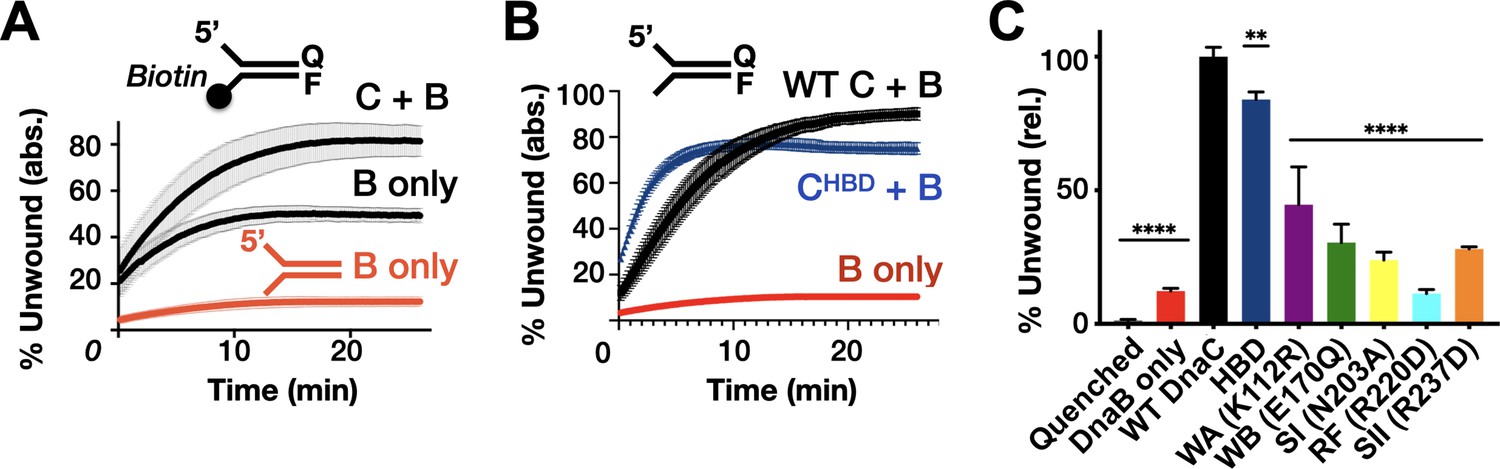
Effect of DnaC ATPase status and 3’-end accessibility on the stimulation of DNA unwinding by DnaB.
(A) The addition of a 3’ biotin-end block to a DNA fork partially stimulates DnaB-dependent fork unwinding compared to when DnaC is present. ‘F’ and ‘Q’ denote the positions of the fluorophore and quencher on the DNA substrates. (B) The isolated DnaC HBD readily stimulates unwinding of an unblocked fork compared to wild-type DnaC. (C) The ATPase activity of DnaC is necessary for stimulating fork unwinding by DnaB. For (A) and (B), the absolute percent of DNA strand separation as measured by a gain in fluorescence intensity is plotted as a function of time. For (C), the percent unwound shown is relative to wild-type DnaC. Error bars in this and all other unwinding curves reflect the standard deviation from different loads of the same reaction in a single experiment.
-
Figure 4—source data 1
Raw unwinding data for biotinylated fork and DnaC HBD and quantification of total % unwound.
- https://cdn.elifesciences.org/articles/64232/elife-64232-fig4-data1-v2.zip
Figure 4—figure supplement 1
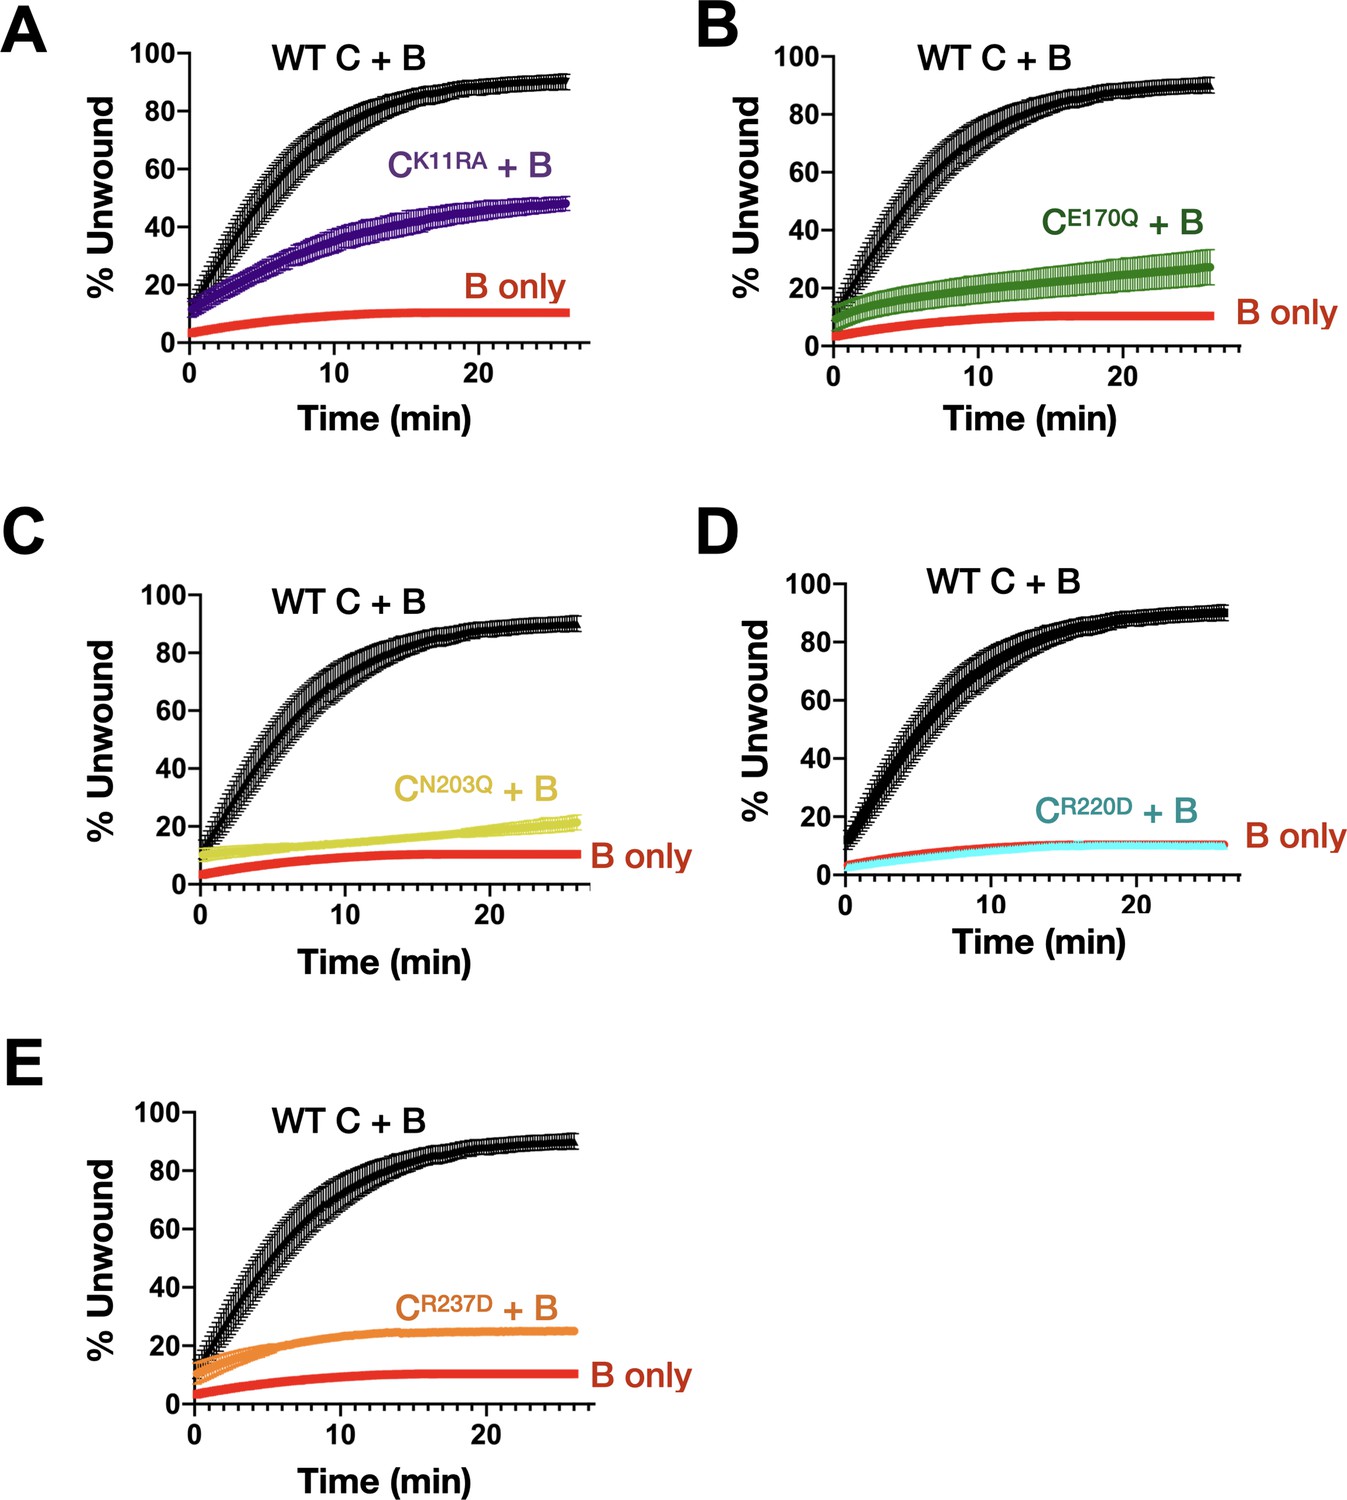
Effect of DnaC ATPase status on the stimulation of DnaB unwinding activity.
Graphs showing the gain in fluorescence intensity of a specified DnaC variant as compared to the ability of DnaB to unwind a model fork substrate in absence and presence of DnaC. DnaC mutants tested are (A) Walker-A, (B) Walker-B, (C) Sensor I, (D) Arg-finger, and (E) Sensor II.
-
Figure 4—figure supplement 1—source data 1
Raw unwinding data of DnaC AAA+ mutants.
- https://cdn.elifesciences.org/articles/64232/elife-64232-fig4-figsupp1-data1-v2.zip
Figure 5 with 1 supplement
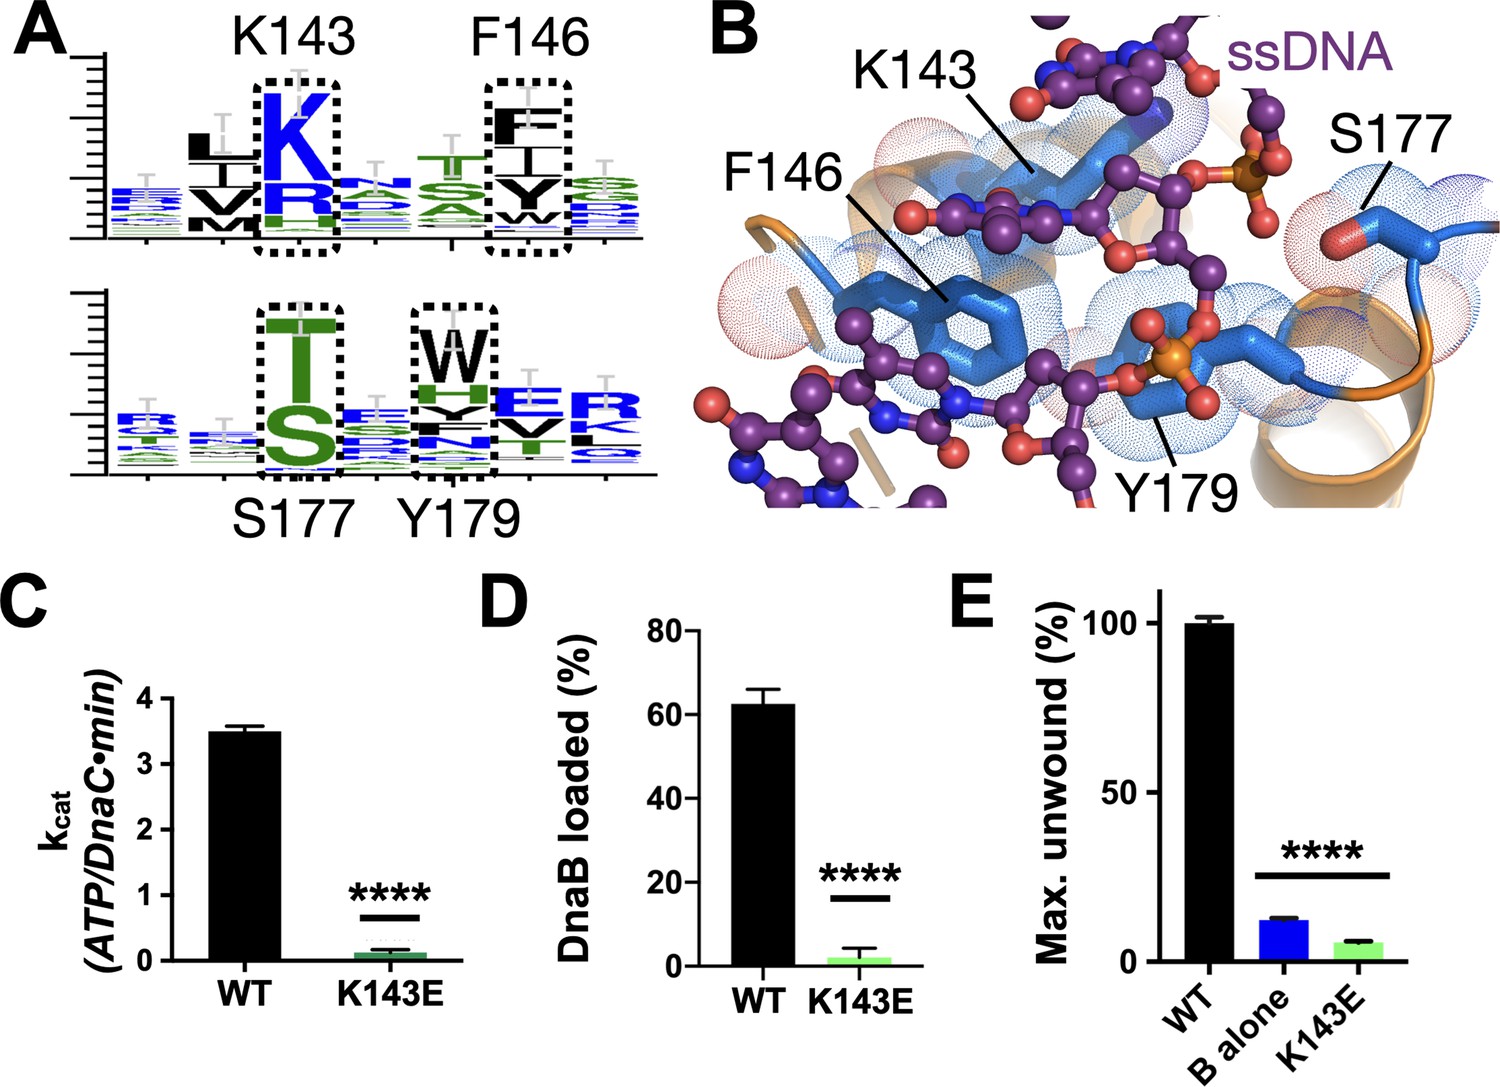
Effect of DNA binding on DnaC function.
(A) WebLogos (Schneider and Stephens, 1990) showing the conservation of the Lys143/Phe146 and Ser177/Tyr179 regions of DnaC. (B) Ribbon and stick representation showing how ssDNA binds to a tetrad of residues in DnaC (Arias-Palomo et al., 2019). (C–E) Bar graphs showing that Lys143 of DnaC is essential to (C) DnaC ATPase function, (D) DnaB loading, and (E) stimulation of DNA fork unwinding by DnaB.
-
Figure 5—source data 1
Raw ATP hydrolysis, helicase loading, and unwinding data for DnaC K143E.
- https://cdn.elifesciences.org/articles/64232/elife-64232-fig5-data1-v2.zip
Figure 5—figure supplement 1
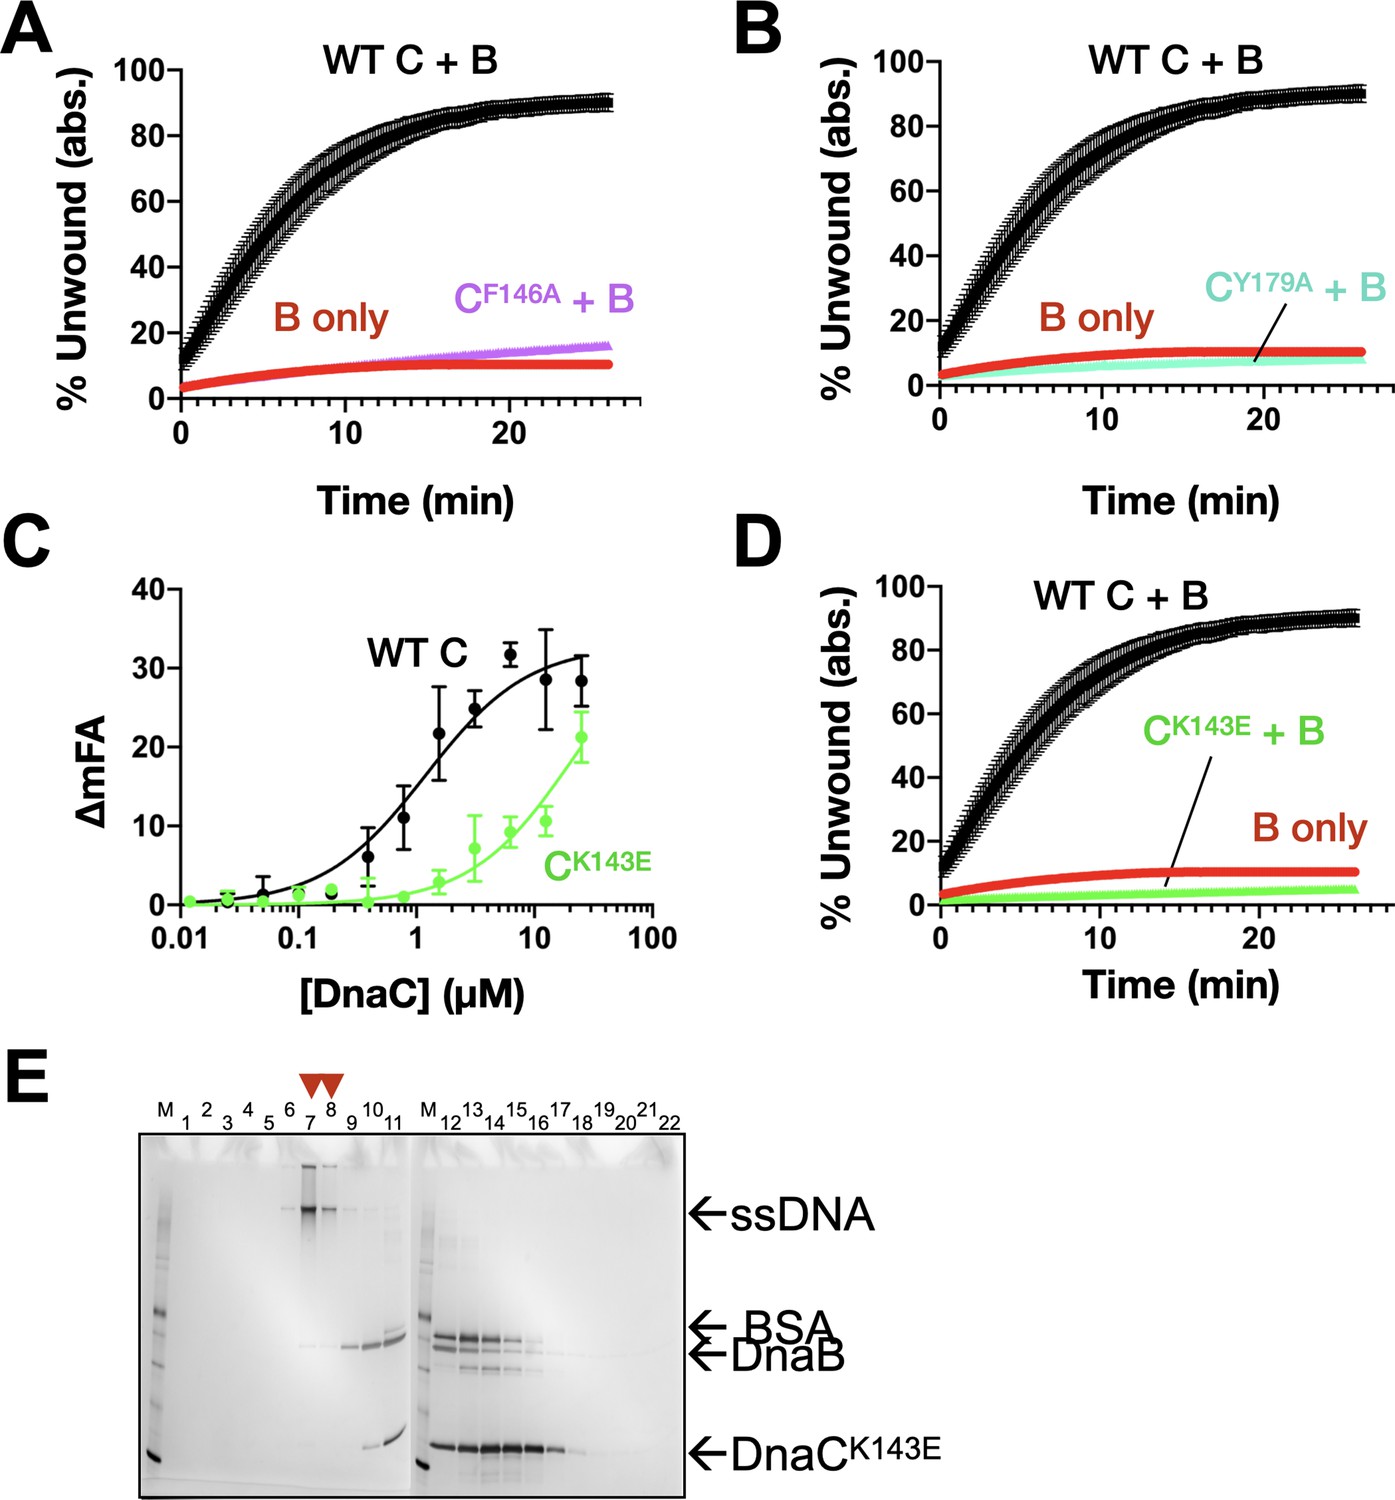
DnaC residues seen to engage ssDNA structurally are important for ssDNA binding, helicase loading, and stimulating DNA unwinding by DnaB.
(A) Unwinding activity for DnaCF146. (B) Unwinding activity for DnaCY179A. (C) Defect in DnaCK143E DNA-binding function as measured by its ability to bind a fluorescein-labeled dT25 oligonucleotide. (D) Unwinding activity for DnaCK143E. (E) Silver-stained SDS-PAGE analysis of sizing-column fractions from a representative DnaB loading reaction with DnaCK143E.
-
Figure 5—figure supplement 1—source data 1
Raw unwinding data for DnaC tetrad mutants and DNA binding and helicase loading data for DnaC K143E.
- https://cdn.elifesciences.org/articles/64232/elife-64232-fig5-figsupp1-data1-v2.zip
Figure 6 with 1 supplement
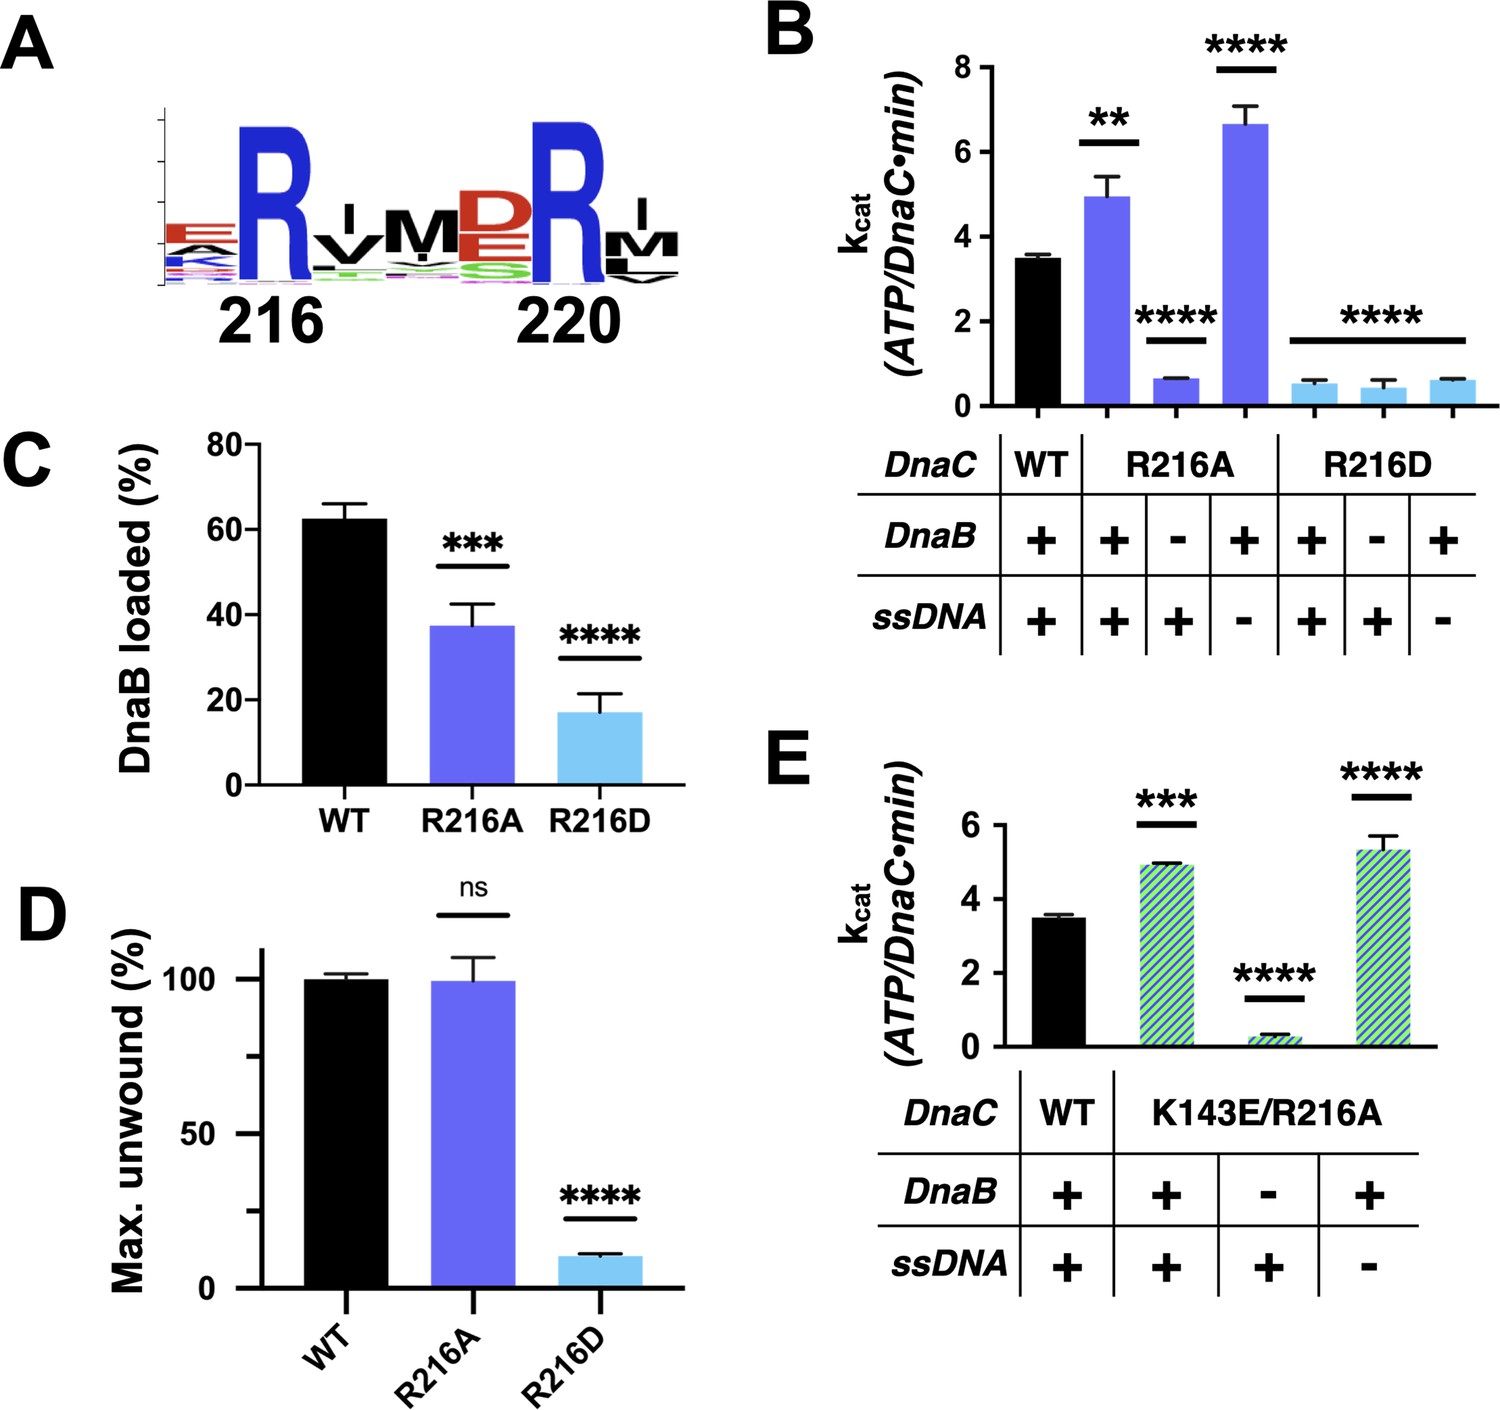
Functional effect of a second conserved arginine adjacent to the Arg-finger on DnaC.
(A) WebLogo (Schneider and Stephens, 1990) showing the conservation of Arg216, which sits four amino acids away from the DnaC Arg-finger (Arg220). (B–D) Bar graphs showing the effect of R216A and R216E mutants on (B) ssDNA- and DnaB-dependent stimulation of DnaC ATPase activity, (C) DnaB loading by DnaC, and (D) DnaC stimulation of DNA fork unwinding by DnaB. (E) Bar graph showing that the R216A mutation can override the loss of DnaC ATPase activity imparted by the disruption of Lys143 when DnaB is present.
-
Figure 6—source data 1
Raw data on unwinding, loading, and DNA and DnaB stimulated ATP hydrolysis by the arginine coupler in DnaC.
- https://cdn.elifesciences.org/articles/64232/elife-64232-fig6-data1-v2.zip
Figure 6—figure supplement 1
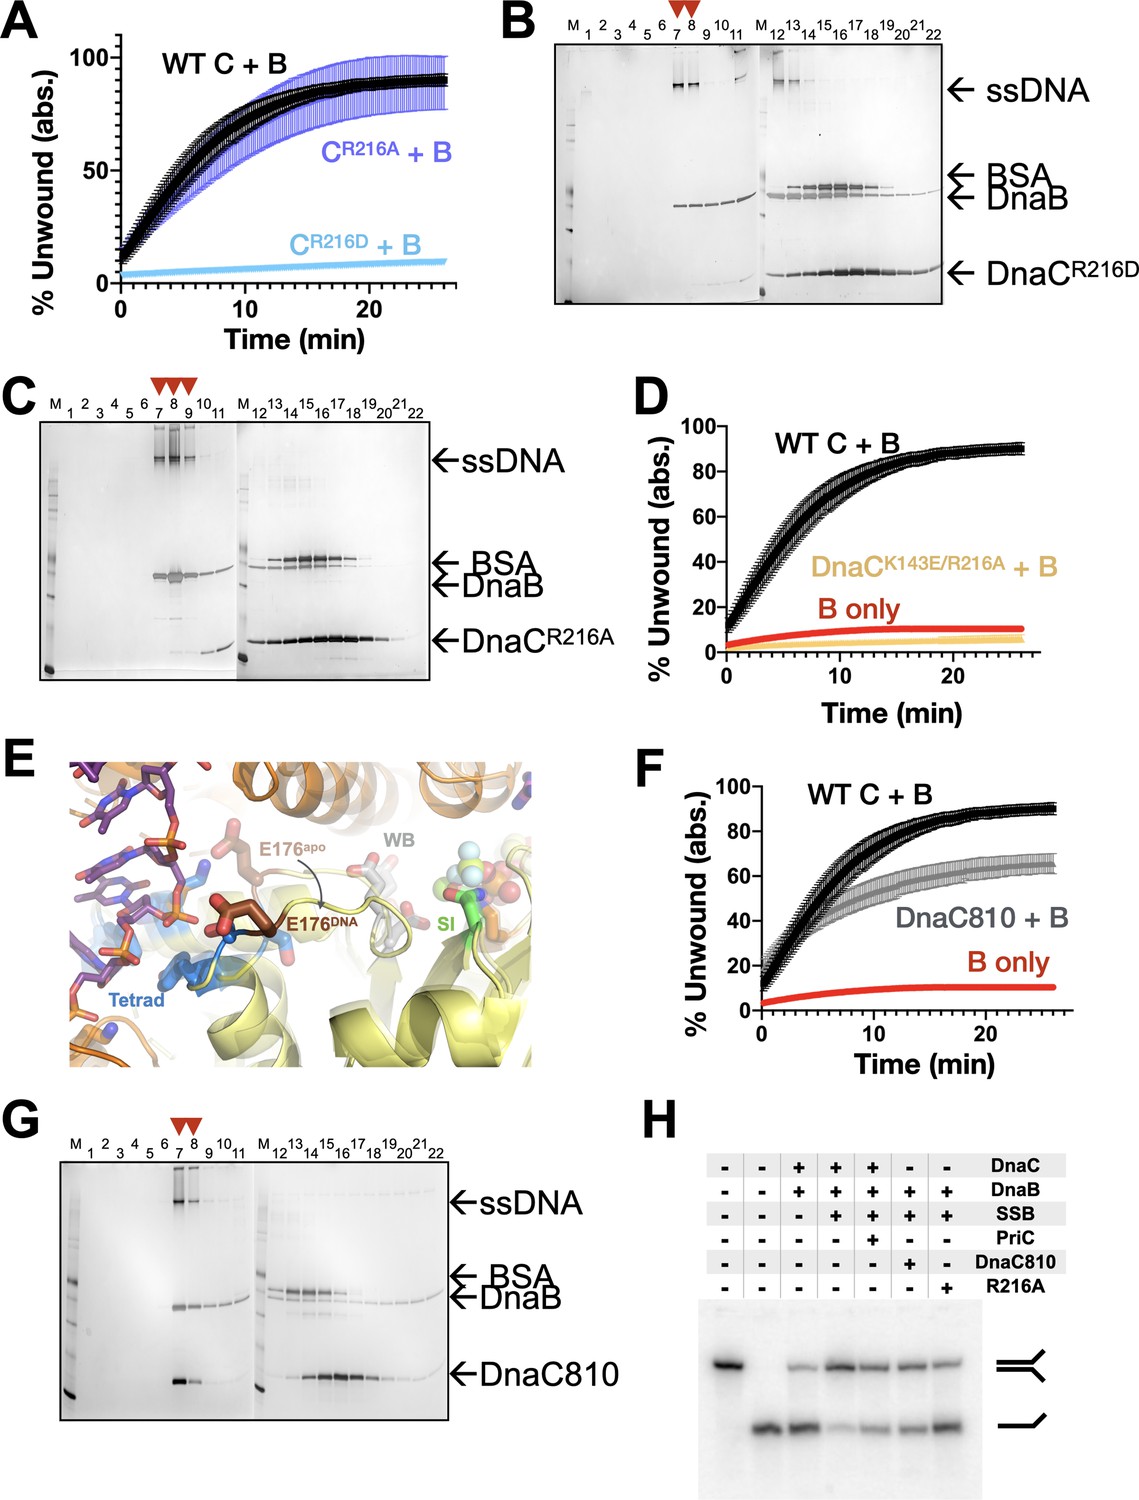
Effect of coupler amino acids on DnaC function.
(A) Representative unwinding assay comparing the stimulatory activity of two different Arg-coupler mutants (R216A and R216D) to wild-type DnaC. (B,C) Representative loading SDS-PAGE assays showing the ability of two different Arg-coupler mutants (R216A and R216D) to deposit DnaB on M13 ssDNA. (D) Representative unwinding assay comparing the stimulatory activity of a double Arg-coupler/ssDNA-binding mutant (R216A/K143E) to wild-type DnaC. (E) The loop that connects the Walker-B motif to the tetrad and that contains the amino acid mutated in the dnaC810 allele (Glu176) undergoes a conformational change between apo and DNA-bound states. The Walker-B (WB), Sensor I (SI), and tetrad elements are labeled. (F) Representative unwinding assay comparing the stimulatory activity of the DnaC810 mutant (E176G) to wild-type DnaC. (G) Representative silver-stained SDS-PAGE analysis of sizing-column fractions from DnaB loading reactions containing DnaC810. (H) Representative gel-based unwinding assay showing that the DnaC810 and Arg-coupler mutants effectively promote the unwinding of an SSB-coated DNA fork substrate in the absence of PriC.
-
Figure 6—figure supplement 1—source data 1
Raw data on effects of coupler residues on DnaC function.
- https://cdn.elifesciences.org/articles/64232/elife-64232-fig6-figsupp1-data1-v2.zip
Figure 7
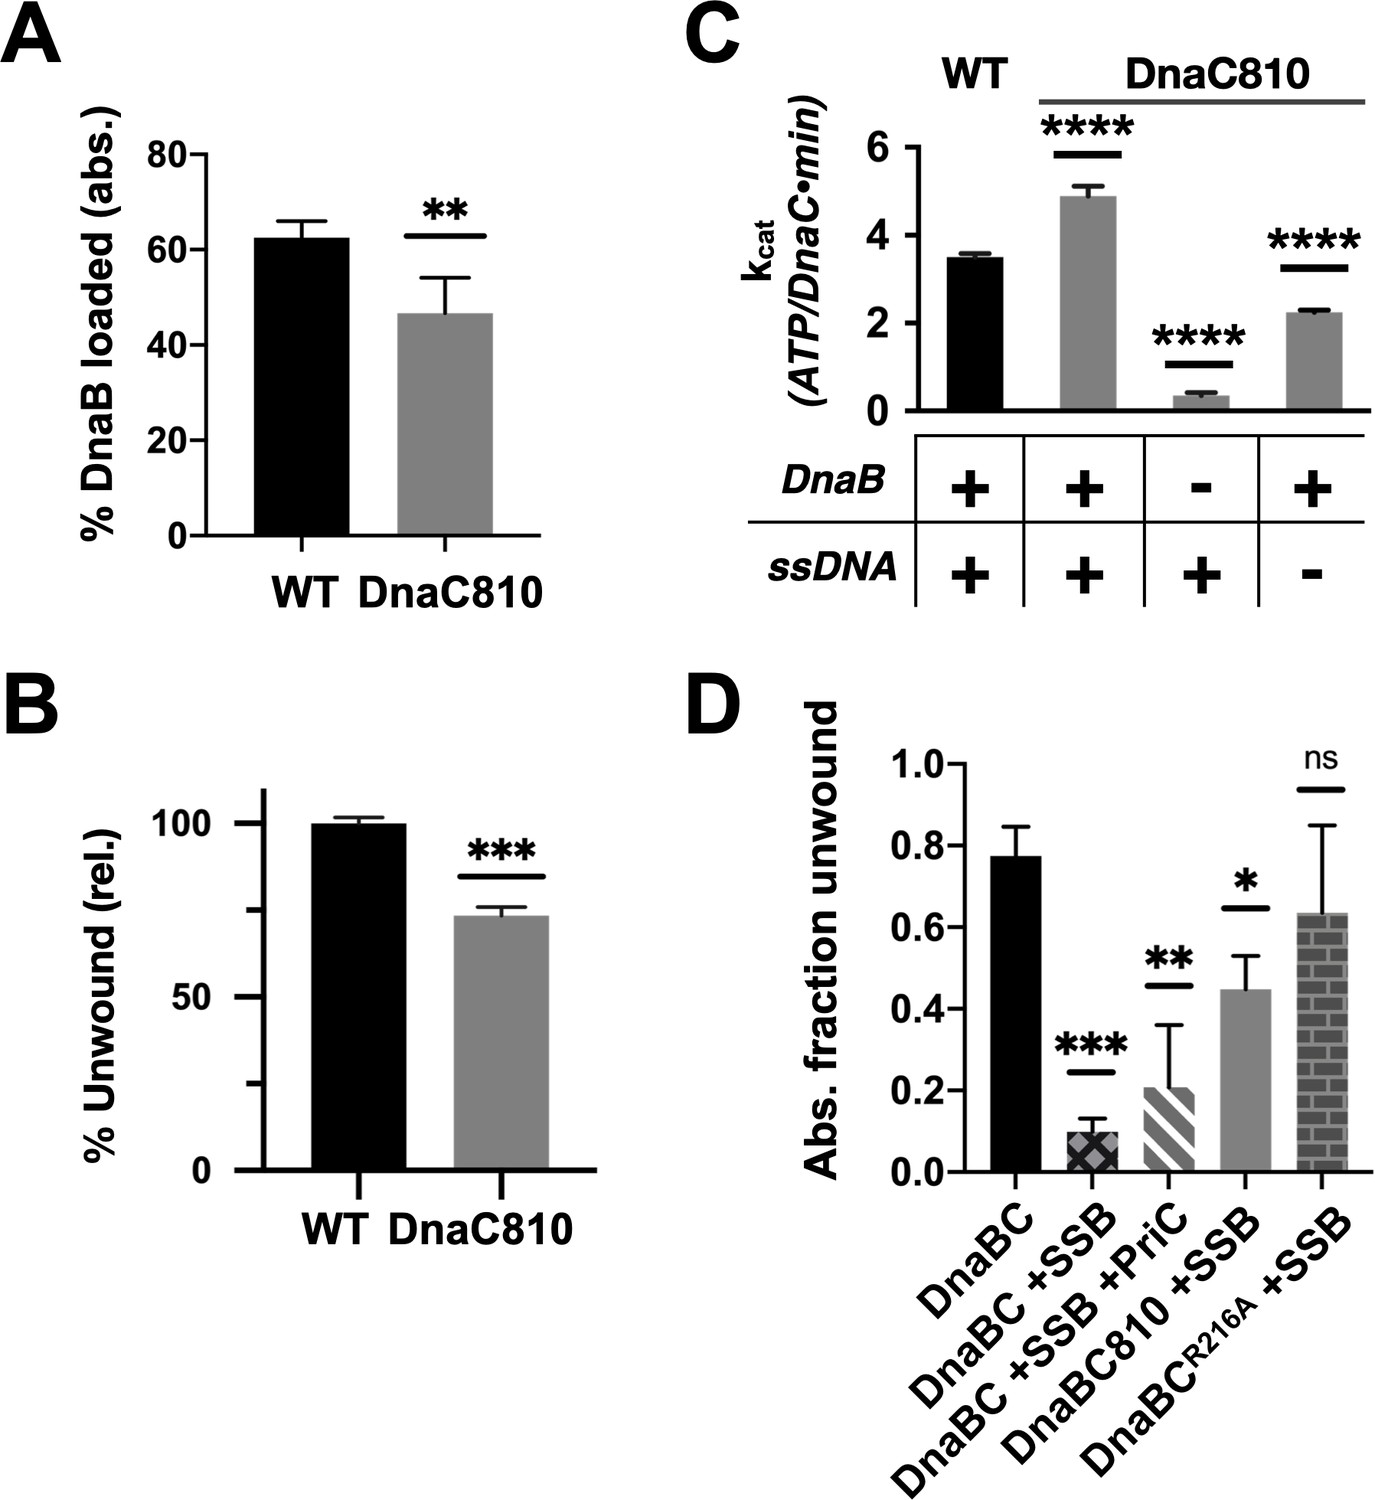
Loss of ssDNA dependency on DnaC ATPase activity correlates with an ability to bypass a need for the replication restart factor, PriC, in unwinding SSB-coated DNA.
(A–C) The DnaC810 replication restart bypass mutation phenocopies a loss of the Arg-coupler. Bar graphs showing the effect of the DnaC810 E176G mutation on (A) percent of DnaB loading (absolute values), (B) percent of DnaB-dependent DNA fork unwinding (relative to wild-type DnaC), and (C) ssDNA- and DnaB-stimulated ATPase activity of the loader. (D) The Arg-coupler mutant of DnaC promotes the DnaB-mediated unwinding of an SSB-coated fork in a PriC-independent manner. Error bars reflect the standard deviation from three different experiments.
-
Figure 7—source data 1
Raw data on effect of DnaC 810 mutant on DnaC function.
- https://cdn.elifesciences.org/articles/64232/elife-64232-fig7-data1-v2.zip
Figure 8 with 1 supplement
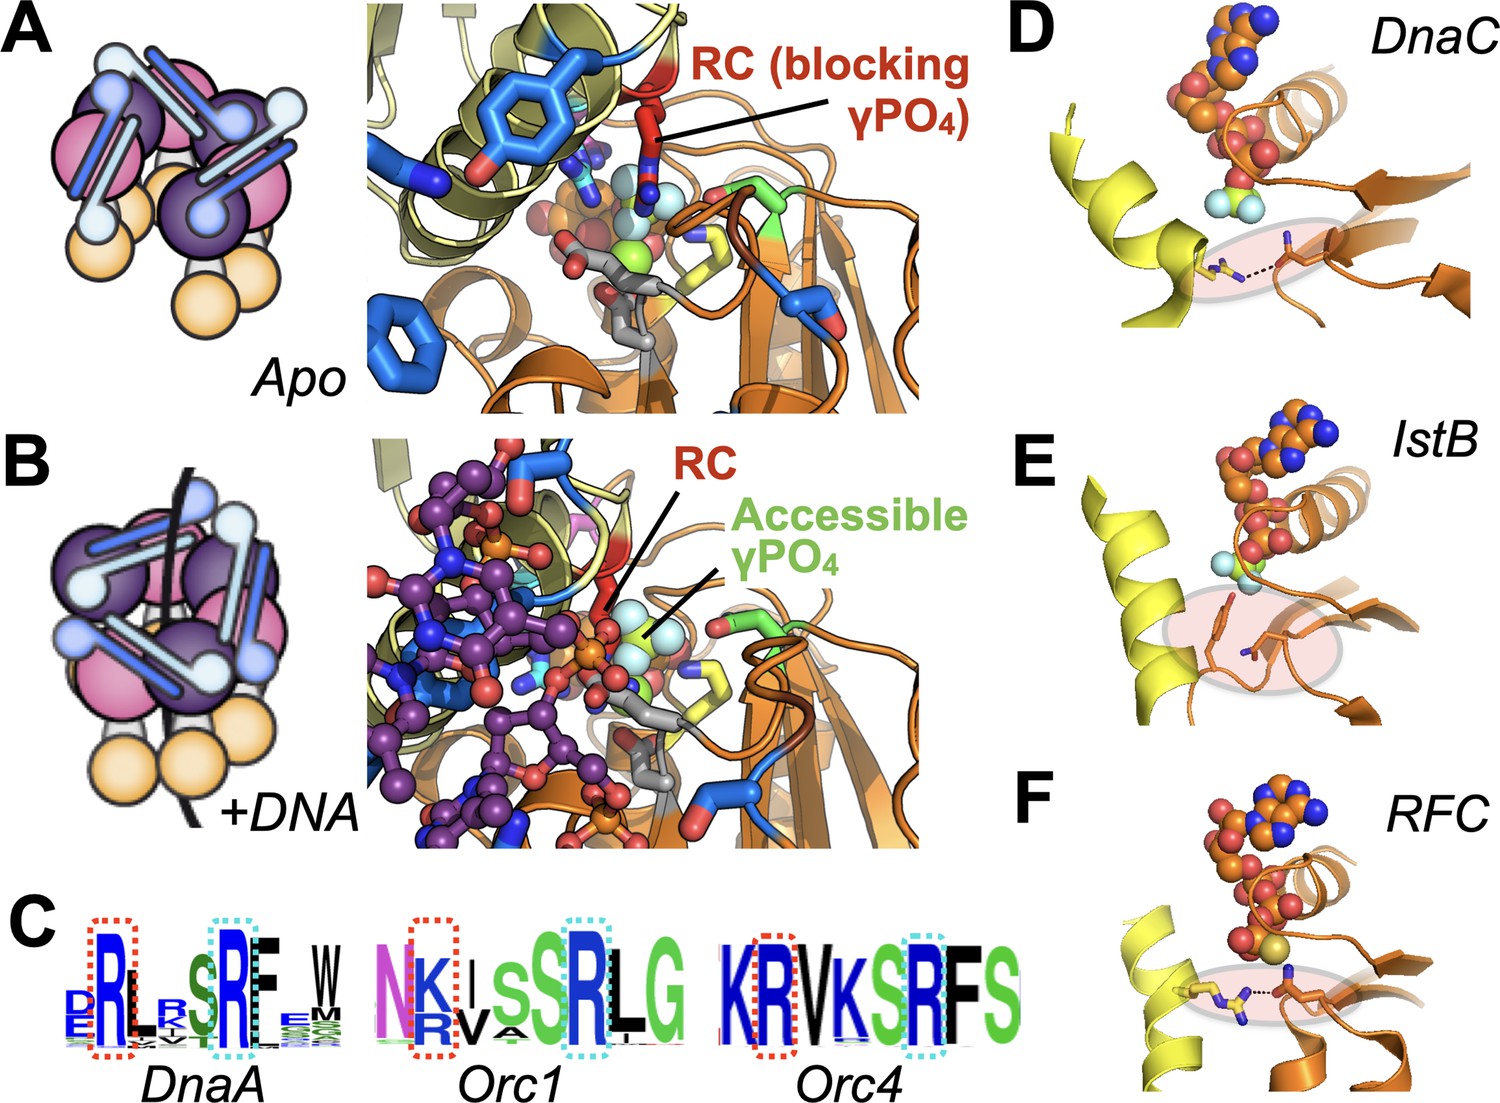
Molecular mechanism of the DnaC Arg-coupler and the presence of potential functional analogs in related switch-type AAA+ ATPases.
(A,B) Schematics and structures showing how the conformational status of the Arg-coupler switches between apo and DNA-bound states to respectively occlude or allow access to the γ-PO4 moiety of nucleotide in the DnaC ATPase site. (C) WebLogo (Schneider and Stephens, 1990) showing an analog of Arg216 (red dotted box) is present next to the Arg-finger (cyan dotted box) of DnaA, Orc1, and Orc4, which sits four amino acids away from the DnaC Arg-finger. (D–F) The Sensor I residue of IstB and Replication Factor C (RFC, chain C in orange and chain D in yellow) is engaged by a conserved side chain in unstimulated ATPase states. DnaC PDB 6QEL; IstB PDB 5BQ5; RFC PDB 1SXJ.
Figure 8—figure supplement 1
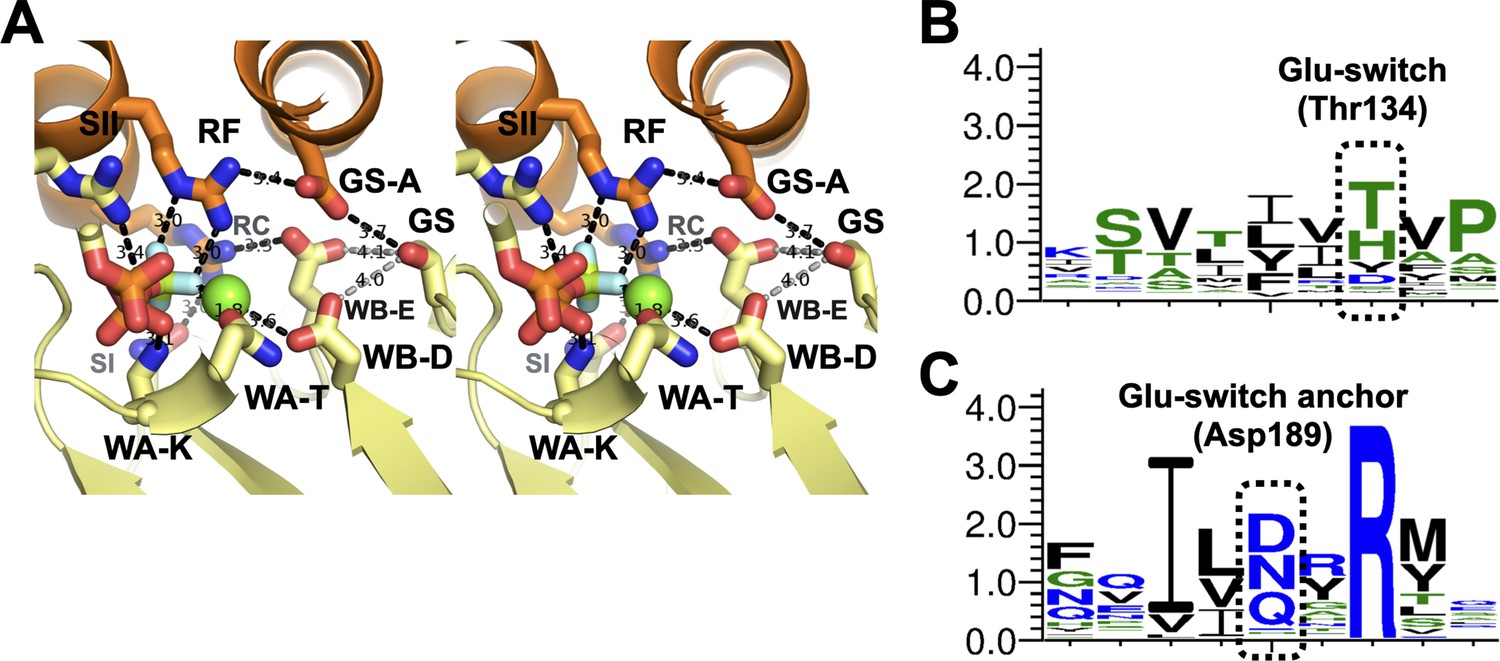
The glutamate-switch region of DnaC.
(A) Wall-eyed stereo view of the DnaC active site as imaged bound to DnaB and nucleotide (DNA-free). Hydrogen bonding (2.7–3.9 Å) or side-chain/metal-ion interactions are shown as black dotted lines. The hydroxyl group on the glutamate switch (‘GS’) amino acid is >4.0 Å (gray dotted lines) from either the catalytic glutamate (‘WB-E’) or Walker-B aspartate (‘WB-A’), but appears anchored to a nearby aspartate (‘GS-A’) that contacts the Arg-finger (‘RF’). Other labels: Walker-A lysine – ‘WA-K’; Walker-A threonine – ‘WA-T’; Sensor I – ‘SI’; Sensor II – ‘SII’; Arg-coupler – ‘RC’. (B) WebLogo of glutamate-switch region. (C) WebLogo of glutamate-switch anchor region. The highly conserved arginine corresponds to a rare, internally buried amino acid that is essentially invariant across DnaC/DnaI family members.
Author response image 1
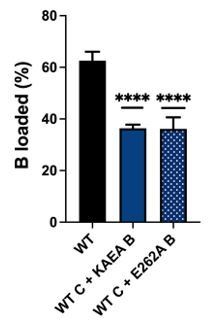
ssDNA loading assay with wildtype (WT) DnaC comparing WT DnaB vs. a single Walker B mutant (E262A) and a double Walker A/B mutant (KAEA) of the helicase.
Tables
Key resources table
| Reagent type (species) or resource | Designation | Source or reference | Identifiers | Additional information |
|---|---|---|---|---|
| Recombinant DNA reagent | pET28b | Novagen | ||
| Strain, strain background (Escherichia coli) | C41(DE3) | Lucigen | Chemically competent cells | |
| Strain, strain background (Escherichia coli) | BL21AI | Invitrogen | Chemically competent cells | |
| Peptide, recombinant protein | TEV | QB3 Macrolab (UC Berkeley) | ||
| Commercial assay or kit | Amylose Resin | NEB | ||
| Commercial assay or kit | Pyruvate kinase/lactate dehydrogenase mix | Sigma-Aldrich | ||
| Commercial assay or kit | Bio-Gel A-1.5m Resin | Bio-Rad |
Additional files
Download links
A two-part list of links to download the article, or parts of the article, in various formats.
Downloads (link to download the article as PDF)
Open citations (links to open the citations from this article in various online reference manager services)
Cite this article (links to download the citations from this article in formats compatible with various reference manager tools)
The molecular coupling between substrate recognition and ATP turnover in a AAA+ hexameric helicase loader
eLife 10:e64232.
https://doi.org/10.7554/eLife.64232


