Neuronal junctophilins recruit specific CaV and RyR isoforms to ER-PM junctions and functionally alter CaV2.1 and CaV2.2
- Department of Physiology and Biophysics, Anschutz Medical Campus, University of Colorado, United States
Figures
Figure 1
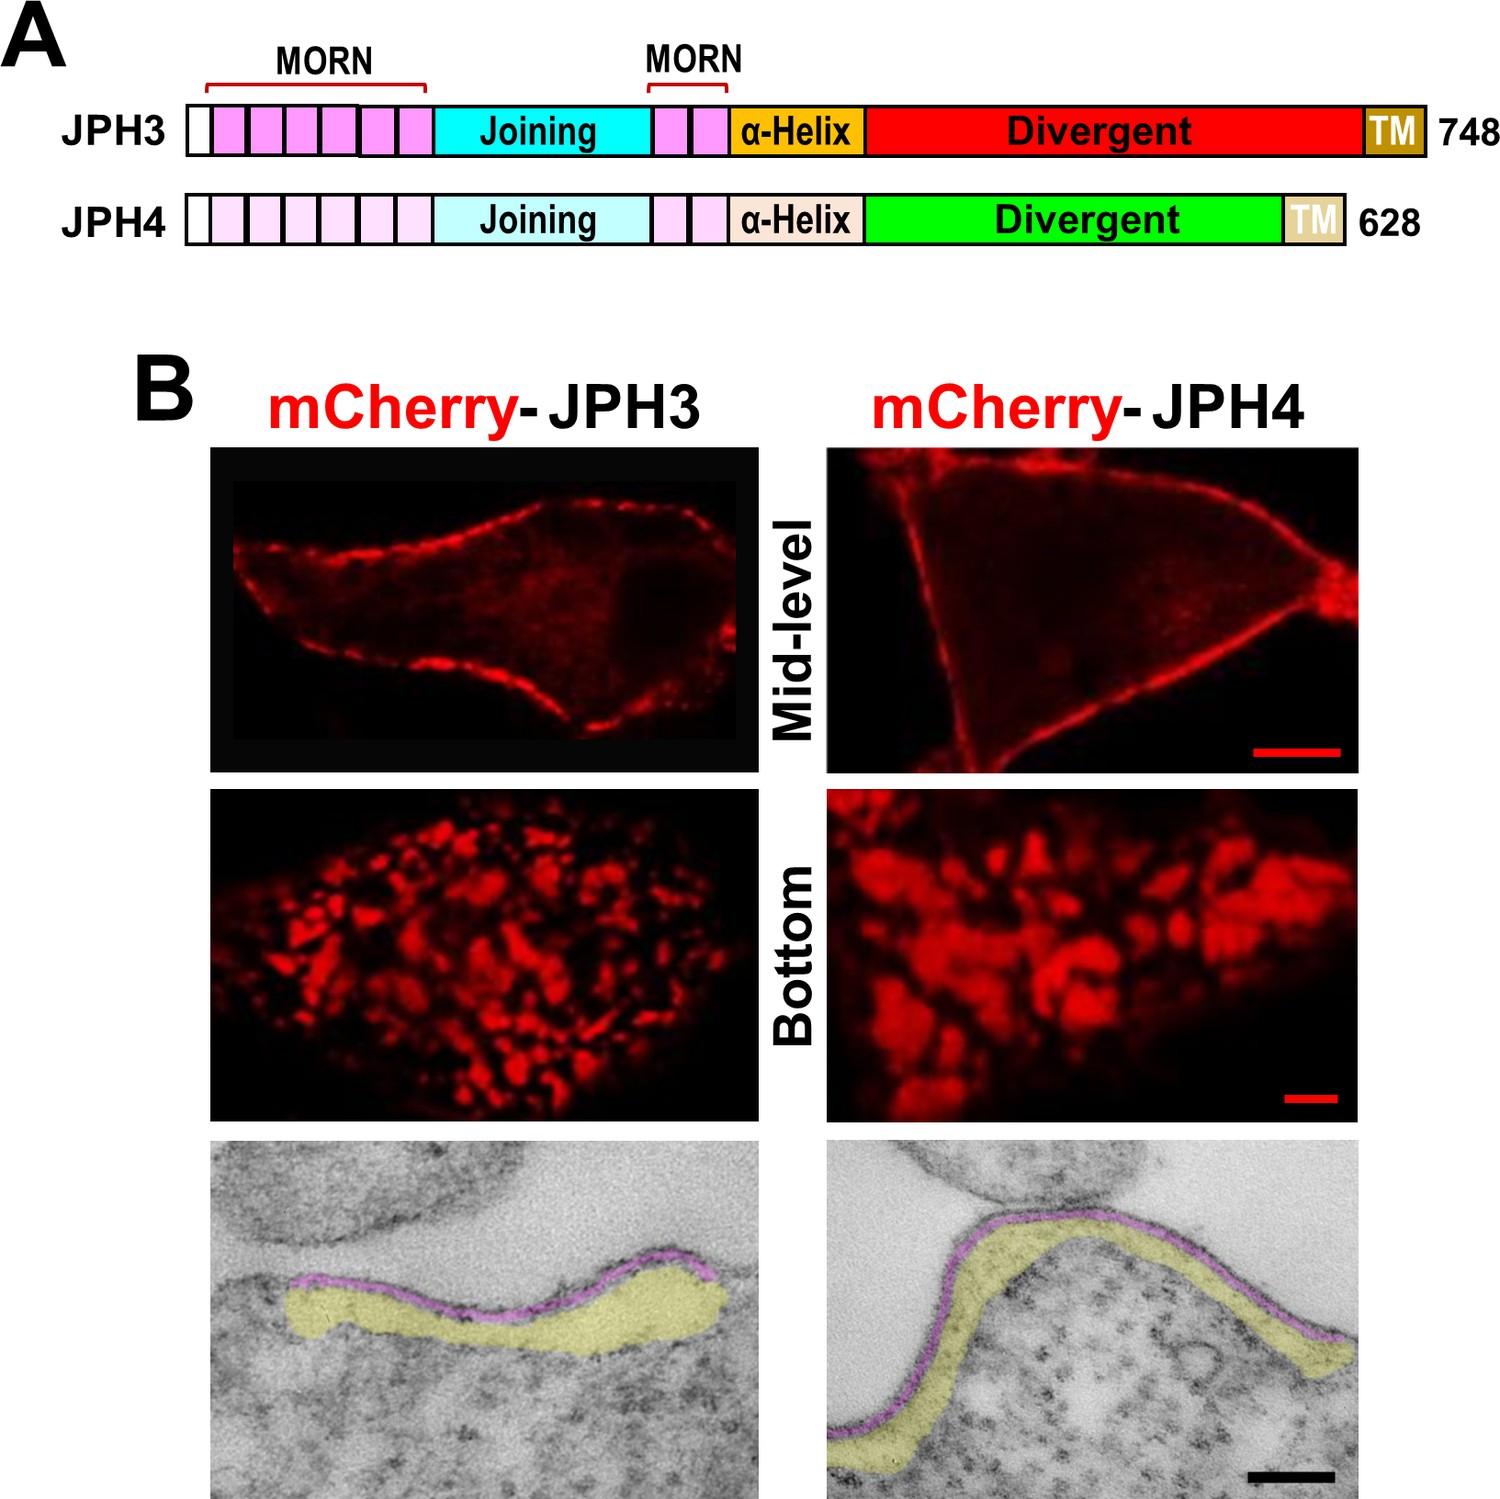
Junctions between the endoplasmic reticulum and plasma membrane (ER-PM junctions) are induced in tsA201 cells by expression of JPH3 or JPH4 N-terminally tagged with fluorescent proteins.
(A) Schematic representation of JPH3 and JPH4, indicating the ‘MORN’ motifs that bind to the plasma membrane and C-terminal segment (‘TM’) that traverses the ER membrane. Except for the ‘Divergent’ domain, the two proteins display substantial sequence similarity (Garbino et al., 2009). (B) Confocal optical sections acquired at mid-level (top row) or the bottom surface (middle row), and thin section electron micrographs (bottom row), are shown for cells transfected with mCherry-JPH3 or mCherry-JPH4 (left and right columns, respectively). The fluorescence was predominantly present in discrete foci near the cell periphery as expected for ER-PM junctions, which can be directly visualized in the electron micrographs in which the junctional gap and the ER sub-cortical cisternae are pseudo-colored in purple and yellow, respectively. Scale bars = 5 μm (top row), 2 μm (middle row), and 100 nm (bottom row).
Figure 2
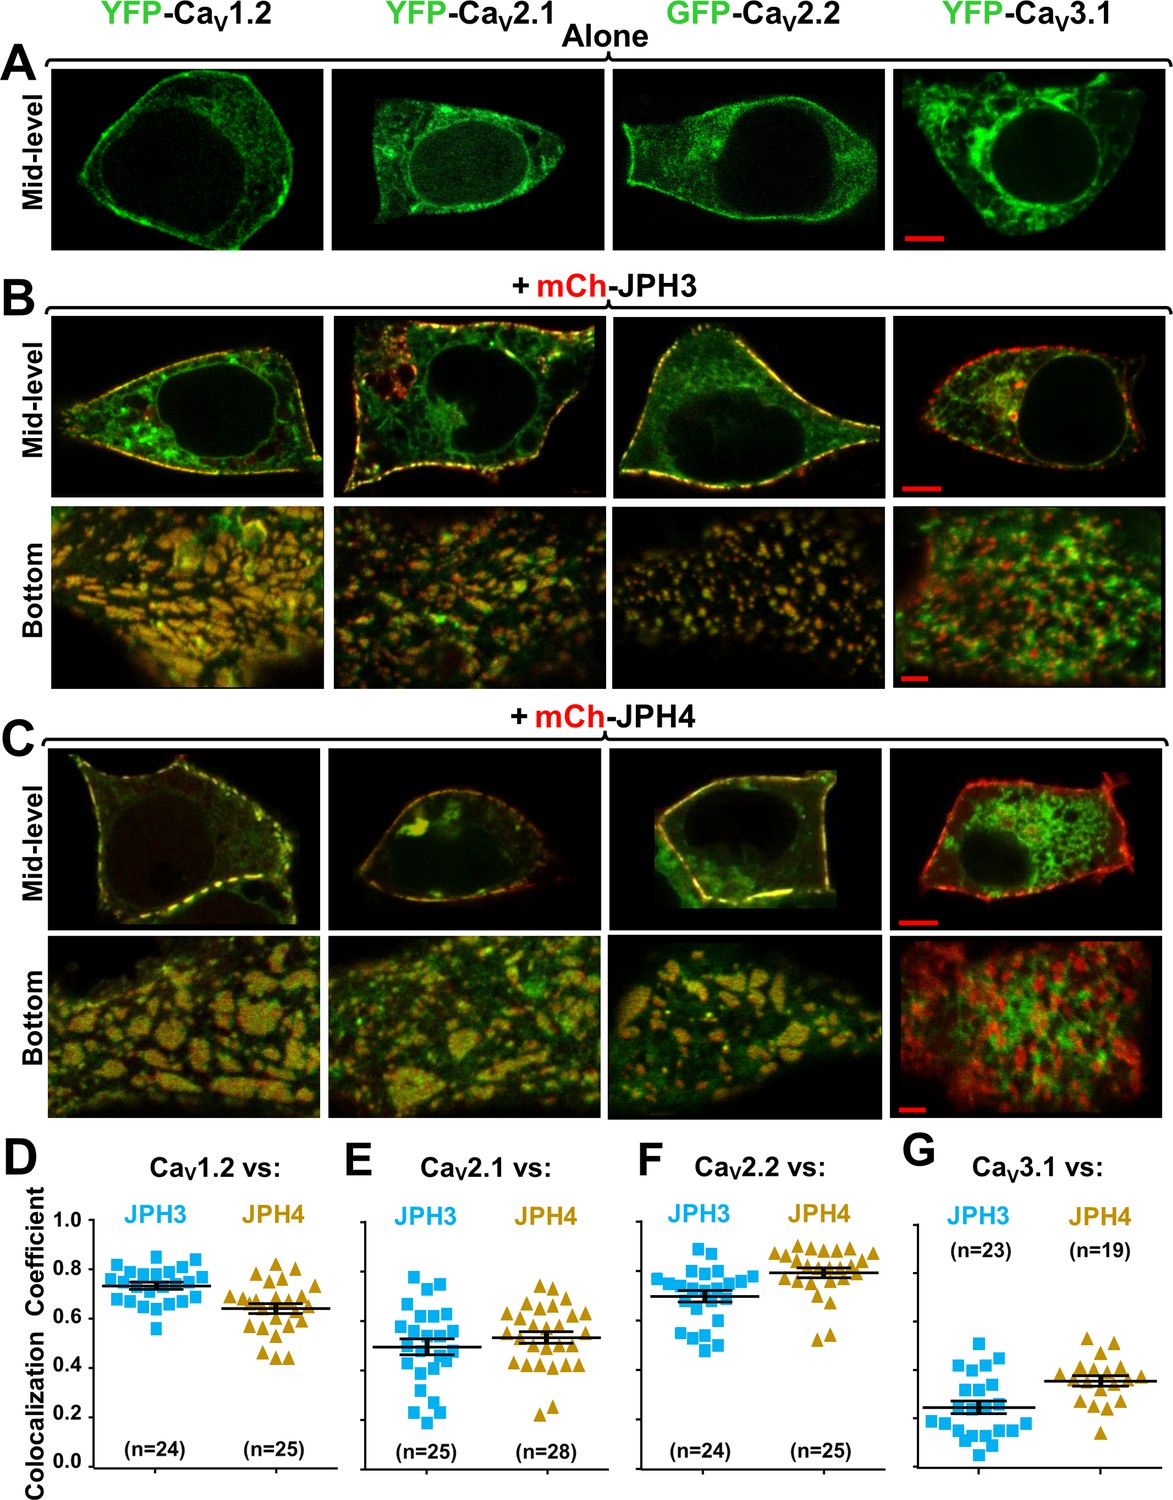
Three neuronal, high-voltage-activated calcium channels (CaV1.2, CaV2.1, and CaV2.2), but not a low-voltage-activated one (CaV3.1), localize at junctions induced between the endoplasmic reticulum and plasma membrane by JPH3 or JPH4.
Mid-level or bottom-surface optical sections are shown for tsA201 cells transfected with the designated CaV constructs (represented in green) either in the absence of junctophilins (A) or together with either mCherry-JPH3 (B) or mCherry-JPH4 (C), in which the junctophilins are represented in red in merged red/green images. cDNAs for the auxiliary subunits β1b and α2-δ1 were also present for the high-voltage-activated channels. For the three high-voltage-activated channels, co-expression with JPH3 or JPH4 resulted in clusters of channels that were near the surface and colocalized with the junctophilins. Conversely, CaV3.1 localization was unaffected by the presence of the two JPHs. Scale bars = 5 and 2 μm, respectively, for the mid-level and bottom-surface images. (D–G) Pearson's colocalization coefficients for the specified combinations of neuronal calcium channels and junctophilins, which were calculated from optical sections of the bottom of the cell that was adjacent to the substrate (see B and C for examples). In this plot (and subsequent plots), individual data points indicate Pearson's coefficient for a single cell, with the mean and ± SEM for each construct combination indicated by longer and shorter horizontal lines, respectively. Numbers of cells are indicated in parentheses. Pearson’s coefficients and their statistical comparison are provided in Figure 2—source data 1.
-
Figure 2—source data 1
Numerical data and statistical analyses to support graphs in Figure 2.
- https://cdn.elifesciences.org/articles/64249/elife-64249-fig2-data1-v2.docx
Figure 3 with 1 supplement
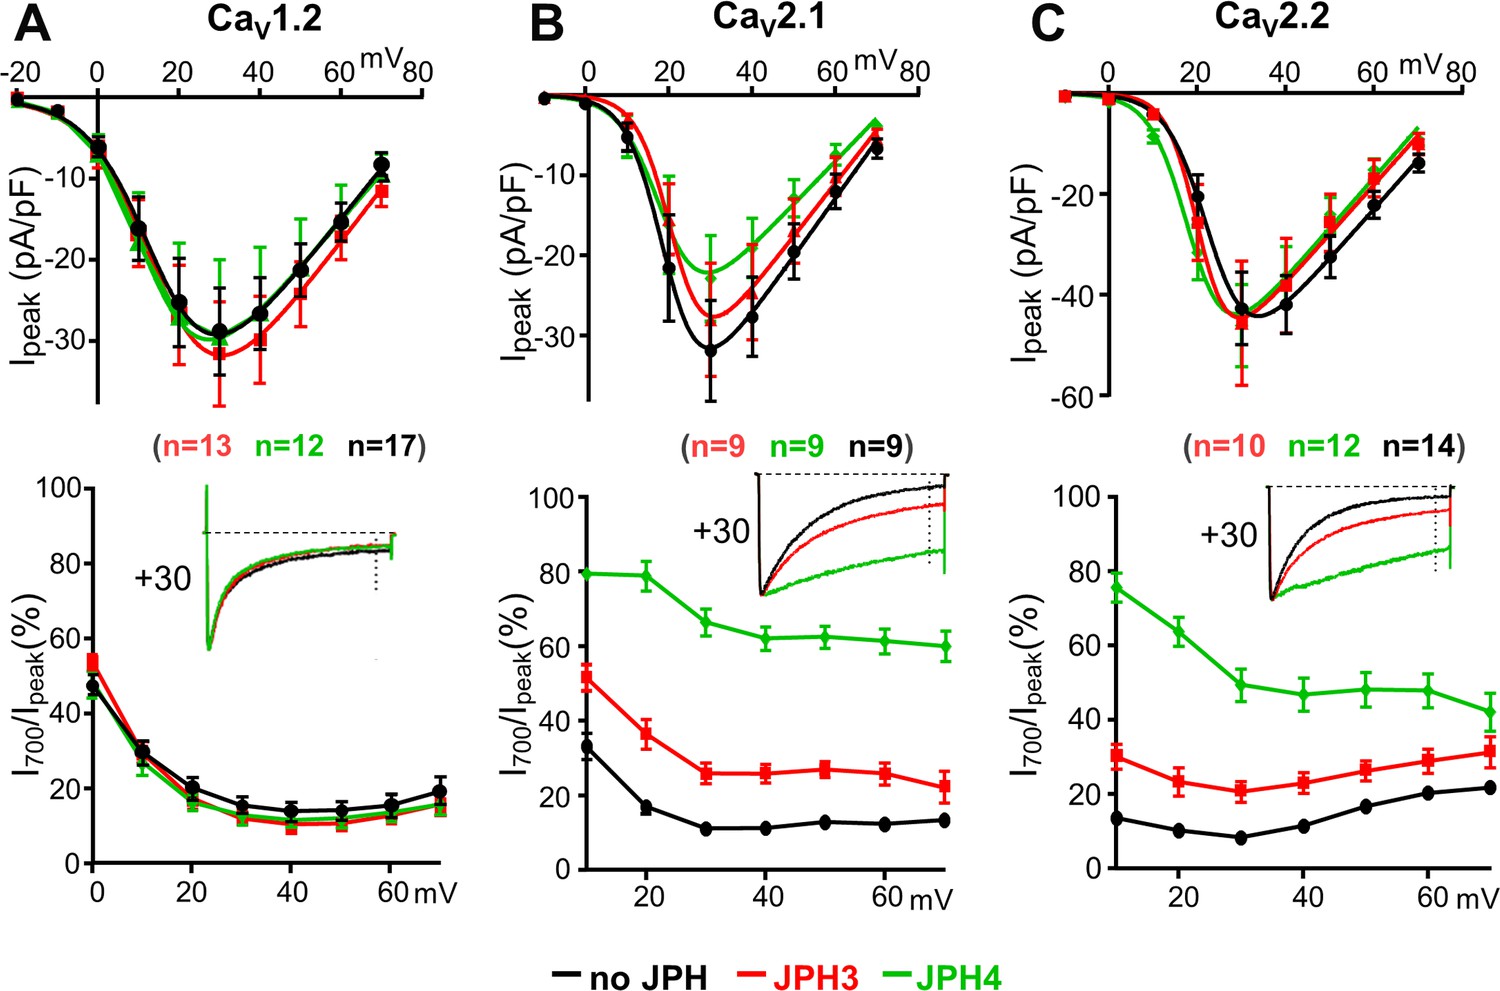
JPH3 and JPH4 slow the inactivation of Ca2+ currents via CaV2.1 and CaV2.2 but not those via CaV1.2.
Ca2+ currents were measured in tsA201 cells transfected with CaV1.2 (A), CaV2.1 (B), or CaV2.2 (C) either without junctophilins (black) or together with either JPH3 (red) or JPH4 (green). Constructs for β1b and α2-δ1 were also present. The upper row of panels illustrates the average peak current versus voltage relationships and the lower row of panels plots the percentage of peak current remaining 700 ms after the peak (I700/Ipeak) as a function of test potential. The insets illustrate representative currents (scaled to match in height) elicited by an 800 ms depolarization to the indicated potential, with the current 700 ms after the peak indicated by the vertical dotted line. Data are shown as mean ± SEM. Tables of Ipeak and I700 are provided in Figure 3—source data 1.
-
Figure 3—source data 1
Numerical data to support graphs in Figure 3.
- https://cdn.elifesciences.org/articles/64249/elife-64249-fig3-data1-v2.docx
Figure 3—figure supplement 1
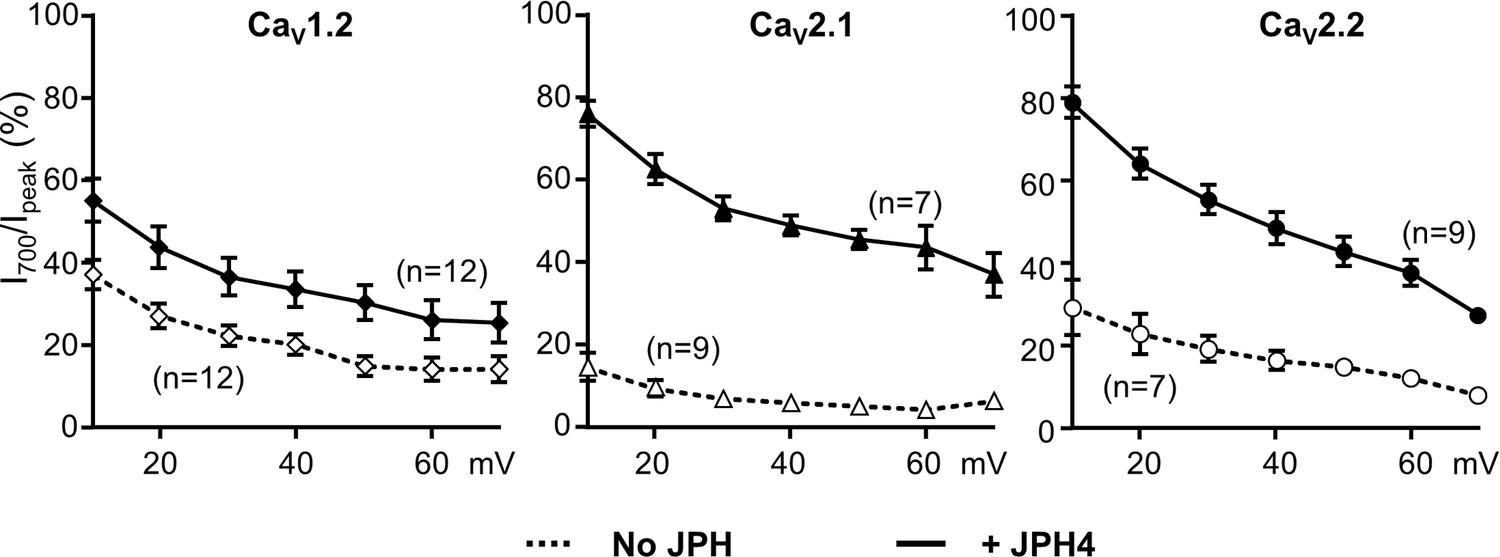
Similar to its effects on Ca2+ currents, JPH4 slows inactivation of Ba2+ currents via CaV2.1 and CaV2.2, with less effect on inactivation of Ba2+ currents via CaV1.2.
Ba2+ currents were measured in tsA201 cells transfected with CaV1.2 (A), CaV2.1 (B), or CaV2.2 (C) either without junctophilins (open symbols) or together with JPH4 (closed symbols). Constructs for β1b and α2-δ1 were also present. The percentage of peak current remaining 700 ms after the peak (I700/Ipeak) is plotted as a function of test potential. Data are shown as mean ± SEM. Tables of Ipeak and I700 are provided in Figure 3—figure supplement 1—source data 1.
-
Figure 3—figure supplement 1—source data 1
Numerical data to support graphs in Figure 3—figure supplement 1.
- https://cdn.elifesciences.org/articles/64249/elife-64249-fig3-figsupp1-data1-v2.docx
Figure 4
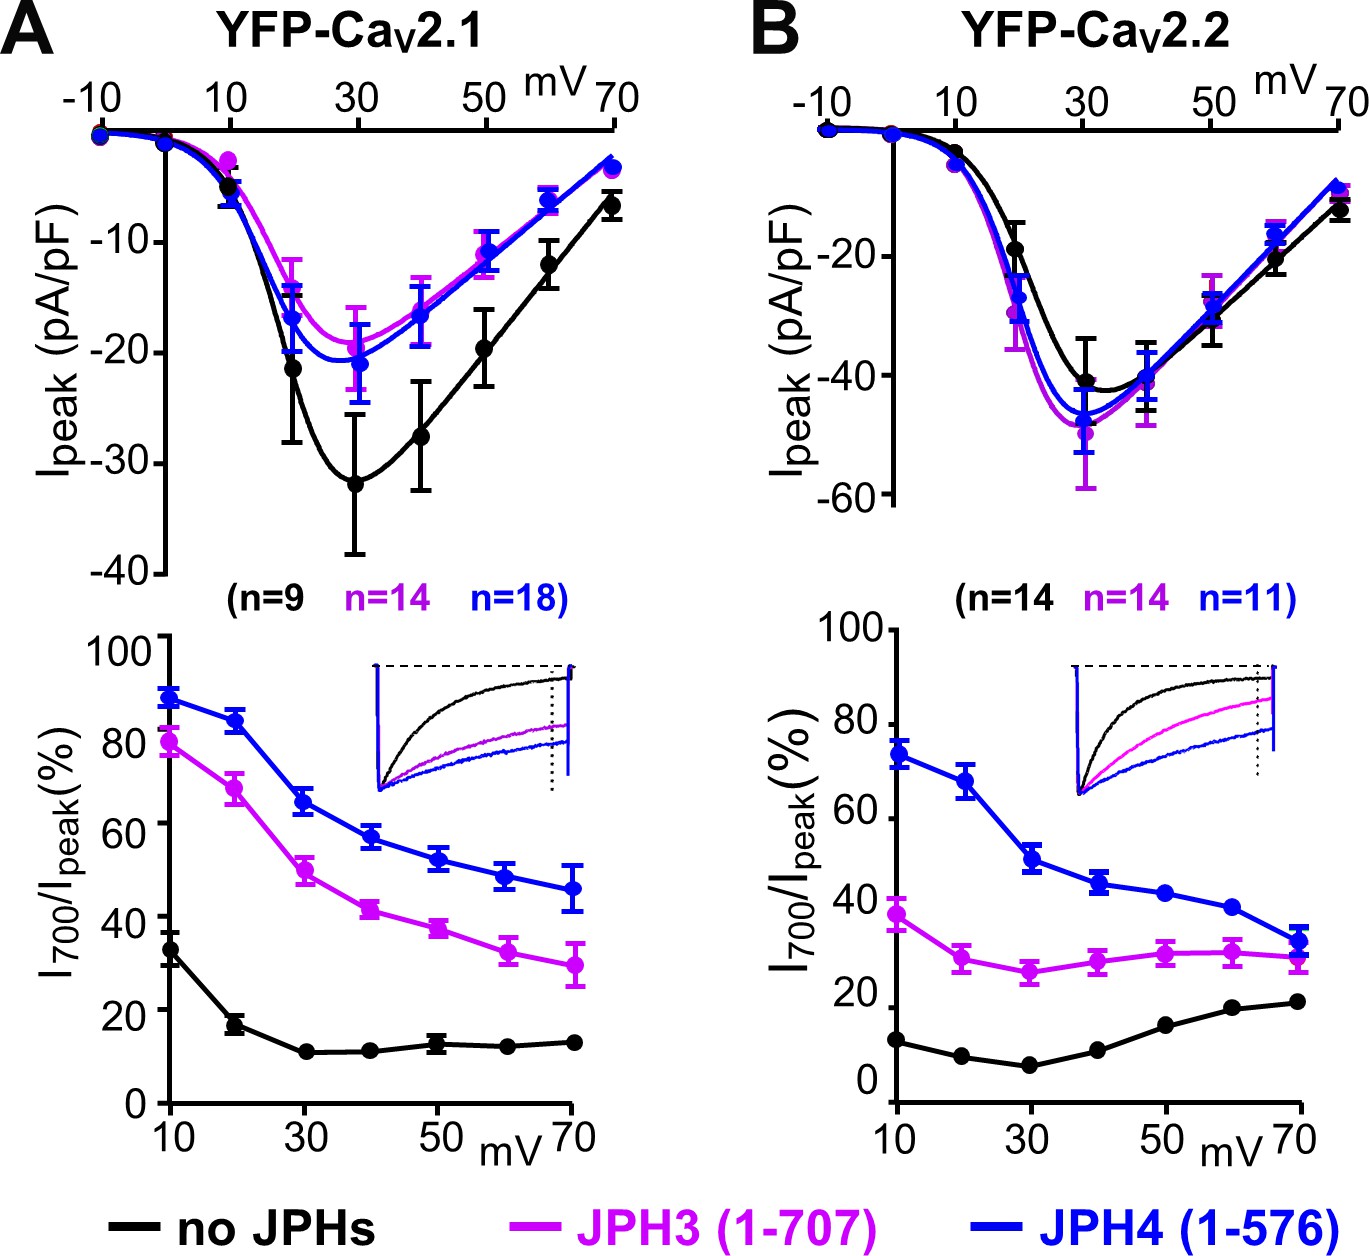
The ability of JPH3 and JPH4 to slow inactivation of CaV2.1 and CaV2.2 does not depend upon the formation of junctions induced between the endoplasmic reticulum and plasma membrane.
Cells were transfected with the calcium channels together with JPH3(1 – 707) or JPH4(1 – 576), which lack the ER-spanning membrane segment and thus associate with the cell surface without inducing ER-PM junctions. (A, B) Peak current and I700/Ipeak as a function of test potential for CaV2.1 and CaV2.2, respectively, expressed without junctophilin, with JPH3(1 – 707) or JPH4(1 – 576), indicated in black, purple, and blue, respectively. cDNAs for the CaV auxiliary subunits β1b and α2-δ1 were also present. The insets illustrate representative Ca2+ currents, which were elicited by 800 ms depolarizations to +30 mV and scaled to match in peak height. On average, the truncated junctophilins slowed inactivation to an extent that was comparable to, or greater than, that caused by the full-length junctophilins (Figure 3). Data are shown as mean ± SEM. Tables of Ipeak and I700 are provided in Figure 4—source data 1.
-
Figure 4—source data 1
Numerical data to support graphs in Figure 4.
- https://cdn.elifesciences.org/articles/64249/elife-64249-fig4-data1-v2.docx
Figure 5 with 1 supplement
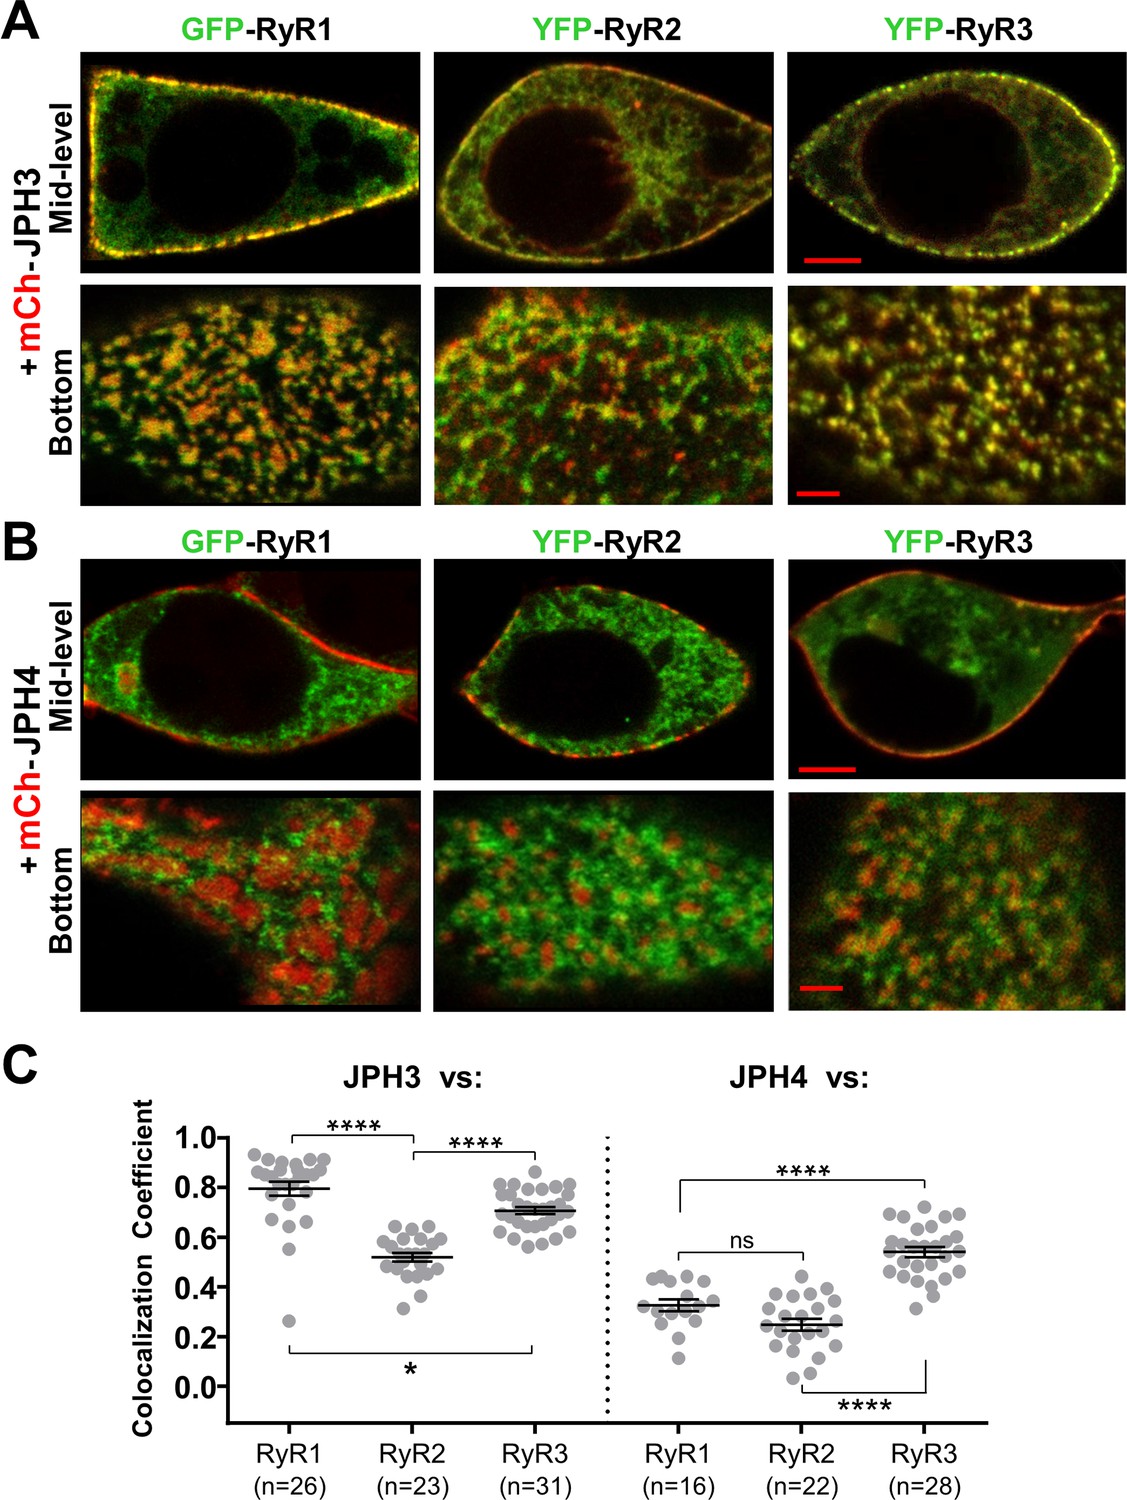
JPH3 recruits all three RyR isoforms to junctions between the endoplasmic reticulum and plasma membranes, whereas JPH4 only recruits RyR3.
Representative, red/green merged images of the mid-level or bottom surface of tsA201 cells expressing GFP-RyR1, YFP-RyR2, or YFP-RyR3 (left to right, represented in green) together with either mCherry-JPH3 (A) or mCherry-JPH4 (B), which are represented in red. Scale bars = 5 and 2 μm, respectively, for the mid-level and bottom-surface images. (C) Pearson's colocalization coefficients for the specified combinations of junctophilins and RyRs, which were calculated from bottom-surface optical sections. Statistical significance: ****p < 0.0001, *p = 0.0248, p = 0.2366 (ns). Pearson’s coefficients and their statistical comparison are provided in Figure 5—source data 1.
-
Figure 5—source data 1
Numerical data and statistical analyses to support graphs in Figure 5.
- https://cdn.elifesciences.org/articles/64249/elife-64249-fig5-data1-v2.docx
Figure 5—figure supplement 1
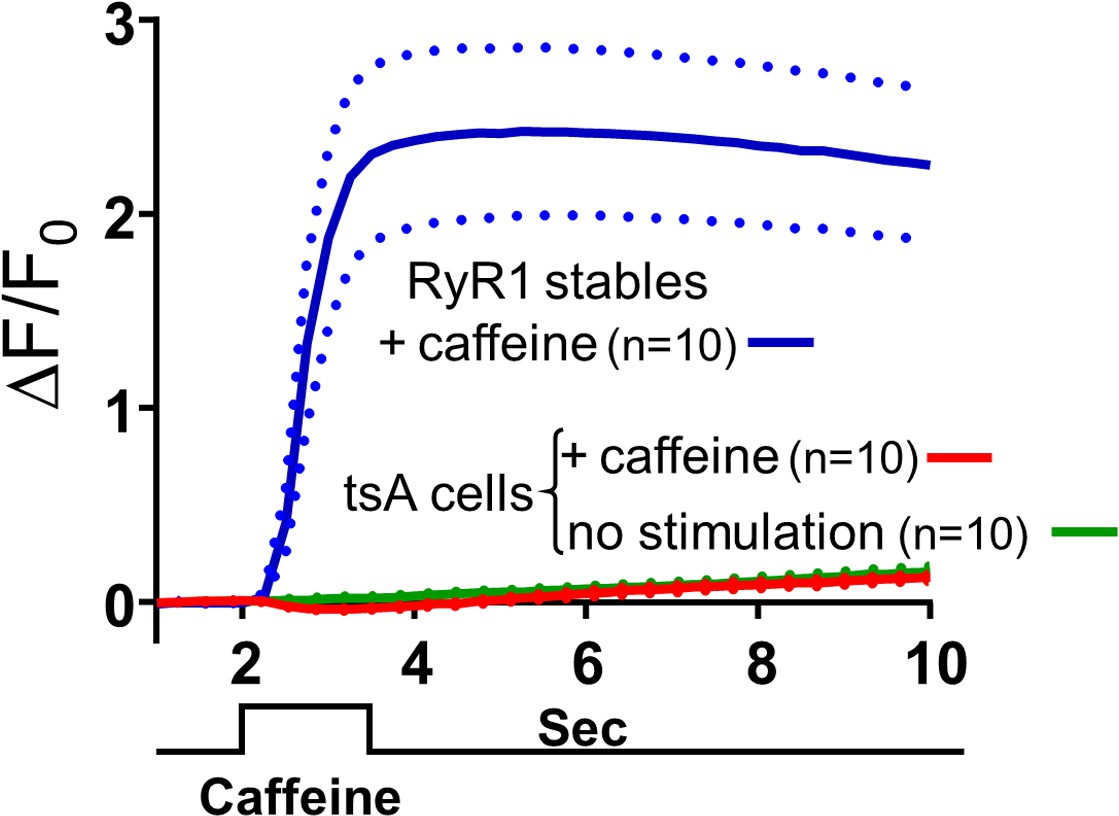
Levels of RyRs endogenously expressed in tsA201 cells are very low.
The change in fluorescence (ΔF/F0) of Fluo8-AM-loaded cells is plotted as a function of time. The blue and red traces represent the responses of RyR1-stable cells and non-transfected tsA201 cells, respectively, with the mean and ± SEM indicated by solid and dashed lines, respectively. Focal application of 1 mM caffeine for 1.5 s causes a large rapid increase of fluorescence in the RyR1-stable cells but very little change in the fluorescence of the naive tsA201 cells. For comparison, the fluorescence as a function of time in naive tsA201 cells that were not exposed to caffeine is also shown (green trace). Raw data for ΔF/F0 are given in Figure 5—figure supplement 1—source data 1.
-
Figure 5—figure supplement 1—source data 1
Numerical data to support graph in Figure 5—figure supplement 1.
- https://cdn.elifesciences.org/articles/64249/elife-64249-fig5-figsupp1-data1-v2.docx
Figure 6
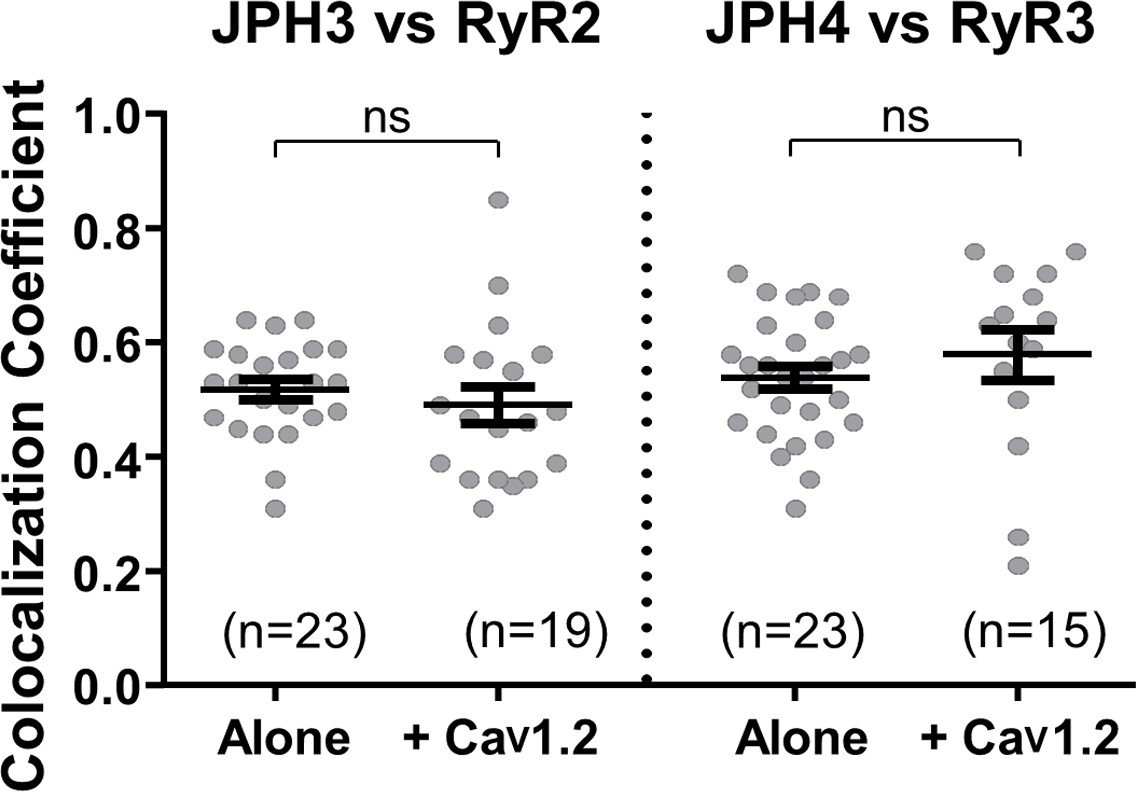
The additional expression of CaV1.2 does not affect colocalization between JPH3 and RyR2 or between JPH4 and RyR3.
Pearson’s coefficients, calculated from bottom-surface scans, for mCherry-JPH3 versus YFP-RyR2 (left), and for mCherry-JPH4 versus YFP-RyR3 (right) expressed either alone or together with CFP-CaV1.2 plus β1b and α2-δ1. Statistical significance: p > 0.4 (ns). Pearson’s coefficients and their statistical comparison are provided in Figure 6—source data 1.
-
Figure 6—source data 1
Numerical data and statistical analyses to support graphs in Figure 6.
- https://cdn.elifesciences.org/articles/64249/elife-64249-fig6-data1-v2.docx
Figure 7
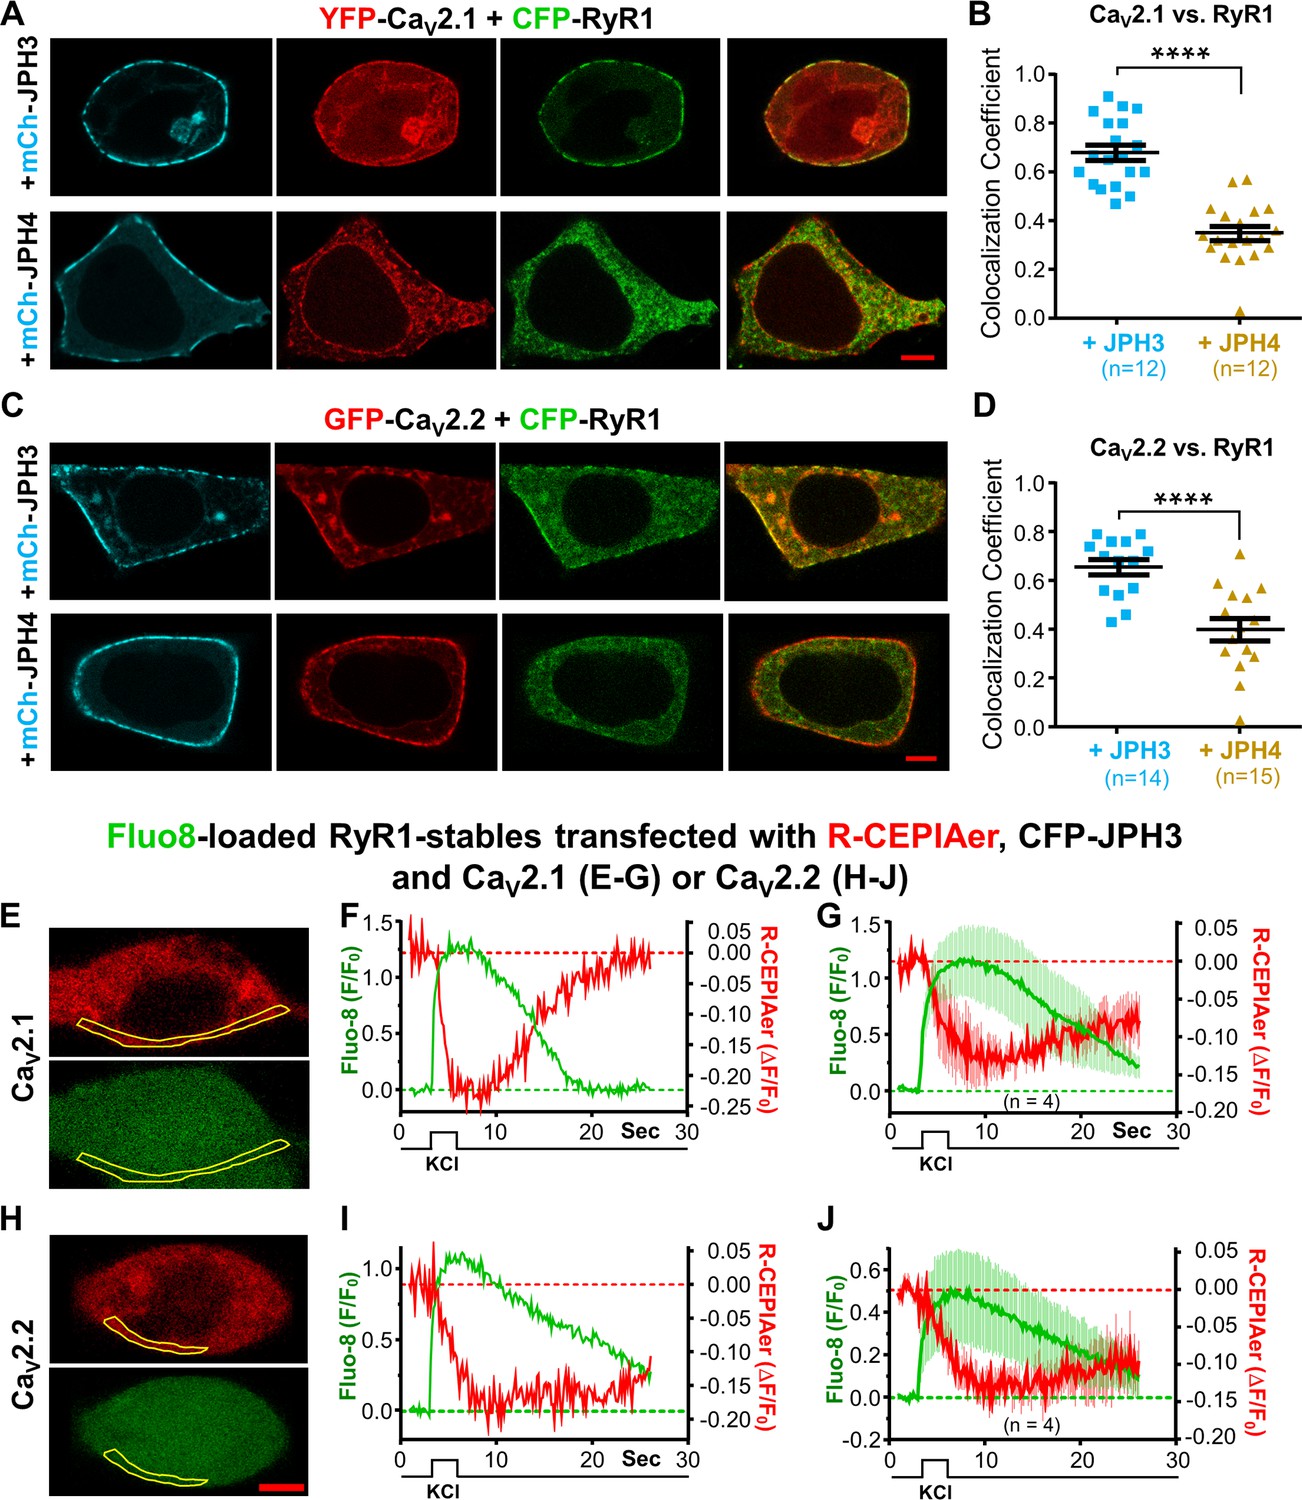
CaV2.1 and CaV2.2 colocalize with RyR1 in the presence of JPH3 but not of JPH4.
Ca2+ release from the endoplasmic reticulum (ER) is detectable after depolarization of cells expressing RyR1, JPH3, and either CaV2.1 or CaV2.2. (A) Representative images of cells expressing YFP-CaV2.1 (represented in red), CFP-RyR1 (represented in green), and either mCherry-JPH3 or mCherry-JPH4 (represented in cyan) as indicated. The rightmost images in each row are overlays of the YFP-CaV2.1 and CFP-RyR1 images. Pearson’s coefficients for these combinations of constructs calculated from bottom-surface scans are plotted in (B). (C) Representative images of cells expressing YFP-CaV2.2 (represented in red), CFP-RyR1 (represented in green), and either mCherry-JPH3 or mCherry-JPH4 (represented in cyan), as indicated. The rightmost images in each row are overlays of the YFP-CaV2.2 and CFP-RyR1 images. Pearson’s coefficients for these combinations of constructs, calculated from bottom-surface scans, are plotted in (D). In all cases (A–D), the cells were also transfected with β1b and α2-δ1. Statistical significance for (B) and (D): ****p ≤ 0.0001. (E–J) Cells stably transfected with RyR1 were transiently transfected with CFP-JPH3, R-CEPIAer (represented in red), β1b, α2-δ1, and either CaV2.1 (E–G) or CaV2.2 (H–J) and loaded with Fluo8-AM (represented in green). Representative images of such cells, acquired prior to depolarization, are shown in (E) and (H) for CaV2.1 and CaV2.2, respectively. (F, I) The Fluo8 and R-CEPIAer fluorescence for these two cells within the indicated regions of interest (outlined in yellow) is plotted as a function of time in response to a 2.5 s, focal application of 100 mM KCl. 4 of the 12 cells producing Fluo8 transients for CaV2.1 also displayed decreased ER Ca2+. 4 of the 11 cells producing Fluo8 transients for CaV2.2 also displayed decreased ER Ca2+. (G, J) Average responses of the four ER-responding cells, for each of the two construct combinations, represented as mean (solid lines) ± SEM (thin vertical lines). Pearson’s coefficients plotted in (B) and (D) and their statistical comparison are provided in Figure 7—source data 1. Raw data for ΔF/F0 plotted in (F), (G), (I), and (J) are given in Figure 7—source data 2.
-
Figure 7—source data 1
Numerical data and statistical analyses to support graphs in Figure 7B,D.
- https://cdn.elifesciences.org/articles/64249/elife-64249-fig7-data1-v2.docx
-
Figure 7—source data 2
Numerical data to support graphs in Figure 7F,G,I,J.
- https://cdn.elifesciences.org/articles/64249/elife-64249-fig7-data2-v2.docx
Figure 8 with 1 supplement
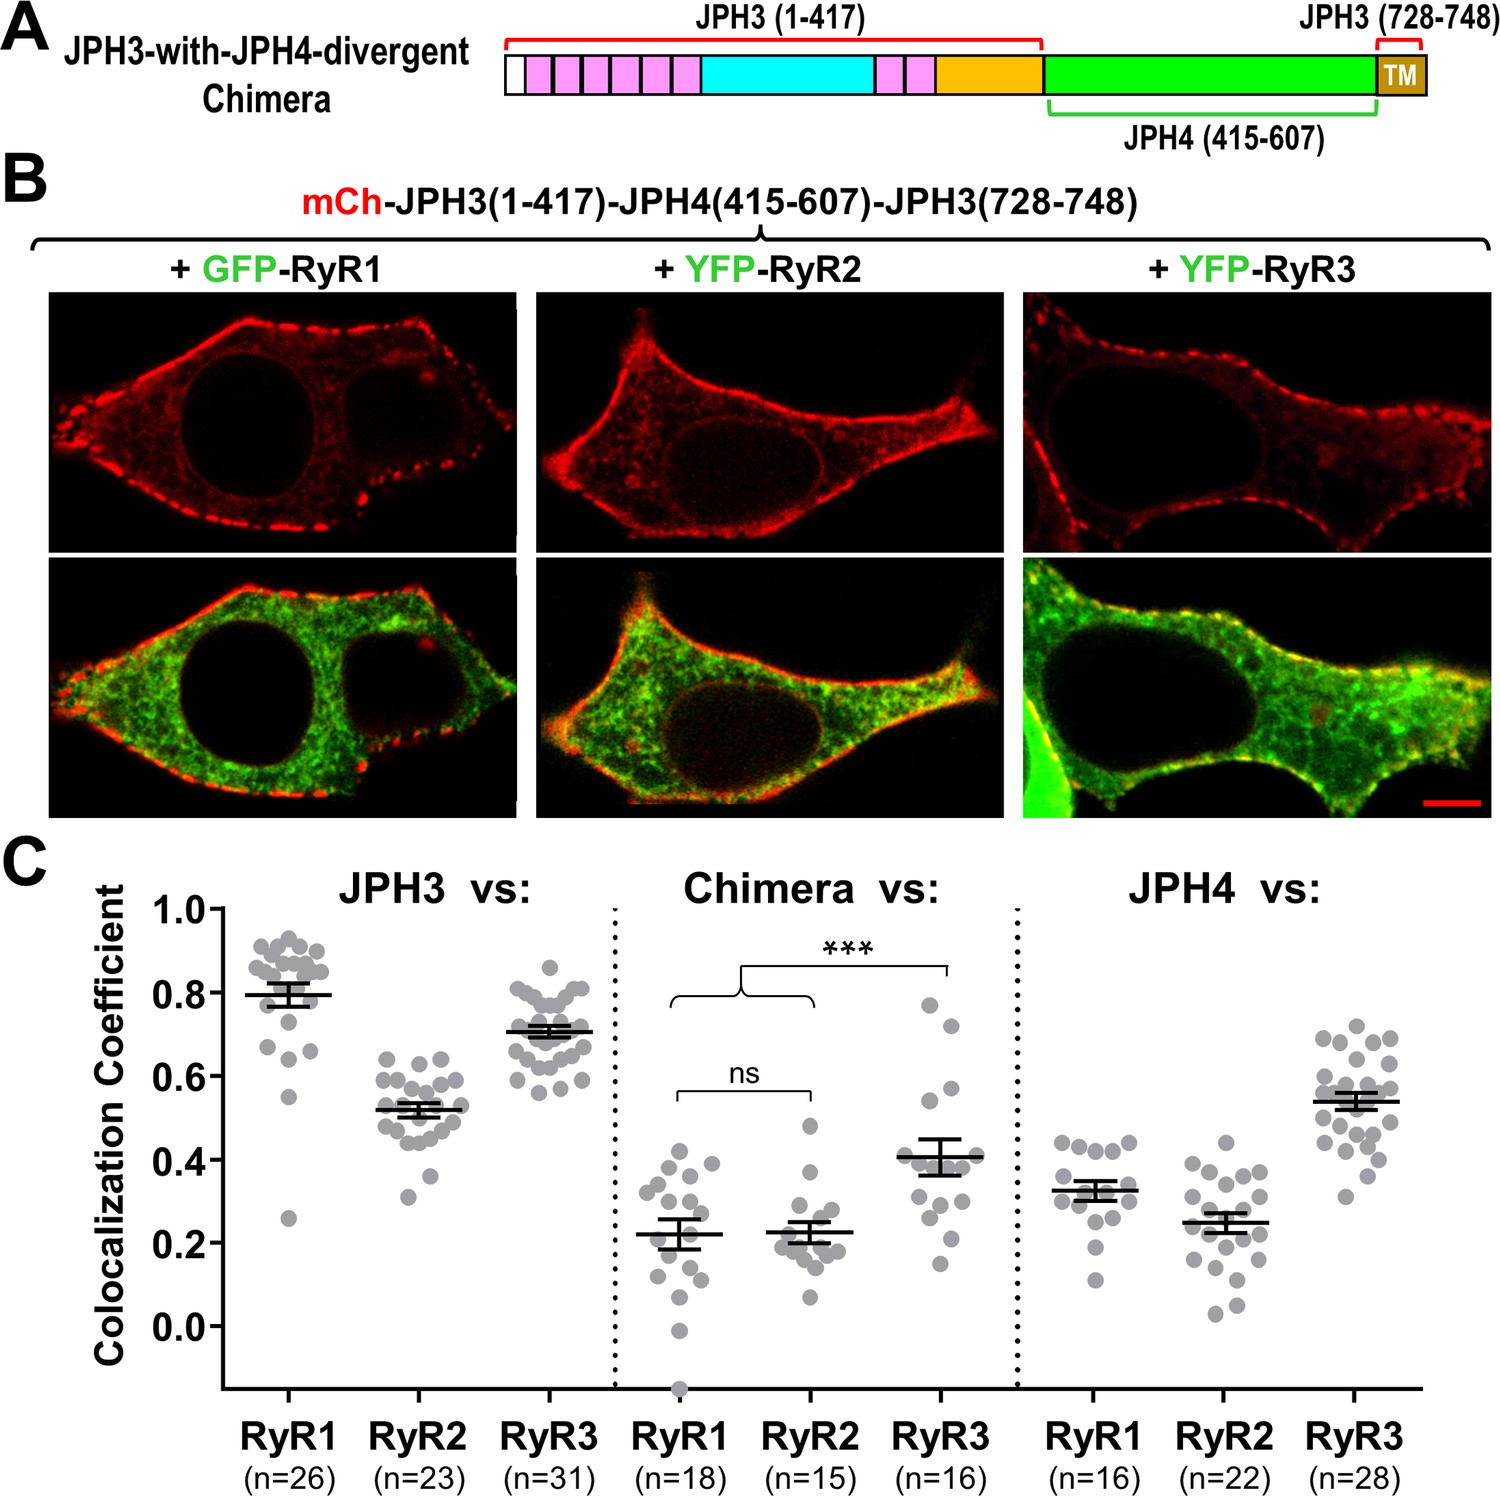
The JPH3 divergent domain is important for the junctional recruitment of all RyRs.
(A) Schematic representation of the chimera ‘JPH3-with-JPH4-divergent’ in which the divergent domain of JPH3 has been replaced by that from JPH4. (B) Red only (top row) and red/green merged images (bottom row) of mid-level confocal sections of tsA201 cells expressing the mCherry-tagged chimera, illustrated in (A), together with GFP-RyR1, YFP-RyR2, or YFP-RyR3 (left to right, represented in green). Scale bar = 5 μm. (C) Pearson's coefficients for colocalization between the three RyR isoforms and the chimeric junctophilin (center) calculated from bottom-surface images, compared with those for JPH3 (left) and JPH4 (right), which are replotted from Figure 5. Statistical significance: ***p ≤ 0.001, p > 0.99 (ns). Pearson’s coefficients are listed in Figure 8—source data 1, together with their statistical comparison to one another and to Pearson’s coefficients plotted in Figure 5.
-
Figure 8—source data 1
Numerical data and statistical analyses to support graphs in Figure 8.
- https://cdn.elifesciences.org/articles/64249/elife-64249-fig8-data1-v2.docx
Figure 8—figure supplement 1
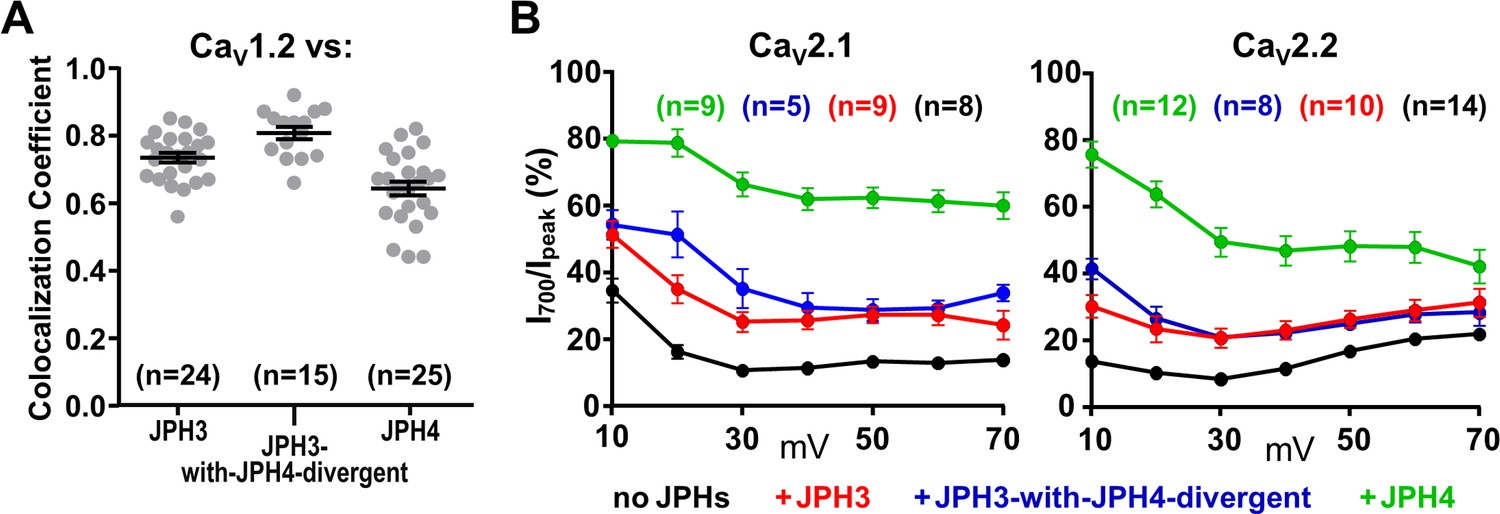
The JPH3 divergent domain is not important for interactions with voltage-gated calcium channels.
(A) Pearson's coefficients for tsA201 cells co-transfected with YFP-CaV1.2 and mCherry-tagged JPH3, JPH3-with-JPH4-divergent (see Figure 6A), or JPH4. Constructs for β1a and α2δ1were also present. (B) Fractional decay of calcium current (I700/Ipeak) in cells transfected with YFP-CaV2.1 or GFP-CaV2.2 either without junctophilins or together with the indicated mCherry-tagged junctophilin constructs. cDNAs for the CaV auxiliary subunits β1b and α2-δ1 were also present. JPH3-with-JPH4-divergent is very similar to intact JPH3 both in recruitment of CaV1.2 and in the slowing of inactivation of CaV2.1 and CaV2.2. Pearson’s coefficients plotted in (A) and their statistical comparison are listed in Figure 8—figure supplement 1—source data 1. Ipeak and I700 plotted in (B) are given in Figure 8—figure supplement 1—source data 2.
-
Figure 8—figure supplement 1—source data 1
Numerical data and statistical analyses to support graph in Figure 8—figure supplement 1A .
- https://cdn.elifesciences.org/articles/64249/elife-64249-fig8-figsupp1-data1-v2.docx
-
Figure 8—figure supplement 1—source data 2
Numerical data to support graph in Figure 8—figure supplement 1B.
- https://cdn.elifesciences.org/articles/64249/elife-64249-fig8-figsupp1-data2-v2.docx
Figure 9
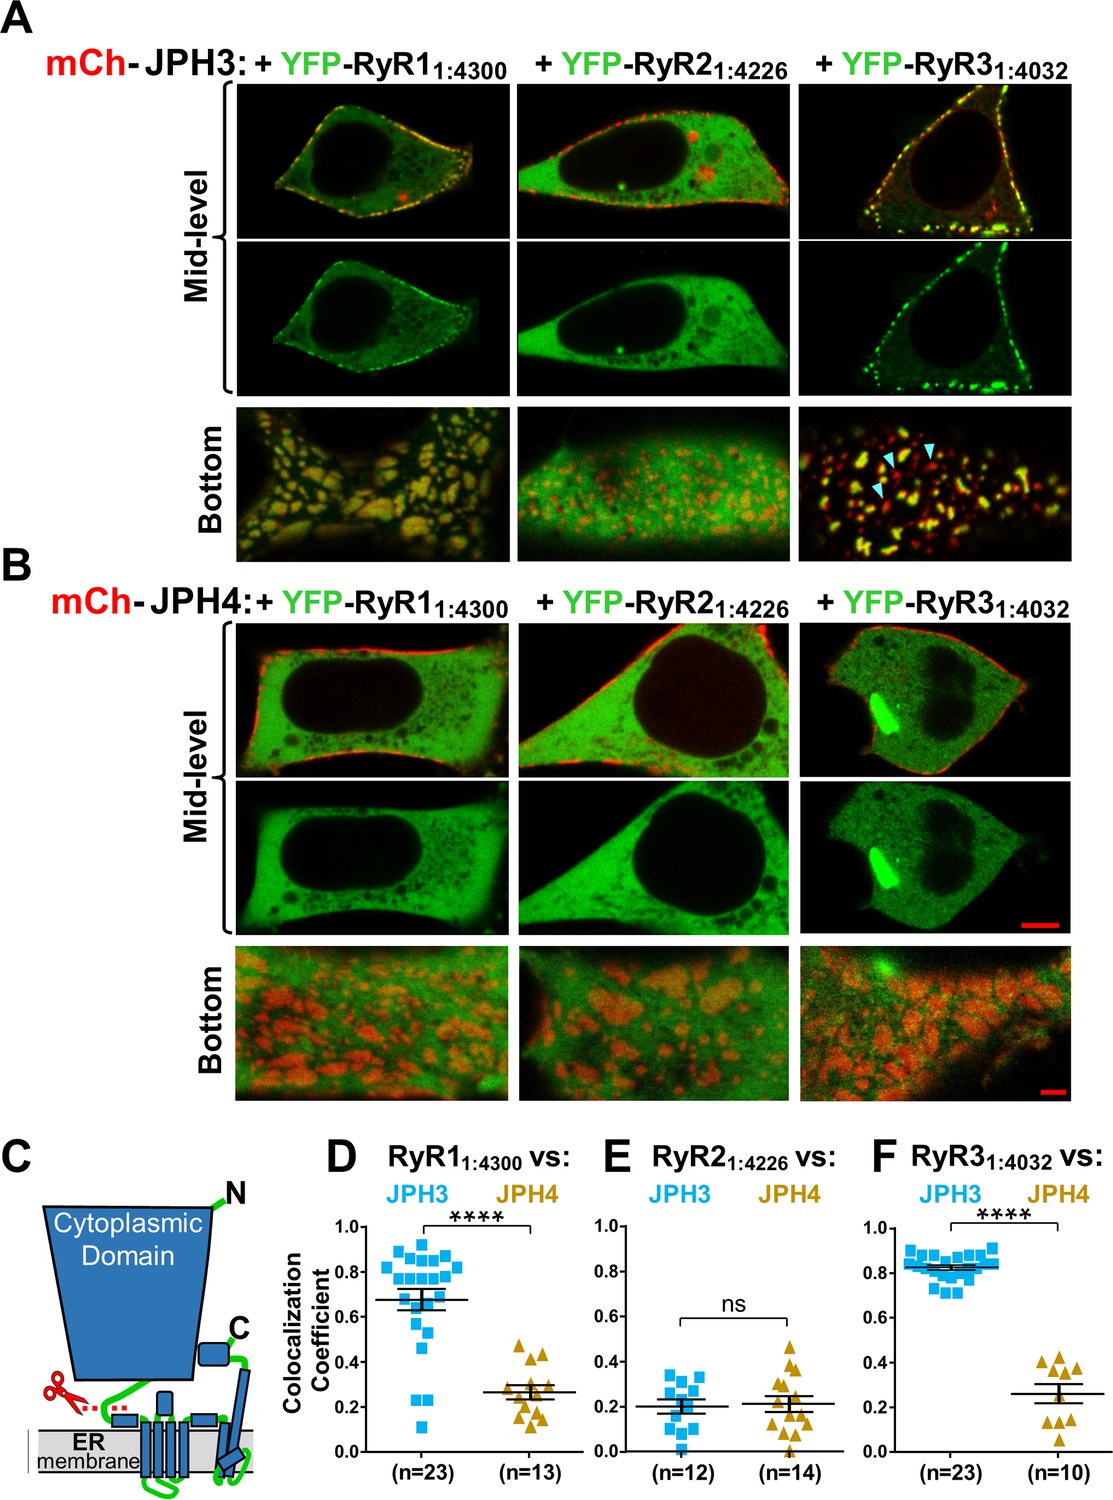
The cytoplasmic domains of RyR1 and RyR3, which have been untethered from the endoplasmic reticulum (ER), accumulate at JPH3-induced junctions between the endoplasmic reticulum and plasma membrane, but the untethered cytoplasmic domain of RyR2 does not; none of the untethered RyR cytoplasmic domains accumulate at junctions induced by JPH4.
Mid-level and bottom-surface optical sections of tsA201 cells expressing YFP-RyR11:4300, YFP-RyR21:4226, or YFP-RyR31:4032 (represented in green) together with either mCherry-JPH3 (A) or mCherry-JPH4 (B). The mid-level sections are illustrated both as overlaid red/green images and green-only images (first and second rows, respectively). Note that in the presence of JPH4 YFP-RyR11:4300, YFP-RyR21:4226, and YFP-RyR31:4032 all behaved as large cytoplasmic proteins, which were excluded from the nucleus and lumen of the ER but were otherwise uniformly distributed. In cells co-expressing JPH3 and RyR31:4032, some junctions contained both proteins, whereas others contained JPH3 with little RyR31:4032 (indicated by arrowheads in the lower-right panel of A). Scale bars = 5 and 2 μm, respectively, for the mid-level and bottom-surface images. (C) Schematic representation of an RyR monomer, indicating the approximate position at which the large cytoplasmic domain was severed from the ER-traversing segments identified in the cryo-EM structures (Samsó et al., 2005; Yuchi and Van Petegem, 2016). (D–F) Pearson's colocalization coefficients for the specified construct combinations calculated from bottom-surface images. Statistical significance: ****p < 0.0001, p > 0.99 (ns). Pearson’s coefficients and their statistical comparison are provided in Figure 9—source data 1.
-
Figure 9—source data 1
Numerical data and statistical analyses to support graphs in Figure 9.
- https://cdn.elifesciences.org/articles/64249/elife-64249-fig9-data1-v2.docx
Figure 10 with 1 supplement
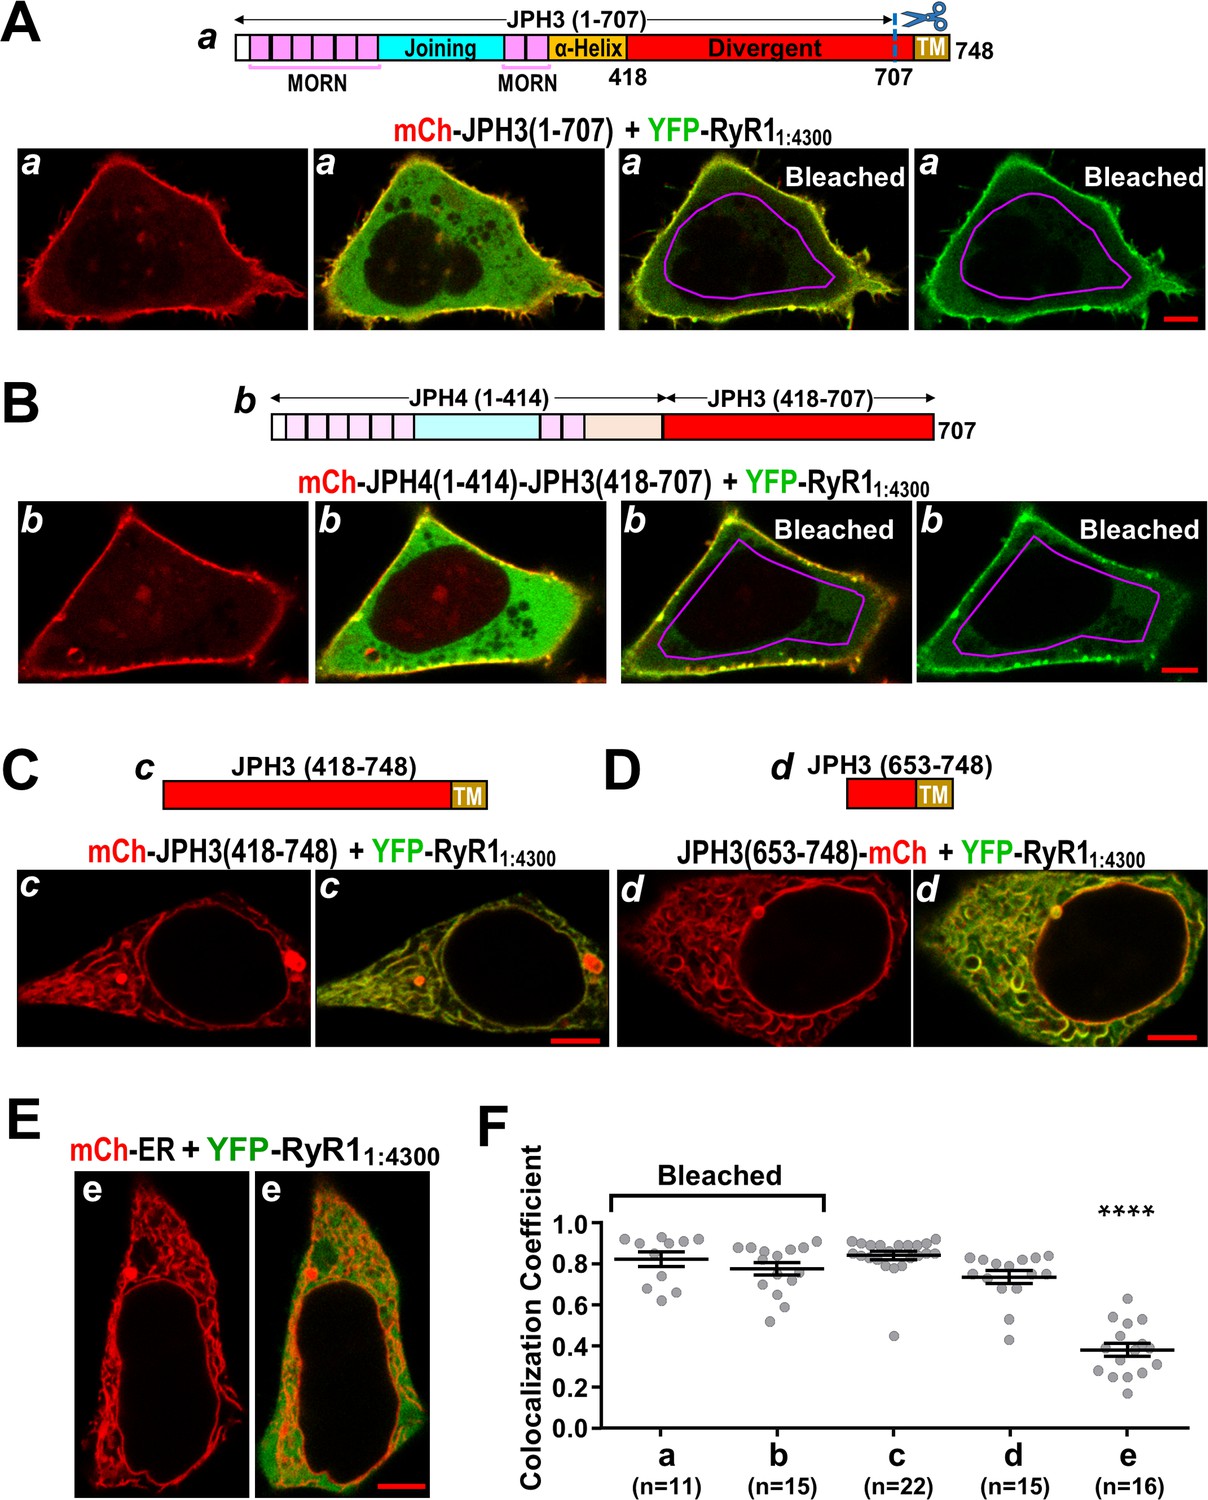
The cytoplasmic domain of RyR1 interacts with a distal segment of the JPH3 divergent region.
(A–E) Confocal sections of tsA201 cells transfected with YFP-RyR11:4300 (represented in green) and the indicated mCherry-tagged constructs. For all the constructs, the leftmost image displays only the mCherry fluorescence (in red), and the image just to its right is a red/green overlay of the mCherry and YFP fluorescence. (A, B) The constructs JPH3(1 – 707) and JPH4(1 – 414)-JPH3(418 – 707) lack the endoplasmic reticulum (ER) transmembrane domain but have MORN motifs that cause association with the plasma membrane (leftmost images). The distribution of YFP-RyR11:4300 was similar for JPH3(1 – 707) and JPH4(1 – 414)-JPH3(418 – 707): it overlapped the junctophilin constructs at the cell surface and was also diffusely present in the cytoplasm (second images from left). After photobleaching the YFP tag within the area outlined in violet, YFP-RyR11:4300 remained concentrated at the cell surface as indicated both in the red/green overlays (third images from left) and in the images of only the YFP-RyR11:4300 fluorescence (rightmost images). See text for additional details. (C, D) mCh-JPH3(418 – 748) and JPH3(653 – 748)-mCh lack the MORN motifs required for association with the plasma membrane and were distributed in a reticular pattern in the cell interior (left), with the YFP-RyR11:4300 having an overlapping pattern (right). (E) YFP-RyR11:4300 did not colocalize with mCherry-ER. Scale bars = 5 μm. (F) Pearson colocalization coefficients for YFP-RyR11:4300 versus the indicated constructs, calculated from mid-level optical sections. In the case of JPH3(1 – 707) and JPH4(1 – 414)-JPH3(418 – 707), these were calculated from sections acquired after photobleaching of YFP-RyR11:4300 in the cell interior. **** Significantly smaller than RyR11:4300 versus the other four junctophilin constructs. Pearson’s coefficients and their statistical comparison are provided in Figure 10—source data 1.
-
Figure 10—source data 1
Numerical data and statistical analyses to support graph in Figure 10.
- https://cdn.elifesciences.org/articles/64249/elife-64249-fig10-data1-v2.docx
Figure 10—figure supplement 1
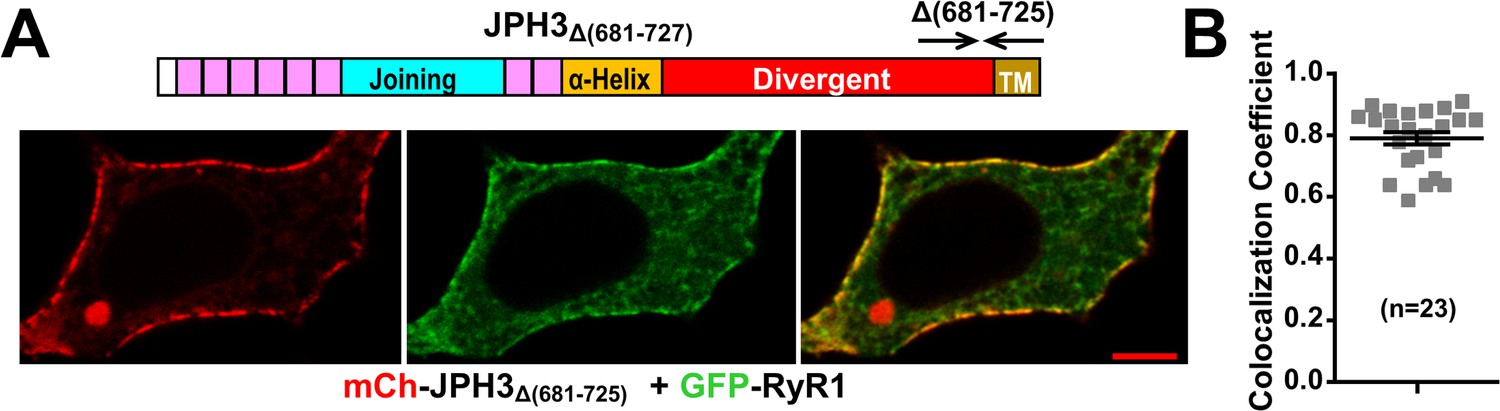
Deletion of JPH3 divergent domain residues 681 – 725 does not affect junctional recruitment of RyR1.
(A) Mid-level confocal sections of a tsA201 cell co-expressing mCherry-JPH3Δ(681-725) (red, left panel), GFP-RyR1 (green, center panel), and the red/green merged image (right panel). Scale bar = 5 µm. (B) Pearson's coefficients for GFP-RyR1 versus mCherry-JPH3Δ(681-725) calculated from bottom-surface optical sections. Pearson’s coefficients plotted in (B) and their statistical comparison to those of RyR1 versus full-length JPH3 are given in Figure 10—figure supplement 1—source data 1.
-
Figure 10—figure supplement 1—source data 1
Numerical data and statistical analyses to support graph in Figure 10—figure supplement 1.
- https://cdn.elifesciences.org/articles/64249/elife-64249-fig10-figsupp1-data1-v2.docx
Figure 11
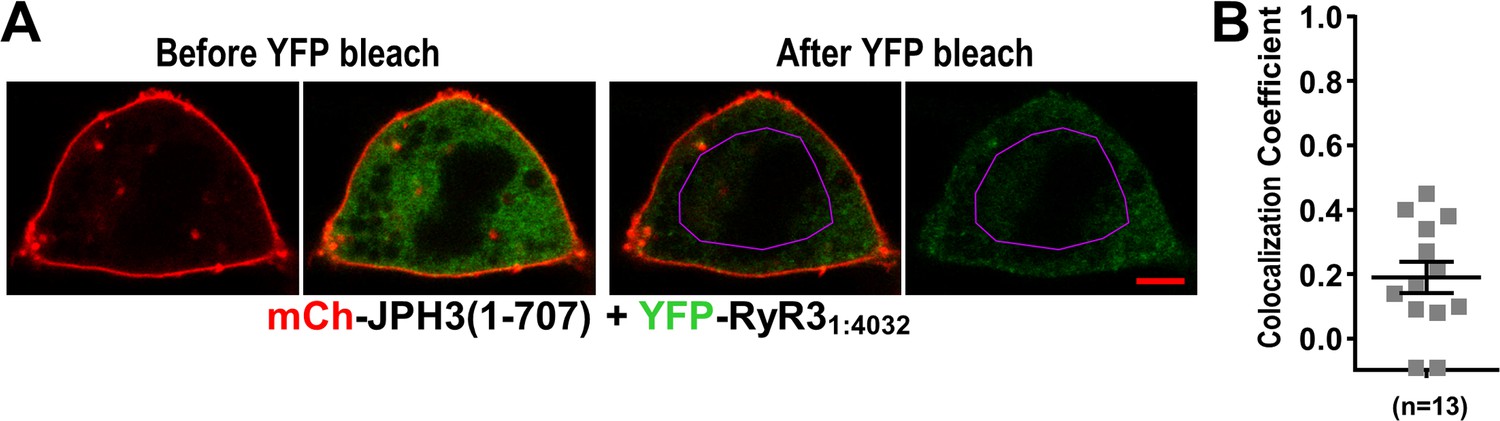
Absence of colocalization between YFP-RyR31:4032 and mCherry-JPH3(1 – 707) expressed in tsA201 cells.
(A) Mid-level optical sections acquired from a transfected cell before and after photobleaching of YFP. mCherry-JPH3(1 – 707) was associated with the cell surface (leftmost image) but there was only weak overlap with YFP-RyR31:4032, which is represented in green in the red/green overlay (faint regions of yellow in the second image from left). These small regions of yellow were almost entirely absent after photobleaching of YFP within the region of interest (ROI) outlined in violet (third panel from left), indicating that they were produced by overlap between mCherry-JPH3(1 – 707) and a mobile pool of YFP-RyR31:4032. The rightmost panel illustrates the relatively uniform bleaching of YFP-RyR31:4032 both inside and outside of the ROI. Scale bar = 5 μm. (B) Pearson's colocalization coefficients for YFP-RyR31:4032 versus mCherry-JPH3(1 – 707) calculated from post-bleach, overlay images like that illustrated in (A). Pearson’s coefficients plotted in (B) and their statistical comparison to those of RyR31:4032 versus full-length JPH3 (Figure 9F) are given in Figure 11—source data 1.
-
Figure 11—source data 1
Numerical data and statistical analyses to support graph in Figure 11.
- https://cdn.elifesciences.org/articles/64249/elife-64249-fig11-data1-v2.docx
Figure 12
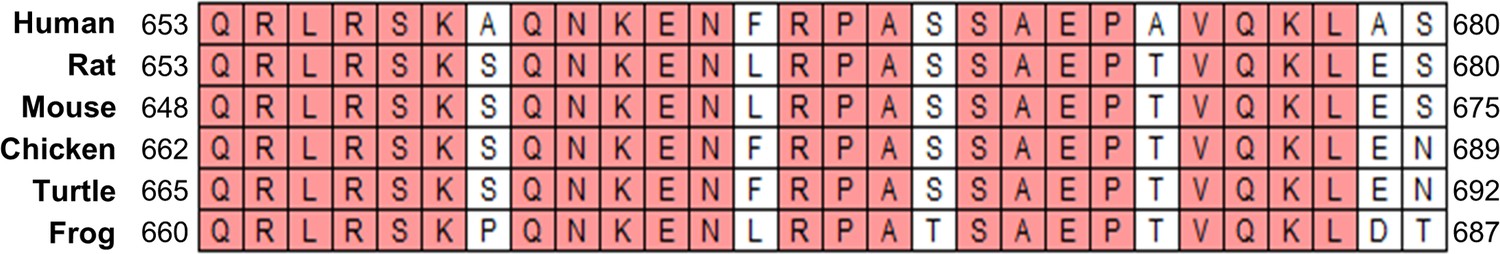
Species alignment of a segment of the JPH3 divergent domain that houses a likely site of interaction with the cytoplasmic domain of RyR1.
Identical residues are shaded pink, and the numbers designate the N- and C-terminal residues, respectively. NCBI Sequence References are AAH36533.1 (Homo sapiens), NP_001100907.1 (Rattus norvegicus), NP_065630.1 (Mus musculus), XP_015148144.2 (Gallus gallus), XP_026519458.1 (Terrapene carolina triunguis), and XP_017949016.1 (Xenopus tropicalis).
Tables
Key resources table
| Reagent type (species) or resource | Designation | Source or reference | Identifiers | Additional information |
|---|---|---|---|---|
| Cell line (Homo sapiens) | tsA201 | tsA201 | ECACC 96121229 RRID:CVCL_0063 | 100 % STR profile match to ATCC # CRL-3216 |
| Cell line (Homo sapiens) | Spiking-HEK293 | PMID:24391999 | HEK293 cells stably expressing NaV1.3 and KIR2.1 | 86 % STR profile match to ATCC # CRL-1573.3 |
| Cell line (Homo sapiens) | RyR1-stable cells | This paper (Materials and methods) | Spiking-HEK293 stably expressing RyR1 | |
| Transfected construct (Homo sapiens) | JPH3 | GenScript | C96900 | In vector: pcDNA3.1-DYK with addition of mCherry or ECFP CDS |
| Transfected construct (Homo sapiens) | JPH4 | GenScript | C97908 | In vector: pcDNA3.1-DYK with addition of mCherry or ECFP CDS |
| Transfected construct (Homo sapiens) | JPH3-with-JPH4-divergent | This paper (Materials and methods) | In vector: same as JPH3 | |
| Transfected construct (Homo sapiens) | JPH3(1 – 707) | This paper (Materials and methods) | In vector: pmCHerry-C1 | |
| Transfected construct (Homo sapiens) | JPH4(1 – 576) | This paper (Materials and methods) | In vector: pmCHerry-C1 | |
| Transfected construct (Homo sapiens) | JPH3Δ681-725 | This paper (Materials and methods) | In vector: same as JPH3 | |
| Transfected construct (Homo sapiens) | JPH4(1 – 414)-JPH3(418 – 707) | This paper (Materials and methods) | In vector: same as JPH3 | |
| Transfected construct (Homo sapiens) | JPH3(418 – 748) | This paper (Materials and methods) | In vector: pmCHerry-C1 | |
| Transfected construct (Homo sapiens) | JPH3(653 – 748) | This paper (Materials and methods) | In vector: pmCHerry-C1 | |
| Transfected construct (Oryctolagus cuniculus) | CaV1.2 | PMID:2474130 | NM_001136522.1 | In vector: pEYFP-C1 or pECFP |
| Transfected construct (Oryctolagus cuniculus) | CaV2.2 | PMID:8386525 | GenBank: D14157.1 | In vector: modified pSP72 (see ref 28) |
| Transfected construct (Rattus norvegicus) | CaV3.1 | PMID:9495342 | GenBank: AF027984.1 | |
| Transfected construct (Oryctolagus cuniculus) | CaV2.1 | PMID:1849233 | NM_001101693.1 | In vector: pEYFP-C1 |
| Transfected construct (Oryctolagus cuniculus) | α2δ1 | PMID:28495885 | NM_001082276.1 | |
| Transfected construct (Rattus norvegicus) | β1b | PMID:19996312 | GenBank: X61394.1 | |
| Transfected construct (Oryctolagus cuniculus) | RyR1 | PMID:2725677 | NM_001101718.1 | In vector: pEYFP-C1 or pECFP-C1 or pCEP4 (with oriP removed) |
| Transfected construct (Mus musculus) | RyR2 | PMID:10473538 | NM_023868.2 | In vector: pcDNA3 plus EYFP CDS |
| Transfected construct (Oryctolagus cuniculus) | RyR3 | PMID:12471029 | NM_001082762.1 | In vector: pcDNA3 plus EYFP CDS |
| Transfected construct (Oryctolagus cuniculus) | RyR11:4300 | PMID:29284662 | In vector: pEYFP-C1 | |
| Transfected construct (Mus musculus) | RyR21:4226 | This paper (Materials and methods) | In vector: pcDNA3 plus EYFP CDS | |
| Transfected construct (Mus musculus) | RyR21:3991 | This paper (Materials and methods) | In vector: pcDNA3 plus EYFP CDS | |
| Transfected construct (Oryctolagus cuniculus) | RyR31:4032 | This paper (Materials and methods) | In vector: pcDNA3 plus EYFP CDS | |
| Transfected construct (Oryctolagus cuniculus) | pCMV R-CEPIA1er | Addgene | Cat # 58216 RRID:Addgene_58216 | |
| Recombinant DNA reagent | pmCherry-C1 | TaKaRa/Clontech | Cat # PT3975-5 | |
| Recombinant DNA reagent | mCherry-ER | Addgene | Cat # 55041 RRID:Addgene_55041 | |
| Recombinant DNA reagent | pEYFP-C1 | TaKaRa/Clontech | Cat # 6006- 1 | |
| Recombinant DNA reagent | pECFP-C1 | TaKaRa/Clontech | Cat # 6076 -1 | |
| Recombinant DNA reagent | pCEP4 | Invitrogen | Cat # V044-50 | |
| Sequence-based reagent | #1 | This paper (Materials and methods) | PCR primer | CGGGAGCTGCCAAC CCCCTGCTGGTGGT CATGGTGATCTTGC |
| Sequence-based reagent | #2 | This paper (Materials and methods) | PCR primer | TCTAGCATGGGCTG CAGGTCTTTGGCAG TGATCCTGGCGAT |
| Sequence-based reagent | #3 | This paper (Materials and methods) | PCR primer | TCGCCAGGATCACT GCCAAAGACCTGCA GCCCATGCTAGAGG |
| Sequence-based reagent | #4 | This paper (Materials and methods) | PCR primer | AAGATCACCATGA CCACCAGCAGGG GGTTGGC |
| Sequence-based reagent | #5 | This paper (Materials and methods) | PCR primer | GCTCGCCAGTTTC TGCACG |
| Sequence-based reagent | #6 | This paper (Materials and methods) | PCR primer | CCTATCCTGGTGG TCATGGTG |
| Sequence-based reagent | #7 | This paper (Materials and methods) | PCR primer | GTACGGGCTCAGC GCCTATCGTGGTG GGAGCCGTGG |
| Sequence-based reagent | #8 | This paper (Materials and methods) | PCR primer | TGGAAGGAAGGGG AGAACTCCTGGGC TATCAGTTTGGCCA |
| Sequence-based reagent | #9 | This paper (Materials and methods) | PCR primer | TGGCCAAACTGATAG CCCAGGAGTTCTCCC CTTCCTTCCAGCACC |
| Sequence-based reagent | #10 | This paper (Materials and methods) | PCR primer | AGGGCCACGGCTCC CACCACGATAGGCG CTGAGCCCG |
| Sequence-based reagent | #11 | This paper (Materials and methods) | PCR primer | CCAGGATCACGAAT TCAGAGTTCTCCCC |
| Sequence-based reagent | #12 | This paper (Materials and methods) | PCR primer | AGTGGTACCTTCC AGGGTCAAGG |
| Sequence-based reagent | #13 | This paper (Materials and methods) | PCR primer | GAGATGAATTCCT TGCTGAGGATGG |
| Sequence-based reagent | #14 | This paper (Materials and methods) | PCR primer | ACGATAAGAGCA AGGGCGAGGAGG |
| Sequence-based reagent | #15 | This paper (Materials and methods) | PCR primer | CTCAGCAACACCAT GGTGGCGACC |
| Sequence-based reagent | #16 | This paper (Materials and methods) | PCR primer | CCATGGTGTTGCTG AGGATGGAGACGCAT |
| Sequence-based reagent | #17 | This paper (Materials and methods) | PCR primer | GCCCTTGCTCTTAT CGTCGTCATCCTTG TAATCGATGAA |
| Sequence-based reagent | #18 | This paper (Materials and methods) | PCR primer | GGGCTAGCGCCAC CATGCAGAGACTG CGGTCC |
| Sequence-based reagent | #19 | This paper (Materials and methods) | PCR primer | GTTCAGGGGGA GGTGTGG |
| Sequence-based reagent | #20 | This paper (Materials and methods) | PCR primer | CGTCAGATCCGCT AGCGCTACCG |
| Sequence-based reagent | #21 | This paper (Materials and methods) | PCR primer | GATCCCGGGCTA GCGGTACCGTCG |
| Sequence-based reagent | #22 | This paper (Materials and methods) | PCR primer | CCGGGCTAGCGGT ACCCCGTCGACTGC |
| Sequence-based reagent | #23 | This paper (Materials and methods) | PCR primer | CTGATCCGATACG TGGATGAGGCGC |
| Sequence-based reagent | #24 | This paper (Materials and methods) | PCR primer | CCATCTGTTTGCCT ATGCGGCCGCTCA CCACATTACC |
| Sequence-based reagent | #25 | This paper (Materials and methods) | PCR primer | GCTCCTGCGGCCG CTCCTTCTCACTCTC |
| Commercial assay or kit | jetPRIME transfection reagent | Polyplus | VWR Cat#:89129- 922 | |
| Chemical compound, drug | Caffeine | Sigma-Aldrich | Cat# C-0750 | |
| Chemical compound, drug | Fluo8-AM | Aat Bioquest | Cat # 21082 | |
| Software, algorithm | GraphPad Prism | GraphPad Prism | RRID:SCR_002798 | Graphs and statistics |
| Software, algorithm | Fiji | ImageJ | doi: 10.1038/nmeth.2019 RRID:SCR_002285 | Image analysis |
Additional files
Download links
A two-part list of links to download the article, or parts of the article, in various formats.
Downloads (link to download the article as PDF)
Open citations (links to open the citations from this article in various online reference manager services)
Cite this article (links to download the citations from this article in formats compatible with various reference manager tools)
Neuronal junctophilins recruit specific CaV and RyR isoforms to ER-PM junctions and functionally alter CaV2.1 and CaV2.2
eLife 10:e64249.
https://doi.org/10.7554/eLife.64249


