Spinal cord precursors utilize neural crest cell mechanisms to generate hybrid peripheral myelinating glia
- Department of Biology, University of Virginia, United States
Figures
Figure 1 with 3 supplements

MEP glia are hybrid, centrally derived, peripheral myelinating glia.
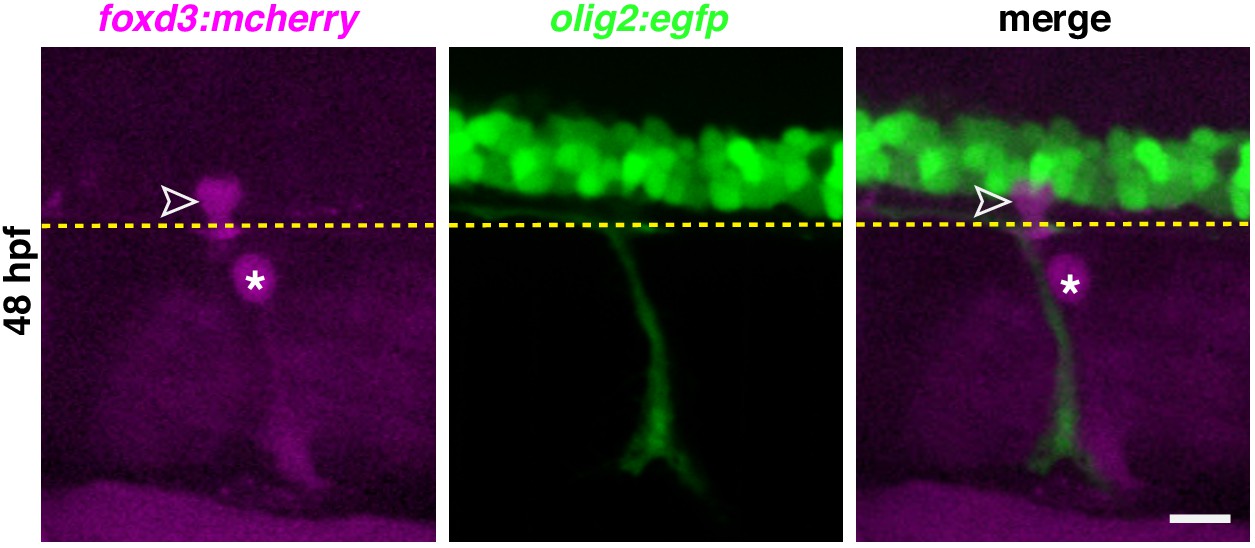
(A) Timeline of MEP glial development. MEP glia (purple) are specified in the ventral spinal cord (gray) after 36 hpf, exit through motor exit points at ~50 hpf, divide, and migrate to eventually initiate myelination of motor root axons (pink) starting at 72 hpf. mn: motorneuron, LFP: lateral floor plate. (B–F) Lateral views of the motor exit point showing (B) a nkx2.2a+/foxd3+ MEP glia (outlined arrowhead) exiting the spinal cord at the motor exit point at 48 hr post-fertilization (hpf); (C) an olig2+/foxd3+ MEP glia (outlined arrowhead) along motor nerve root axons at 55 hpf; (D) sox10+/nkx2.2a+ MEP glia (outlined arrowheads) and sox10-/nkx2.2a+ perineurial glia (arrow) at 72 hpf; (E) sox10+/nkx2.2a+ MEP glial sheaths (outlined arrowheads) and sox10-/nkx2.2a+ perineurial cells at 4 days post-fertilization dp (arrowhead) and (F) foxd3+ MEP glia making mbp+ myelin sheaths (outlined arrowheads) at 4 dpf. Insets show single z-plane images. (G) In olig2:egfp and nkx2.2a:nls-egfp larvae at 55 hpf, olig2+ pMN domain cells (teal), OPCs (gray), and MEP glia (purple) are labeled, as are nkx2.2a+ LFP cells (yellow), OPCs (gray) and MEP glia (purple). These images were used for fluorescence intensity measurement. (H) Violin plot of mean intensity of GFP fluorescence of olig2:egfp+ cells at 55 hpf (OPCs: 54914 ± 1674 arbitrary units (A.U.), MEP glia: 7149 ± 394, pMN domain cells: 29934 ± 1481). (I) Violin plot of mean intensity of GFP fluorescence of nkx2.2a:nls- egfp cells at 55 hpf (OPCs: 22981 ± 2013, MEP glia: 28610 ± 1624, lateral floor plate cells: 24049 ± 1602). (H–I) (n = 28 MEP glia, n = 28 OPCs and n = 28 neural tube cells from seven embryos). Asterisks denote the dorsal root ganglion (DRG) and yellow dashed lines denote the edge of the spinal cord. Scale bar (B–G) 20 µm.
-
Figure 1—source data 1
Source data for Figure 1 .
- https://cdn.elifesciences.org/articles/64267/elife-64267-fig1-data1-v2.xlsx
Figure 1—figure supplement 1
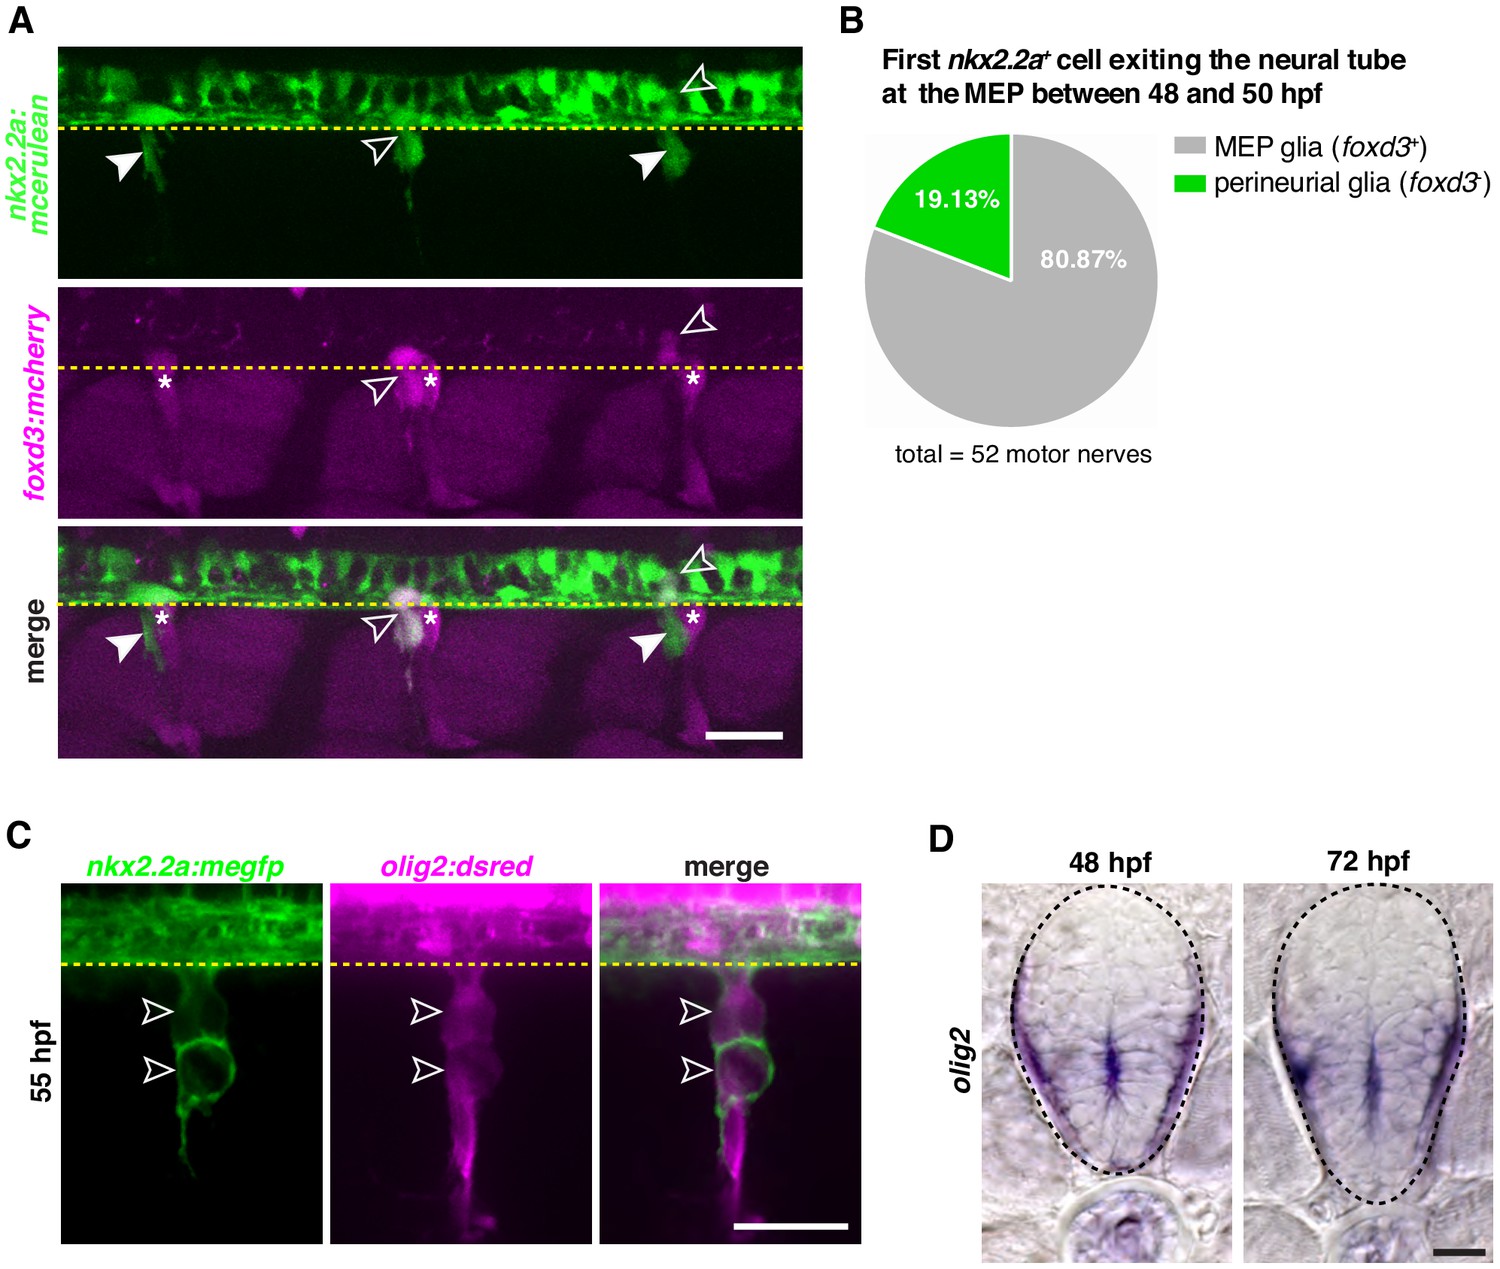
Development of nkx2.2a+MEP glia.
(A) Lateral view of the trunk of a foxd3:mcherry;nkx2.2a:mcerulean embryo showing nkx2.2a+/foxd3+ MEP glia (outlined arrowheads) and nkx2.2a+/foxd3- perineurial glia (arrowheads) at MEP TZs at 50 hpf. (B) Percentage of MEP glia versus perineurial glia that exit the neural tube first; n = 52 motor nerves. (C) Lateral view of a motor exit point in an olig2:dsred; nkx2.2a:megfp embryo showing nkx2.2a+/olig2+ MEP glia dividing (outlined arrowheads) at 55 hpf. (D) In situ hybridization of olig2+ cells in the spinal cord at 48 and 72 hpf. Dashed lines denote the edge of the spinal cord and asterisks denote the DRG. Scale bar (A) 25 µm, (C) 20 µm, (D) 10 µm.
-
Figure 1—figure supplement 1—source data 1
Source data for Figure 1—figure supplement 1 .
- https://cdn.elifesciences.org/articles/64267/elife-64267-fig1-figsupp1-data1-v2.xlsx
Figure 1—figure supplement 2
Fluorescence intensity over the timecourse of MEP glial development.
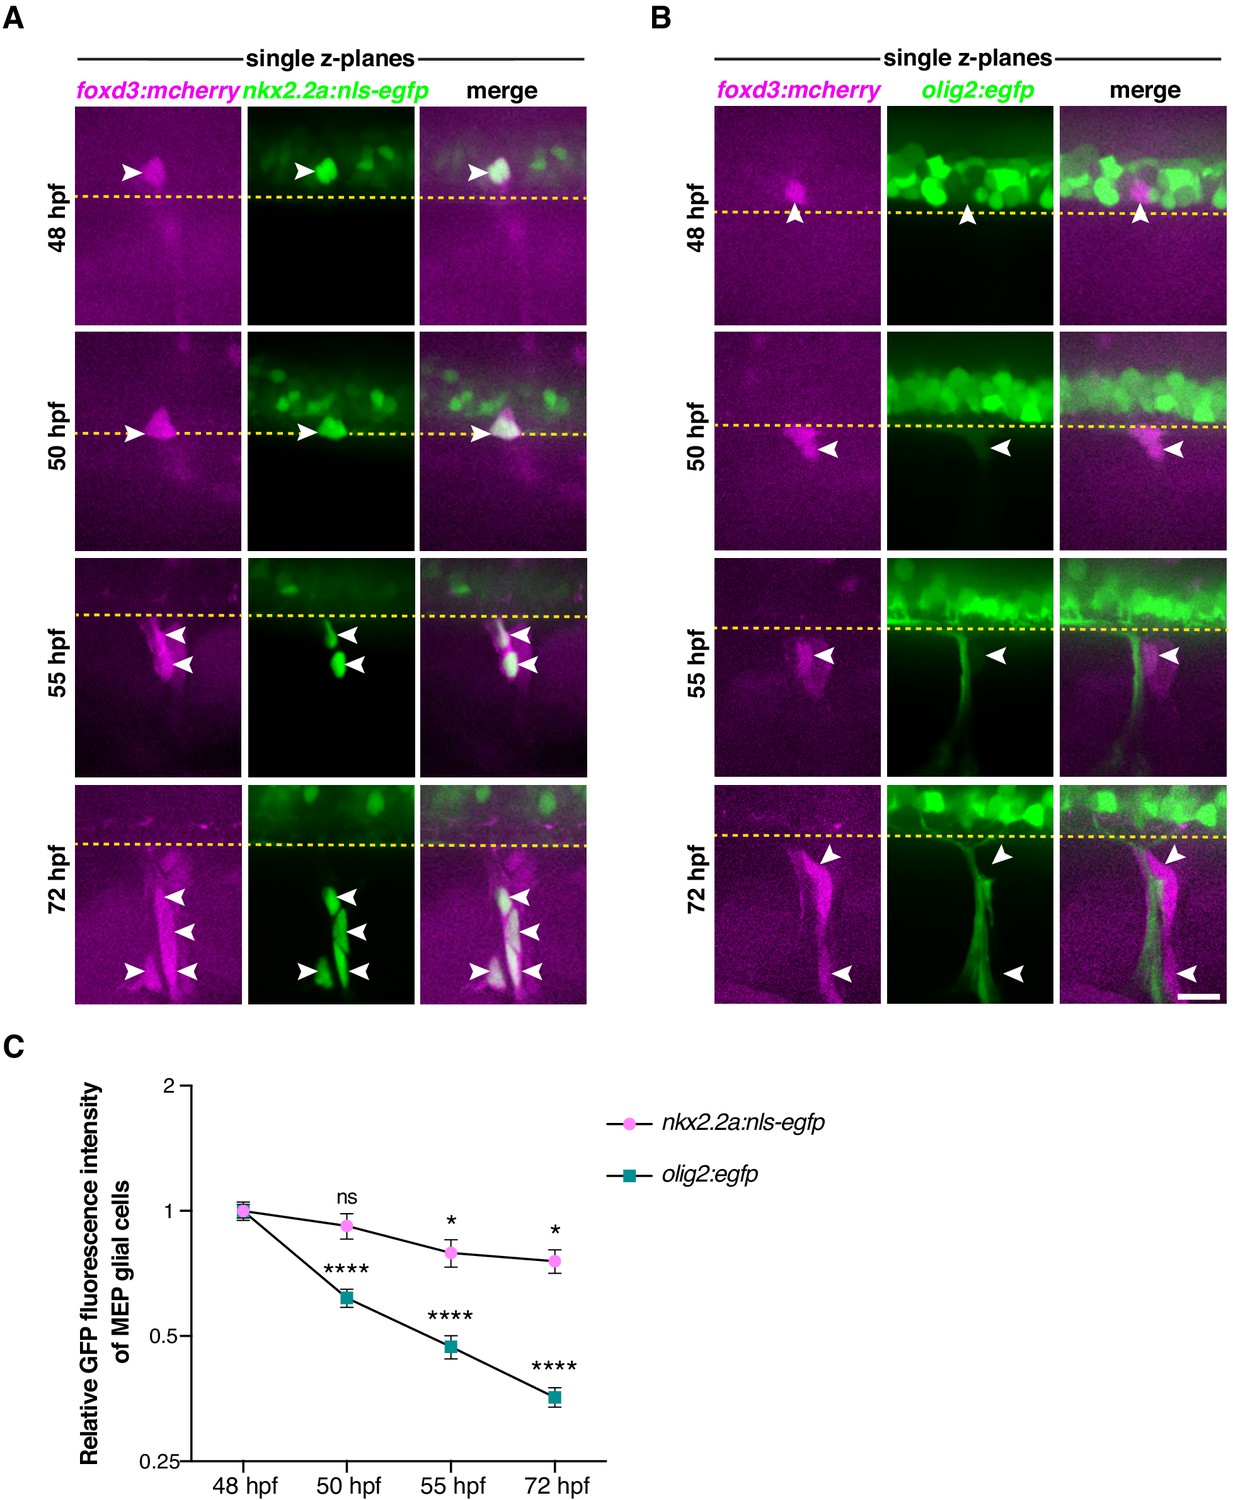
(A) Single z-plane confocal images of the motor exit points showing foxd3+/nkx2.2a+ MEP glia (arrowheads) at 48, 50, 55,and 72 hpf in foxd3:mcherry;nkx2.2a:nls-egfp embryos. (B) Single z-plane confocal images of the motor exit points showing foxd3+/olig2 + MEP glia (arrowheads) at 48, 50, 55 hpf and foxd3+/olig2- MEP glia (arrowheads) at 72 hpf in foxd3:mcherry;olig2:egfp embryos. (C) Relative GFP fluorescence intensity of MEP glial cells. Mean ± SEM of nkx2.2a fluorescence levels at 48hpf: 1 ± 0.05; 50hpf: 0.92 ± 0.06, p=0.53; 55hpf: 0.79 ± 0.06, p=0.03; 72hpf: 0.76 ± 0.05, p=0.02. Mean ± SEM of olig2 fluorescence levels at 48hpf: 1 ± 0.04; 50hpf: 0.62 ± 0.03, p<0.0001; 55hpf: 0.47 ± 0.03, p<0.0001; 72hpf: 0.36 ± 0.02, p<0.0001. (A–B) Scale bar, 20 μm.
-
Figure 1—figure supplement 2—source data 1
Source data for Figure 1—figure supplement 2 .
- https://cdn.elifesciences.org/articles/64267/elife-64267-fig1-figsupp2-data1-v2.xlsx
Figure 1—figure supplement 3
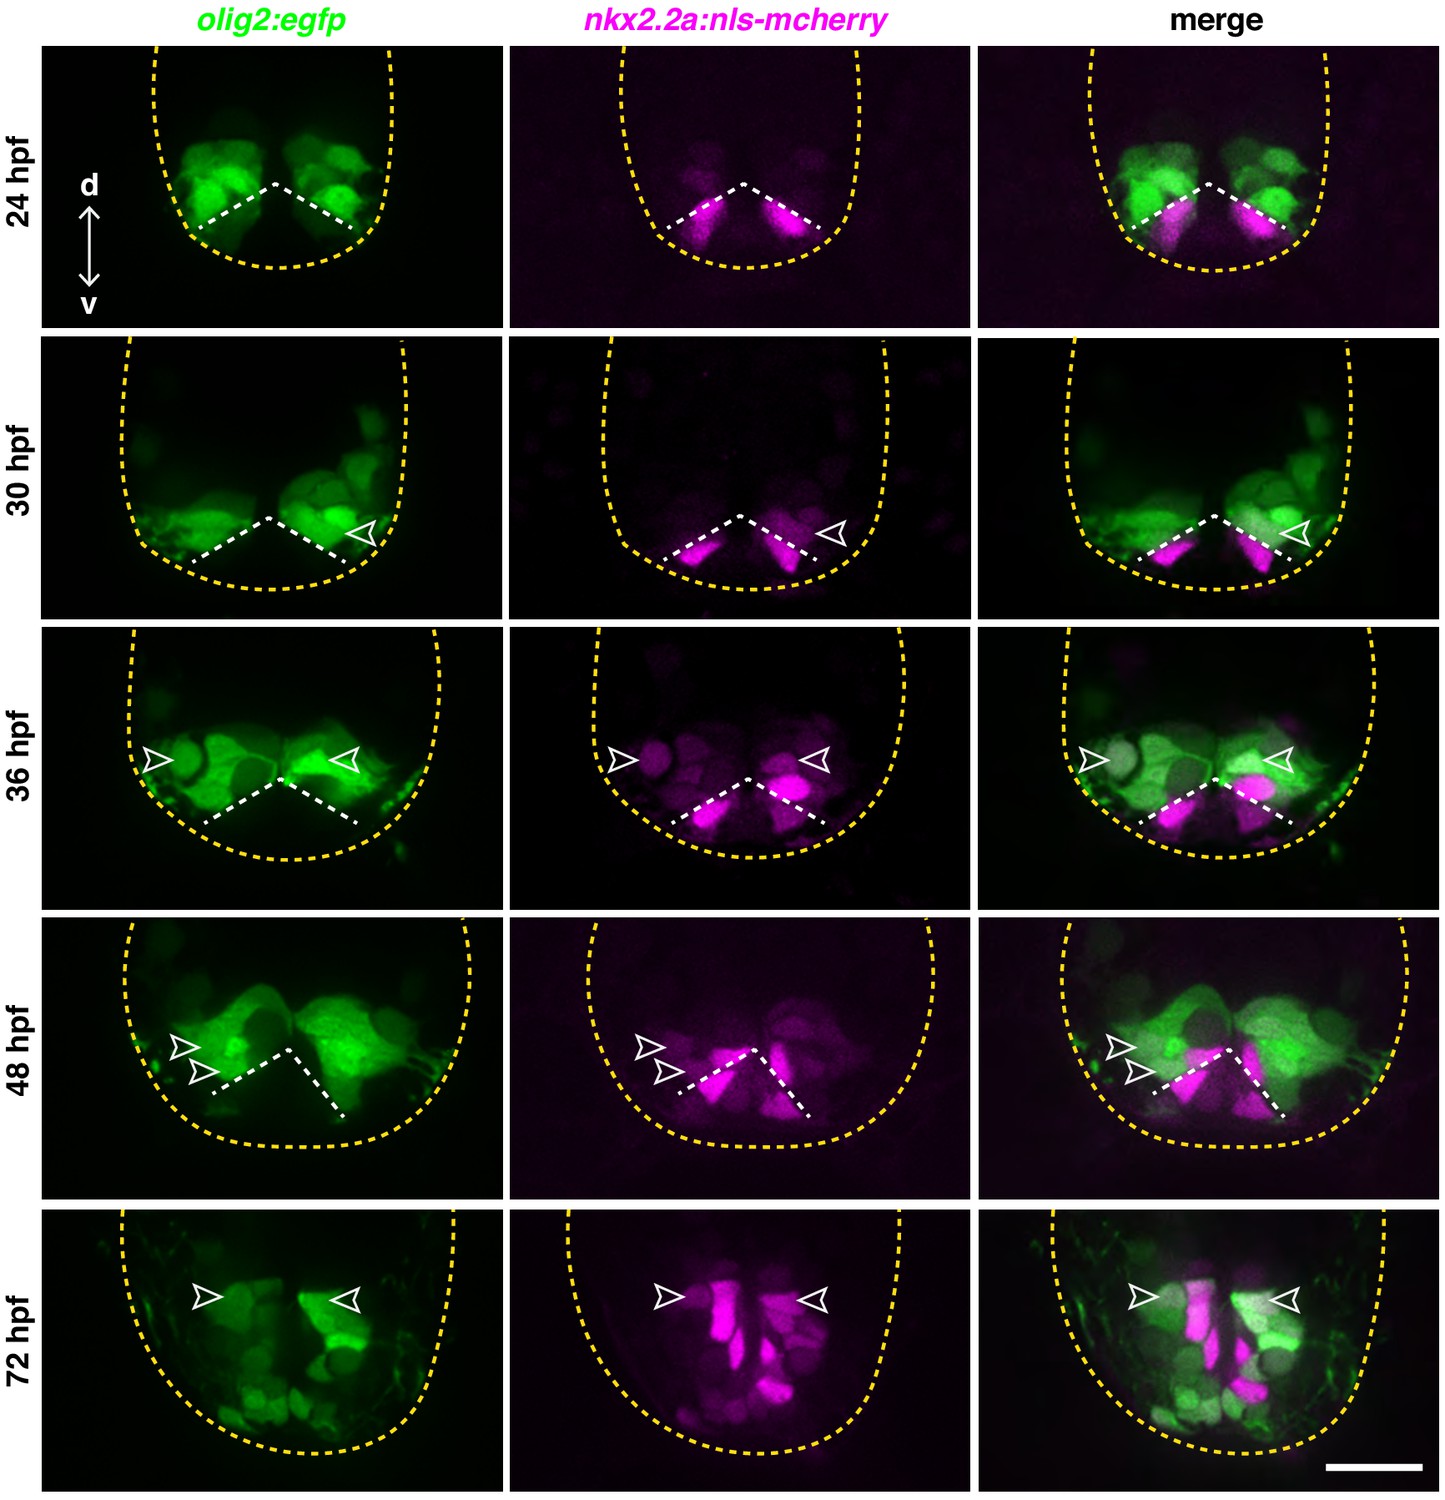
Transverse sections of the neural tube of olig2:egfp;nkx2.2a:nls-mcherry embryos at 24, 30, 36, 48, and 72 hpf showing olig2+/nkx2.2a+ cells (outlined arrowheads).
All sections were collected along the yolk extension. White dashed lines show the dorsal edge of the lateral floor plate and yellow dashed lines denote the edge of the spinal cord. Scale bar, 25 µm.
Figure 2 with 1 supplement
Ventral neural tube radial glial precursors give rise to MEP glia.
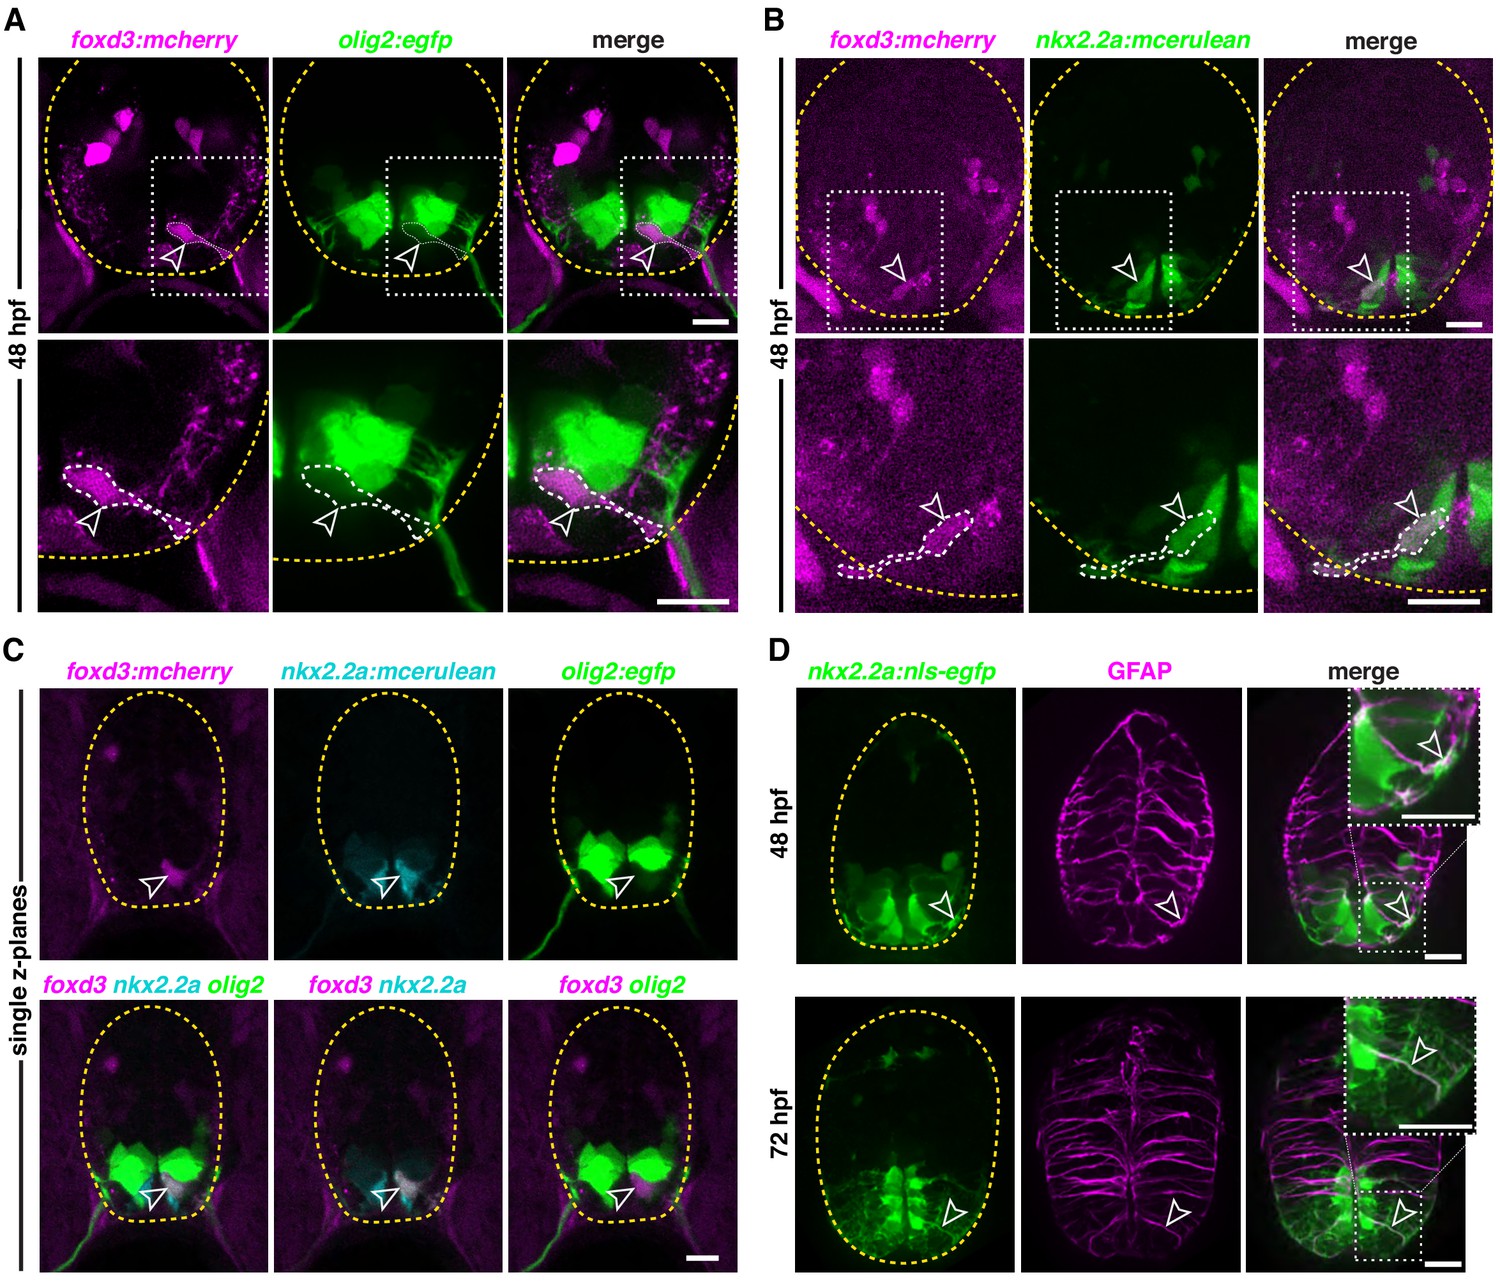
(A) Transverse section of a foxd3:mcherry;olig2:egfp embryo at 48 hpf showing a foxd3+/olig2+ MEP glial cell (outlined arrowhead) ventral to the olig2 pMN domain in the spinal cord. (B) Transverse section of a foxd3:mcherry;nkx2.2a:mcerulean embryo at 48 hpf showing a foxd3+/nkx2.2a+ MEP glial cell (outlined arrowhead). (C) Transverse section of a foxd3:mcherry;nkx2.2a:mcerulean;olig2:egfp embryo at 48 hpf showing a foxd3+/nkx2.2a+/olig2+ triple positive MEP glial cell (outlined arrowhead) in the p3 domain of the neural tube, just ventral to the pMN domain. (D) Transverse section of a nkx2.2a:nls-egfp embryo showing nkx2.2a+/GFAP+ radial glia (outlined arrowhead) at 48 hpf (top panel) and 72 hpf (bottom panel). Yellow dashed lines outline the edge of the spinal cord. Top right corner white boxes show higher magnification of bottom white boxes. Scale bar, (A–D) 10 µm.
Figure 2—figure supplement 1
Lateral view of the trunk of a foxd3:mcherry;olig2:egfp embryo showing one foxd3+ MEP glial cell (outlined arrowhead) at the MEP TZ at 48 hpf.
Yellow dashed lines denote the edge of the spinal cord and asterisks denote the DRG. Scale bar, 10 µm.
Figure 3 with 2 supplements
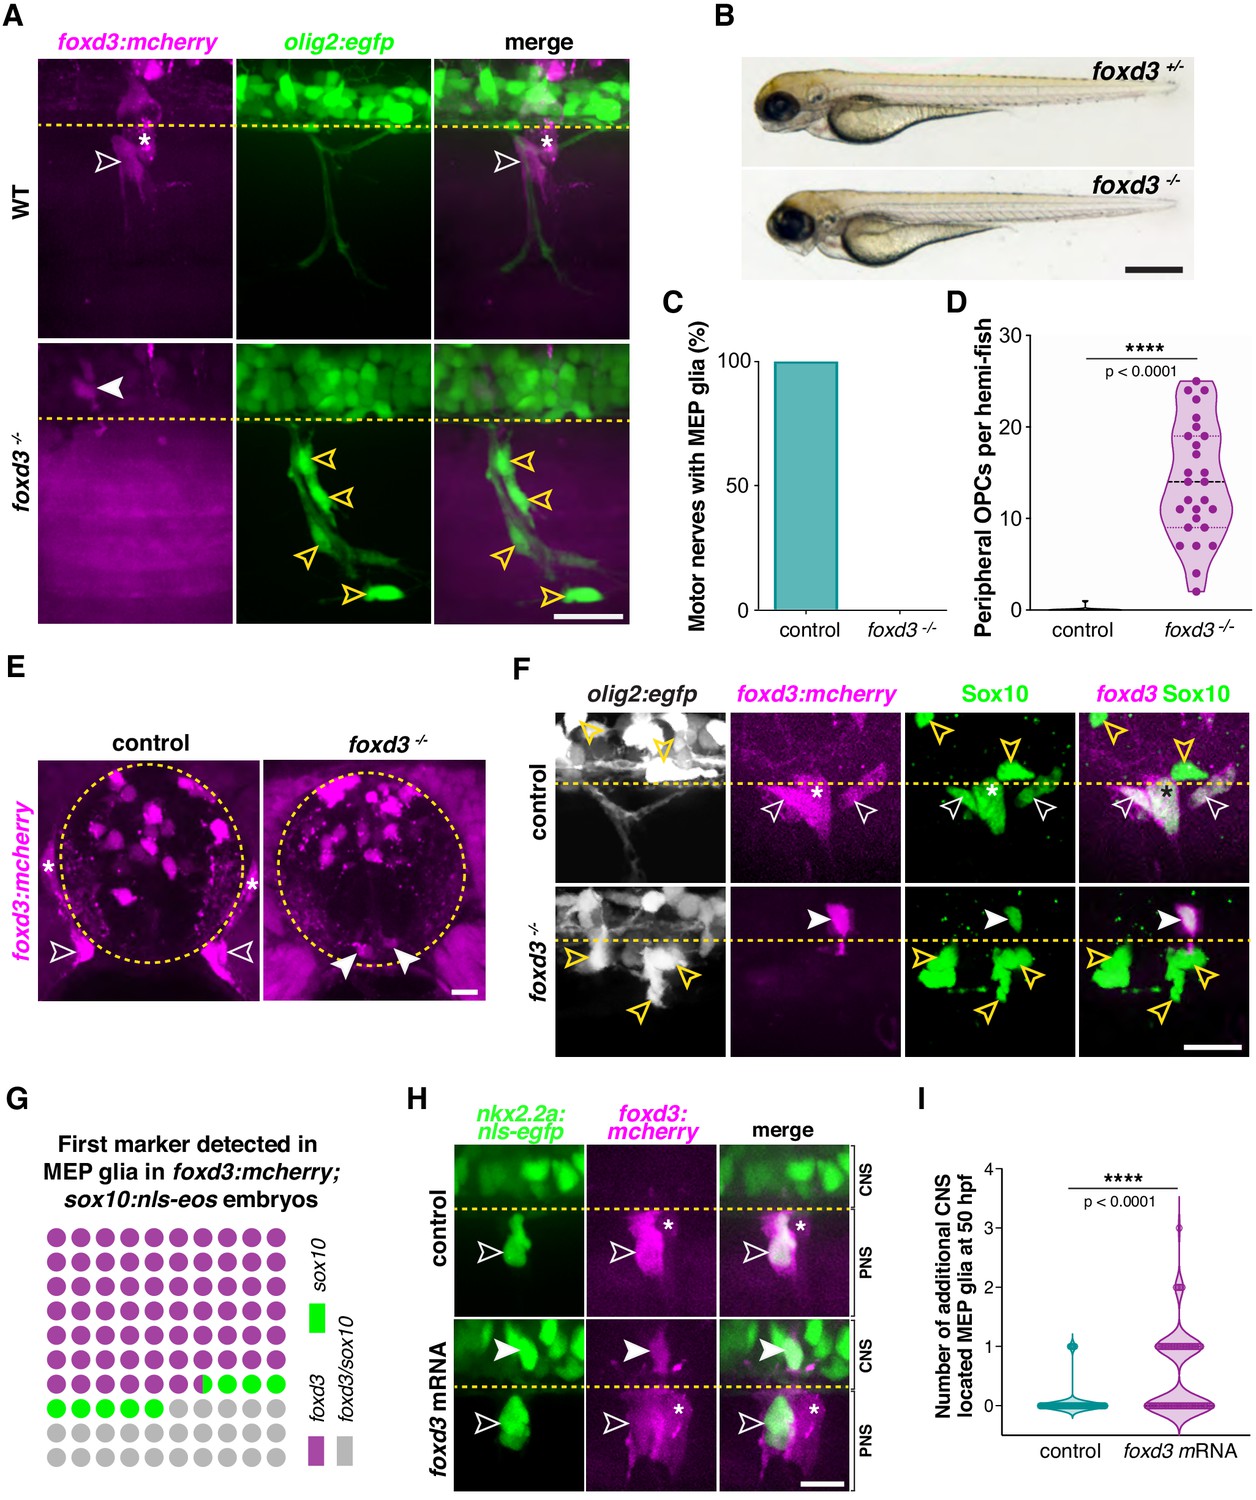
MEP glia require foxd3 to exit the spinal cord.
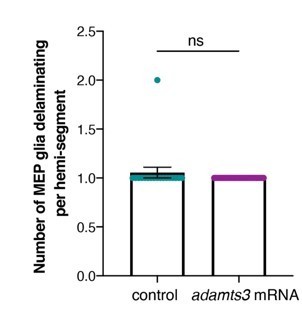
(A) MEP TZ in a foxd3:mcherry;olig2:egfp larvae showing foxd3+ MEP glia (white outlined arrowhead) along the motor root of a foxd3+/- control larva and stalled in the spinal cord of a foxd3-/- larva (white arrowhead) at 3 dpf. Note the presence of peripheral OPCs (yellow outlined arrowheads) along motor nerve axons in a foxd3-/- sibling lacking peripheral MEP glia. (B) Bright-field images of foxd3+/- and foxd3-/- siblings at 3 dpf reveal no developmental delay in foxd3-/- larvae. (C) Percentage of motor nerves with MEP glia in foxd3+/- (n = 150 nerves from 10 larvae) and foxd3-/- siblings (n = 270 nerves from 27 larvae) at 3 dpf. (D) Mean ± SEM of peripheral OPCs in olig2:egfp;foxd3:mcherry;foxd3+/- (0.07 ± 0.07, n = 15 larvae) and foxd3-/- (14.07 ± 1.2, n = 27 larvae) larvae at 3 dpf; p<0.0001. (E) Transverse sections of the spinal cord in foxd3:mcherry;foxd3+/- and foxd3-/- larvae showing MEP glia (outlined arrowheads) at the motor nerve root in a control sibling and MEP glia (arrowheads) in the lateral floor plate in a foxd3 mutant at 72 hpf. (F) Immunohistochemistry showing Sox10+/foxd3+ MEP glia (white outlined arrowheads) along motor nerve root axons in a foxd3+/- control embryo, and a Sox10+/foxd3+ MEP glial cell (white arrowhead) stalled in the spinal cord of a foxd3-/- larvae at 3 dpf. Yellow outlined arrowheads show OPCs in the spinal cord in a control larva and along peripheral axons in a foxd3-/- larva. Asterisks denote the DRG in control larvae. Note the absence of DRG in foxd3 mutants. (G) Dot plot of markers first detected in MEP glia, in percent. (H) Control and foxd3 mRNA-injected nkx2.2a:nls-egfp;foxd3:mcherry embryos showing a nkx2.2a+/foxd3+ MEP glia (outlined arrowhead) in the PNS in a control embryo and nkx2.2a+/foxd3+ MEP glia both in the CNS (arrowhead) and PNS (outlined arrowhead) in the injected embryo, at 50 hpf. (I), Mean ± SEM of additional CNS-located MEP glia indicates 0.08 ± 0.03 MEP glia in control embryos (n = 76 hemi-segments from 10 embryos), and 0.54 ± 0.07 MEP glia in foxd3 mRNA injected embryos (n = 78 hemi-segments from 10 embryos) at 50 hpf; p<0.0001. Asterisks denote the DRG and yellow dashed lines denote the edge of the spinal cord. Scale bar, (A, F) 25 µm, (B) 0.5 mm, (E) 10 µm, and (H) 20 µm.
-
Figure 3—source data 1
Source data for Figure 3 .
- https://cdn.elifesciences.org/articles/64267/elife-64267-fig3-data1-v2.xlsx
Figure 3—figure supplement 1
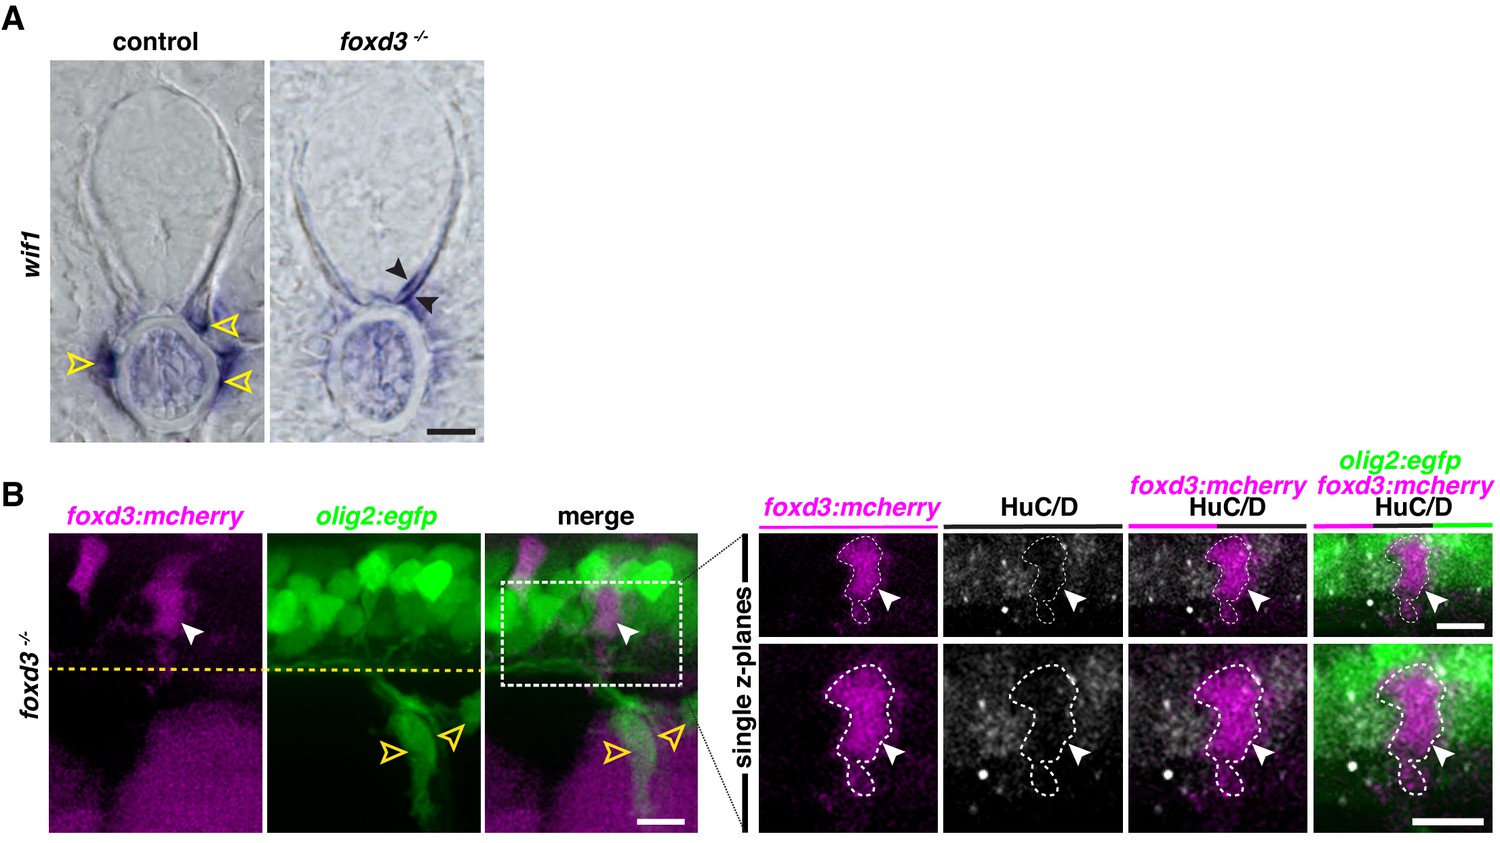
MEP glia do not exit the spinal cord infoxd3mutant larvae.
(A) In situ hybridization showing wif1+ MEP glia (yellow outlined arrowheads) along the motor nerve root in a foxd3+/- control larva and wif1+ MEP glia (black arrowheads) in the spinal cord of foxd3-/- larva at 3 dpf. (B) Lateral view of a foxd3:mcherry; olig2:egfp;foxd3-/- larva at 3 dpf showing a foxd3+ MEP glia in the CNS (white arrowhead) and olig2+ OPCs in the PNS (yellow outlined arrowheads). Dashed box shows single z-plane confocal image of a HuC immunohistostaining showing olig2+/HuC+ motorneurons and a foxd3+/HuC- MEP glial cell (white arrowhead). Scale bar, (A–B) 10 µm.
Figure 3—figure supplement 2
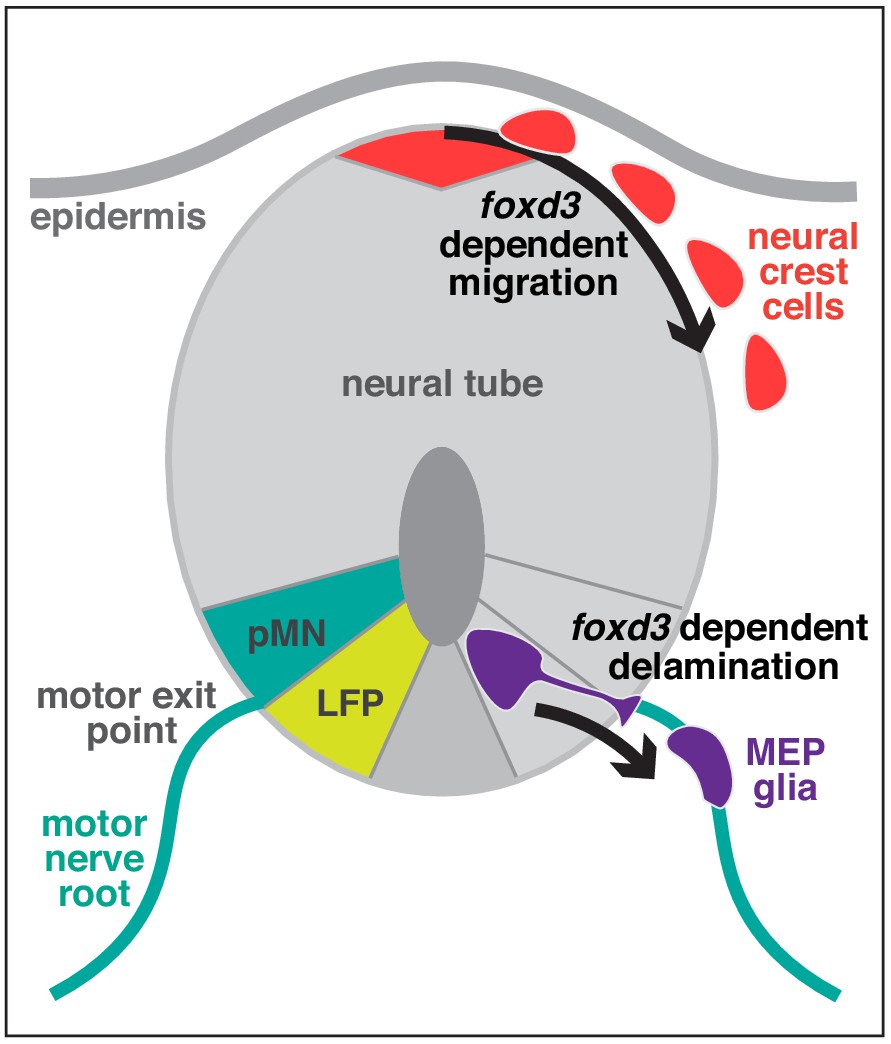
Schematic of the zebrafish neural tube showing foxd3-dependent MEP glial (purple) delamination from the lateral floor plate (LFP), mirroring foxd3-dependent neural crest cell (red) migration from the dorsal neural tube.
Figure 4
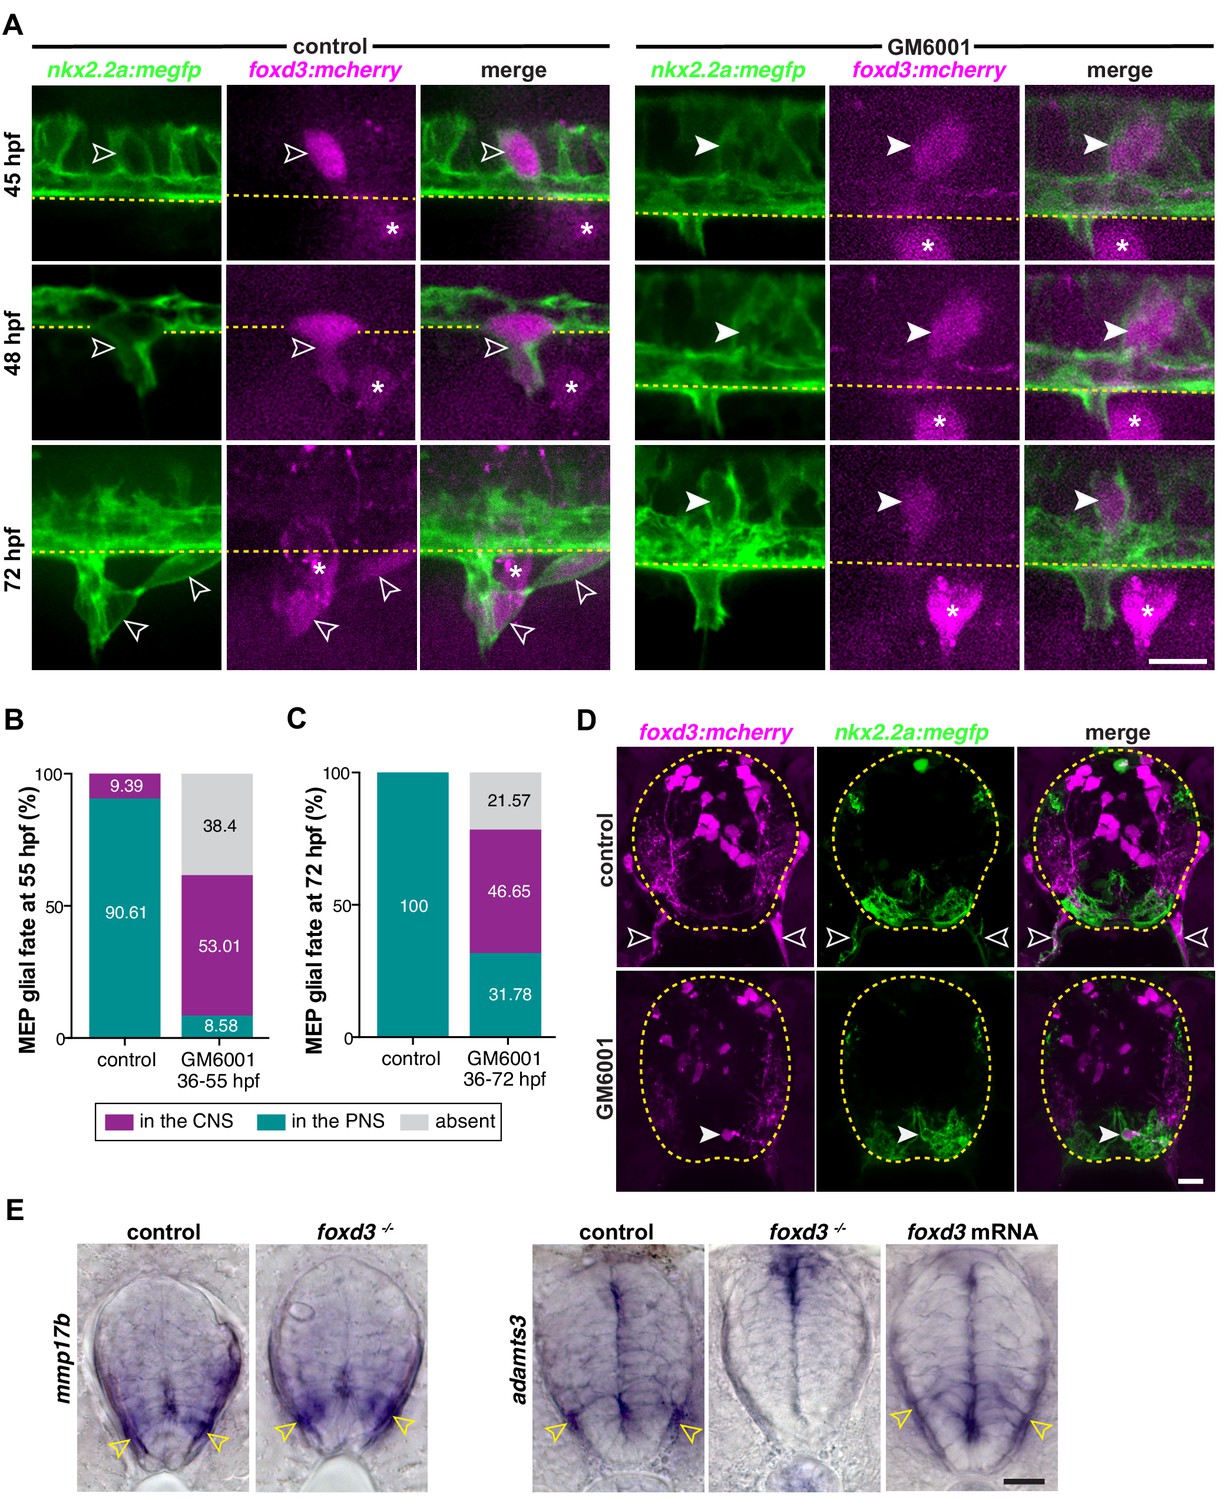
Matrix metalloproteinases participate in MEP glial exit.
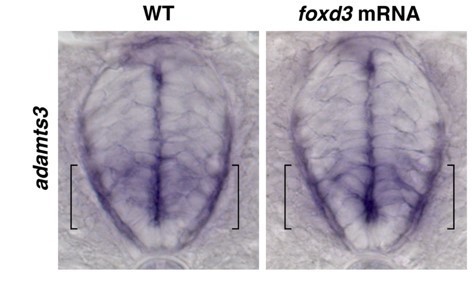
(A) Lateral view of the zebrafish trunk showing a nkx2.2a+/foxd3+ MEP glial cell (outlined arrowhead) delaminate from the lateral floor plate and exit the spinal cord in a control embryo and nkx2.2a+/foxd3+ MEP glia unable to exit the spinal cord (white arrowhead) in an embryo treated with 100 µM GM6001 from 36 to 48 hpf. (B) Percentage of MEP glia in the spinal cord, absent, or present along motor nerves at 55 hpf in DMSO control (n = 68 nerves from six embryos) and GM6001- treated embryos (n = 68 nerves from eight embryos). (C) Percentage of MEP glia in the spinal cord, absent, or present along motor nerves at 72 hpf in DMSO control (n = 70 nerves from seven larvae) and GM6001-treated larvae (n = 70 nerves from seven larvae). (D) Transverse sections of foxd3:mcherry;nkx2.2a:megfp spinal cords at 72 hpf showing nkx2.2a+/foxd3+ MEP glia in the PNS (outlined arrowheads) in DMSO control and nkx2.2a+/foxd3+ MEP glia in the lateral floor plate (arrowhead) in GM6001-treated larvae. Yellow dashed lines outline the edge of the spinal cord. (E) In situ hybridizations showing mmp17b in the spinal cord of foxd3+/- and foxd3-/- siblings and adamts3 expression in the spinal cord of foxd3+/- and foxd3-/- siblings and foxd3 mRNA injected embryos at 48 hpf. Scale bar, (A, D, E) 10 µm.
-
Figure 4—source data 1
Source data for Figure 4 .
- https://cdn.elifesciences.org/articles/64267/elife-64267-fig4-data1-v2.xlsx
Figure 5 with 1 supplement

Clonal analysis reveals that neural tube precursors give rise to one MEP glial progenitor per motor exit point.
(A) Lateral view of Sox10 immunohistochemistry in a nkx2.2a:cre;ubi:zebrabow larvae showing Cre recombinase driven recombination (blue and green) in nkx2.2a+ cells at 4 dpf. Floor plate cells (bracket) and Sox10+ MEP glia along two distinct nerves (white and yellow outlined arrowheads respectively) labeled. (B) Percentage of MEP glia present along a single motor nerve sharing a common (96.67%) vs distinct neural tube precursor (3.33%); n = 214 MEP glia and n = 60 motor nerves in 20 animals. (C) Ternary plot showing the intensity profile of 14 MEP glia present on three adjacent motor nerves (white and yellow symbols in C correspond to white and yellow outlined arrowheads in A) for RFP, YFP and CFP, in percent. (D) Mean ± SEM of MEP glial cell divisions per motor nerve (2.19 ± 0.18) between 48 and 72 hpf; n = 27 nerves in 12 larvae. (E) DMSO control and aphidicolin/hydroxyurea (HUA)-treated nkx2.2a:nls-egfp;foxd3:mcherry larvae showing nkx2.2a+/ foxd3+ MEP glia (outlined arrowheads) along motor nerve root axons at 72 hpf. (F) Mean ± SEM of MEP glia along motor nerve roots at 72 hpf indicating 2.82 ± 0.12 MEP glia in control larvae (n = 79 hemi-segments from 10 larvae), and 0.90 ± 0.04 MEP glia in aphidicolin/HUA treated larvae (n = 89 hemi-segments from 10 larvae; p<0.0001). (G) Lateral view of a foxd3:mcherry;sox2:egfp larvae at 55 hpf showing foxd3+/sox2+ MEP glia (white outlined arrowhead) and DRG (asterisk). (H) Singe z plane transverse section of a BLBP immunostaining in foxd3:mcherry;nkx2.2a:mcerulean larvae showing BLBP+/foxd3+/nkx2.2a+ MEP glia (outlined arrowheads) outside the spinal cord along the motor nerve root at 55 hpf. Asterisks denote the DRG and yellow dashed lines denote the edge of the spinal cord. Scale bar, (A) 25 µm, (E, H) 20 µm, (G) 10 µm.
-
Figure 5—source data 1
Source data for Figure 5 .
- https://cdn.elifesciences.org/articles/64267/elife-64267-fig5-data1-v2.xlsx
Figure 5—figure supplement 1
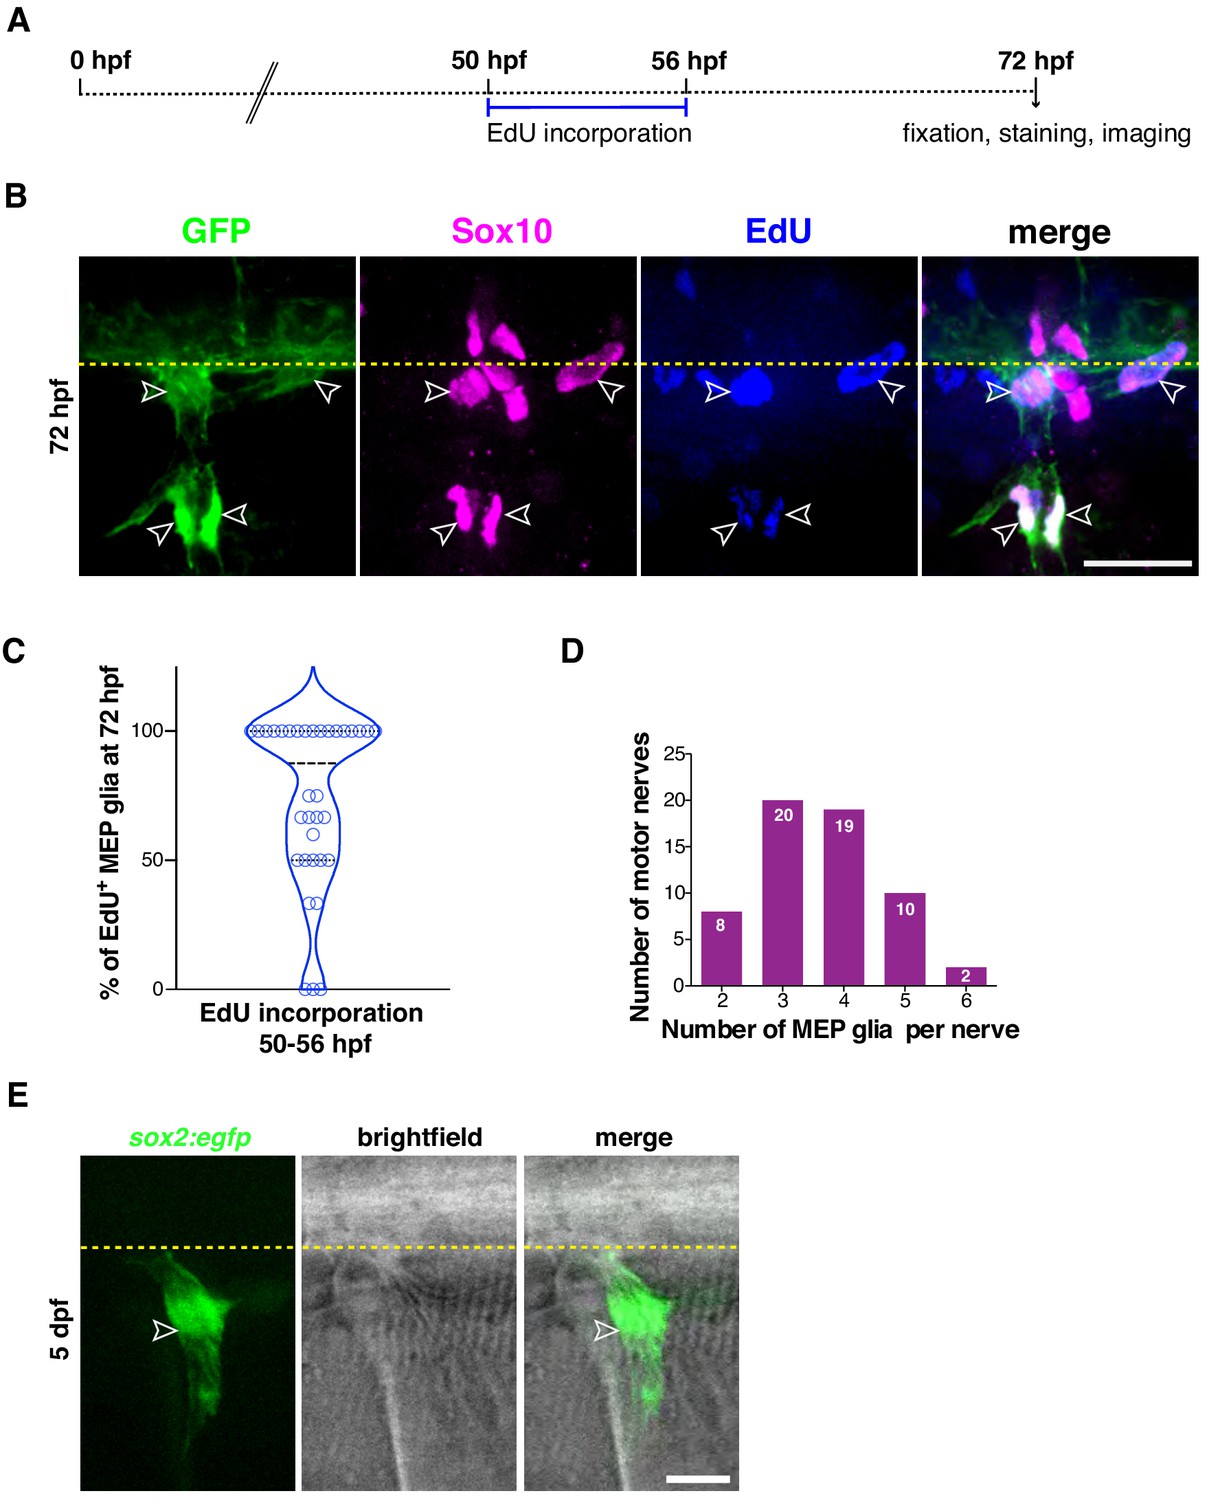
MEP glial proliferation.
(A) Experimental design for MEP glial EdU incorporation assay. (B) Lateral view of a nkx2.2a:nls-eGFP larva showing EdU+/GFP+/Sox10+ MEP glia at 72 hpf (outlined arrowheads). (C) Percentage of EdU+ MEP glia per motor nerve at 72 hpf; n = 89 MEP glia in 10 larvae. (D) Distribution of the number of MEP glia per motor nerve at 4 dpf; n = 214 MEP glia and. n = 60 motor nerves in 20 larvae. (E) Lateral view of a sox2:egfp larvae at 55 hpf showing sox2+ MEP glia (white outlined arrowhead). Yellow dashed lines denote the edge of the spinal cord. Scale bar, (B) 20 µm, (E) 10 µm.
-
Figure 5—figure supplement 1—source data 1
Source data for Figure 5—figure supplement 1 .
- https://cdn.elifesciences.org/articles/64267/elife-64267-fig5-figsupp1-data1-v2.xlsx
Figure 6 with 2 supplements

MEP glial development is axonal dependent.
(A) Lateral view of sox10:eos;nbt:dsred WT control and plexinA3-/- siblings at 3 dpf showing MEP glia along both motor nerve axons (outlined arrowheads) and ectopic motor nerve axons (arrowheads). Brackets denote ectopic motor exit points. (B) Lateral views of sox10:tagrfp;hb9:yfp-ntr larvae from 48 to 72 hpf, treated with either 2% DMSO or 20 mM metronidazole(MTZ)/2% DMSO from 9 to 72 hpf, showing sox10+ MEP glia (white outlined arrowheads) exit the spinal cord and migrate onto healthy motor axons in the control embryo. In the MTZ-treated larvae, MEP glia did not exit the spinal cord. Asterisks denote the DRG and yellow dashed lines denote the edge of the spinal cord. Scale bar, (A) 25 µm, (B) 20 µm.
Figure 6—figure supplement 1
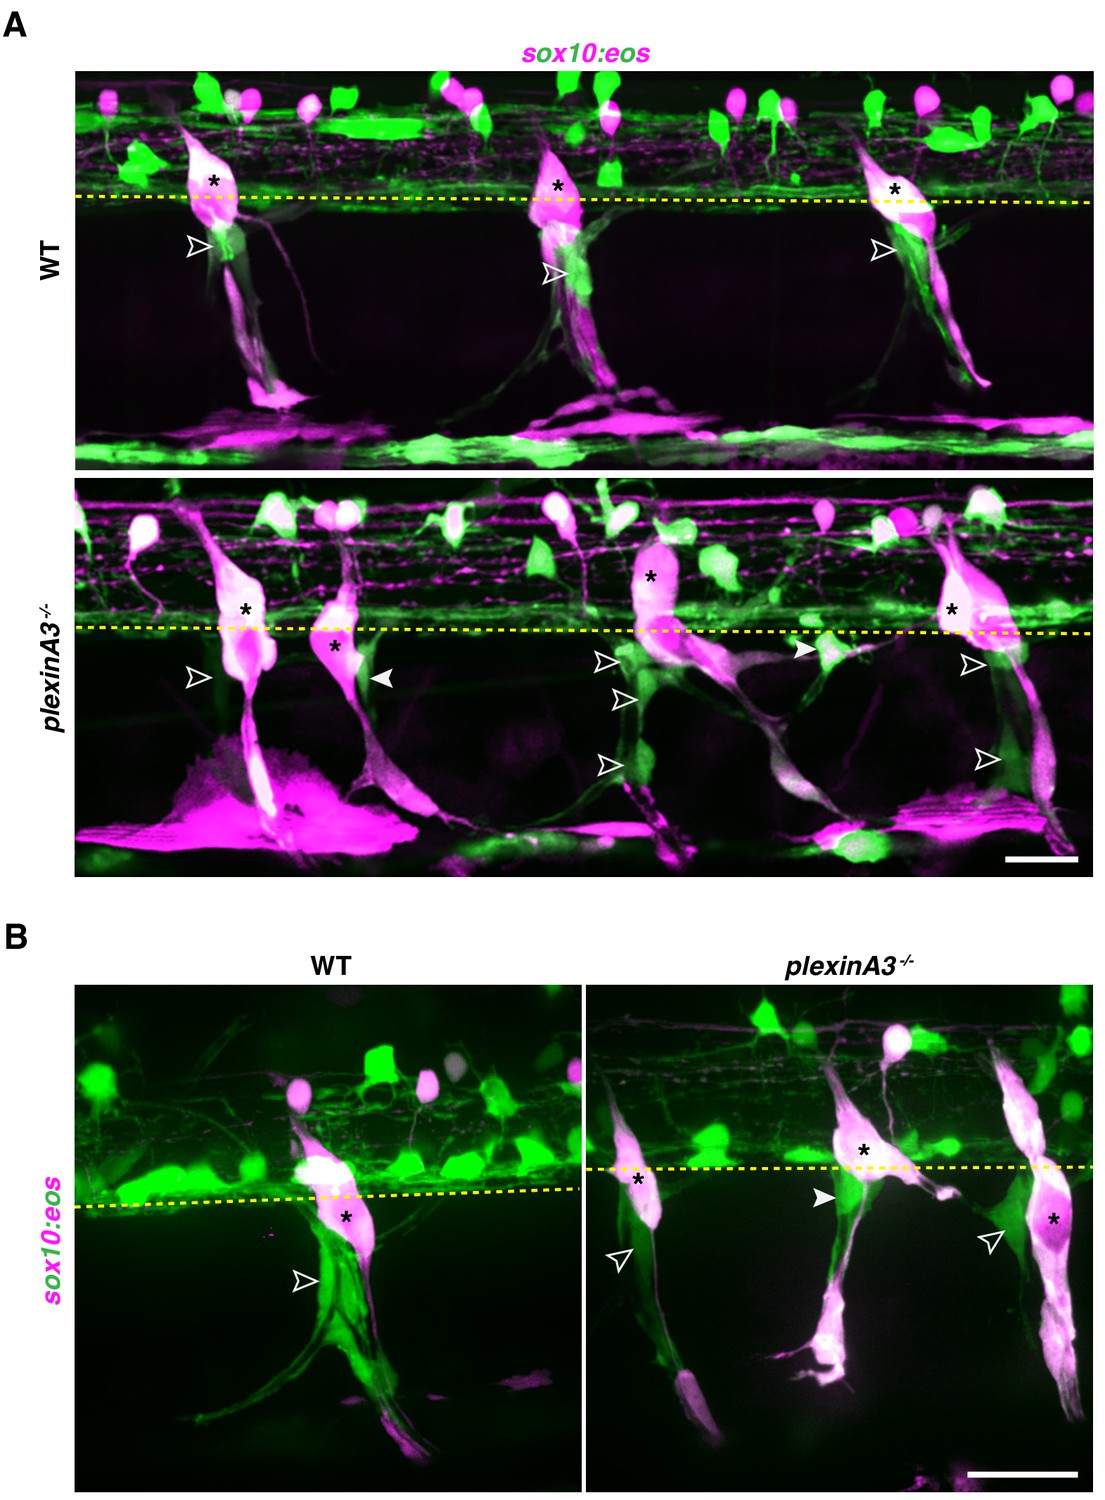
Ectopic motor axons are associated with ectopic MEP glia in plexinA3 mutant larvae.
(A) Lateral view of three somites of photoconverted sox10:eos;plexinA3 siblings at 72 hpf, showing green, unphotoconverted MEP glia along three motor nerves (white outlined arrowheads) in plexinA3+/+ and -/- larvae, and along ectopic motor nerves (white arrowheads) in plexinA3-/- larvae. (B) Lateral view of one somite of photoconverted sox10:eos;plexinA3 siblings showing green, unphotoconverted MEP glia along motor axons (white outlined arrowheads) and ectopic motor axons (white arrowhead), and red, photoconverted neural crest cells (shown in magenta) at 72 hpf. Yellow dashed lines denote the edge of the spinal cord and asterisks denote the DRG. Scale bar (A–B) 25 μm.
Figure 6—figure supplement 2
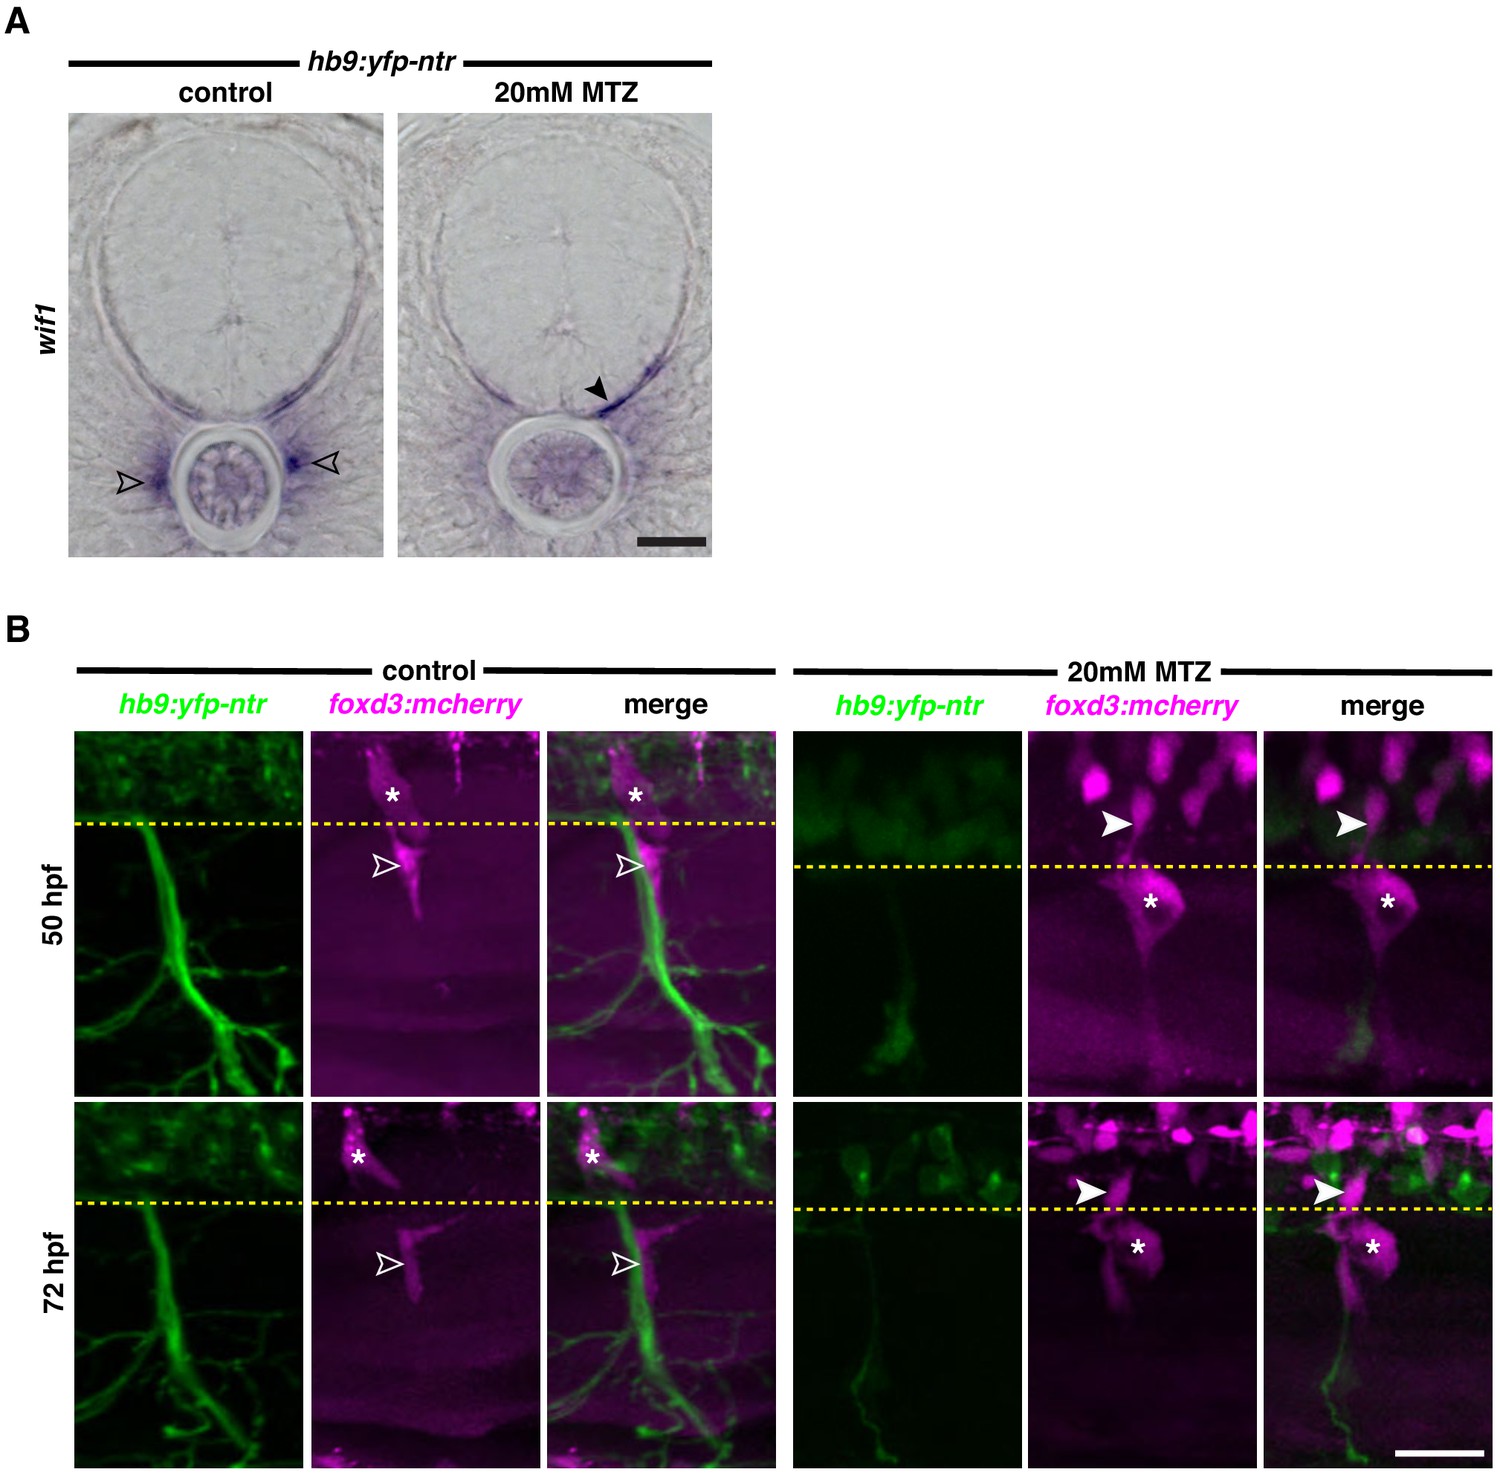
MEP glia do not exit the spinal cord in the absence of motor axons.
(A) In situ hybridization showing wif1+ MEP glia (outlined arrowheads) along the motor nerve root in a DMSO-treated hb9:yfp-ntr larva and wif1+ MEP glia (arrowheads) in the spinal cord of a MTZ-treated hb9:yfp-ntr larva at 3 dpf. (B) Lateral views of foxd3:mcherry;hb9:yfp-ntr larvae at 50 and 72 hpf, treated with either 2% DMSO or 20 mM metronidazole (MTZ)/2% DMSO from 9 to 72 hpf, showing foxd3+ MEP glia (outlined arrowheads) along motor axons in the control larvae. In the MTZ-treated larvae, foxd3+ MEP glia did not exit the spinal cord. Yellow dashed lines denote the edge of the spinal cord and asterisks denote the DRG. Scale bar, (A) 10 µm, (B) 20 µm.
Figure 7 with 1 supplement

Neuregulin 1 type III drives MEP glial directed migration.
(A) Motor exit point of sox10:eos WT and nrg1 -/- siblings photoconverted at 48 hpf and imaged at 3 dpf showing the presence of MEP glia (outlined arrowheads) and Schwann cells (SCs) (arrowhead) in a control larva and the presence of an oligodendrocyte membrane extension (pink arrowhead) in a nrg1 -/- larva that lacks MEP glia and SCs. Yellow dashed lines denote the edge of the spinal cord. (B) In situ hybridization showing wif1+ MEP glia along motor nerve root axons in a WT control larva (outlined arrowheads, n = 24 larvae) and the absence of wif1+ MEP glia along motor nerve root axons in a nrg1 mutant larva at 3 dpf (n = 16 larvae). Arrowheads indicate the presence of wif1+ cells near the lateral line nerve in a nrg1 mutant larva at 3 dpf. (C) In situ hybridization showing wif1+ MEP glia along motor nerve root axons in a WT control larva (outlined arrowheads, n = 20 larvae) and the absence of wif1+ MEP glia along motor nerve root axons in an erbb3b mutant larva at 3 dpf (n = 14 larvae). Arrowheads indicate the presence of wif1+ cells near the lateral line nerve in an erbb3b mutant larva at 3 dpf. Scale bar (A–C), 10 μm.
Figure 7—figure supplement 1
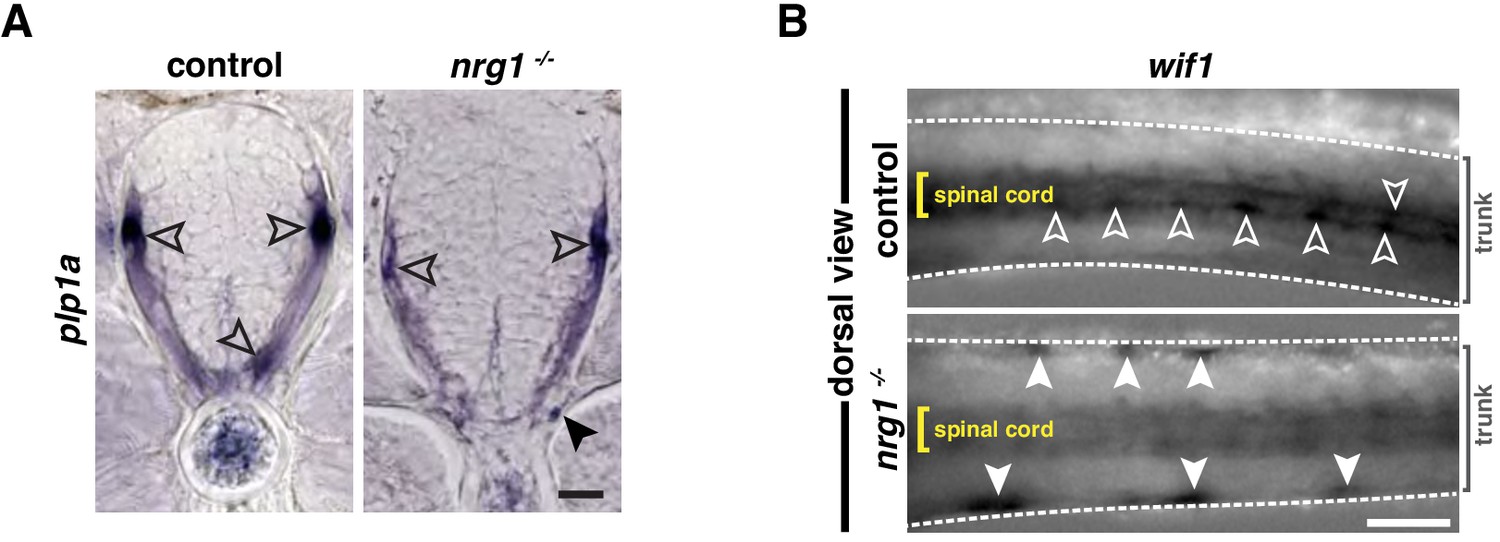
MEP glia are absent along the motor root in nrg1 mutant larvae.
(A) In situ hybridization showing plp1a+ oligodendrocytes in the spinal cord (outlined arrowheads) in nrg1+/+ larvae and in both the CNS (outlined arrowheads) and the PNS (arrowhead) in nrg1-/- larvae at 3 dpf. (B) Dorsal view of the zebrafish trunk showing wif1+ MEP glia in WT and nrg1-/- larvae at 3 dpf. wif1+ MEP glia are located at the edge of the spinal cord (white outlined arrowheads) in WT larvae while their location is lateral (white arrowheads), close to the skin, in nrg1-/- larvae. Yellow brackets denote the width of the spinal cord. White dashed lines denote the trunk. Scale bar, (A) 10 µm, (B) 250 µm.
Figure 8 with 2 supplements
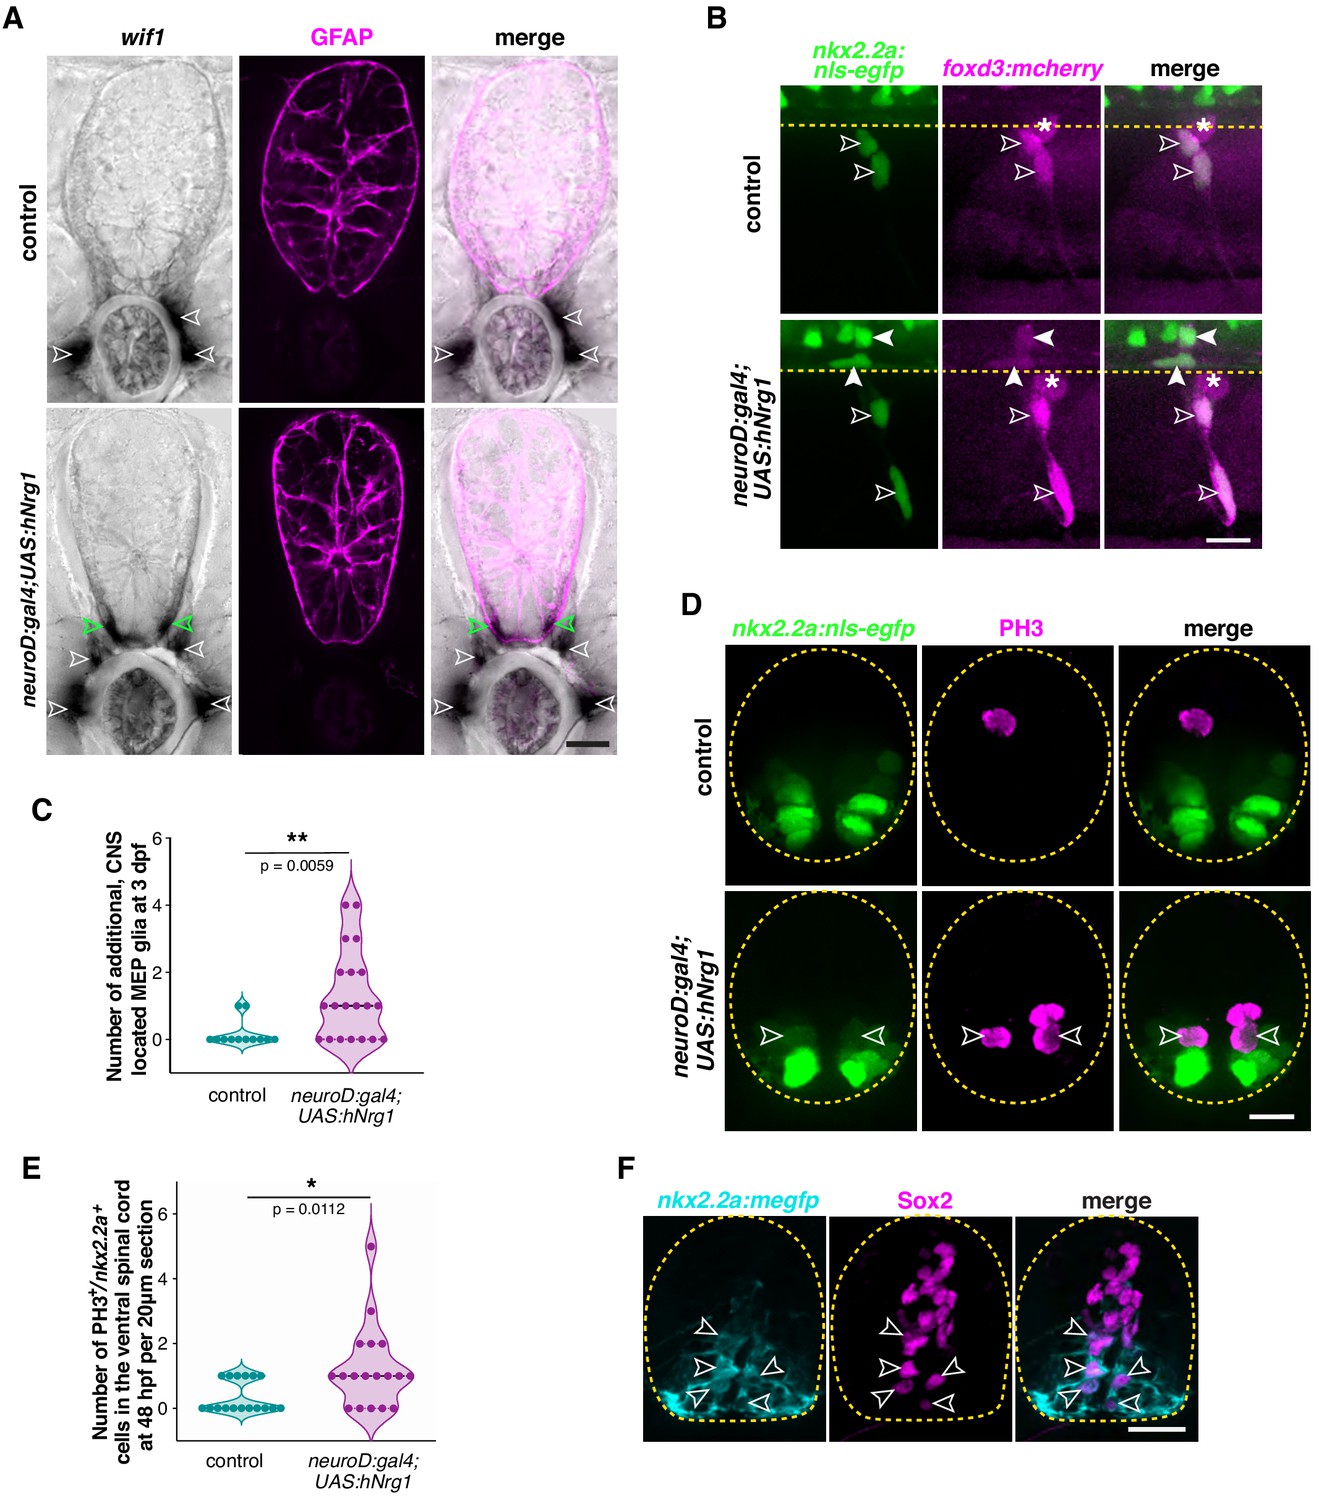
Neuregulin 1 type III drives MEP glial development.
(A) In situ hybridization showing wif1+ MEP glia (white outlined arrowheads) along motor nerve roots in WT larvae (n = 30 larvae) at 3 dpf and both inside (green outlined arrowheads) and outside (white outlined arrowheads) the spinal cord in neuroD:gal4;UAS:hNrg1 larvae (n = 30 larvae). Zrf1 immunostaining shows GFAP+ radial glia and denotes the outline of the spinal cord. (B) Lateral view of 3 dpf nkx2.2a:nls-egfp;foxd3:mcherry control and neuroD:gal4;UAS:hNrg1 larvae showing nkx2.2a+/foxd3+ MEP glia (outlined arrowheads) along motor nerve root axons. MEP glia are found in both the PNS (outlined arrowheads) and in the ventral spinal cord (arrowheads) in neuroD:gal4;UAS:hNrg1 larvae. Asterisks denote the DRG. (C) Mean ± SEM of additional, centrally located MEP glia per hemi-segment in control (0.17 ± 0.11; n = 12 larvae) and neuroD:gal4;UAS:hNrg1 larvae (1.3 ± 0.3; n = 20 larvae) at 3 dpf. (D) PH3 immunostaining on spinal cord transverse sections in neuroD:gal4;nkx2.2a:nls-egfp control larvae and neuroD:gal4;UAS:hNrg1;nkx2.2a:nls-egfp larvae showing PH3+/nkx2.2a+ proliferating radial glia (outline arrowheads). (E) Mean ± SEM of PH3+/nkx2.2a+ cells in the ventral spinal cord per 20 µm section in neuroD:gal4 (0.35 ± 0.12; n = 17 sections from four embryos) and neuroD:gal4;UAS:hNrg1 larvae (1.22 ± 0.3; n = 18 sections from four embryos). (F) Transverse section of a nkx2.2a:megfp larva at 4 dpf showing Sox2+/nkx2.2a+ radial glial precursors. Yellow dashed lines denote the edge of the spinal cord. Scale bar (A,B,D,F), 10 µm.
-
Figure 8—source data 1
Source data for Figure 8 .
- https://cdn.elifesciences.org/articles/64267/elife-64267-fig8-data1-v2.xlsx
Figure 8—figure supplement 1
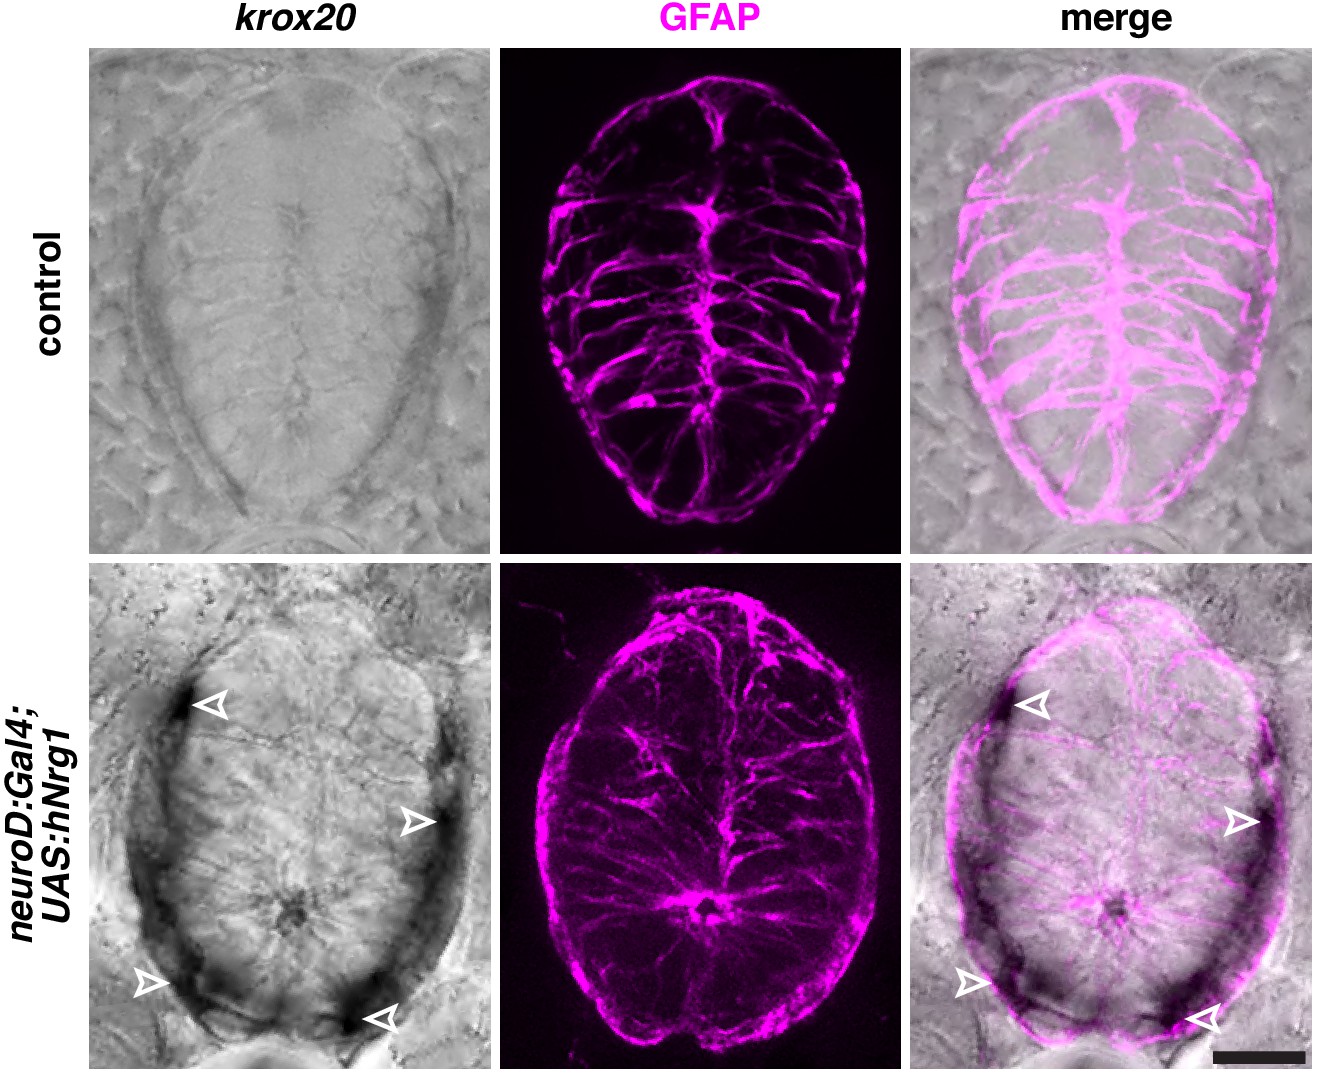
In situ hybridization showing the absence of Schwann cells in the spinal cord of a control sibling (n = 20 larvae), and the presence of krox20+ Schwann cells (white outlined arrowheads) in the ventral and dorsal spinal cord in a neuroD:gal4;UAS:hNrg1 larva at 4 dpf (n = 20 larvae).
Zrf1 immunostaining shows GFAP+ radial glia and denotes the outline of the spinal cord. Scale bar, 10 µm.
Figure 8—figure supplement 2
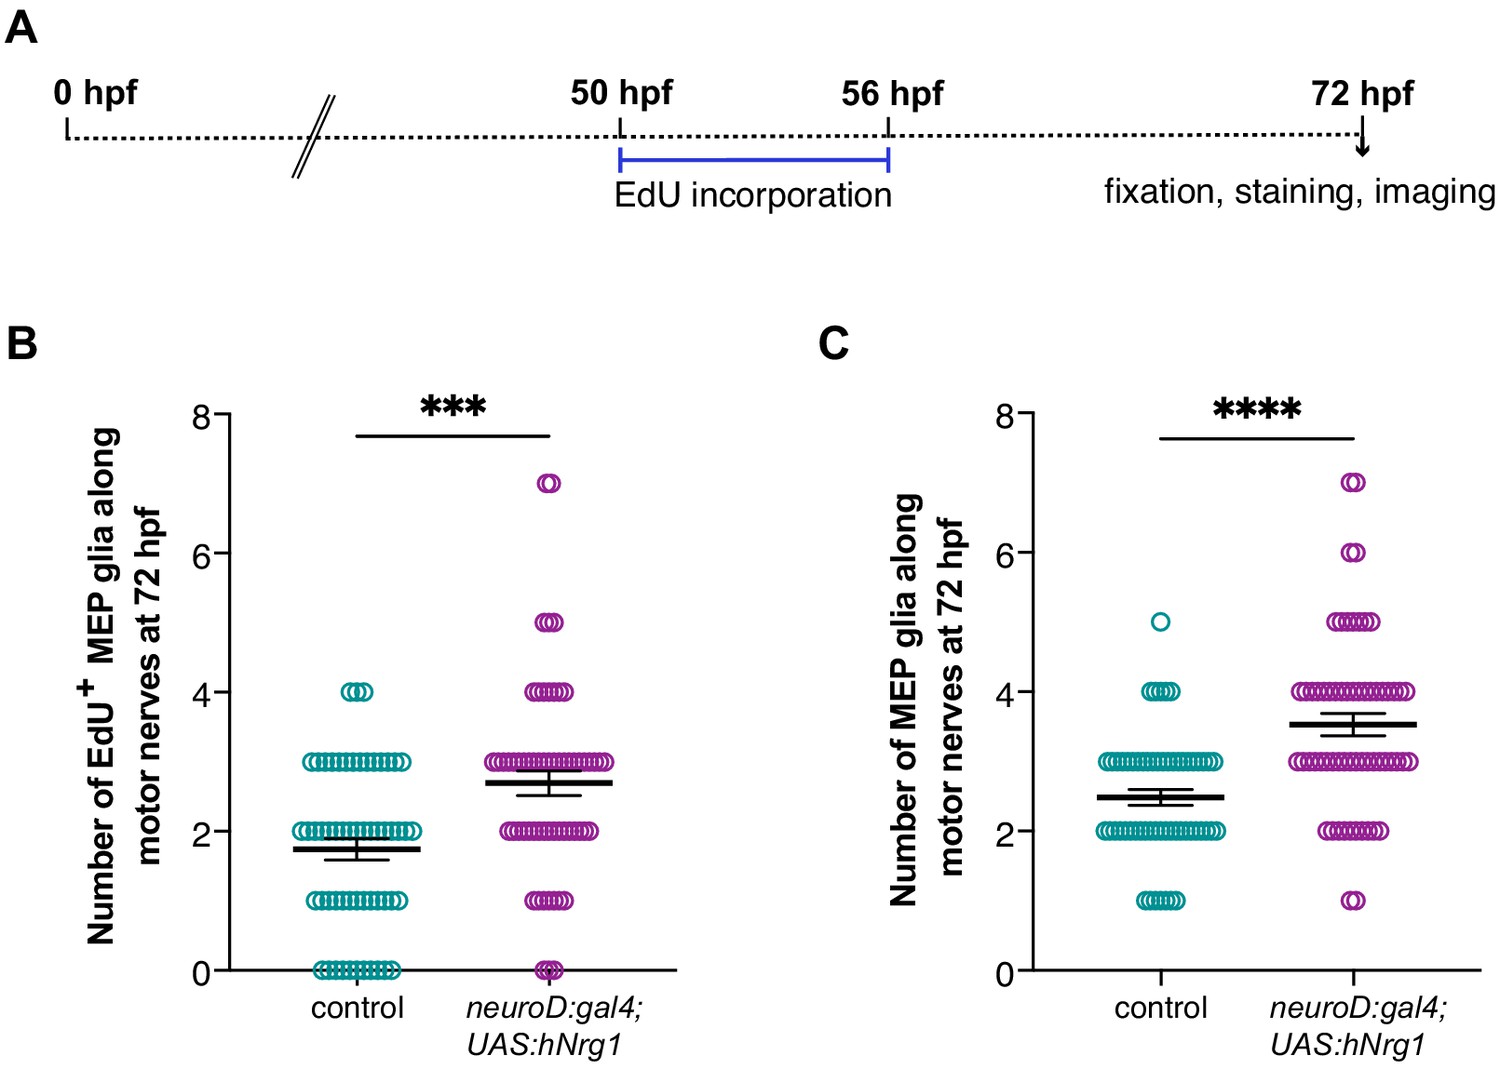
EdU proliferation assay.
(A) Experimental design for MEP glial EdU incorporation assay. (B) Mean ± SEM of number of EdU+ MEP glia per motor nerve in control (1.74 ± 0.15) and neuroD:gal4;UAS:hNrg1 (2.70 ± 0.18) larvae at 72 hpf (p=0.0002). (C) Mean ± SEM of total number of MEP glia per motor nerve in control (2.48 ± 0.12) and neuroD:gal4;UAS:hNrg1 (3.53 ± 0.16) larvae at 72 hpf (p<0.0001). (B– C) n = 58 nerves in 10 control larvae and n = 62 nerves in 12 neuroD:gal4;UAS:hNrg1 larvae.
-
Figure 8—figure supplement 2—source data 1
Source data for Figure 8—figure supplement 2 .
- https://cdn.elifesciences.org/articles/64267/elife-64267-fig8-figsupp2-data1-v2.xlsx
Author response image 1
Author response image 2
Videos
Video 1
foxd3+ MEP glia (arrow) exit the spinal cord and migrate onto olig2+ motor axons in foxd3:mcherry;olig2:egfp;foxd3+/- larvae between 48 and 72 hpf.
Images were taken every 15 min and the movie runs at 10 frames per second (fps).
Video 2
foxd3+ MEP glia are stalled in the spinal cord (arrow) in foxd3:mcherry;olig2:egfp;foxd3-/- larvae imaged between 48 and 72 hpf.
Images were taken every 15 min and the movie runs at 10 fps.
Video 3
A single nkx2.2a+/foxd3+ MEP glia (arrow) has exited the spinal cord and divides in the PNS in control foxd3:mcherry;nkx2.2a:megfp;nkx2.2a:nls-egfp embryos.
Video on the right is the merge of GFP and mCherry channels. Images were taken every 15 min from 48 to 72 hpf and the movie runs at 10 fps.
Video 4
An additional nkx2.2a+/foxd3+ MEP glia (arrow) exits the spinal cord in foxd3 mRNA-injected foxd3:mcherry;nkx2.2a:megfp;nkx2.2a:nls-egfp embryos.
Video on the right is the merge of GFP and mCherry channels. Images were taken every 15 min from 50 to 72 hpf and the movie runs at 10 fps.
Video 5
One foxd3+/nkx2.2a+ MEP glial progenitor delaminates from the lateral floor plate, exits the spinal cord, and divides to give rise to several MEP glia along the motor nerve in a foxd3:mcherry;nkx2.2a:megfp control embryo.
Images were taken every 10 min from 48 to 72 hpf and the movie runs at 10 fps.
Video 6
One foxd3+/nkx2.2a+ MEP glial progenitor delaminates from the lateral floor plate and stalls at the MEP in the spinal cord in a foxd3:mcherry;nkx2.2a:megfp embryo treated with GM6001 from 36 to 72 hpf.
Images were taken every 10 min from 48 to 72 hpf and the movie runs at 10 fps.
Video 7
One nkx2.2a+/foxd3+ MEP glial progenitor exits the spinal cord at the MEP transition zone and undergoes cell division in the PNS to generate several MEP glia in a nkx2.2a:nls-egfp/foxd3:mcherry embryo.
Images were taken every 15 min from 50 to 72 hpf and the movie runs at 10 fps.
Tables
Key resources table
| Reagent type (species) or resource | Designation | Source or reference | Identifiers | Additional information |
|---|---|---|---|---|
| Strain (Danio rerio) | AB* | ZIRC | RRID:ZFIN_ZDB-GENO-960809-7 | |
| Genetic reagent (Danio rerio) | Tg(nkx2.2a(3.5):Cre; cmlc2:eGFP)uva42 | This paper | ||
| Genetic reagent (Danio rerio) | Tg(nkx2.2a(3.5): mCerulean3)uva41 | This paper | ||
| Genetic reagent (Danio rerio) | Tg(nkx2.2a(3.5):nls-eGFP)uva1 | This paper | ||
| Genetic reagent (Danio rerio) | Tg(mbp: eGFP-CAAX)ue2 | Almeida et al., 2011 | RRID:ZFIN_ZDB-ALT-120103-2 | |
| Genetic reagent (Danio rerio) | Gt(foxd3: mcherry)ct110R | Hochgreb-Hägele and Bronner, 2013 | RRID:ZFIN_ZDB-ALT-130314-2 | |
| Genetic reagent (Danio rerio) | Tg(XlTubb: DsRed) zf148 | Peri and Nüsslein-Volhard, 2008 | RRID:ZFIN_ZDB-ALT-081027-2 | |
| Genetic reagent (Danio rerio) | Tg(neuroD1:Gal4; cmlc2:eGFP)uva22 | Fontenas et al., 2019 | RRID:ZFIN_ZDB-ALT-191209-8 | |
| Genetic reagent (Danio rerio) | Tg(nkx2.2a(3.5): nls-mCherry)uva2 | Zhu et al., 2019 | RRID:ZFIN_ZDB-ALT-200513-2 | |
| Genetic reagent (Danio rerio) | Tg(olig2:eGFP)vu12 | Shin et al., 2003 | RRID:ZFIN_ZDB-ALT-041129-8 | |
| Genetic reagent (Danio rerio) | Tg(olig2: DsRed2)vu19 | Shin et al., 2003 | RRID:ZFIN_ZDB-FISH-150901–8168 | |
| Genetic reagent (Danio rerio) | Tg(sox10(4.9):Eos)w9 | McGraw et al., 2012 | RRID:ZFIN_ZDB-ALT-110721-1 | |
| Genetic reagent (Danio rerio) | Tg(sox10(4.9): nls-Eos)w18 | McGraw et al., 2012 | RRID:ZFIN_ZDB-ALT-110721-2 | |
| Genetic reagent (Danio rerio) | Tg(sox10(4.9): TagRFP)uva5 | Zhu et al., 2019 | RRID:ZFIN_ZDB-ALT-200513–7 | |
| Genetic reagent (Danio rerio) | Tg(sox10(7.2): mRFP)vu234 | Kucenas et al., 2008b | RRID:ZFIN_ZDB-ALT-080321–3 | |
| Genetic reagent (Danio rerio) | Tg(UAS:hNrg1 type III)st85 | Perlin et al., 2011 | RRID:ZFIN_ZDB-ALT-120221–8 | |
| Genetic reagent (Danio rerio) | Tg(ubi: Zebrabow-M)a131 | Pan et al., 2013 | RRID:ZFIN_ZDB-ALT-130816–2 | |
| Genetic reagent (Danio rerio) | Tg(2xNRSE-2xMnx1- Mmu.Fos:KalTA4,5xUAS- ADV.E1b:GAP-YFP-2A-Eco. NfsBT41Q/ N71S/F124T)lmc008 | Mathias et al., 2014 | RRID:ZFIN_ZDB-ALT-151021–5 | |
| Genetic reagent (Danio rerio) | Tg(sox2(2.9): eGFP)uva55 | This paper | ||
| Genetic reagent (Danio rerio) | neuregulin1z26 | Perlin et al., 2011 | RRID:ZFIN_ZDB-ALT-120308–1 | |
| Genetic reagent (Danio rerio) | plexinA3 p13umal | Palaisa and Granato, 2007 | RRID:ZFIN_ZDB-ALT-071126–1 | |
| Genetic reagent (Danio rerio) | erbb3bst48 | Lyons et al., 2005 | RRID:ZFIN_ZDB-ALT-050512–6 | |
| Recombinant DNA reagent | p5E-nkx2.2a(−3.5) | Pauls et al., 2007 | N/A | |
| Recombinant DNA reagent | pME-mcerulean3 | Zhu et al., 2019 | N/A | |
| Recombinant DNA reagent | p5E-sox2(−2.9) | This paper | ||
| Recombinant DNA reagent | pME-nls-eGFP | Kwan et al., 2007 | N/A | |
| Recombinant DNA reagent | p3E-polyA | Kwan et al., 2007 | N/A | |
| Recombinant DNA reagent | pDestTol2CG2 | Kwan et al., 2007 | N/A | |
| Recombinant DNA reagent | pME-cre | This paper | ||
| Recombinant DNA reagent | Human adamts3 | Genomics-online | Cat. #ABIN3996515 | |
| Commercial assay or kit | pENTR 5´-TOPO cloning kit | Invitrogen | Cat. #K59120 | |
| Commercial assay or kit | LR clonase II plus | Invitrogen | Cat. #12538–120 | |
| Commercial assay or kit | Click-it EdU Cell proliferation kit for imaging. Alexa Fluor 647 dye | Invitrogen | Cat. #C11340 | |
| Commercial assay or kit | mMESSAGE mMACHINE sp6 transcription kit | Fisher | Cat. #AM1340 | |
| Chemical compound, drug | DAPI fluoromount-G | Southern Biotech | Cat. #0100–20 | |
| Chemical compound, drug | DIG RNA labeling mix | Roche | Cat. #11277073910 | |
| Chemical compound, drug | metronidazole | Sigma | Cat#M1547; CAS#443-48-1 | 20 mM |
| Chemical compound, drug | GM6001 | Enzo Life Sciences | Cat. #BML-EI300-0001; CAS# 142880-36-2 | 100 μM |
| Chemical compound, drug | aphidicolin | Sigma | Cat. #A0781; CAS# 38966-21-1 | 150 μM |
| Chemical compound, drug | hydroxyurea | Sigma | Cat. #H8627; CAS#127-07-1 | 20 mM |
| Antibody | Mouse anti-GFAP | ZIRC | Cat. #Zrf1 ; RRID:AB_10013806 | 1 :1000 |
| Antibody | Anti-digoxigenin-AP, Fab fragments from sheep | Sigma | Cat#11093274910; RRID:AB_514497 | 1:5000 |
| Antibody | Rabbit anti-sox10 | Binari et al., 2013 | N/A | 1 :5000 |
| Antibody | chicken anti-GFP | Abcam | Cat. #ab13970; RRID:AB_300798 | 1 :500 |
| Antibody | Alexa Fluor 488 goat anti-chicken | ThermoFisher | Cat. #A-11039; RRID:AB_2534096 | 1:1000 |
| Antibody | Alexa Fluor 647 goat anti-rabbit IgG(H+L) | ThermoFisher | Cat. #A-21244; RRID:AB_2535812 | 1:1000 |
| Antibody | Rabbit anti-BLBP | Sigma | Cat. #ABN14; RRID:AB_10000325 | 1:1000 |
| Antibody | Rabbit anti-PH3 | Millipore | Cat. #06–570; RRID:AB_310177 | 1:2000 |
| Antibody | Rabbit anti-sox2 | Abcam | Cat. #ab97959; RRID:AB_2341193 | 1:500 |
| Antibody | Alexa Fluor 647 goat anti-mouse IgG(H+L) | ThermoFisher | Cat. #A-21235; RRID:AB_2535804 | 1:1000 |
| Sequence-based reagent | Cre-F | This paper | PCR primers | 5’-ATGTCCAATCTTCTAACCGT-3’ |
| Sequence-based reagent | Cre-R | This paper | PCR primers | 5’-TTAGTCTCCATCCTCCAGCA-3’ |
| Sequence-based reagent | Foxd3-F | This paper | PCR primers | 5’-CAGGGATCCATGA CCCTGTCTGGAGGCA-3’ |
| Sequence-based reagent | Foxd3-R | This paper | PCR primers | 5’-GAACTCGAGTCATTGA GAAGGCCATTTCGATA-3’ |
| Sequence-based reagent | Sox2-F | This paper | PCR primers | 5’-GTGAGTAACTTTT GGGTGTGCGG-3’ |
| Sequence-based reagent | Sox2-R | This paper | PCR primers | 5’-TTAAACCGATTTTC TCGAAAGTCTAC-3’ |
| Sequence-based reagent | Mmp17b-F | This paper | PCR primers | 5’-GGGAAGTGCTG TGGATGTTT-3’ |
| Sequence-based reagent | Mmp17b-R | This paper | PCR primers | 5’-TAATACGACTCACTATAGATG AAACTCGAGCAGTGTTGG-3’ |
| Sequence-based reagent | Adamts3-F | This paper | PCR primers | 5’-TCCTGGGGCT AGACATGTGA-3’ |
| Sequence-based reagent | Adamts3-R | This paper | PCR primers | 5’-TAATACGACTCACTATAGAGC GCACAGTACGGATTTGA-3’ |
| Software | ImageJ/Fiji | ImageJ.nih.gov | RRID:SCR_003070 | |
| Software | Prism 9 | GraphPad softwares | RRID:SCR_002798 | |
| Software | Metamorph | Molecular Devices | RRID:SCR_002368 | |
| Software | Imaris 9.6 | Oxford Instruments | RRID:SCR_007370 | |
| Software | RStudio | RStudio | RRID:SCR_000432 |
Table 1
Strains and transgenic lines.
Picture description: Cross section of the spinal cord showing Sox2+ neural precursors (magenta), nkx2.2a+ precursors (cyan) and Sox10+ glia (yellow) at 4 days post-fertilization.
| Full name | abbreviation | Reference |
|---|---|---|
| Tg(mbp:eGFP-CAAX)ue2 | mbp:egfp-caax | Almeida et al., 2011 |
| Gt(foxd3:mcherry)ct110R | foxd3:mcherry | Hochgreb-Hägele and Bronner, 2013 |
| Tg(XlTubb:DsRed) zf148 | nbt:dsred | Peri and Nüsslein-Volhard, 2008 |
| Tg(neuroD1:Gal4; cmlc2:eGFP)uva22 | neuroD:Gal4 | Fontenas et al., 2019 |
| Tg(nkx2.2a:meGFP)vu17 | nkx2.2a:megfp | Kucenas et al., 2008b |
| Tg(nkx2.2a(3.5):Cre; cmlc2:eGFP)uva42 | nkx2.2a:cre | This paper |
| Tg(nkx2.2a(3.5):mCerulean3)uva41 | nkx2.2a:mcerulean | This paper |
| Tg(nkx2.2a(3.5):nls-eGFP)uva1 | nkx2.2a:nls-egfp | This paper |
| Tg(nkx2.2a(3.5):nls-mCherry)uva2 | nkx2.2a:nls-mcherry | Zhu et al., 2019 |
| Tg(olig2:eGFP)vu12 | olig2:egfp | Shin et al., 2003 |
| Tg(olig2:DsRed2)vu19 | olig2:dsred | Shin et al., 2003 |
| Tg(sox10(4.9):Eos)w9 | sox10:eos | McGraw et al., 2012 |
| Tg(sox10(4.9):nls-Eos)w18 | sox10:nls-eos | McGraw et al., 2012 |
| Tg(sox10(4.9):TagRFP)uva5 | sox10:tagrfp | Zhu et al., 2019 |
| Tg(sox10(7.2):mRFP)vu234 | sox10:mrfp | Kucenas et al., 2008b |
| Tg(UAS:hNrg1 type III) | UAS:hNrg1 | Perlin et al., 2011 |
| Tg(ubi:Zebrabow-M)a131 | ubi:zebrabow | Pan et al., 2013 |
| Tg(2xNRSE-2xMnx1-Mmu.Fos:KalTA4,5xUAS-ADV.E1b:GAP-YFP-2A-Eco.NfsBT41Q/N71S/F124T)lmc008 | hb9:yfp-ntr | Mathias et al., 2014 |
| Tg(sox2(2.9):eGFP)uva55 | sox2:egfp | This paper |
| AB* | wildtype | |
| neuregulin1z26 | nrg1 | Perlin et al., 2011 |
| plexinA3 p13umal (sidetracked) | plexinA3 | Palaisa and Granato, 2007 |
| erbb3bst48 | erbb3b | Lyons et al., 2005 |
Additional files
Download links
A two-part list of links to download the article, or parts of the article, in various formats.
Downloads (link to download the article as PDF)
Open citations (links to open the citations from this article in various online reference manager services)
Cite this article (links to download the citations from this article in formats compatible with various reference manager tools)
Spinal cord precursors utilize neural crest cell mechanisms to generate hybrid peripheral myelinating glia
eLife 10:e64267.
https://doi.org/10.7554/eLife.64267


