High-resolution mapping of the neutralizing and binding specificities of polyclonal sera post-HIV Env trimer vaccination
- Basic Sciences Division and Computational Biology Program, Fred Hutchinson Cancer Research Center, United States
- Department of Integrative Structural and Computational Biology, The Scripps Research Institute, United States
- Department of Microbiology and Immunology, Weill Cornell Medical College, United States
- Human Biology Division, Fred Hutchinson Cancer Research Center, United States
- Howard Hughes Medical Institute, United States
Figures
Figure 1 with 1 supplement
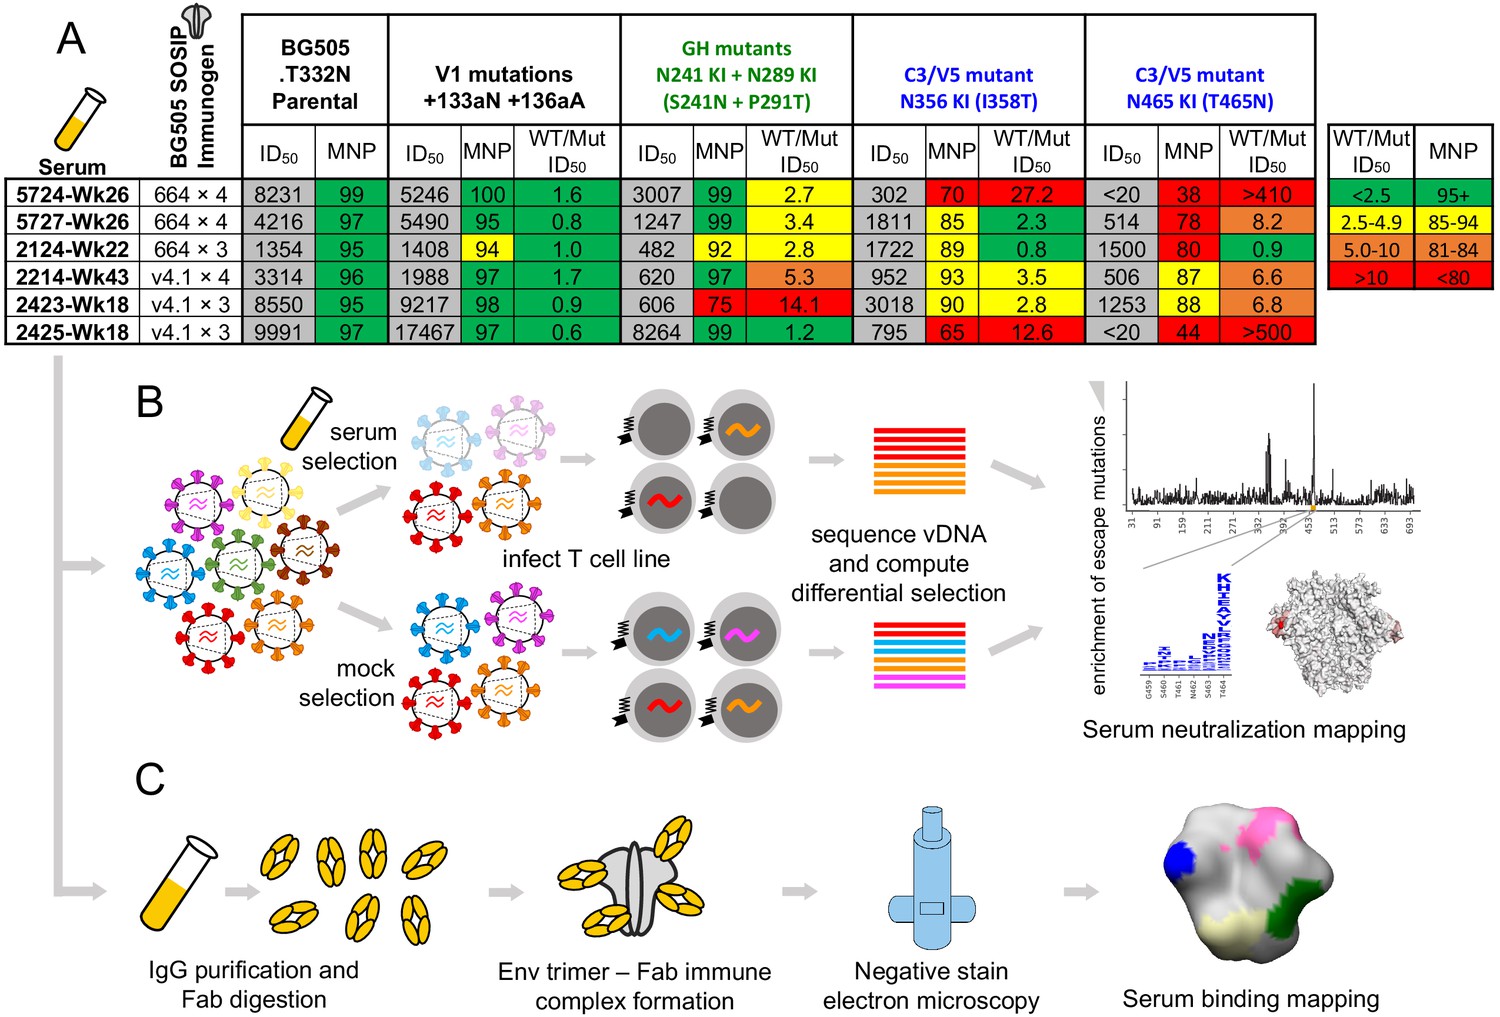
Overview of sera and epitope mapping approaches.
(A) Preliminary point-mutant mapping of the BG505-trimer-vaccinated sera panel. The sera dilution that inhibits 50% of virus entry (ID50), maximum neutralization percentage plateau (MNP), and fold change in ID50 values of wild type relative to mutant pseudoviruses (WT/Mut ID50) are shown for the parental BG505.T332N and pseudoviruses bearing insertion (V1 epitope) and glycan knock in mutation(s) (GH and C3/V5 epitopes). The weeks (Wk) post-initial vaccination of the serum sample is specified in each sera’s name; sera are subsequently referred to by only their four-digit ID number. (B) Experimental schematic of mutational antigenic profiling. (C) Experimental schematic of EMPEM.
Figure 1—figure supplement 1
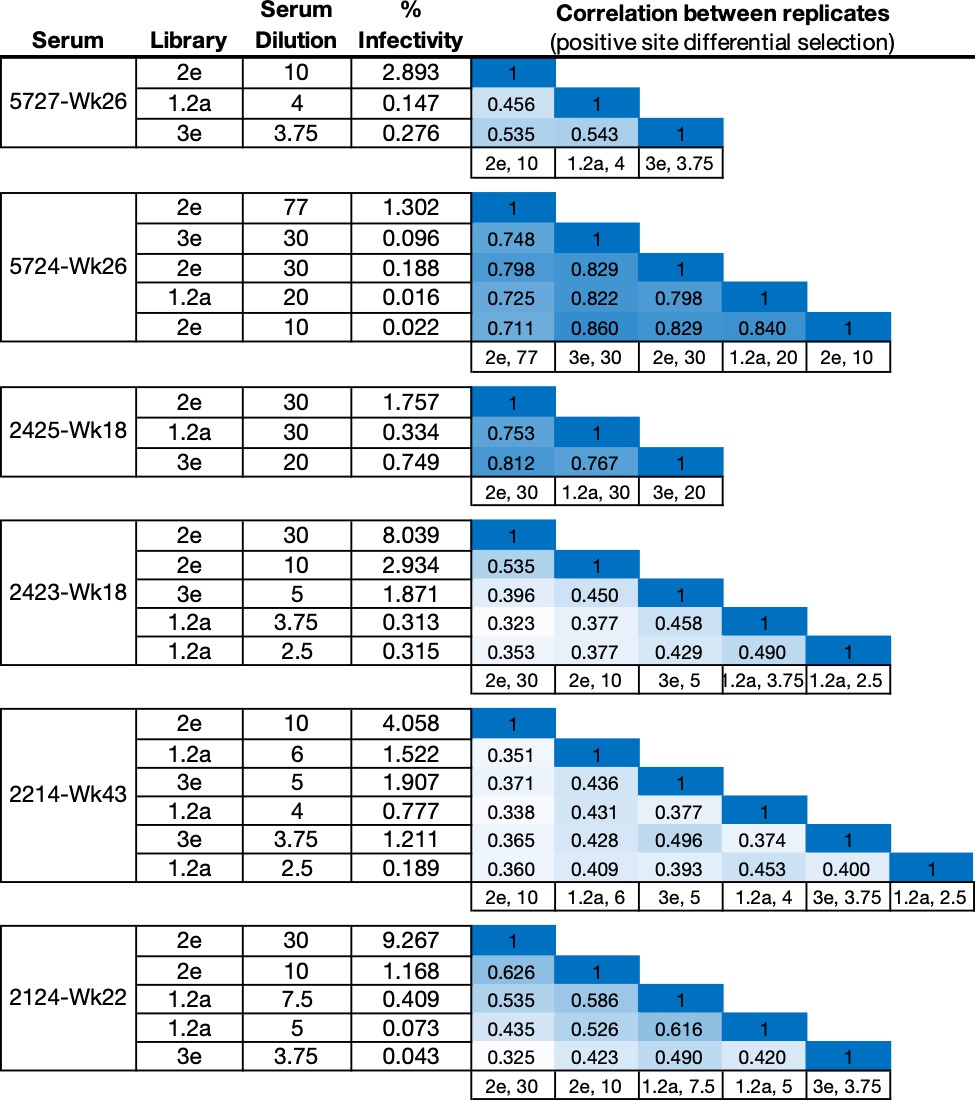
Experimental details for all mutational antigenic profiling experiments.
The Library is the stock of independently passaged mutant virus library used in each experiment. The percentage of the mutant virus library that successfully entered cells after serum selection (% Infectivity) was measured using qPCR standard curves. The correlation matrix shows the Pearson’s r correlation coefficient of the positive site differential selection values between replicates.
Figure 2 with 7 supplements
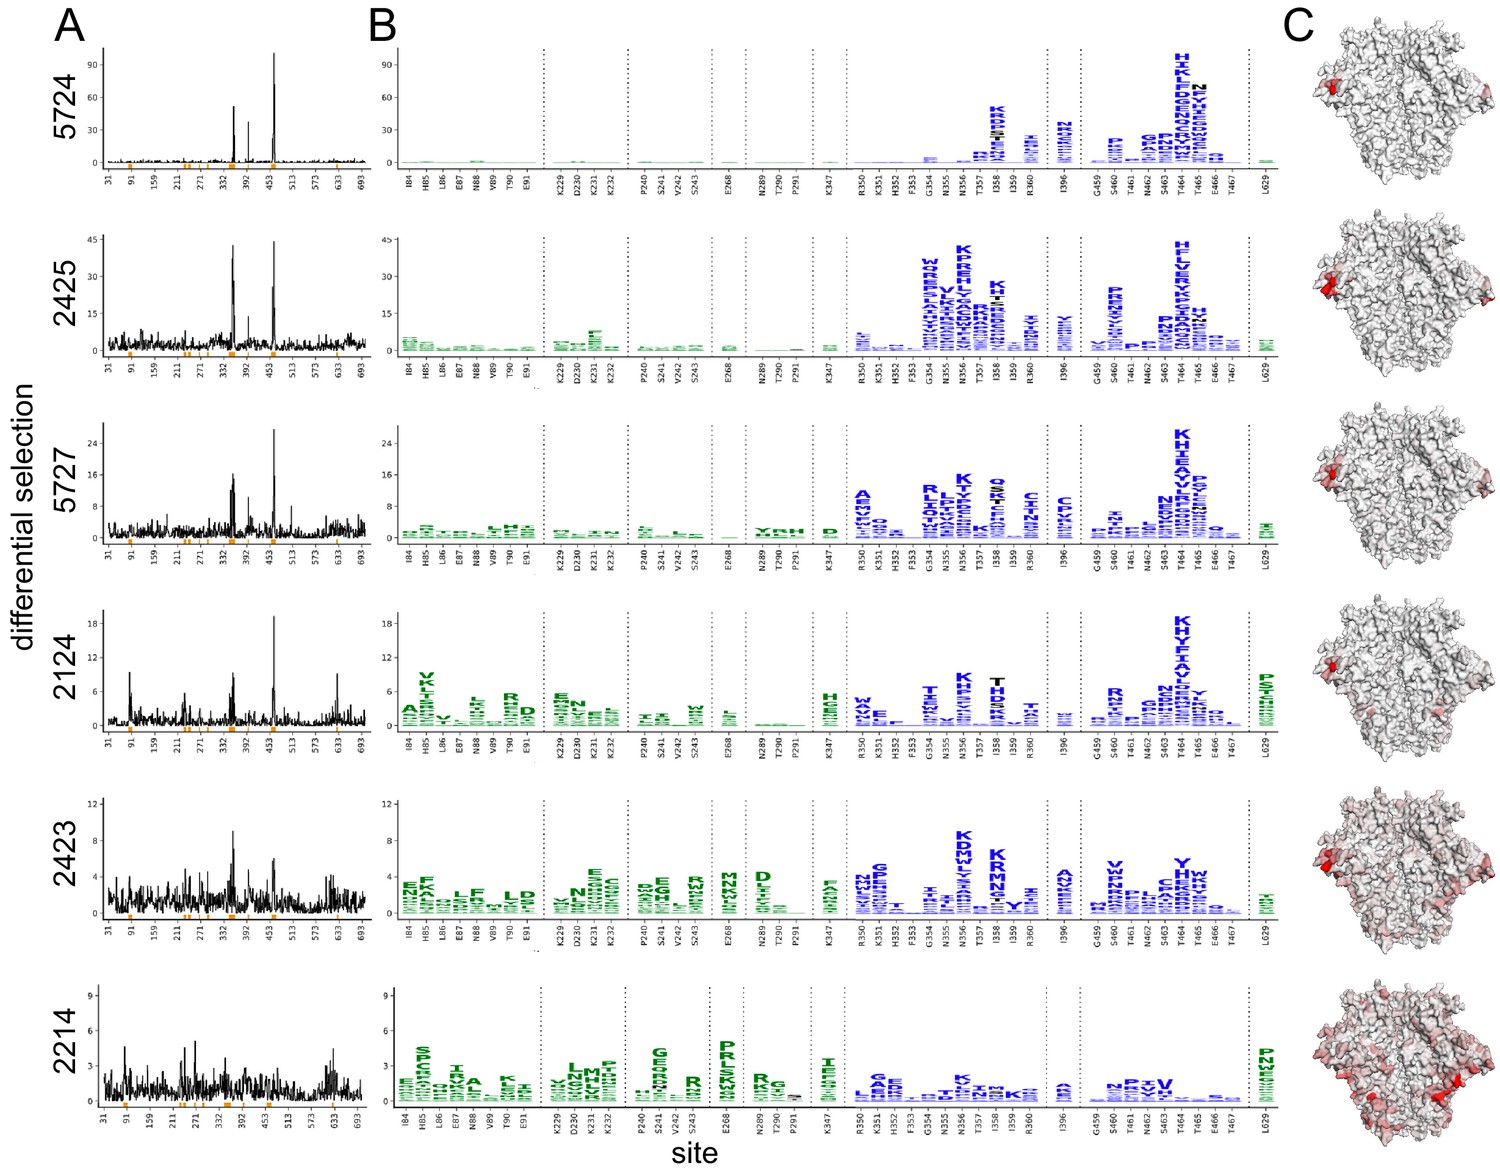
Serum neutralization-escape mutations mapped by mutational antigenic profiling.
(A) Line plots showing the positive site differential selection for each serum across the Env ectodomain. Differential selection is a measure of the enrichment of mutations in the sera-selected conditions relative to a no-sera control (see Materials and methods for details). (B) Differential selection for each mutation at key sites (indicated with orange underlines in (A)). The height of each letter is proportional to the differential selection for that amino-acid mutation. The GH epitope is colored green, and the C3/V5 epitope is colored blue. Mutations tested during preliminary point-mutant mapping are colored black (Figure 1A; all mutations that add a tested glycan are indicated). For both (A) and (B), the y-axis is scaled to the maximal effect size site for each sera; sera without a single dominant region of escape (2243 and 2214) are plotted such that 90% of the site-level signal is at <20% of the y-axis maximum. (C) The positive site differential selection is mapped onto the BG505 trimer (PDB: 5FYL). The color scheme is right censored at 15 to visualize subdominant responses; for samples with a maximum selection less than 15, the maximum value is mapped to most red color. An interactive version of these visualizations is at https://jbloomlab.github.io/Vacc_Rabbit_Sera_MAP/. Raw numerical values and logo plots for the entire Env ectodomain are in Figure 2—source data 1.
-
Figure 2—source data 1
Zip file containing csv files with all median site- and mutation-level differential selection values, as well as logo plots plotting escape profiles for the entire mutagenized portion of env.
- https://cdn.elifesciences.org/articles/64281/elife-64281-fig2-data1-v2.zip
Figure 2—figure supplement 1
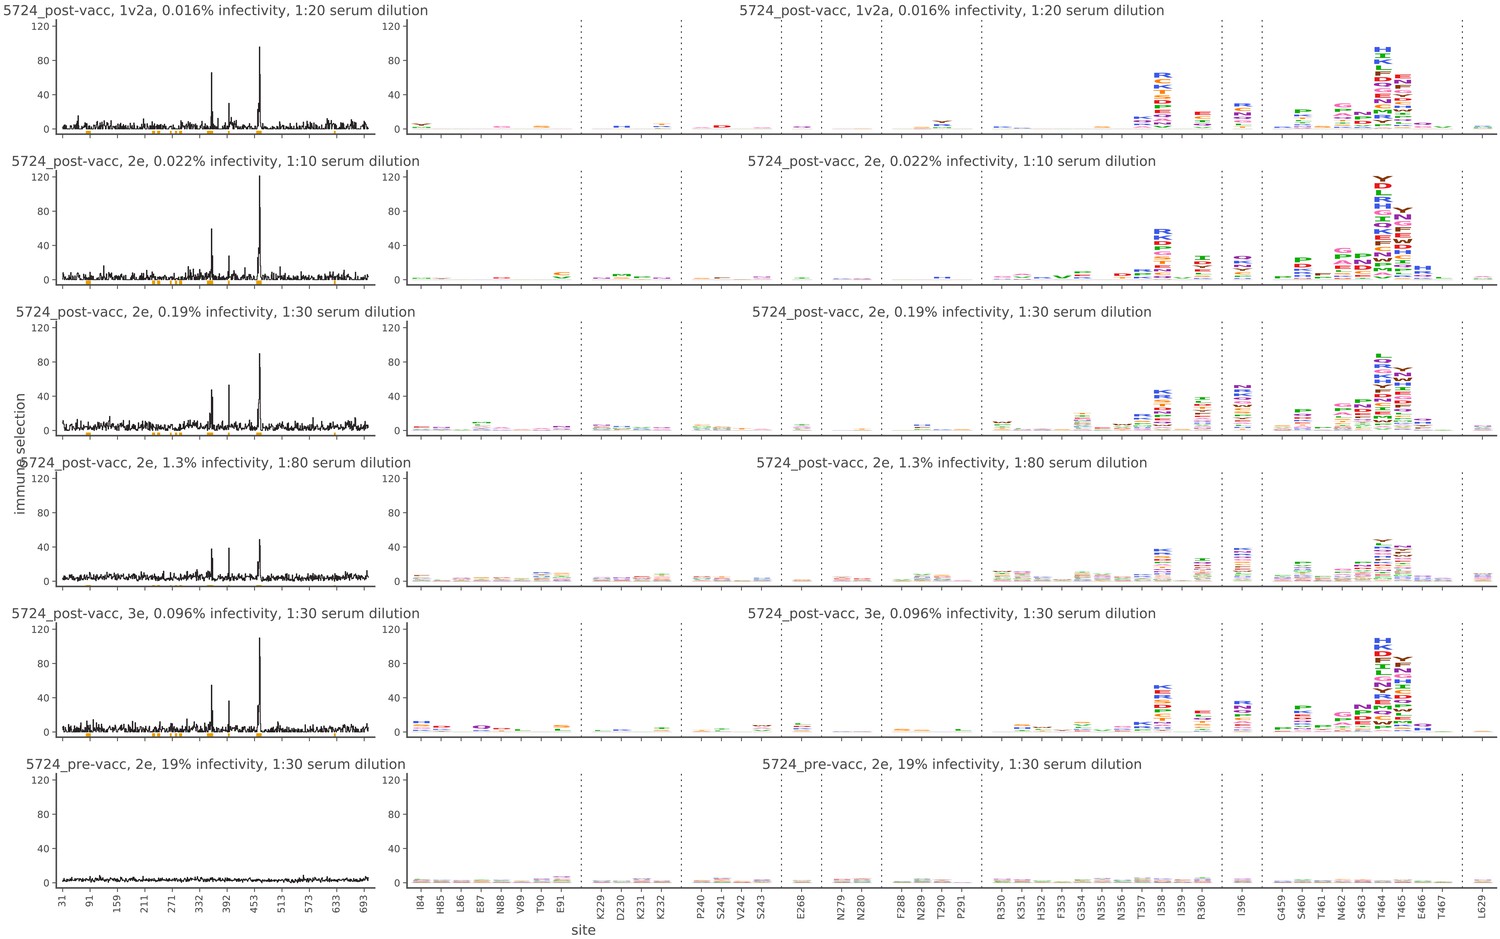
Mutational antigenic profiling data plotted for each individual replicates of pre- and post-immunization sera from rabbit 5724.
Data are plotted as in Figure 2A,B for each, but with mutations colored according to their biochemical property rather than epitope.
Figure 2—figure supplement 2
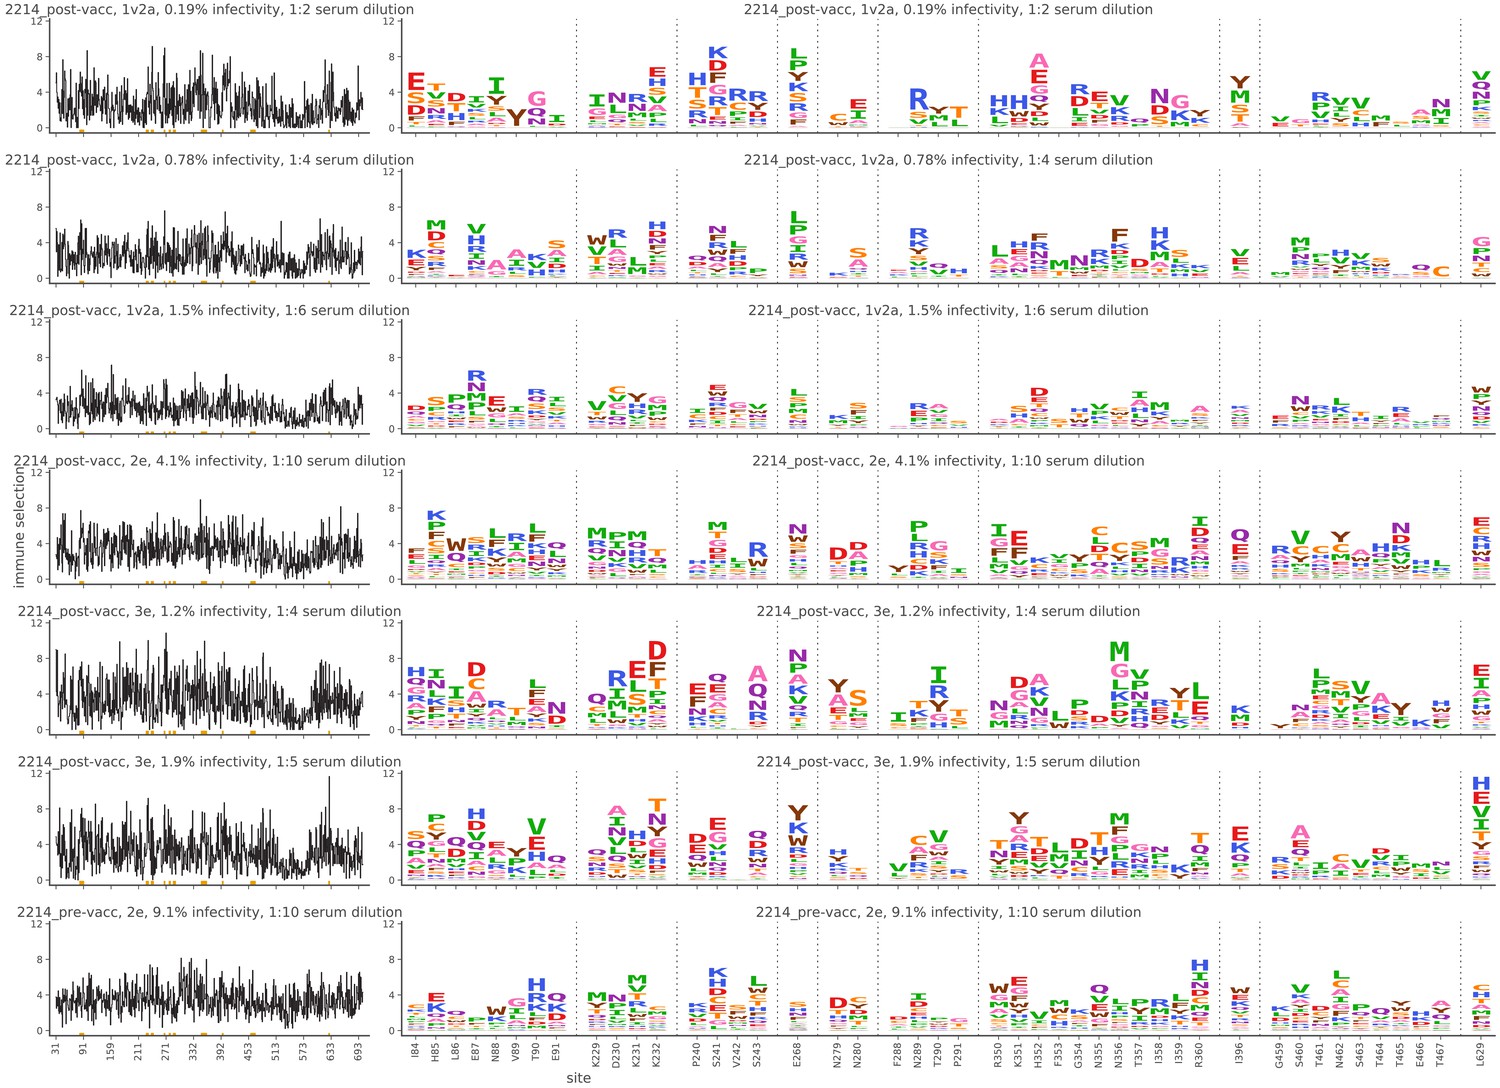
Mutational antigenic profiling data plotted for each individual replicates of pre- and post-immunization sera from rabbit 2214.
Data are plotted as in Figure 2A,B for each, but with mutations colored according to their biochemical property rather than epitope.
Figure 2—figure supplement 3
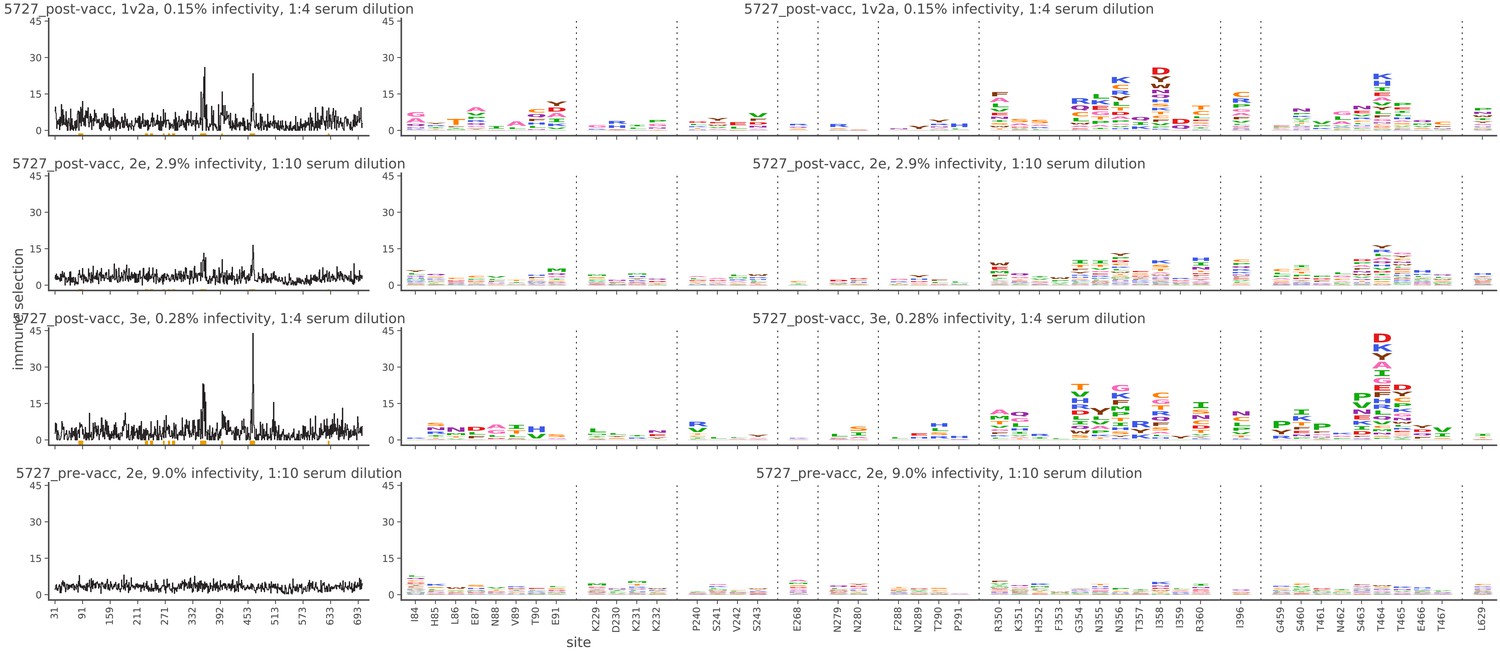
Mutational antigenic profiling data plotted for each individual replicates of pre- and post-immunization sera from rabbit 5727.
Data are plotted as in Figure 2A,B for each, but with mutations colored according to their biochemical property rather than epitope.
Figure 2—figure supplement 4
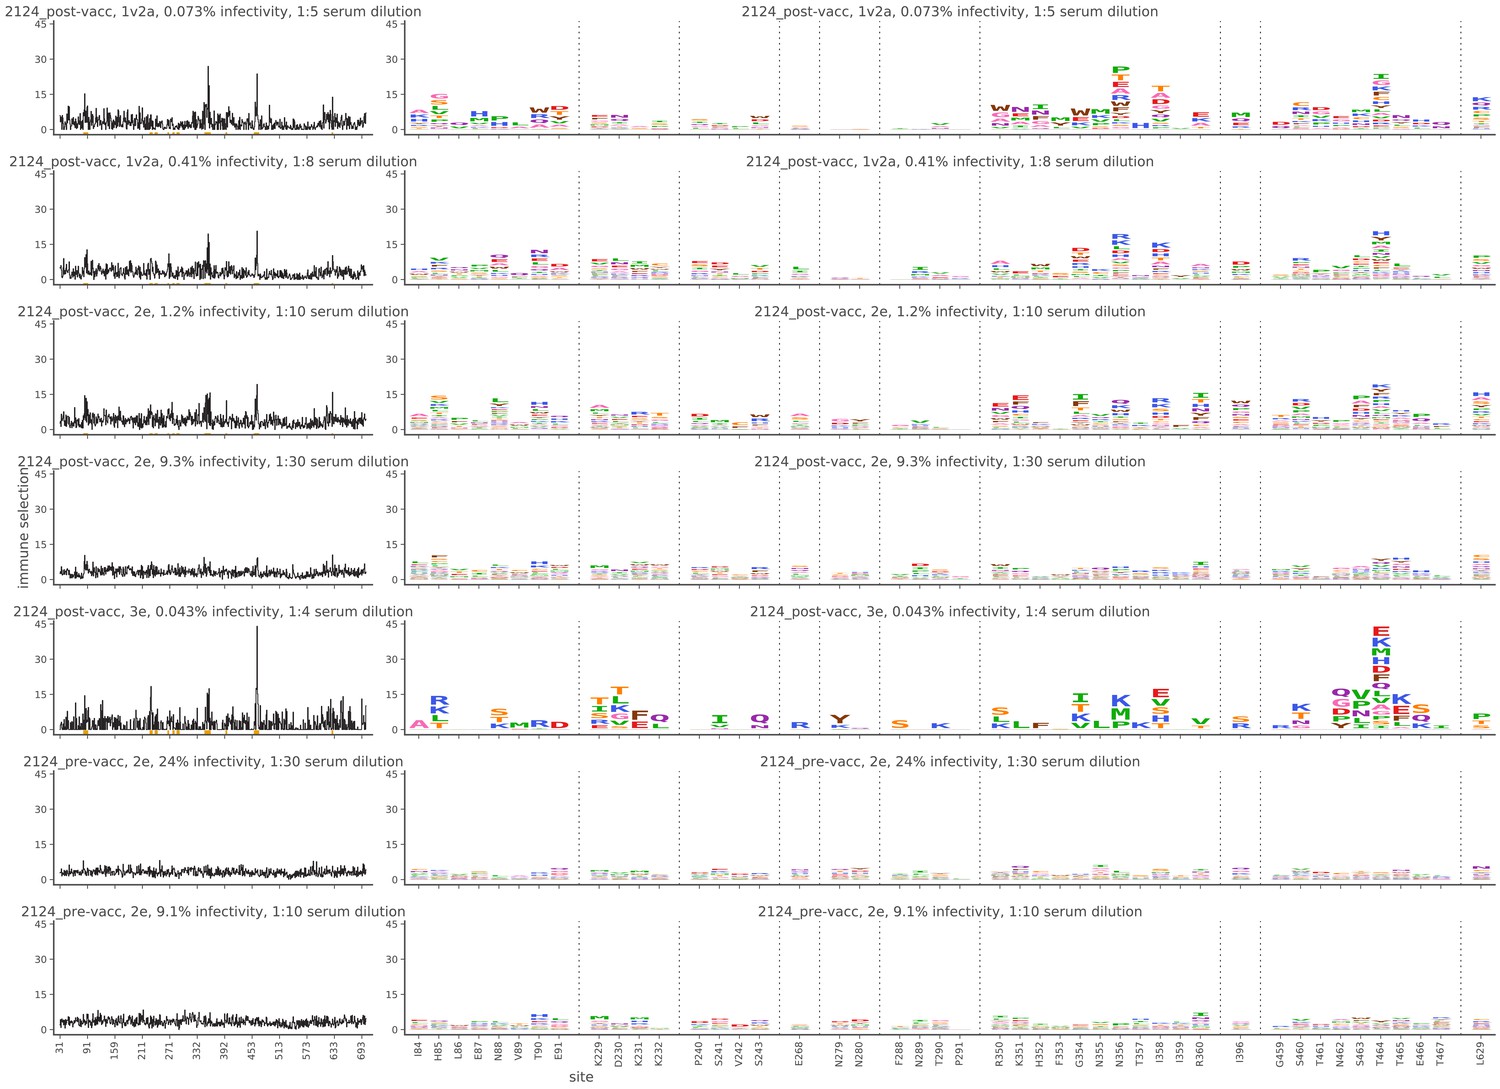
Mutational antigenic profiling data plotted for each individual replicates of pre- and post-immunization sera from rabbit 2124.
Data are plotted as in Figure 2A,B for each, but with mutations colored according to their biochemical property rather than epitope.
Figure 2—figure supplement 5
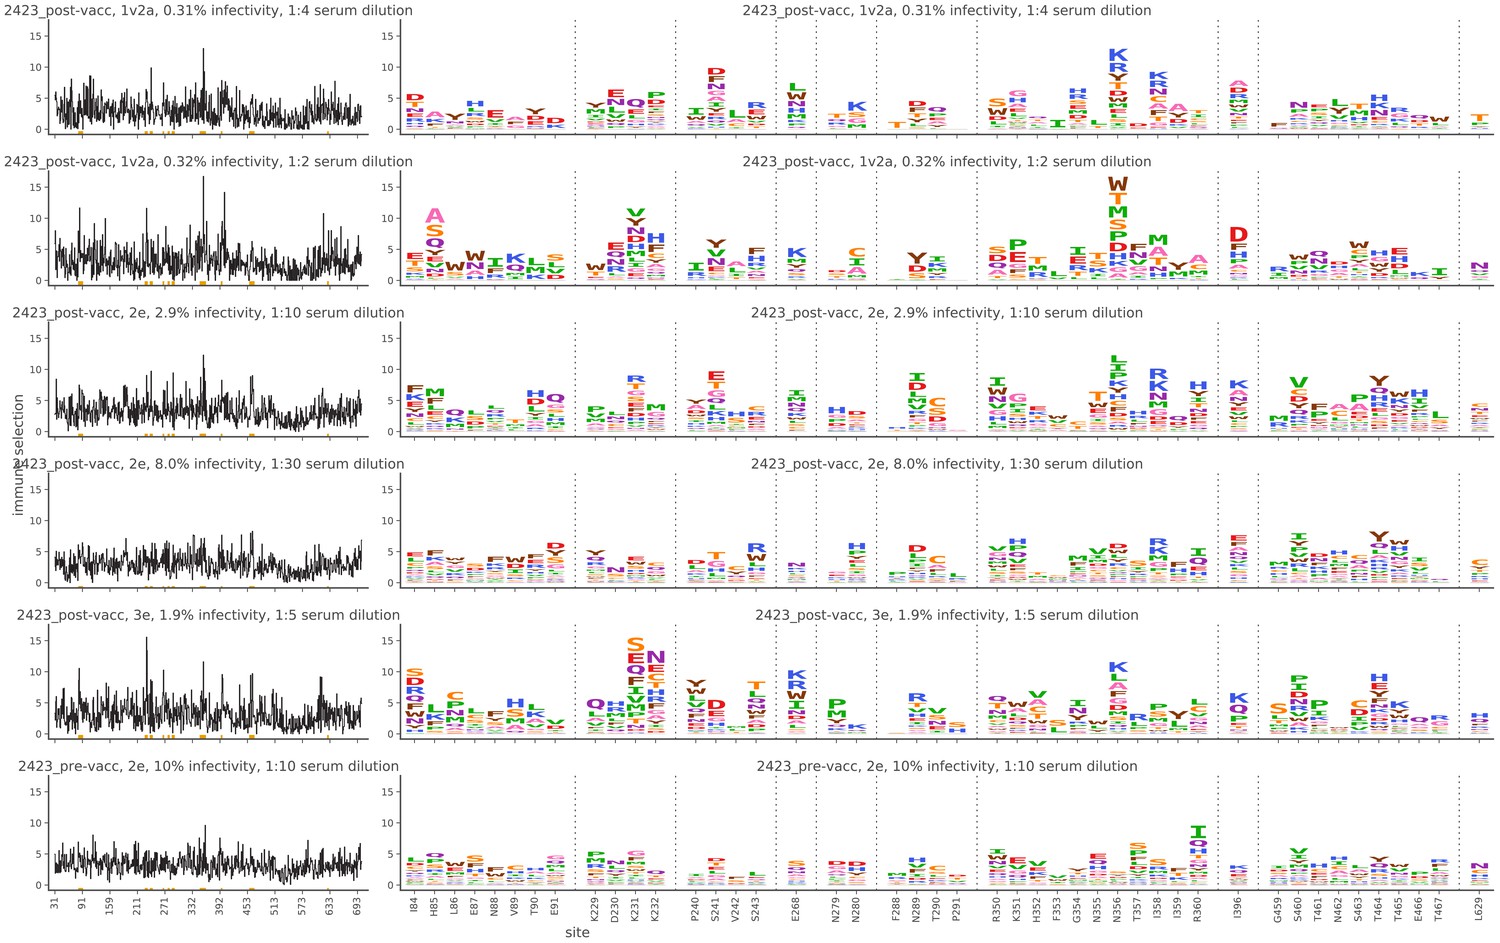
Mutational antigenic profiling data plotted for each individual replicates of pre- and post-immunization sera from rabbit 2423.
Data are plotted as in Figure 2A,B for each, but with mutations colored according to their biochemical property rather than epitope.
Figure 2—figure supplement 6
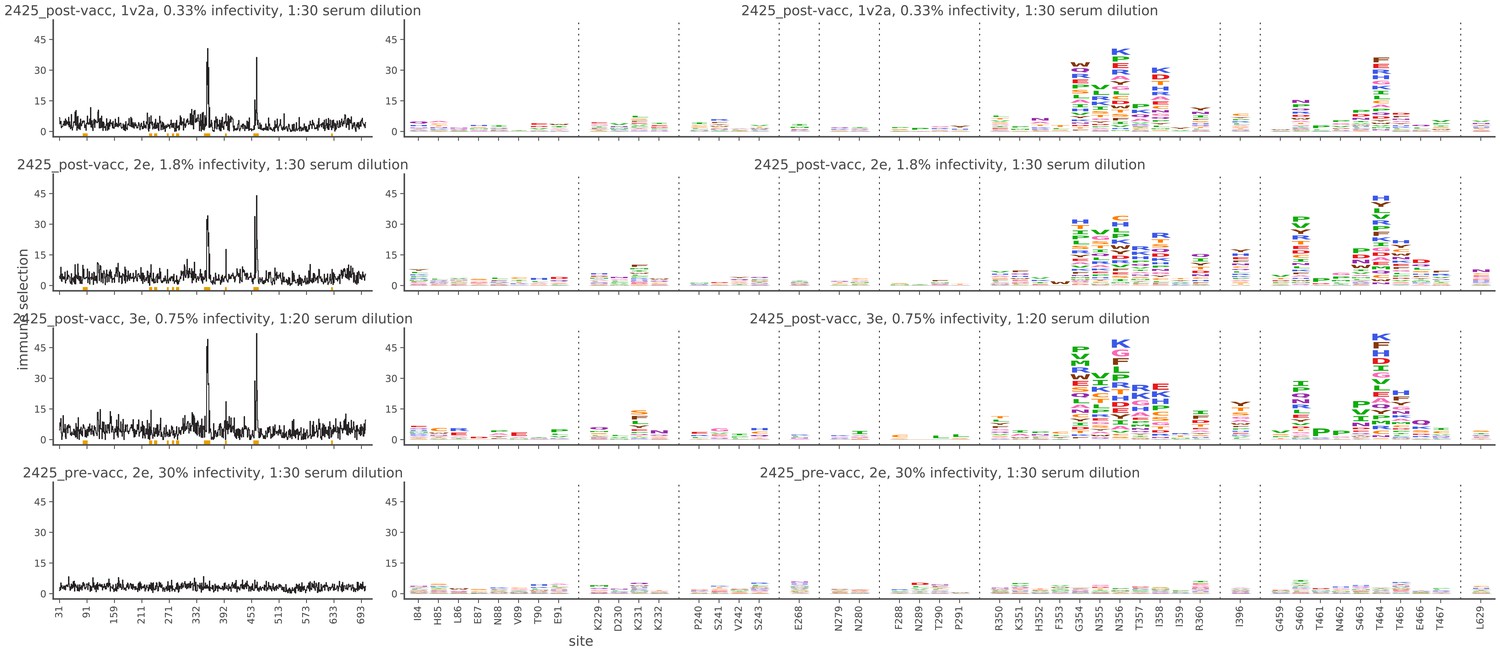
Mutational antigenic profiling data plotted for each individual replicates of pre- and post-immunization sera from rabbit 2425.
Data are plotted as in Figure 2A,B for each, but with mutations colored according to their biochemical property rather than epitope.
Figure 2—figure supplement 7
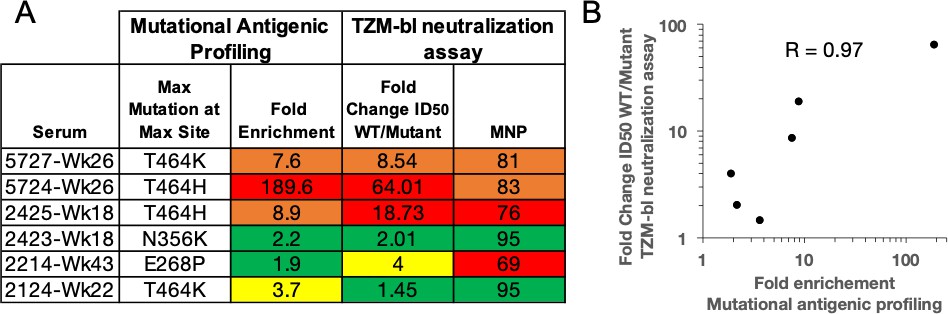
Validation of mutational antigenic profiling in neutralization assays.
(A) The fold enrichment in mutational antigenic profiling and the fold change in ID50 relative to wild type and maximum neutralization plateau (MNP) from TZM-bl neutralization assays for the maximal effect mutant at the maximal effect site. The color scheme is as in Figure 1A. (B) Correlation between fold change ID50 relative to wild type in TZM-bl neutralization assays and the fold enrichment in mutational antigenic profiling. The Pearson’s correlation coefficient is shown.
Figure 3 with 1 supplement

Comparing the binding and neutralization specificities of the sera.
(A) Refined 3D reconstructions from negative stain EMPEM. Specificities are mapped onto the Env trimer structure, with epitopes colored as in (C). (B) Mutational antigenic profiling data mapped onto the BG505 SOSIP Env structure, as in Figure 2C, represented here to contrast with EMPEM. (C) Summary data from (A) and (B), as well as validation TZM-bl neutralization assay point-mutant mapping of single and double epitope knock out mutations (see Figure 3—figure supplement 1 for details). A checkmark (EMPEM and MAP) indicates a response was detected to that epitope, and TZM-bl responses were summarized as ‘Dominant’, ‘Subdominant’, or undetected (left blank) based on data in Figure 3—figure supplement 1. We did not perform neutralization assay validation at epitopes where the discrepancies between the EMPEM and mutational antigenic profiling are easily explained by antigenicity differences between soluble trimer and virus (N611, base, and gp120 interface; labeled as ‘Not tested’).
Figure 3—figure supplement 1

Effect of mutations that disrupt the C3/V5, glycan hole, and V1 epitopes alone and in combination with other epitope knockouts.
Mutations are colored according to epitope, as in Figure 3. The standard deviation of replicate measures is shown in parentheses. Mutants labeled with an (*) are from the preliminary point-mutant mapping in Figure 1A; these experiments were performed in a different lab than the remainder of TZM-bl point-mutant mapping. While fold change in ID50 was always compared to a wild-type virus ran in parallel in independent labs, results across labs should only be interpreted generally (as presented in Figure 3C).
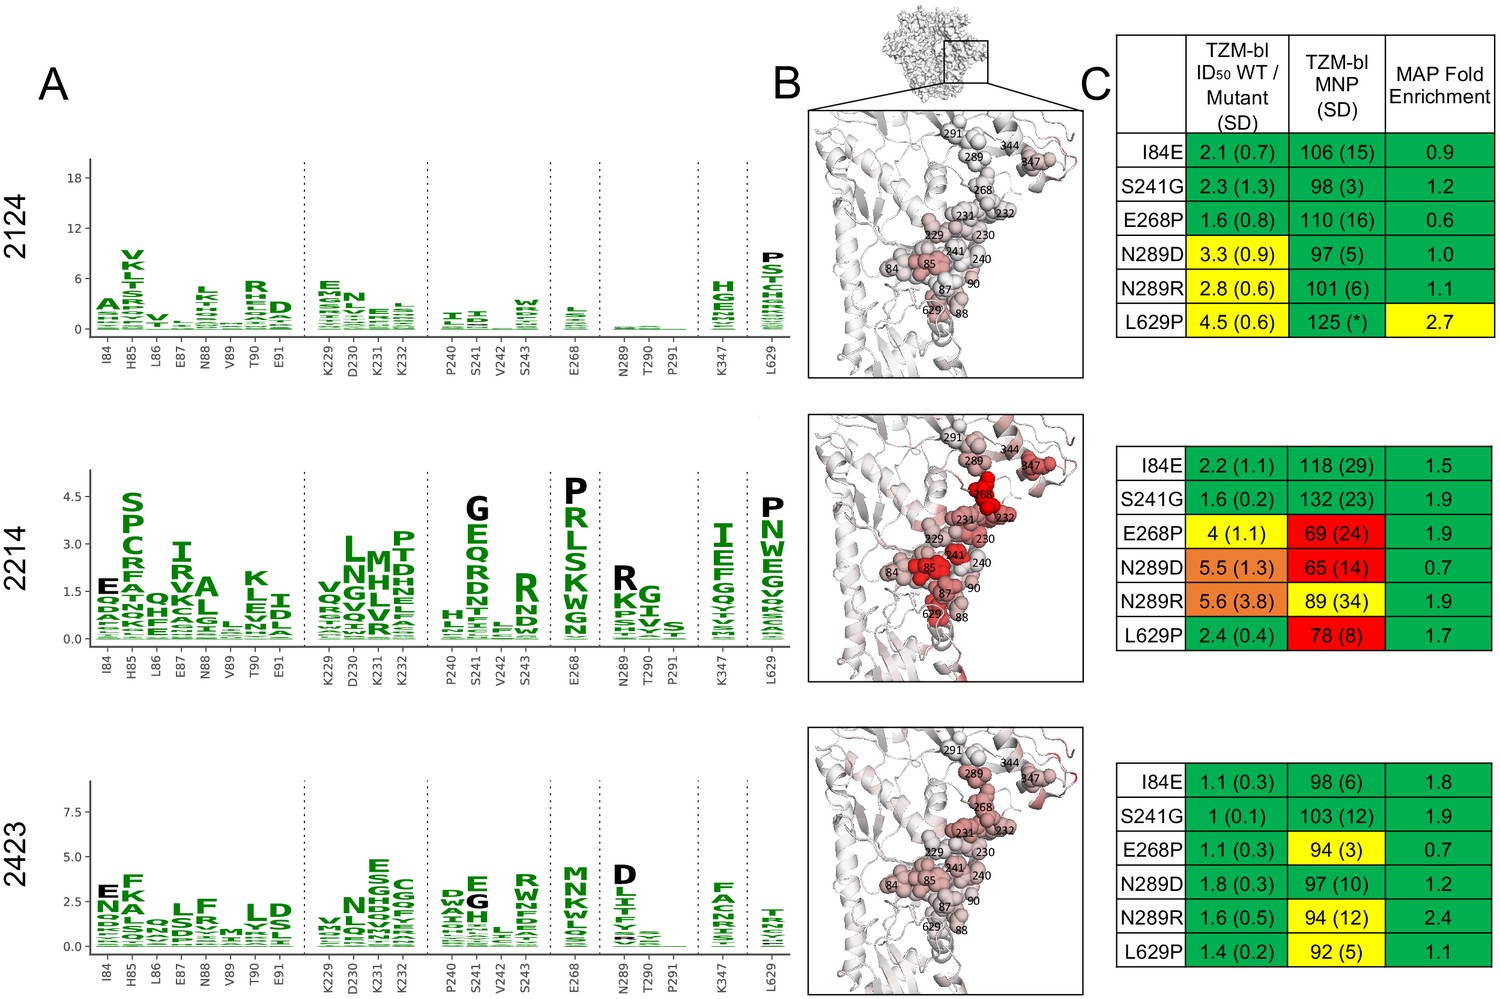
Figure 4 with 1 supplement

C3/V5 residue-level epitope specificity.
(A) Differential selection is plotted in logo plots for the C3/V5 epitope, as in Figure 1B. Mutations validated in TZM-bl neutralization assays (C) are colored black. The y-axis is scaled to the largest effect size site. (B) The positive site differential selection is mapped onto the BG505 trimer (PDB: 5FYL), colored as in Figure 1C. Sites shown in (A) are shown with spheres in (B). These data can be explored interactively using dms-view at https://jbloomlab.github.io/Vacc_Rabbit_Sera_MAP/. (C) The fold change in ID50 relative to wild type and the maximum neutralization plateau (MNP) for each mutant validated in a pseudovirus TZM-bl neutralization assay. The table color scheme is as in Figure 1A, and the standard deviation of replicate measures are shown in parentheses. See Figure 4—figure supplement 1 for the single sera with relatively less targeting of this epitope.
Figure 4—figure supplement 1
A, B, and C as in Figure 4, but for the single sera with limited targeting of the C3/V5 epitope.
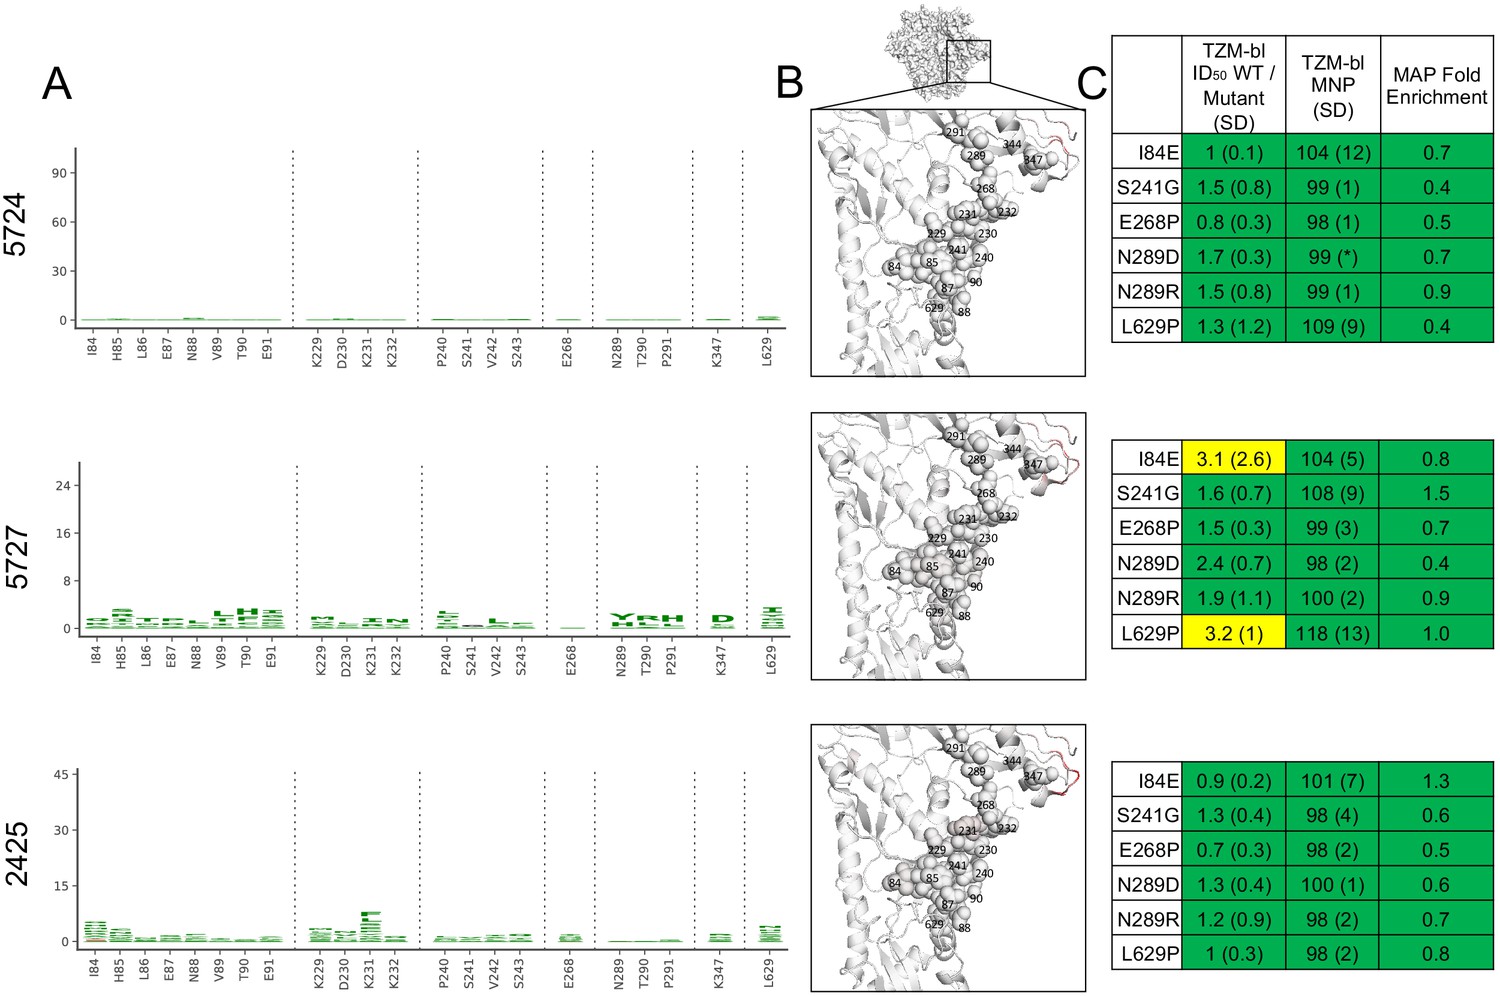
Figure 5 with 1 supplement
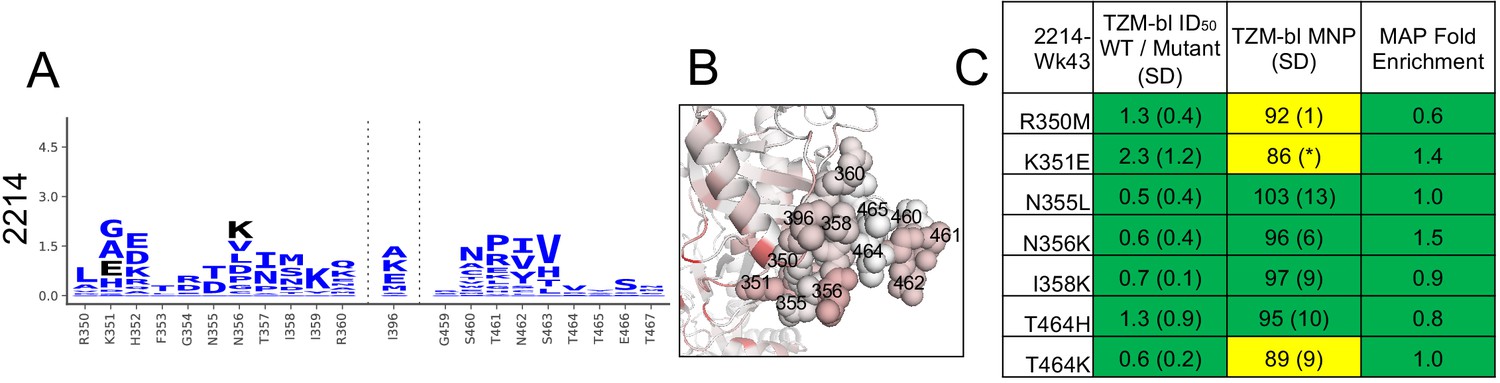
Glycan hole epitope specificity.
(A) Differential selection is plotted in logo plots for the glycan hole epitope, as in Figure 1B. Mutations validated in TZM-bl neutralization assays (C) are colored black. The y-axis is scaled to the largest effect size site, which is oftentimes not in this GH view. (B) The positive site differential selection is mapped onto the BG505 trimer (PDB: 5FYL), with a single monomer shown and colored as in Figure 1C. Sites shown in (A) are shown with spheres in (B). These data can be explored interactively using dms-view at https://jbloomlab.github.io/Vacc_Rabbit_Sera_MAP/. (C) The fold change in ID50 relative to wild type and the maximum neutralization plateau (MNP) for each mutant validated in a pseudovirus TZM-bl neutralization assay. The table color scheme is as in Figure 1A, and the standard deviation of replicate measures are shown in parentheses. The table color scheme is as in Figure 1A. See Figure 5—figure supplement 1 for the three sera with limited targeting of this epitope.
Figure 5—figure supplement 1
(A), (B), and (C) as in Figure 5, but for the three sera with limited targeting of the glycan hole epitope.
Additional files
Download links
A two-part list of links to download the article, or parts of the article, in various formats.
Downloads (link to download the article as PDF)
Open citations (links to open the citations from this article in various online reference manager services)
Cite this article (links to download the citations from this article in formats compatible with various reference manager tools)
High-resolution mapping of the neutralizing and binding specificities of polyclonal sera post-HIV Env trimer vaccination
eLife 10:e64281.
https://doi.org/10.7554/eLife.64281


