Endothelial cell-type-specific molecular requirements for angiogenesis drive fenestrated vessel development in the brain
- Department of Cardiovascular and Metabolic Sciences, Lerner Research Institute, Cleveland Clinic, United States
- Cleveland Clinic Lerner College of Medicine of Case Western Reserve University, United States
Figures
Figure 1 with 3 supplements
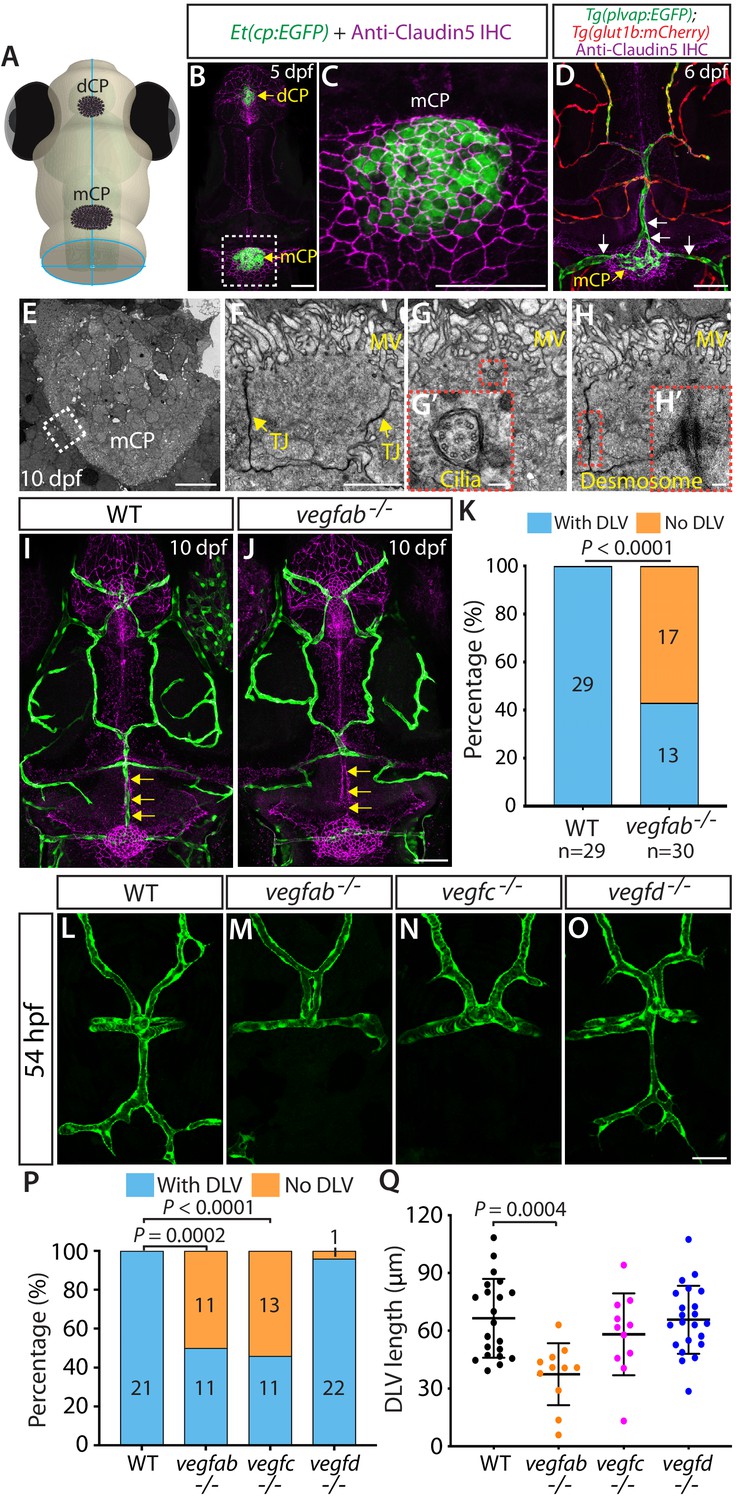
Fenestrated mCP vascular formation defects in vegfab and vegfc mutant zebrafish.
(A) Schematic representation of the dorsal view of the zebrafish head, indicating the locations of the diencephalic and myelencephalic CP (dCP and mCP, respectively). (B and C) Dorsal views of a 5 dpf Et(cp:EGFP) head immunostained for Claudin-5 (magenta), indicating EGFP+ and Claudin-5+ mCP epithelial cells. A magnified image of the boxed area is shown in (C). (D) Dorsal view of a 6 dpf Tg(plvap:EGFP);Tg(glut1b:mCherry) head immunostained for Claudin-5 (magenta) shows heterogeneous Tg(plvap:EGFP) and Tg(glut1b:mCherry) expression patterns in the brain and meningeal vasculature. Strong Tg(plvap:EGFP) and weak Tg(glut1b:mCherry) expression was observed in the mCP vasculature (white arrows). (E–H) Transmission electron microscopy images of 10 dpf wild-type (WT) mCP and its surrounding tissues (E) and of mCP epithelial cells (F–H). Magnified images of mCP epithelial cells (F–H) were taken in areas between the mCP and its neighboring tissues as indicated by the dashed line. mCP epithelial cells showed tight junctions (TJ) and microvilli (MV), the 9 + 2 arrangement of microtubules of cilia (G’), and desmosomes (H’). Magnified images of the boxed areas (G and H) are shown in (G’) and (H’), respectively. (I and J) Dorsal views of 10 dpf WT (I) and vegfab-/- (J) cranial vasculature visualized by Tg(kdrl:EGFP) expression and anti-Claudin-5 immunostaining (magenta) show a specific loss of the dorsal longitudinal vein (DLV) in vegfab-/- larvae (yellow arrows). (K) Percentage of the fish of indicated genotype with and without the DLV at 10 dpf (n = 29 for WT and n = 30 for vegfab-/- fish). (L–O) Dorsal views of 54 hpf WT (L), vegfab-/- (M), vegfc-/- (N), and vegfd-/- (O) cranial vasculature visualized by Tg(kdrl:EGFP) expression. Approximately half of the vegfab-/- and vegfc-/- embryos examined lacked the DLV. (P) Percentage of the fish of indicated genotype with and without the DLV at 54 hpf (n = 21 for WT, n = 22 for vegfab-/-, n = 24 for vegfc-/-, and n = 23 for vegfd-/- fish). (Q) Quantification of DLV lengths of the fish that formed the DLV at 54 hpf (n = 21 for WT, n = 11 for vegfab-/-, n = 11 for vegfc-/-, and n = 22 for vegfd-/- fish). Data are means ± SD. Scale bars: 50 µm in (B), (C), (D), (J), (O); 10 µm in (E); 2 µm in (F); 100 nm in (G’) and (H’).
-
Figure 1—source data 1
Quantifications of DLV lengths and the ‘No DLV’ phenotype in 54 hpf WT and vegf mutant embryos.
- https://cdn.elifesciences.org/articles/64295/elife-64295-fig1-data1-v2.xlsx
Figure 1—figure supplement 1
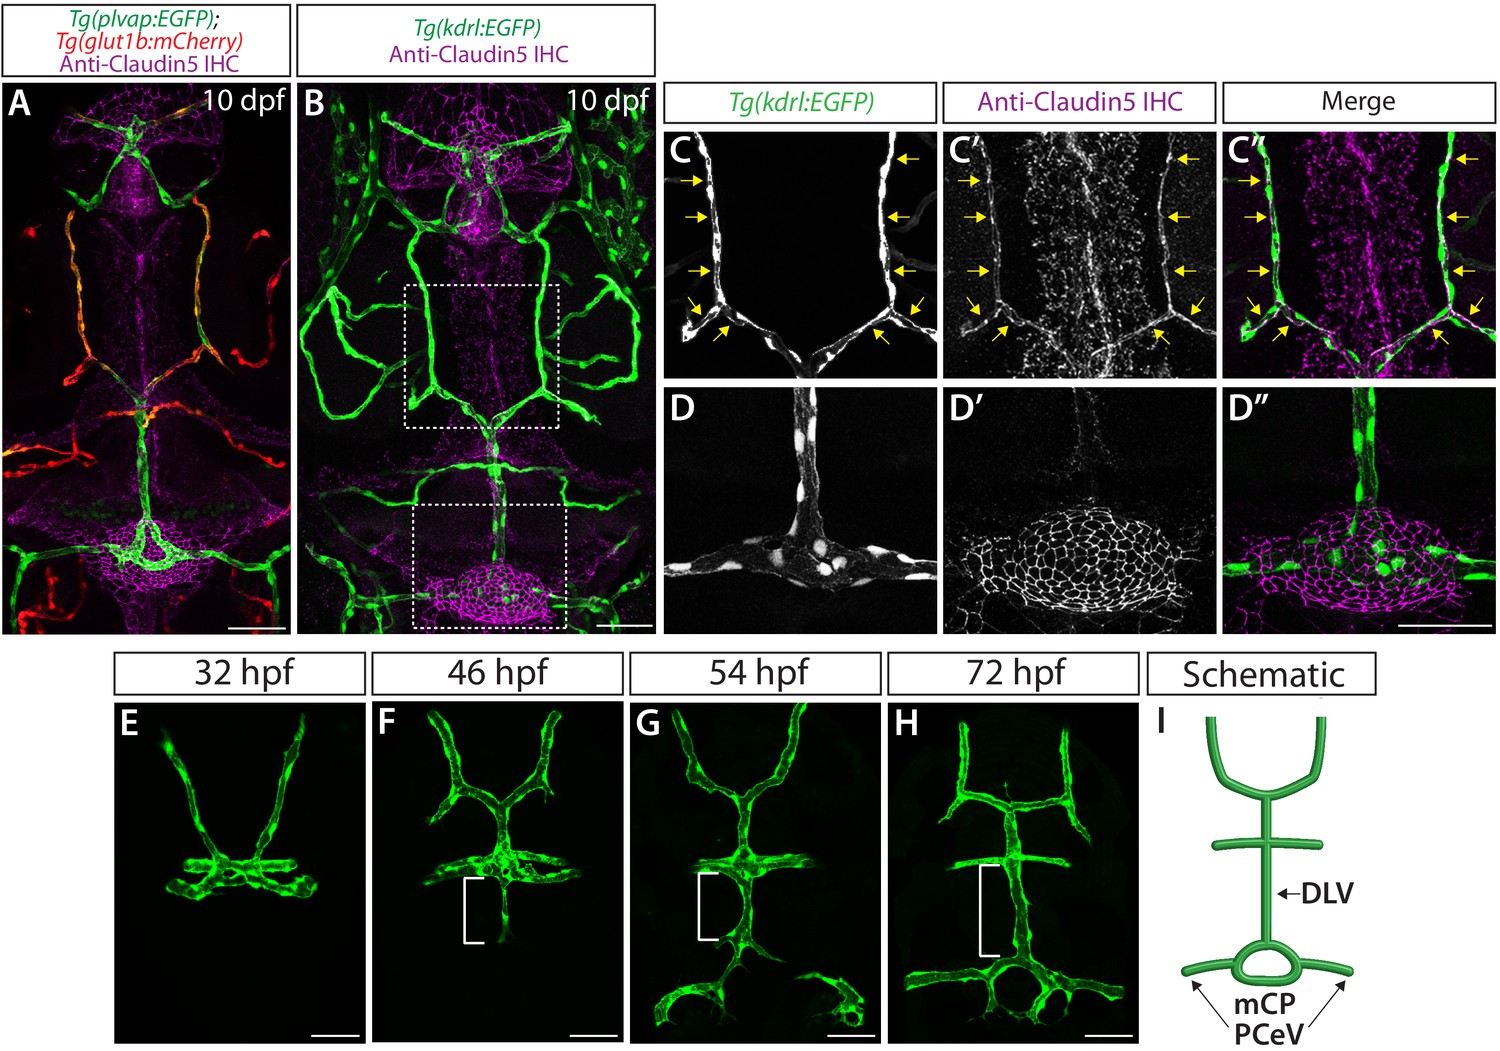
Molecularly heterogeneous networks of the brain and meningeal vasculature and developmental time courses of mCP vascularization.
(A) Dorsal view of a 10 dpf Tg(plvap:EGFP);Tg(glut1b:mCherry) head immunostained for Claudin-5 (magenta) shows heterogeneous Tg(plvap:EGFP) and Tg(glut1b:mCherry) expression levels in the brain and meningeal vasculature. Strong Tg(plvapb:EGFP) and weak Tg(glut1b:mCherry) expression was observed in the mCP vasculature. (B) Dorsal view of a 10 dpf Tg(kdrl:EGFP) larval head immunostained for Claudin-5 (magenta). (C–C") Magnified images of the top boxed area in (B) show Claudin-5+ mesencephalic veins (MsV, yellow arrows). (D–D") Magnified images of the bottom boxed area in (B) show Claudin-5- mCP vasculature composed of the dorsal longitudinal vein (DLV) and posterior cerebral vein (PCeV). (E–H) Dorsal views of 32 (E), 46 (F), 54 (G), and 72 (H) hpf cranial vasculature visualized by Tg(kdrl:EGFP) expression. The DLV began sprouting before 46 hpf (F) and extended posteriorly toward the myelencephalic choroid plexus (mCP) to connect with the bilateral PCeV around 54 hpf (G) to form the mCP vasculature through 72 hpf (H). (I) Schematic representation of the dorsal view of the cranial vasculature at 72 hpf. Scale bars: 50 µm.
Figure 1—figure supplement 2
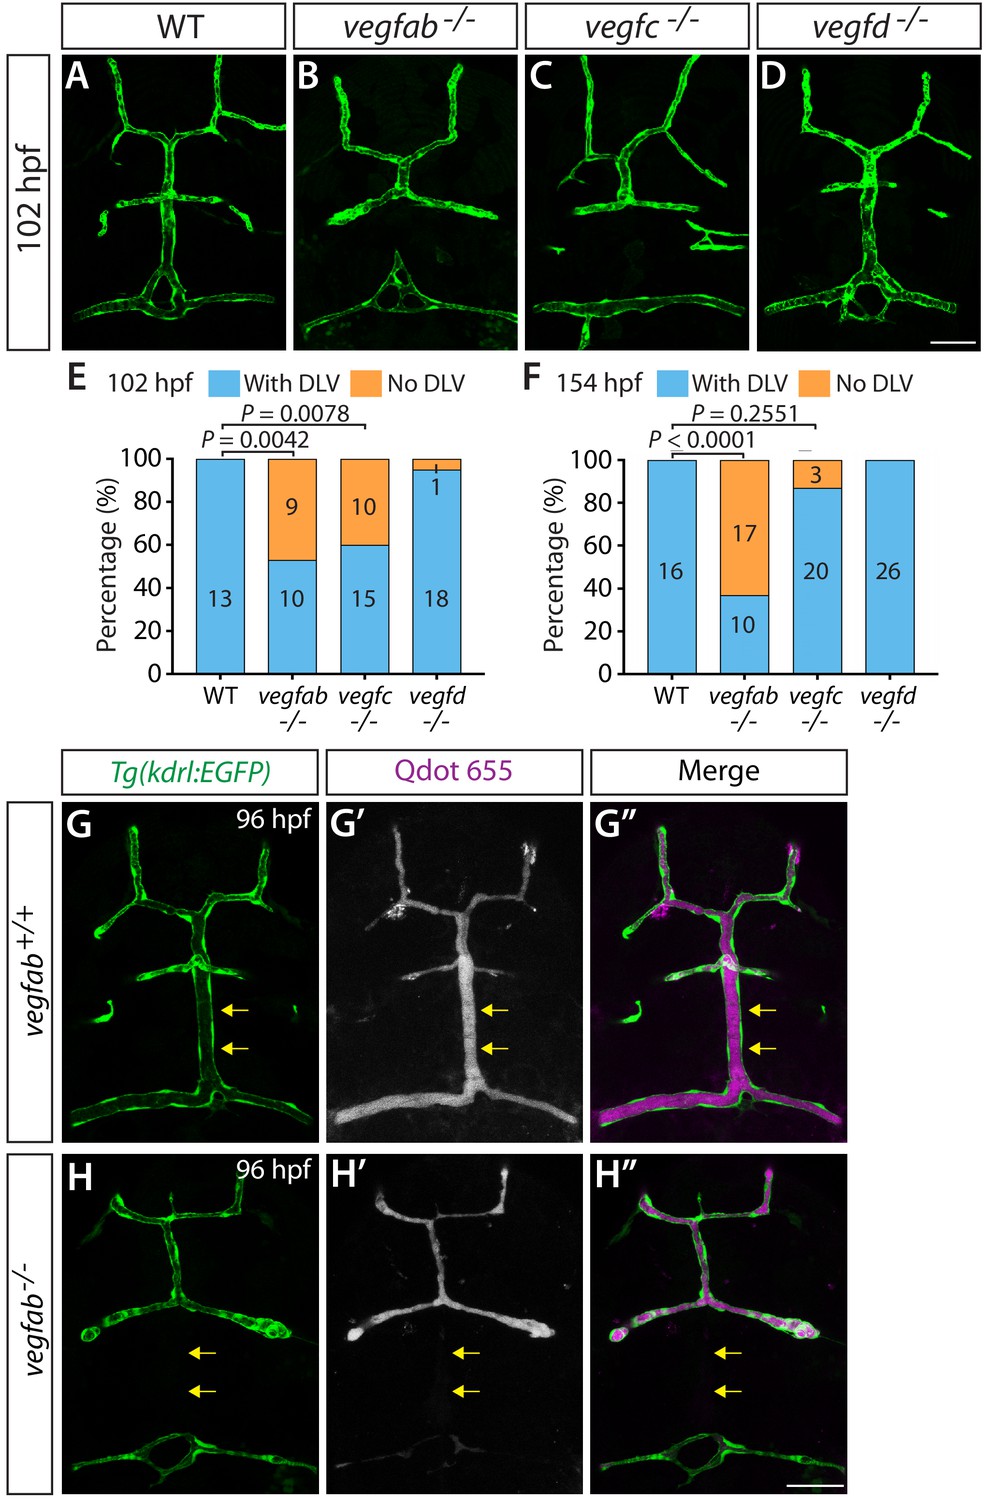
Characterization of DLV formation defects in vegfab and vegfc mutants at distinct larval stages and visualization of perfused cranial vasculature in WT and vegfab mutant larvae.
(A–D) Dorsal views of 102 hpf WT (A), vegfab-/- (B), vegfc-/- (C), and vegfd-/- (D) cranial vasculature visualized by Tg(kdrl:EGFP) expression. A significant fraction of vegfab-/- and vegfc-/- larvae lacked the DLV at 102 hpf. (E and F) Percentage of the fish of indicated genotype with and without the DLV at 102 (E) and 154 (F) hpf. A significantly higher fraction of vegfab-/- and vegfc-/- fish lacked the DLV at 102 hpf (47% and 40%, respectively) than WT (0%) (n = 13 for WT, n = 19 for vegfab-/-, n = 25 for vegfc-/-, and n = 19 for vegfd-/- fish examined at 102 hpf). At 154 hpf, while 63% of vegfab-/- fish exhibited the ‘No DLV’ phenotype, only 13% of vegfc-/- fish showed this phenotype (n = 16 for WT, n = 27 for vegfab-/-, n = 23 for vegfc-/-, and n = 26 for vegfd-/- fish examined at 154 hpf). Only a small fraction of vegfd-/- fish examined lacked the DLV at 102 and 154 hpf (5% and 0%, respectively). (G–H") Dorsal views of 96 hpf vegfab+/+ (G–G") and vegfab-/- (H–H") heads of larvae that carry the Tg(kdrl:EGFP) transgene (G and H) and that were injected with streptavidin-conjugated Qdot 655 nanocrystals (G’ and H’) (merged images shown in G" and H"). In vegfab+/+ fish (n = 10), the DLV is visualized by both Tg(kdrl:EGFP) expression (G) and blood-circulating Qdot 655 nanocrystals (G’). In contrast, in the vegfab-/- larvae that lack the Tg(kdrl:EGFP)-positive DLV (H, n = 8), blood-circulating Qdot 655 nanocrystals did not label the DLV (H’), showing the lack of a perfused, functional DLV. Yellow arrows point to the presence and absence of the DLV in vegfab+/+ and vegfab-/- larvae, respectively. Scale bars: 50 µm.
Figure 1—figure supplement 3
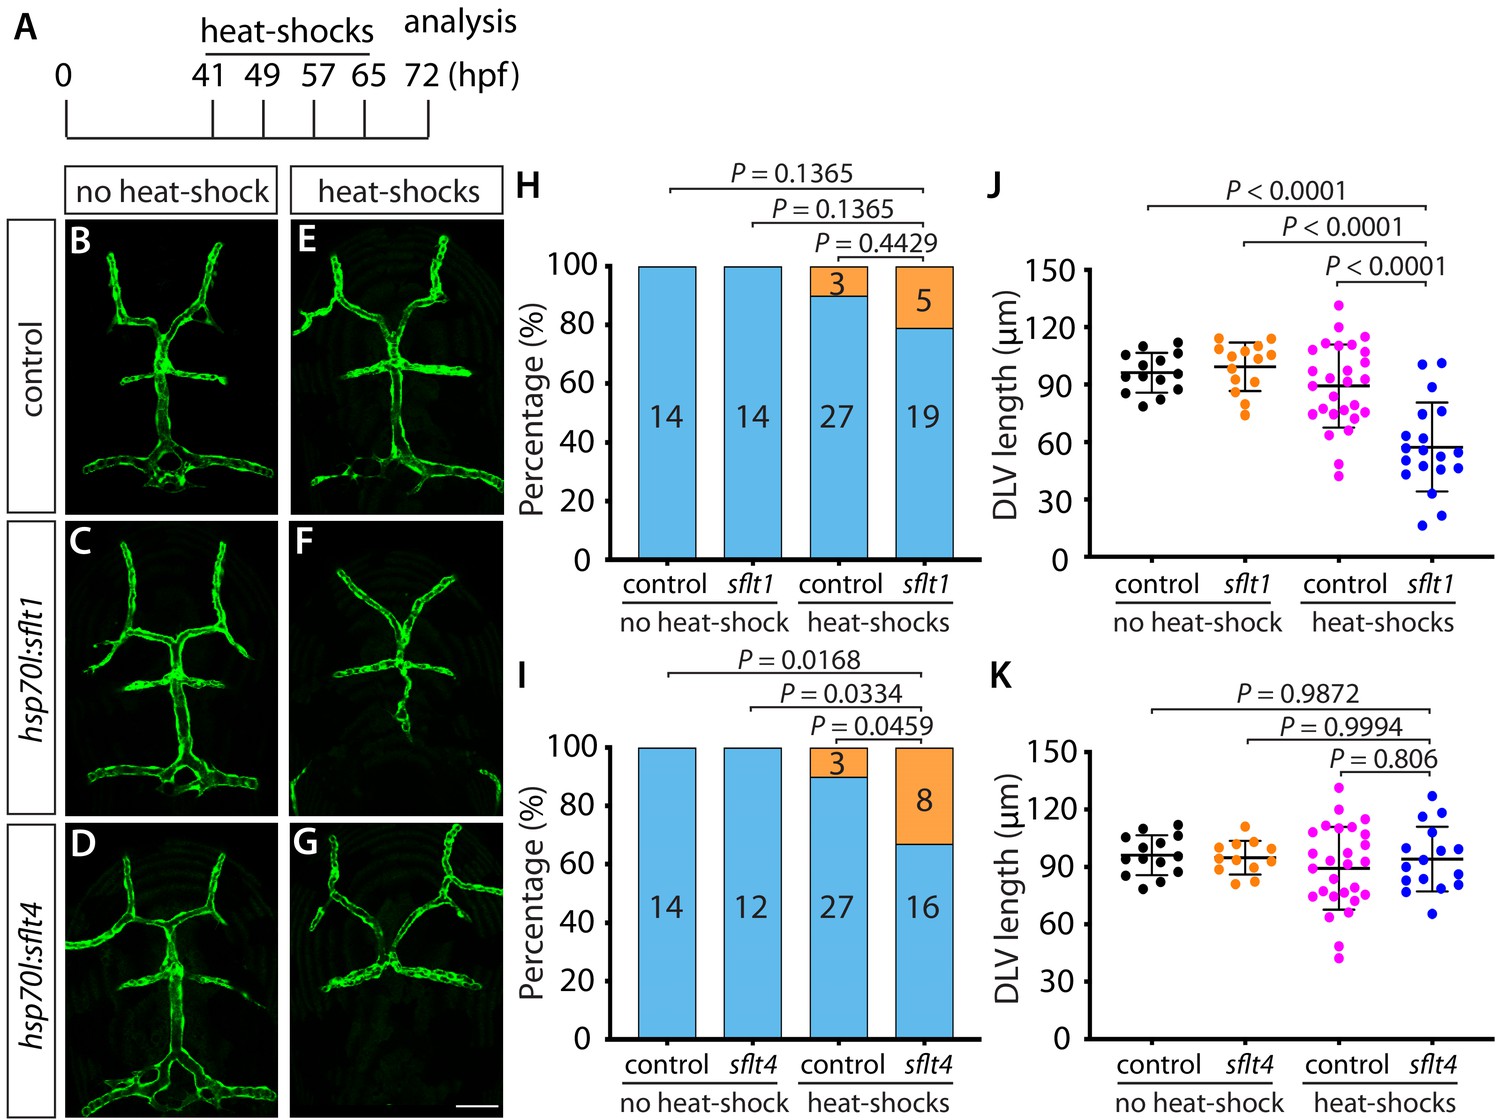
Heatshock-induced overexpression of sFlt1 and sFlt4 partially phenocopied the DLV formation defects observed in vegfab and vegfc mutants, respectively.
(A) Experimental time course of the heat-shock treatments. Tg(hsp70l:sflt1), Tg(hsp70l:sflt4), and their control siblings were subjected to a heat-shock at 41, 49, 57, and 65 hpf and analyzed at 72 hpf. (B–G) Dorsal views of the cranial vasculature of 72 hpf Tg(kdrl:EGFP) (B and E), Tg(hsp70l:sflt1);Tg(kdrl:EGFP) (C and F), and Tg(hsp70l:sflt4);Tg(kdrl:EGFP) (D and G) larvae after treatment with (E–G) or without (B–D) multiple heatshocks. (H–K) Percentage of the 72 hpf fish with and without the DLV after the indicated treatment (H and I). Quantification of the DLV lengths of fish subjected to the indicated treatment (J and K). The results involving sFlt1 overexpression are shown in (H and J) and those involving sFlt4 overexpression are shown in (I and K). The results of their control siblings with and without the heatshocks are shared in the graphs for both groups. Heatshock-induced overexpression of sFlt4 led to a significantly increased percentage of the ‘No DLV’ phenotype (33%) compared to the other control groups (I), while DLV lengths were significantly shorter in the fish subjected to heatshock-induced overexpression of sFlt1 compared to the other control groups (J). The number of the animals examined is listed in the graph. Data are means ± SD. Scale bar: 50 µm.
Figure 2 with 1 supplement
vegfab genetically interacts with vegfc in mCP vascular development.
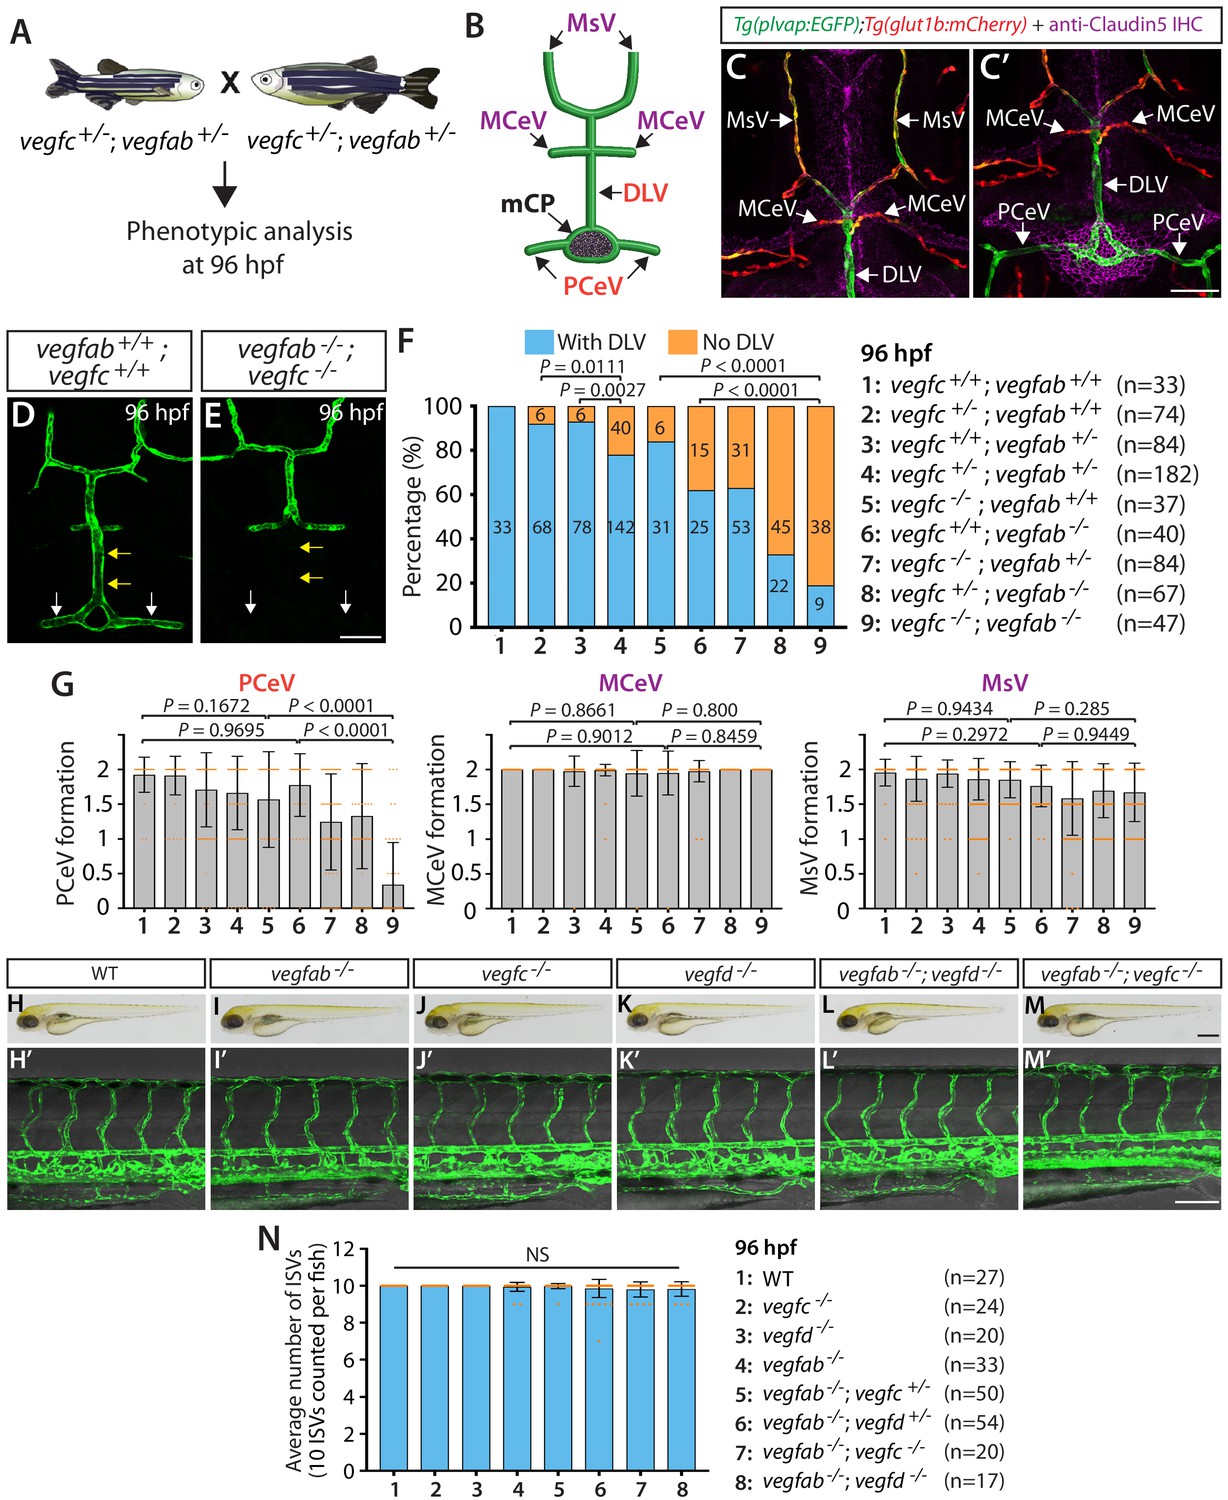
(A) Experimental setup for the results shown in (D–G). (B) Schematic representation of the dorsal view of 96 hpf WT cranial vasculature, illustrating distinct cranial vessels. PCeV: posterior cerebral vein, MCeV: middle cerebral vein, MsV: mesencephalic vein. (C and C’) Dorsal views of a 10 dpf Tg(plvap:EGFP);Tg(glut1b:mCherry) head immunostained for Claudin-5 (magenta) show that the DLV and PCeV exhibit stronger Tg(plvap:EGFP), and weaker Tg(glut1b:mCherry), expression than the MCeV and MsV do. (D and E) Dorsal views of 96 hpf vegfab+/+;vegfc+/+ (D) and vegfab-/-;vegfc-/- (E) cranial vasculature visualized by Tg(kdrl:EGFP) expression show a specific loss of the DLV (yellow arrows) and PCeV (white arrows) in vegfab-/-;vegfc-/- larvae. (F) Percentage of 96 hpf fish of indicated genotype with and without the DLV (the number of the animals examined per genotype is listed in the panel). (G) Quantification of PCeV, MCeV, and MsV formation at 96 hpf. PCeV formation was severely and selectively compromised in vegfc-/-;vegfab-/- larvae compared to the corresponding single mutants. (H–M) Brightfield images of 96 hpf WT (H), vegfab-/- (I), vegfc-/- (J), vegfd-/- (K), vegfab-/-;vegfd-/- (L), and vegfab-/-;vegfc-/- (M) larvae. (H’–M’) Lateral views of 96 hpf WT (H’), vegfab-/- (I’), vegfc-/- (J’), vegfd-/- (K’), vegfab-/-;vegfd-/- (L’), and vegfab-/-;vegfc-/- (M’) larval trunk vasculature visualized by Tg(kdrl:EGFP) expression. (N) Quantification of average number of ISVs in 96 hpf fish of indicated genotype (the number of the animals examined per genotype is listed in the panel). No significant difference in the number of ISVs was observed across the genotypes. NS: not significant. Data are means ± SD. Scale bars: 50 µm in (C’), (E), and (M’); 1 mm in (M).
Figure 2—figure supplement 1
vegfab genetically interacts with vegfd in mCP vascular development.
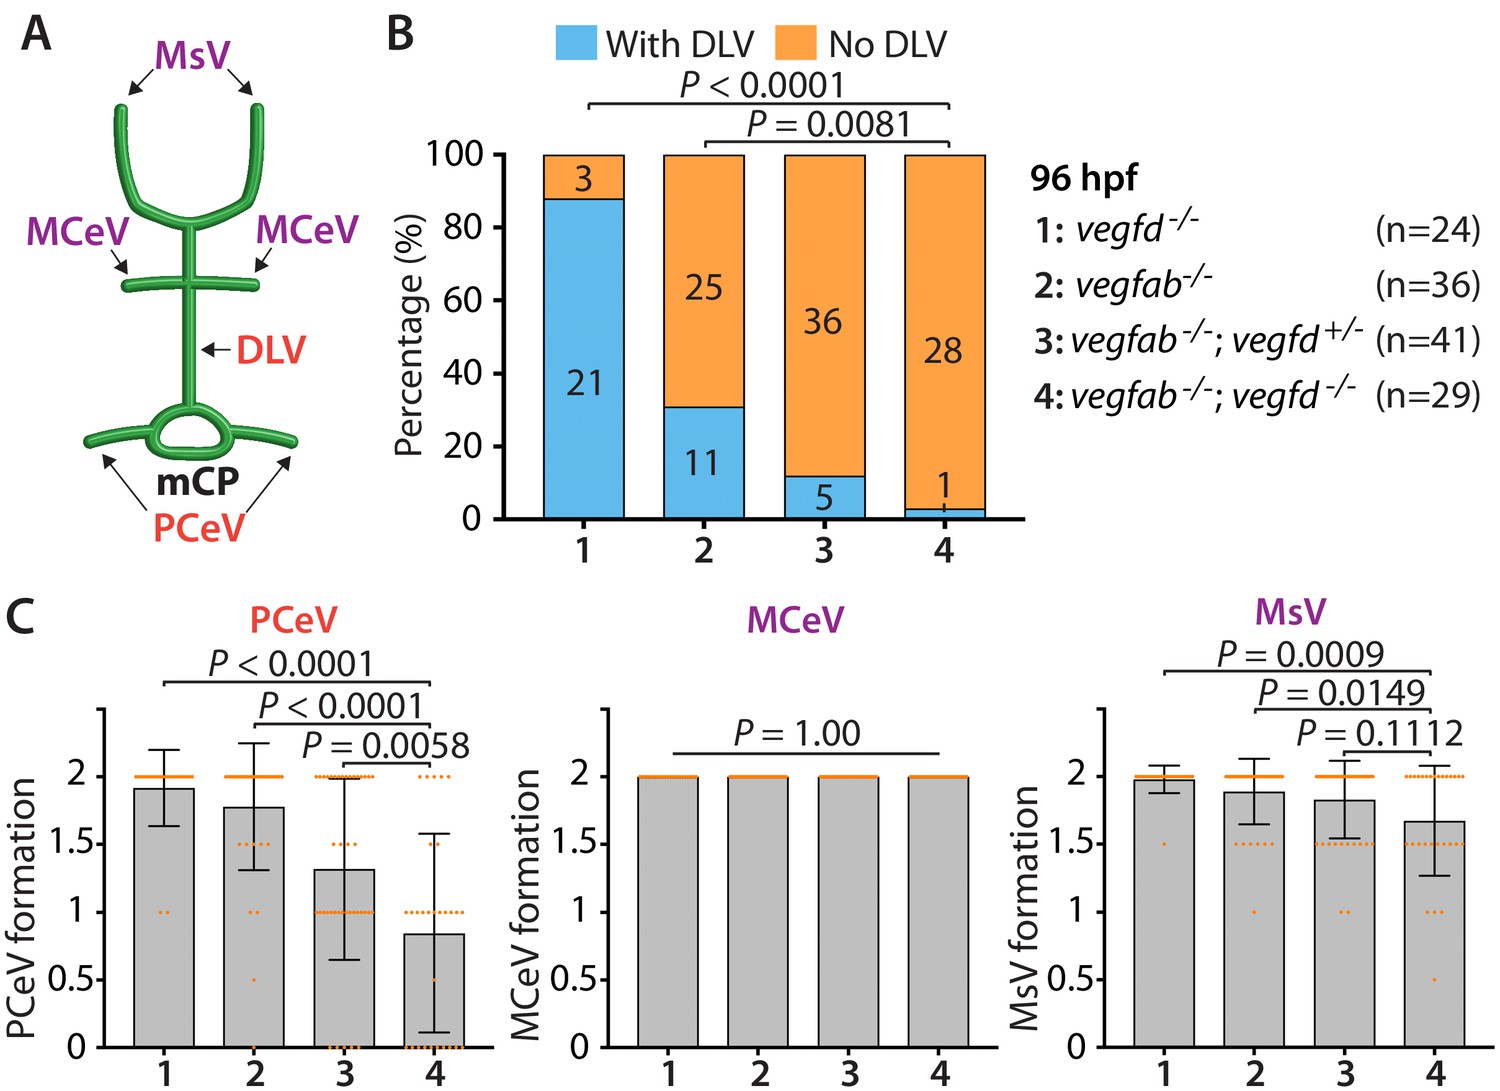
(A) Schematic representation of the dorsal view of WT cranial vasculature, illustrating the mCP vasculature (DLV, PCeV) and the neighboring cranial vessels (MsV, MCeV). (B) Percentage of 96 hpf fish of indicated genotype with and without the DLV. vegfab-/-;vegfd-/- larvae displayed a significantly higher penetrance of the ‘No DLV’ phenotype (97%) than vegfab-/- (69%) and vegfd-/- (12.5%) larvae, showing that vegfab and vegfd genetically interacts in DLV formation (n = 24 for vegfd-/-, n = 36 for vegfab-/-, n = 41 for vegfab-/-;vegfd+/-, and n = 29 for vegfab-/-;vegfd-/- fish). (C) Quantification of PCeV, MCeV, and MsV formation at 96 hpf. PCeV formation was severely compromised in vegfab-/-;vegfd-/- larvae compared to the corresponding single mutants. At this stage, MsV, but not MCeV, formation was mildly affected in vegfab;vegfd double mutants compared to the corresponding single mutants. Data are means ± SD.
Figure 3 with 1 supplement
Multiple Vegf ligands function redundantly to drive mCP vascularization.
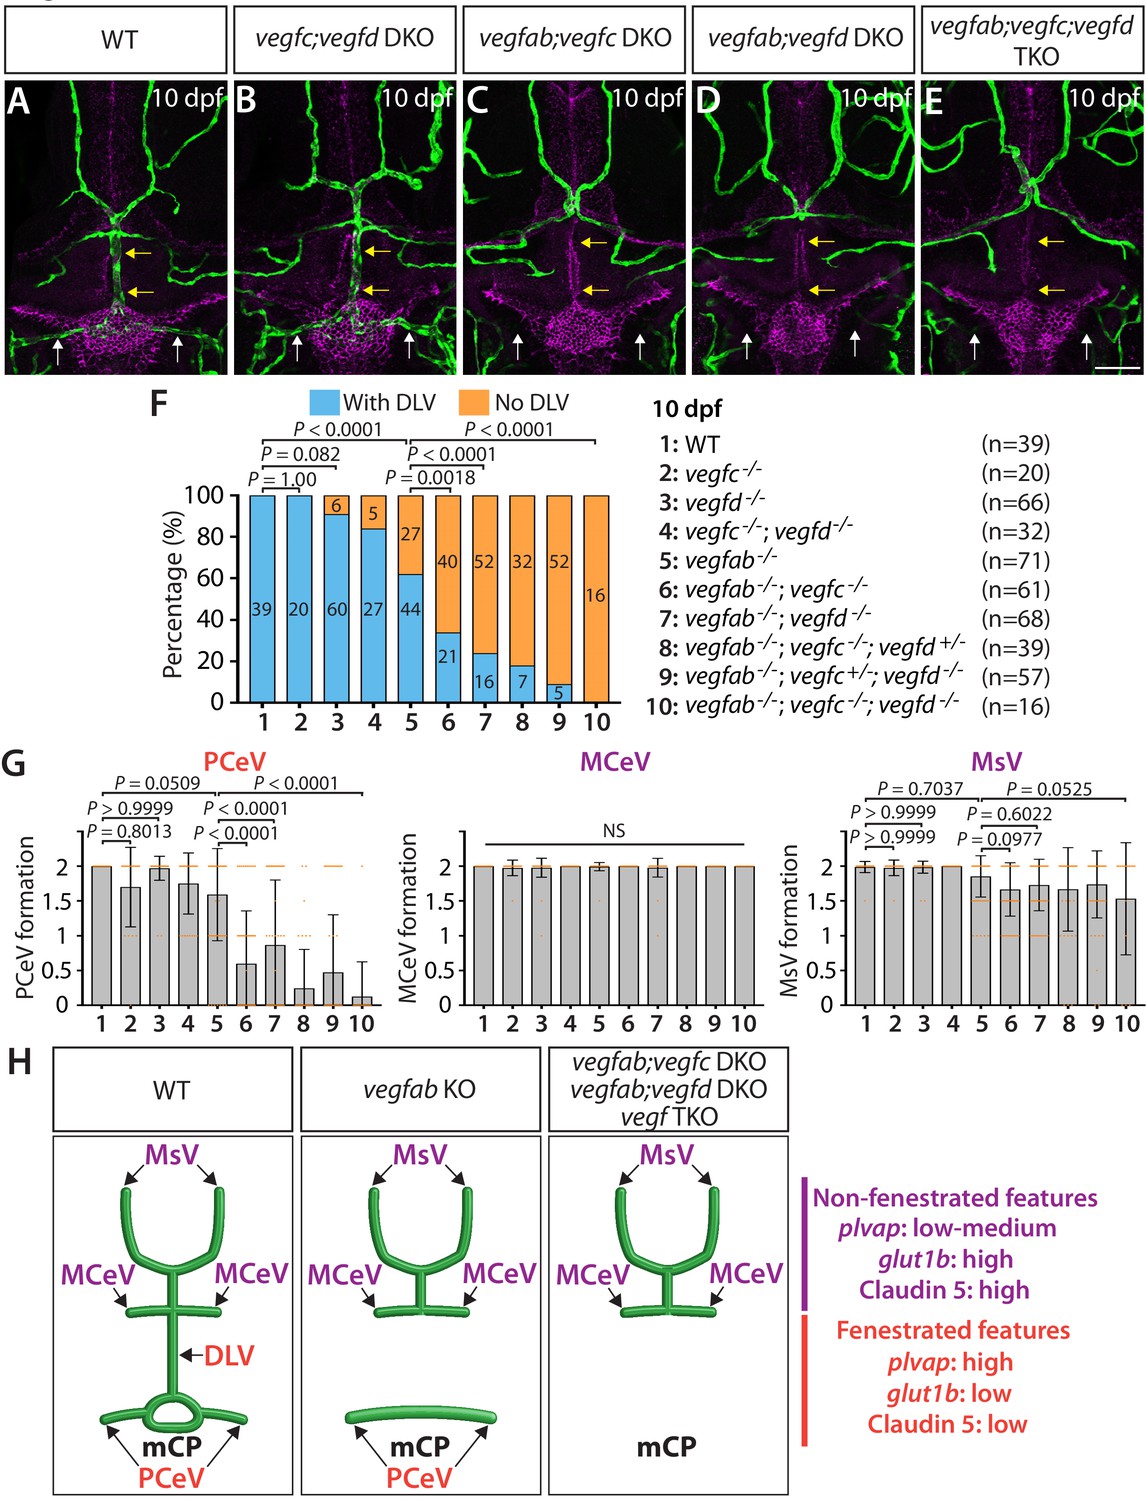
(A–E) Dorsal views of 10 dpf WT (A), vegfc-/-;vegfd-/- (vegfc;vegfd DKO, B), vegfab-/-;vegfc-/- (vegfab;vegfc DKO, C), vegfab-/-;vegfd-/- (vegfab;vegfd DKO, D), and vegfab-/-;vegfc-/-;vegfd-/- (vegfab;vegfc;vegfd TKO, E) cranial vasculature visualized by Tg(kdrl:EGFP) expression and anti-Claudin-5 immunostaining (magenta) show specific losses of the DLV (yellow arrows) and PCeV (white arrows) in vegfab-/-;vegfc-/- (C), vegfab-/-;vegfd-/- (D), and vegfab-/-;vegfc-/-;vegfd-/- (E) larvae. (F) Percentage of 10 dpf fish of indicated genotype with and without the DLV (the number of the animals examined per genotype is listed in the panel). (G) Quantification of PCeV, MCeV, and MsV formation at 10 dpf. (H) Schematic representations of the dorsal view of 10 dpf WT, vegfab-/- (vegfab KO), vegfab-/-;vegfc-/- (vegfab;vegfc DKO), vegfab-/-;vegfd-/- (vegfab;vegfd DKO), and vegfab-/-;vegfc-/-;vegfd-/- (vegf TKO) cranial vasculature summarize the vascular phenotypes observed in these mutants. Genetic evidence shows that there are specific requirements for Vegfab/Vegfc/Vegfd-dependent angiogenesis involved in fenestrated mCP vascular development. Scale bar: 50 µm.
Figure 3—figure supplement 1
Developmental relationships between FGPs and mCP vasculature in WT, vegfab-/-, and vegfc-/-;vegfd-/- larvae.
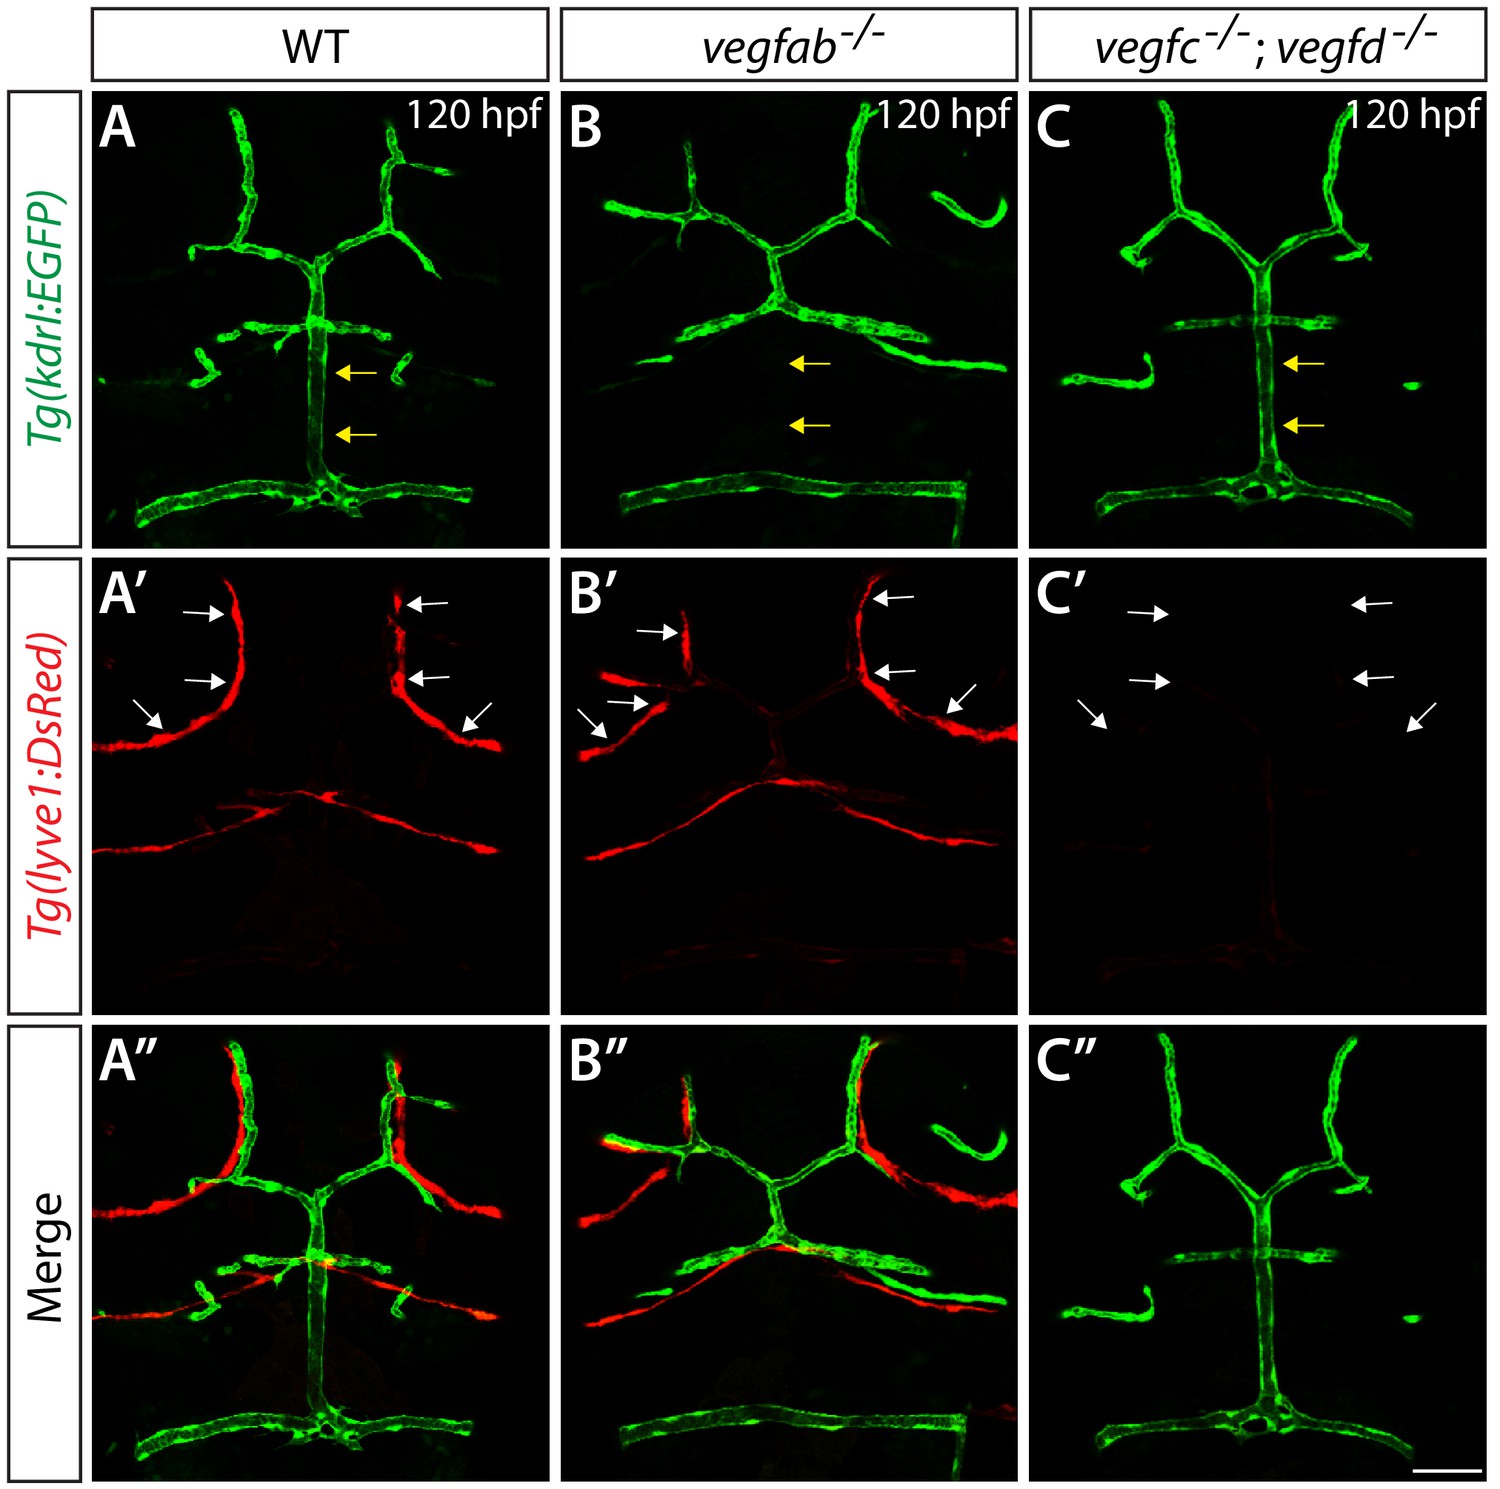
(A–C") Dorsal views of 120 hpf WT (A–A"), vegfab-/- (B–B"), and vegfc-/-;vegfd-/- (C–C") heads of larvae that carried the Tg(kdrl:EGFP) (A–C) and Tg(lyve1:DsRed) (A’–C’) transgenes (merged images shown in A"–C"). All of the vegfab-/- larvae that lacked the DLV (n = 7) formed FGPs in the dorsal surfaces of the brain meninges (B–B"), as observed in WT larvae (n = 13). In contrast, vegfc-/-;vegfd-/- larvae (C–C") that exhibited the complete loss of FGPs (n = 9) formed the DLV and PCeV, as observed in WT fish. Yellow arrows point to the DLV and white arrows to the FGPs. Scale bar: 50 µm.
Figure 4
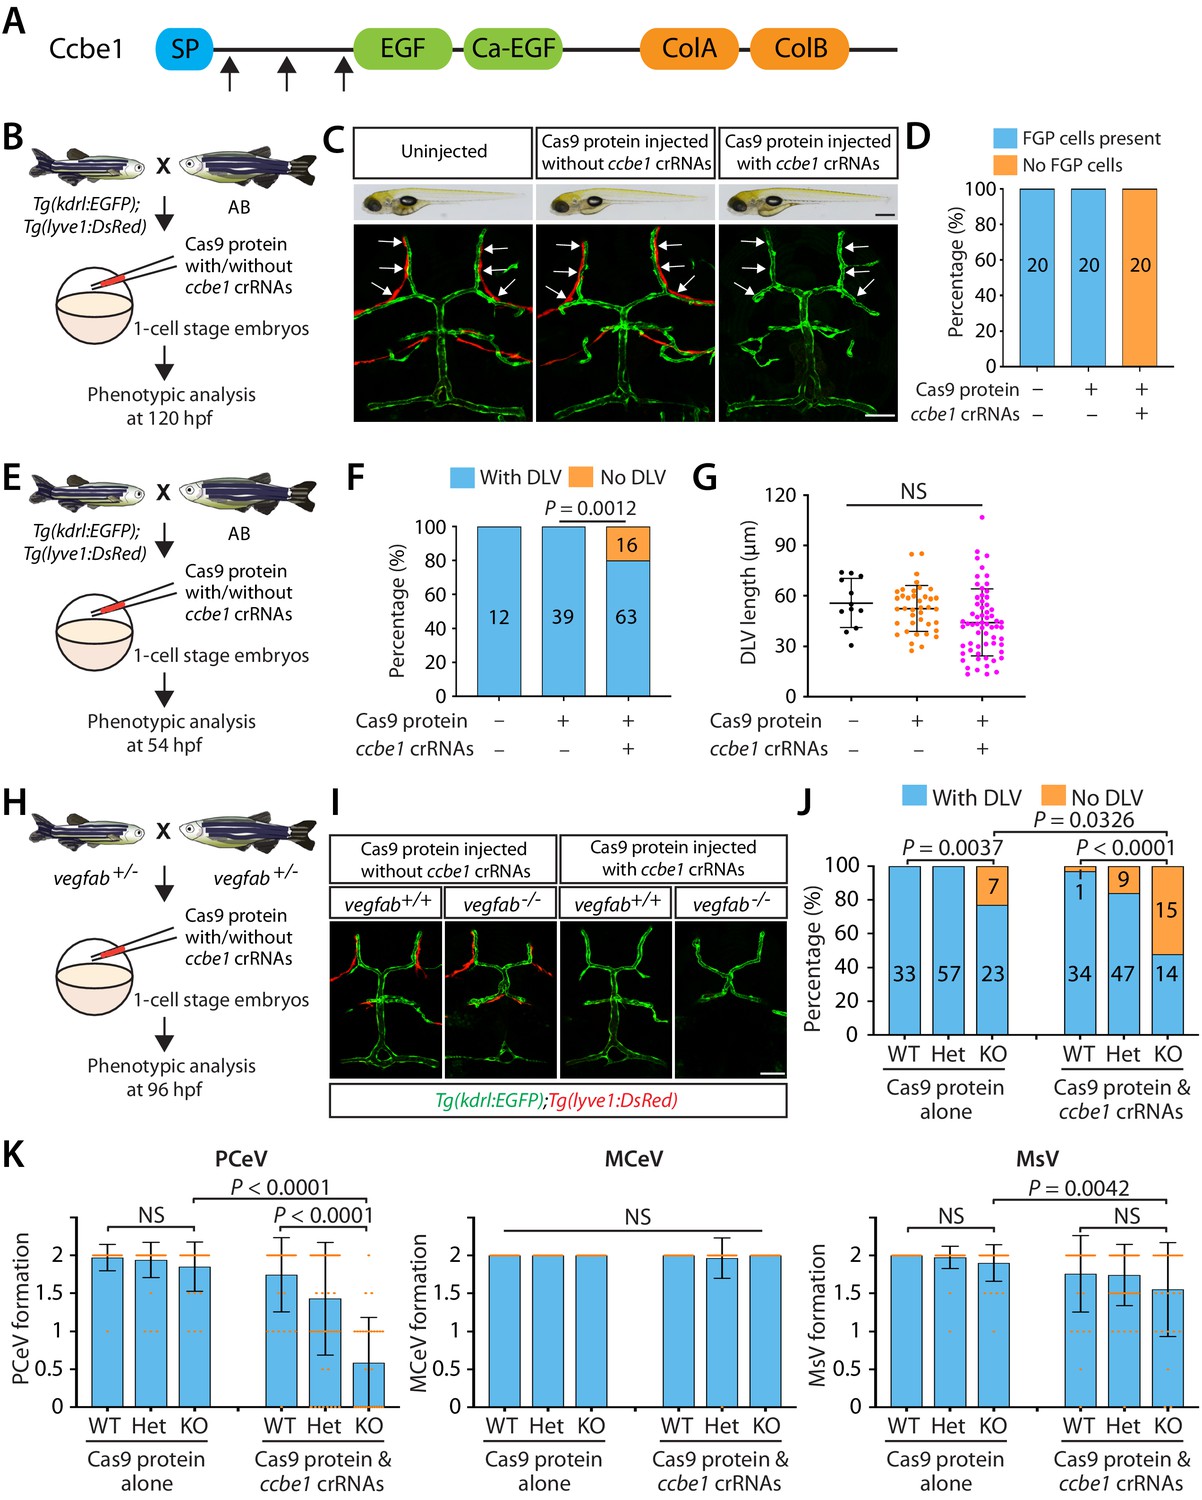
Combined genetic inactivation of ccbe1 and vegfab leads to significantly enhanced defects in DLV and PCeV formation.
(A) Predicted domain structure of zebrafish Ccbe1. Ccbe1 consists of a signal peptide (SP), an EGF domain, a calcium-binding EGF domain (Ca-EGF), and two collagen repeat domains (ColA and ColB). Arrows indicate the approximate positions of the protein sequences corresponding to the target sequences of the three designed CRISPR RNA (crRNA). (B) Experimental flows of the microinjection experiments for panels (C and D). Injection cocktails containing Cas9 protein with or without the three ccbe1 crRNA:tracrRNA duplex complexes were injected into one-cell stage embryos produced from Tg(kdrl:EGFP);Tg(lyve1:DsRed) fish crossed with wild-type AB counterparts. Injected progeny were analyzed at 120 hpf for the presence or absence of Tg(lyve1:DsRed)+ FGPs in the dorsal meningeal surfaces of the optic tectum. (C) Brightfield and confocal images of 120 hpf Tg(kdrl:EGFP);Tg(lyve1:DsRed) larvae after no injection or Cas9 protein injection with and without the three ccbe1 crRNA:tracrRNA complexes. Although the larvae injected with the ccbe1 crRNA ribonucleoprotein (RNP) complexes exhibited no apparent differences in their gross morphology compared to uninjected and Cas9 injected controls, they completely lacked Tg(lyve1:DsRed)+ FGPs (white arrows) in the dorsal meningeal surfaces of the optic tectum. (D) Percentage of 120 hpf larvae of indicated treatment with and without Tg(lyve1:DsRed)+ FGPs in the dorsal meningeal surfaces of the optic tectum (n = 20 animals examined for each group). (E) Experimental flows of the microinjection experiments for panel (F and G). (F) Percentage of 54 hpf larvae of indicated treatment with and without the DLV (the number of the animals examined per treatment is listed in the panel). A significant fraction of the embryos injected with the ccbe1 crRNA RNP complexes lacked the DLV at this stage. (G) Quantification of DLV lengths of the fish of indicated treatment that formed the DLV at 54 hpf. (H) Experimental flows of the microinjection experiments for panels (I–K). (I) Dorsal views of 96 hpf vegfab+/+ and vegfab-/- larvae that carried Tg(kdrl:EGFP) and Tg(lyve1:DsRed) transgenes after Cas9 protein injection with and without the three ccbe1 crRNA:tracrRNA complexes. While control solution injected vegfab+/+ and vegfab-/- larvae formed Tg(lyve1:DsRed)+ FGPs in the dorsal surfaces of the brain meninges, those injected with the ccbe1 crRNA RNP complexes completely lacked FGPs regardless of vegfab genotypes. A significant fraction of vegfab-/- larvae in both injection groups exhibited the ‘No DLV’ phenotype. (J) Percentage of 96 hpf larvae of indicated genotype and treatment with and without the DLV (the number of the animals examined per genotype is listed in the panel). vegfab-/- larvae injected with the ccbe1 crRNA RNP complexes displayed a markedly increased penetrance of the ‘No DLV’ phenotype. (K) Quantification of PCeV, MCeV, and MsV formation at 96 hpf. vegfab-/- larvae injected with the Cas9 control solution as well as vegfab+/+ larvae injected with the ccbe1 crRNA RNP complexes did not exhibit a defect in PCeV formation. However, vegfab-/- larvae injected with the ccbe1 crRNA RNP complexes exhibited severe defects in PCeV formation. Scale bars: 50 μm in (C) (fluorescence image), (J); 1 mm in (C) (brightfield image).
-
Figure 4—source data 1
Quantifications of DLV lengths and the ‘No DLV’ phenotype in 54 hpf ccbe1 RNP-injected embryos and their sibling controls.
- https://cdn.elifesciences.org/articles/64295/elife-64295-fig4-data1-v2.xlsx
Figure 5 with 1 supplement
Expression analysis of endothelial markers for the fenestrated and BBB states in WT, vegfab, vegfc, and vegfd mutants.
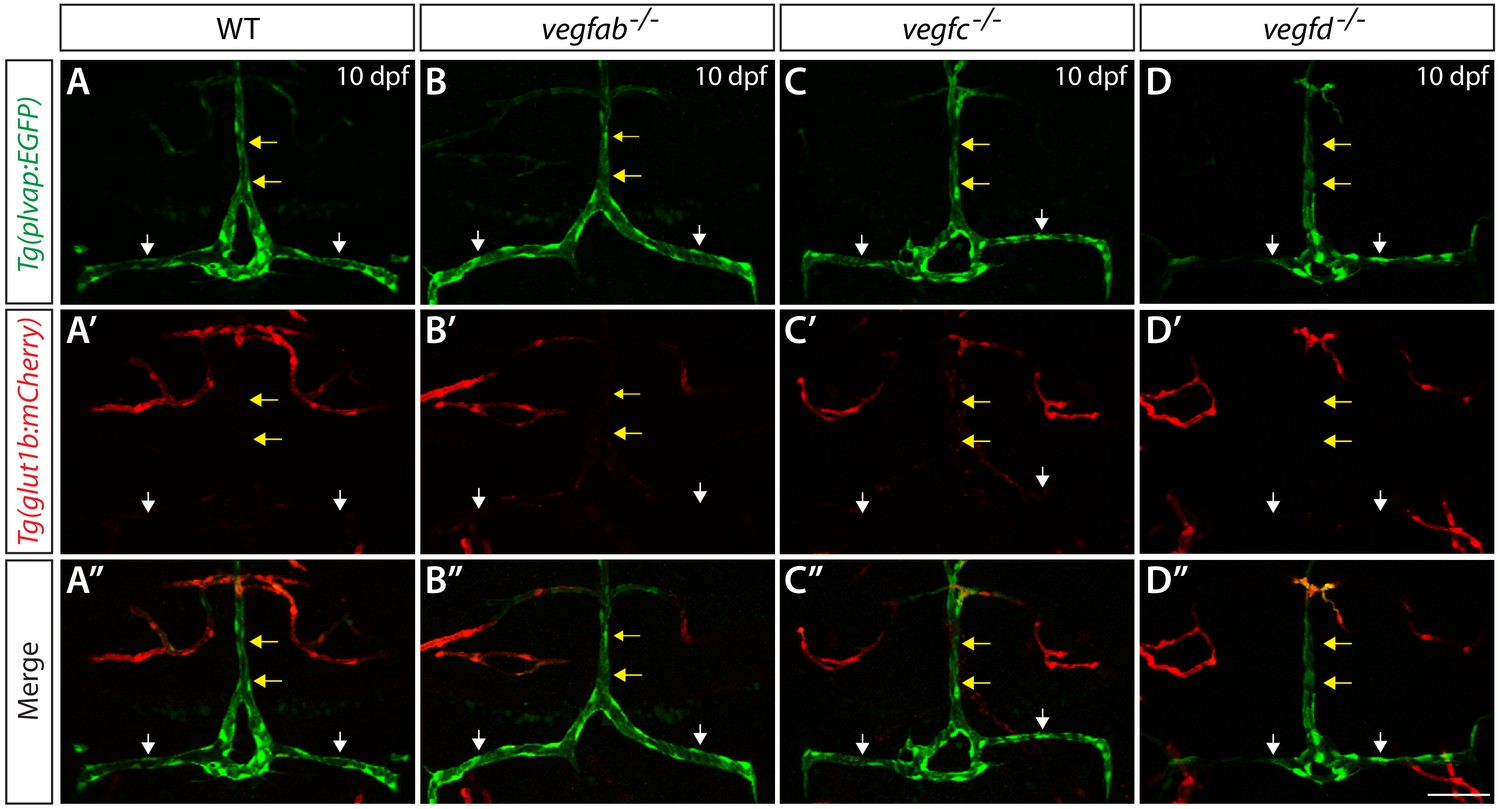
Dorsal views of 10 dpf WT (A–A"), vegfab-/- (B–B"), vegfc-/- (C–C"), and vegfd-/- (D–D") heads of the larvae that carried the Tg(plvap:EGFP) (A–D) and Tg(glut1b:mCherry) (A’–D’) transgenes (merged images shown in A"–D"). Only the vegfab-/-, vegfc-/-, and vegfd-/- larvae that formed the DLV and PCeV were subjected to this analysis. High levels of Tg(plvap:EGFP), but low levels of Tg(glut1b:mCherry), expression were observed in the DLV and PCeV of WT fish (A–A’, n = 24). The expression patterns of the Tg(plvap:EGFP) and Tg(glut1b:mCherry) transgenes were not altered in any of the single mutants (n = 9 for vegfab-/-, n = 4 for vegfc-/-, and n = 4 for vegfd-/- fish). Yellow arrows point to the DLV and white arrows to the PCeV. Scale bar: 50 μm.
Figure 5—figure supplement 1
Analysis of Claudin-5 protein expression in the mCP vasculature of vegf single and double mutants.
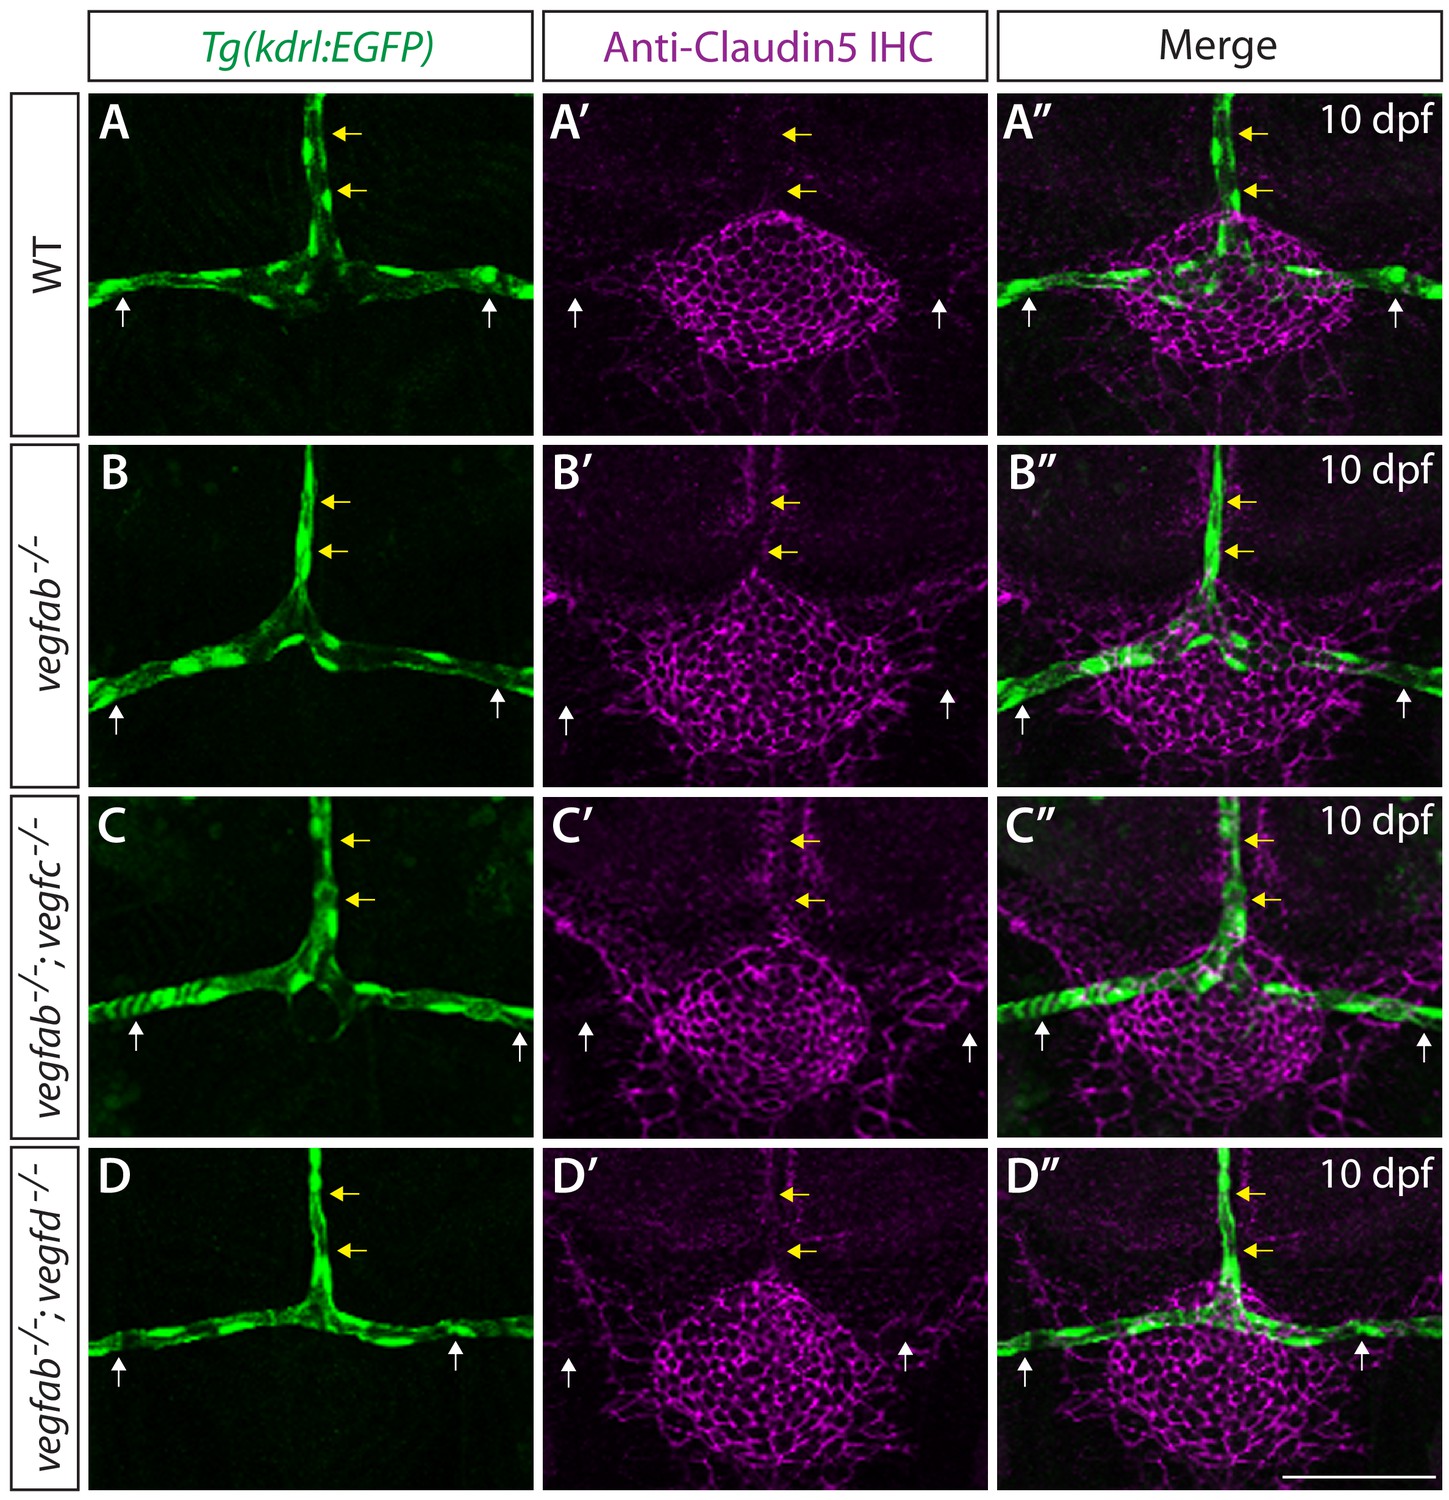
(A–D") Magnified views of 10 dpf WT (A–A"), vegfab-/- (B–B"), vegfab-/-;vegfc-/- (C–C"), and vegfab-/-;vegfd-/- (D–D") larvae carrying the Tg(kdrl:EGFP) transgene that were immunostained for GFP and Claudin-5 (magenta). In 10 WT fish, Claudin-5 immunoreactivity is prominent in mCP epithelial cells and weakly present in the tissues located ventrally to the DLV and PCeV but is barely detectable in the DLV and PCeV (A–A’). No obvious differences were observed in this low level of Claudin-5 expression in these vessels between WT and any of the vegfab-/-, vegfab-/-;vegfc-/-, and vegfab-/-;vegfd-/- larvae that formed these vessels (B–D"). Yellow arrows point to the DLV and white arrows to the PCeV. The number of the animals examined was: n = 65 for WT, n = 50 for vegfab-/-, n = 26 for vegfab-/-;vegfc-/-, and, n = 24 for vegfab-/-;vegfd-/- fish. Scale bar: 50 μm.
Figure 6 with 5 supplements
Expression analyses of vegfab, vegfc, and vegfd during mCP vascularization.
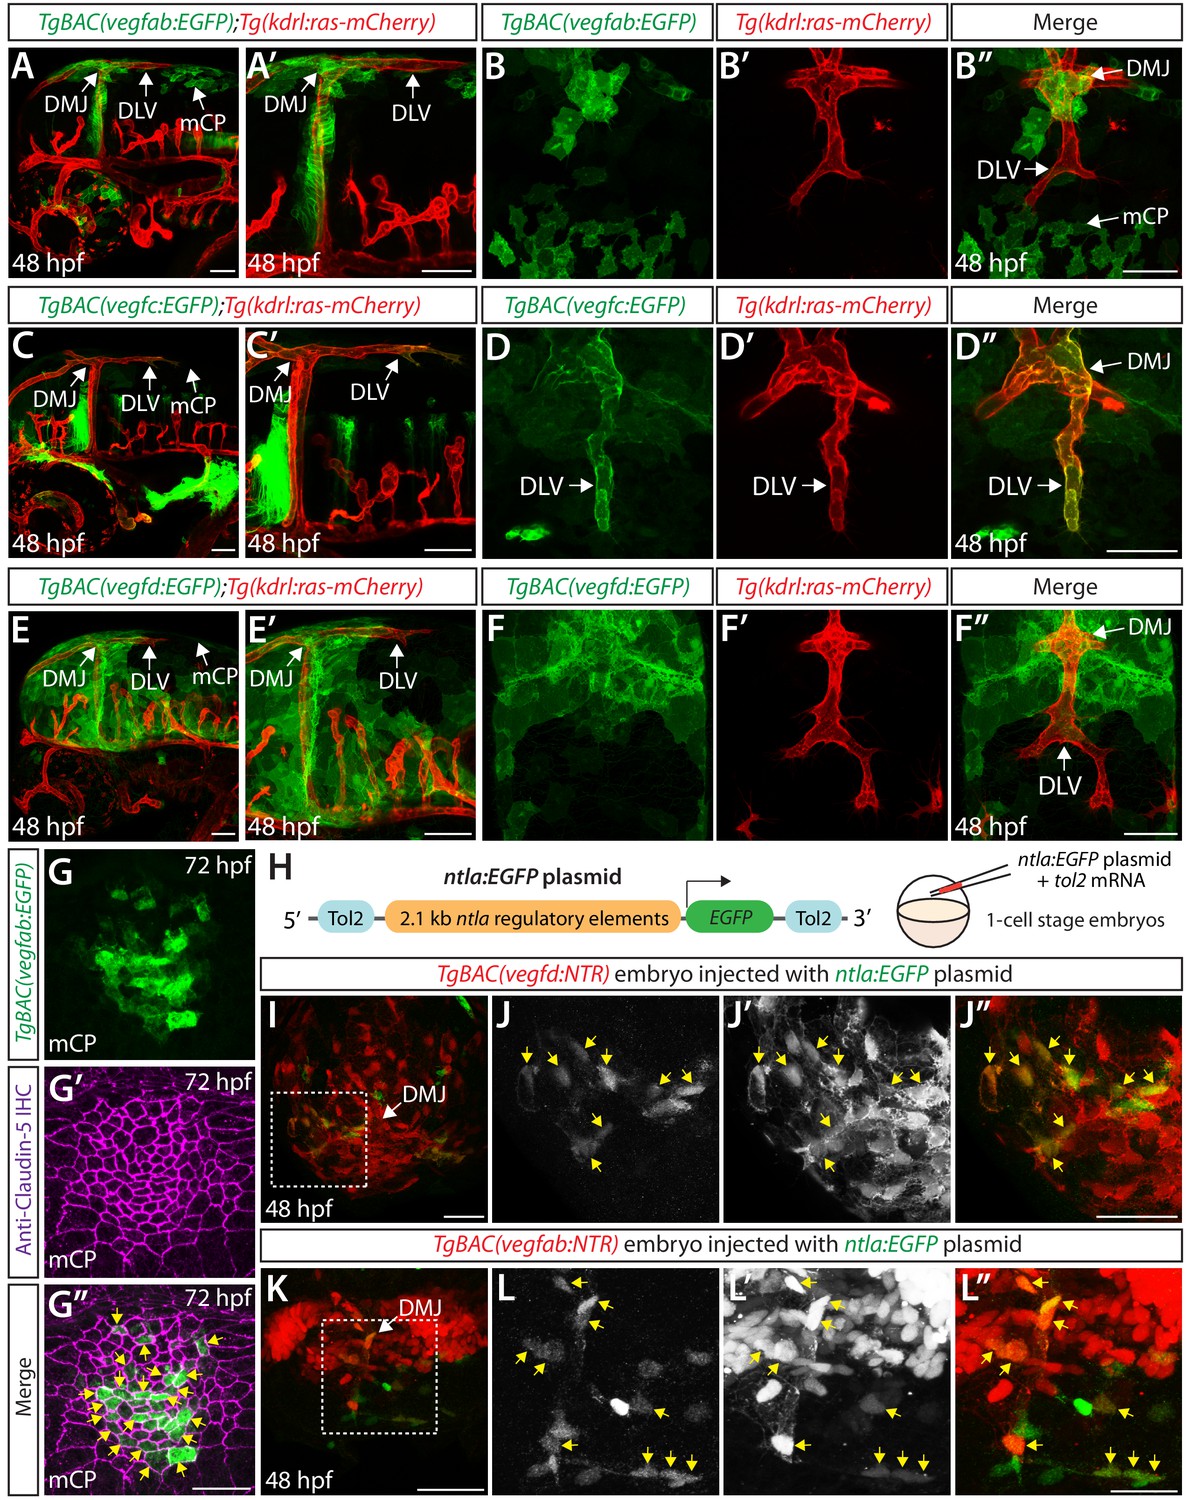
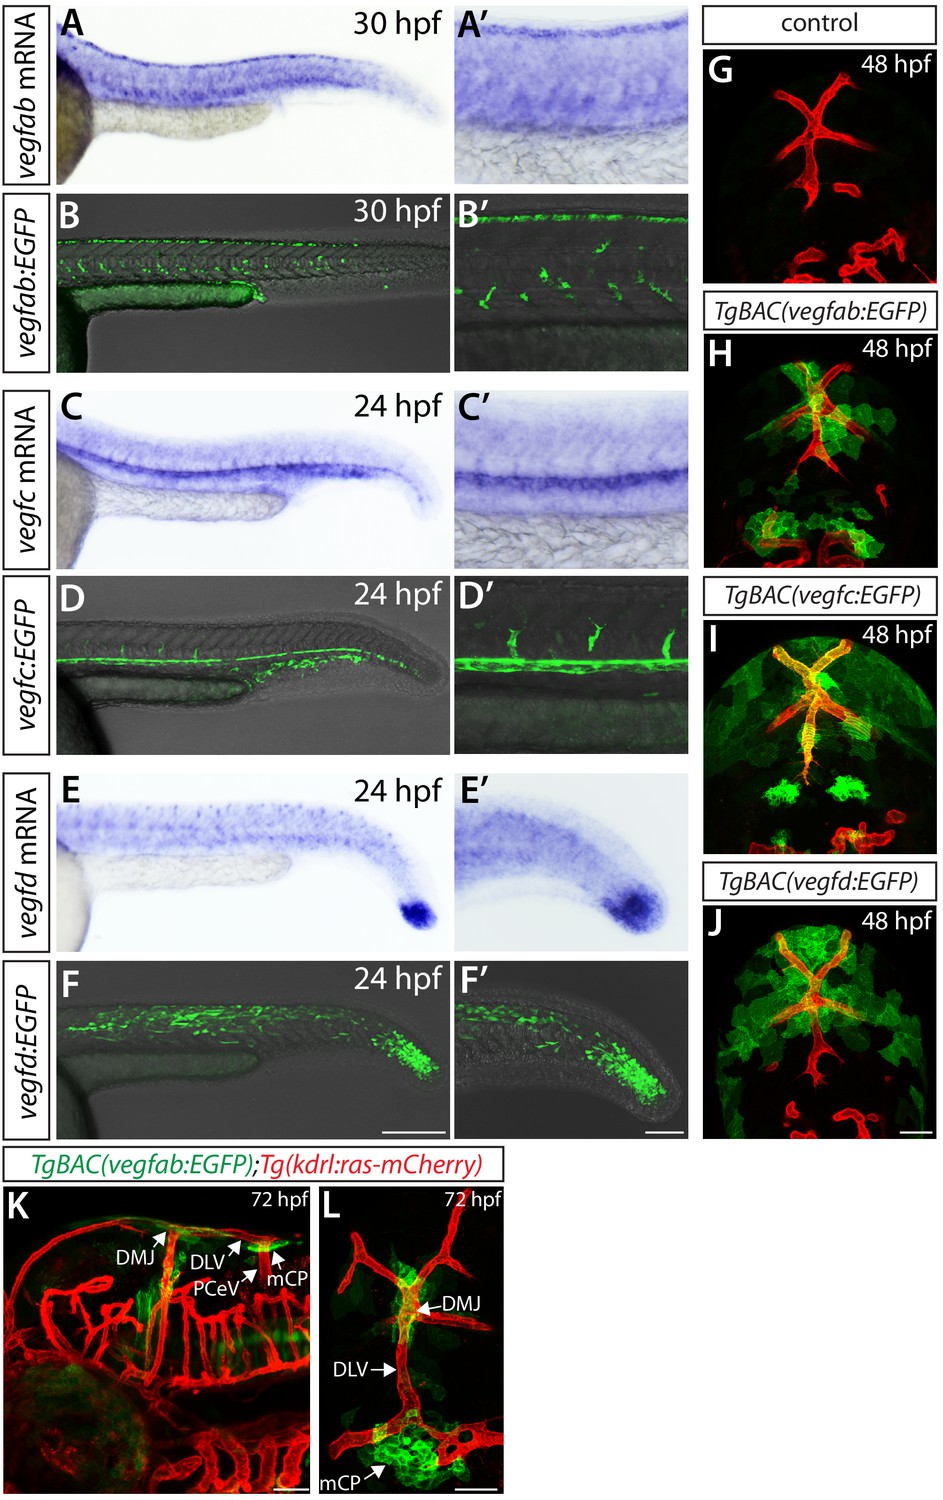
(A, A’ and B–B") Lateral (A and A’) and dorsal (B–B") views of 48 hpf TgBAC(vegfab:EGFP);Tg(kdrl:ras-mCherry) embryos, showing TgBAC(vegfab:EGFP) expression in the dorsal midline junction (DMJ) and mCP regions. TgBAC(vegfab:EGFP) expression was not observed in the extending DLV (B–B"). (C, C’ and D–D") Lateral (C and C’) and dorsal (D–D") views of 48 hpf TgBAC(vegfc:EGFP);Tg(kdrl:ras-mCherry) embryos, showing TgBAC(vegfc:EGFP) expression in the endothelial cells that comprise the DLV (D–D"). (E, E’ and F–F") Lateral (E and E’) and dorsal (F–F") views of 48 hpf TgBAC(vegfd:EGFP);Tg(kdrl:ras-mCherry) embryos, showing TgBAC(vegfd:EGFP) expression in the meninges and DMJ. TgBAC(vegfd:EGFP) expression was not observed in the extending DLV (F–F"). (G–G") Dorsal views of a 72 hpf TgBAC(vegfab:EGFP) larva immunostained for Claudin-5 (magenta). Magnified images of the mCP region are shown. Yellow arrows indicate EGFP+ and Claudin-5+ mCP epithelial cells. (H) Schematic of the ntla:EGFP construct used for injection experiments (I–L"). (I–L") Dorsal views of 48 hpf TgBAC(vegfd:NTR) (I–J") and TgBAC(vegfab:NTR) (K–L") head of embryos that were injected with the ntla:EGFP construct at the one-cell stage. Magnified images of the boxed area in (I) and (K) are shown in (J–J") and (L–L"), respectively. Most of the EGFP+ cells (J and L) were co-localized with NTR-mCherry+ meningeal cells (J’ and L’) in TgBAC(vegfd:NTR) (J–J") and TgBAC(vegfab:NTR) (L–L") embryos. Yellow arrows point to the co-localized cells (n = 3 embryos, 18 co-localized cells observed for TgBAC(vegfd:NTR); n = 3 embryos, 19 co-localized cells observed for TgBAC(vegfab:NTR)). Scale bars: 50 μm in (A–F"), (I), (J"), (K); 25 μm in (G", L").
Figure 6—figure supplement 1
Validation and expression analyses of distinct vegf BAC transgenic lines.
(A–F’) Endogenous mRNA transcripts of vegfab (A and A’), vegfc (C and C’), and vegfd (E and E’) at the indicated embryonic stages were detected by in situ hybridization. Lateral views of the EGFP expression patterns driven by the Tg(UAS:EGFP) embryo carrying the TgBAC(vegfab:gal4ff) (B and B’), TgBAC(vegfc:gal4ff) (D and D’), or TgBAC(vegfd:gal4ff) (F and F’) transgene. The EGFP expression patterns driven by each of the BAC transgenic lines closely matched those of the corresponding endogenous mRNA. (G–J) Dorsal views of 48 hpf Tg(kdrl:ras-mCherry) embryos with no additional gene (G) or carrying the TgBAC(vegfab:EGFP) (H), TgBAC(vegc:EGFP) (I), or TgBAC(vegd:EGFP) (J) transgene. No detectable auto-fluorescence was observed in the control embryo (G) under these microscopy settings. TgBAC(vegfab:EGFP), TgBAC(vegfc:EGFP), and TgBAC(vegfd:EGFP) expression was observed in dorsal meningeal surfaces and distinct cell types. (K and L) Lateral (K) and dorsal (L) views of 72 hpf TgBAC(vegfab:EGFP);Tg(kdrl:ras-mCherry) larvae, showing the TgBAC(vegfab:EGFP) expression in the DMJ and mCP. TgBAC(vegfab:EGFP) expression was not observed in the DLV. Scale bars: 200 μm in (F); 100 μm in (F’); 50 μm in (J), (K), (L).
Figure 6—figure supplement 2
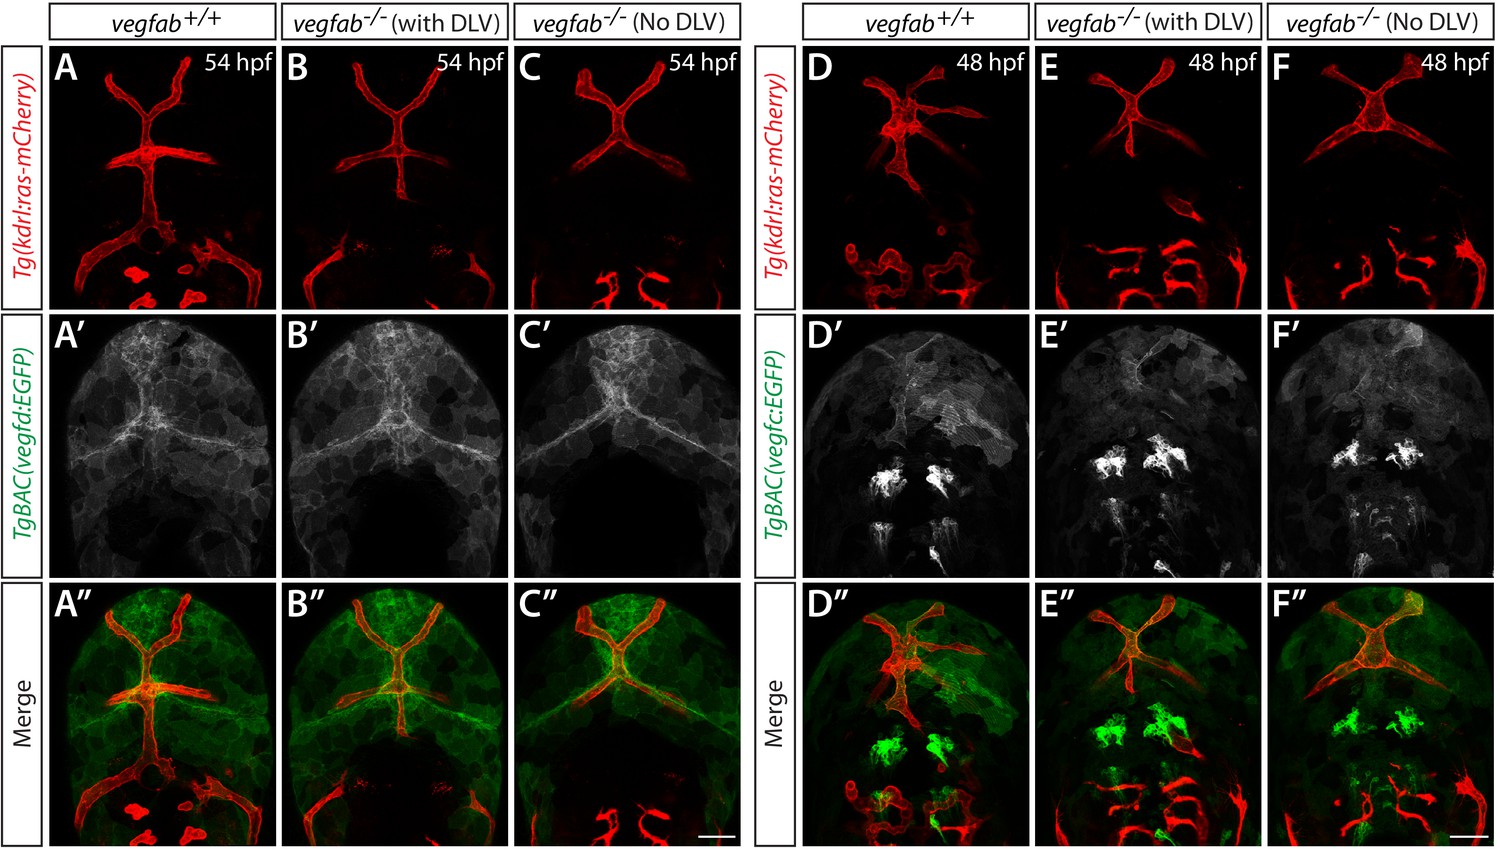
TgBAC(vegfd:EGFP) and TgBAC(vegfc:EGFP) expression patterns in WT and vegfab mutants which displayed the presence or absence of the DLV.
(A–C") Dorsal views of 54 hpf vegfab+/+ (A–A") and vegfab-/- (B–C") heads of embryos that carried the TgBAC(vegd:EGFP) and Tg(kdrl:ras-mCherry) transgenes. vegfab-/- embryos that exhibited the presence (B–B"), or absence (C–C"), of the DLV were examined. Overall TgBAC(vegd:EGFP) expression patterns and signal intensity did not apparently differ between vegfab+/+ (A’, n = 14) and vegfab-/- embryos regardless of the presence (B’, n = 7), or absence (C’, n = 4), of the DLV. (D–F") Dorsal views of 48 hpf vegfab+/+ (D–D") and vegfab-/- (E–F") heads of embryos that carried the TgBAC(vegc:EGFP) and Tg(kdrl:ras-mCherry) transgenes. vegfab-/- embryos that exhibited the presence (E–E"), or absence (F–F"), of the DLV were examined. Overall TgBAC(vegc:EGFP) expression patterns and signal intensity did not apparently differ between vegfab+/+ (D’, n = 3) and vegfab-/- embryos regardless of the presence (E’, n = 2), or absence (F’, n = 3), of the DLV. Scale bars: 50 μm.
Figure 6—figure supplement 3
Co-localization analyses in TgBAC(vegfab:NTR), TgBAC(vegfc:NTR), and TgBAC(vegfd:NTR) embryos that carried the Tg(sox10:EGFP) transgene.
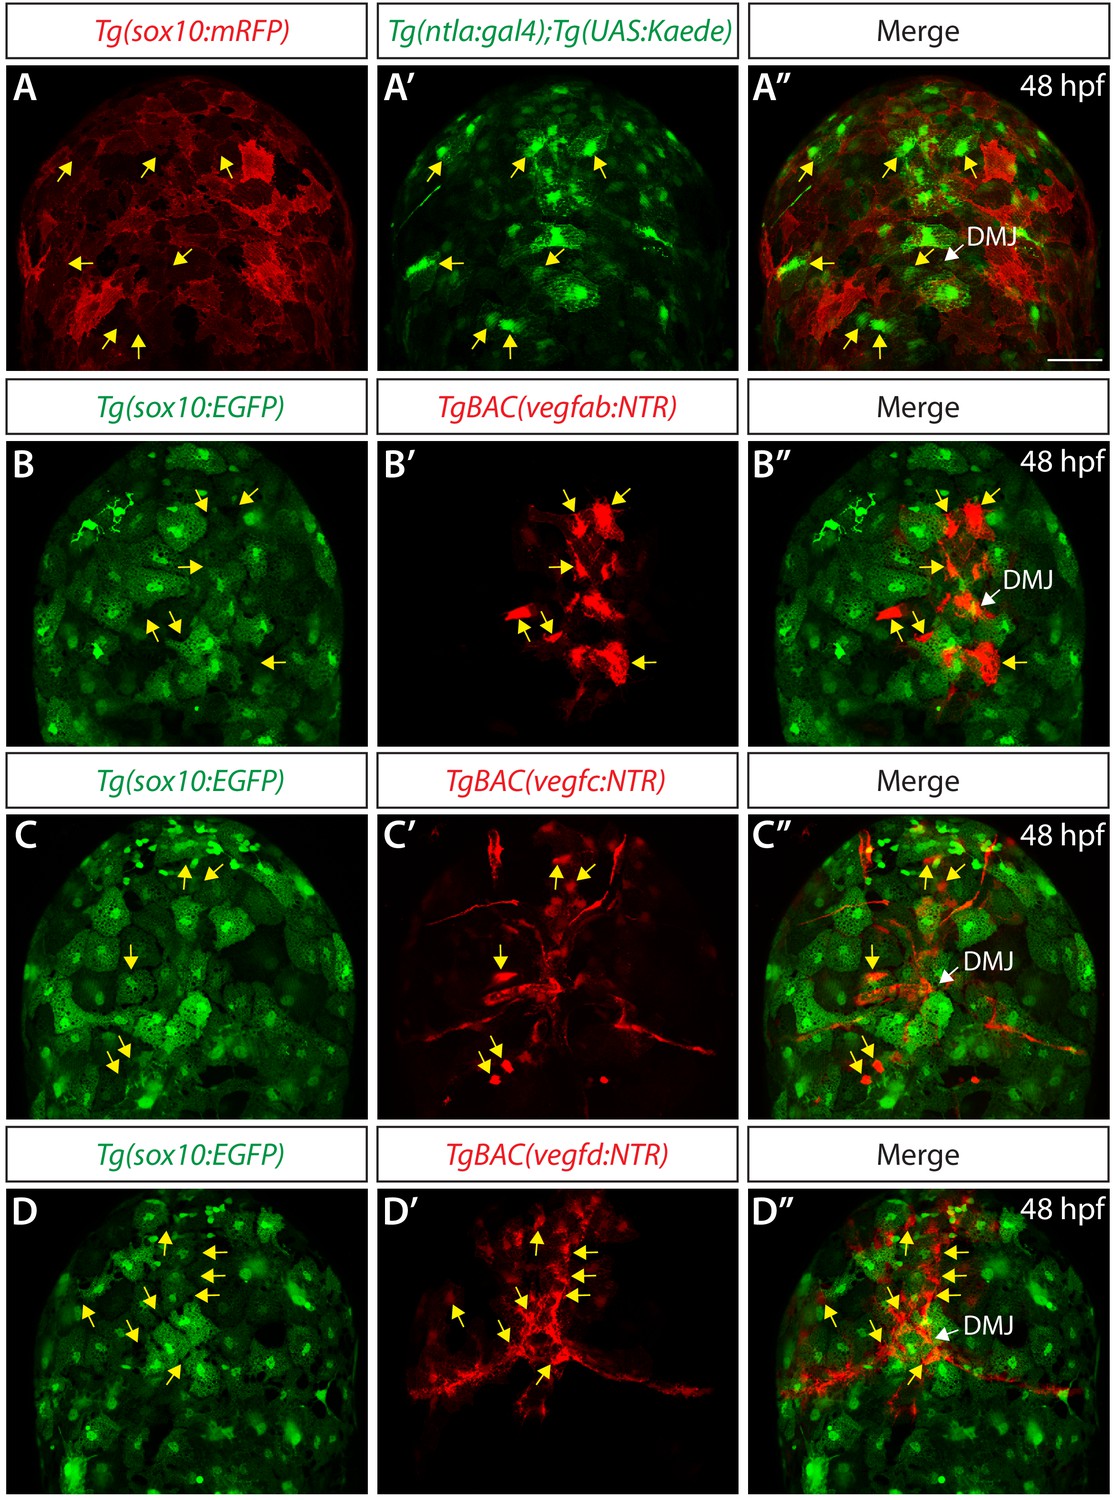
(A–A") Confocal maximum projection images of the dorsal views of a 48 hpf Tg(ntla:gal4);Tg(UAS:Kaede);Tg(sox10:mRFP) embryo, showing intermingled distribution of Kaede+ and mRFP+ meningeal cells (n = 7 embryos; 180 Tg(ntla:gal4);Tg(UAS:Kaede)+ cells examined; 1 cell co-localized with Tg(sox10:mRFP)+ cell). Yellow arrows point to some of the Kaede+ meningeal cells that were clearly not mRFP+ even on the maximum projection images. (B–B") Confocal maximum projection images of the dorsal views of a 48 hpf Tg(sox10:EGFP);TgBAC(vegfab:NTR) embryo, showing non-overlapping distribution of EGFP+ and NTR-mCherry+ meningeal cells (n = 12 embryos; 80 TgBAC(vegfab:NTR)+ cells examined; 2 cells co-localized with Tg(sox10:EGFP)+ cells). Yellow arrows point to some of the NTR-mCherry+ meningeal cells that were clearly not EGFP+ even on the maximum projection images. (C–C") Confocal maximum projection images of the dorsal views of a 48 hpf Tg(sox10:EGFP);TgBAC(vegfc:NTR) embryo, showing non-overlapping distribution of EGFP+ and NTR-mCherry+ meningeal cells (n = 4 embryos; 66 TgBAC(vegfc:NTR)+ cells examined; 0 cells co-localized with Tg(sox10:EGFP)+ cells). Yellow arrows point to some of the NTR-mCherry+ meningeal cells that were clearly not EGFP+ even on the maximum projection images. (D–D") Confocal maximum projection images of the dorsal views of a 48 hpf Tg(sox10:EGFP);TgBAC(vegfd:NTR) embryo, showing non-overlapping distribution of EGFP+ and NTR-mCherry+ meningeal cells (n = 4 embryos; 66 TgBAC(vegfd:NTR)+ cells examined; 2 cells co-localized with Tg(sox10:EGFP)+ cells). Yellow arrows point to some of the NTR-mCherry+ meningeal cells that were clearly not EGFP+ even on the maximum projection images. Scale bar: 50 μm.
Figure 6—figure supplement 4
Co-localization analyses in TgBAC(vegfab:NTR), TgBAC(vegfc:NTR), and TgBAC(vegfd:NTR) embryos carrying the Tg(mpeg1.1:Dendra2) transgene.
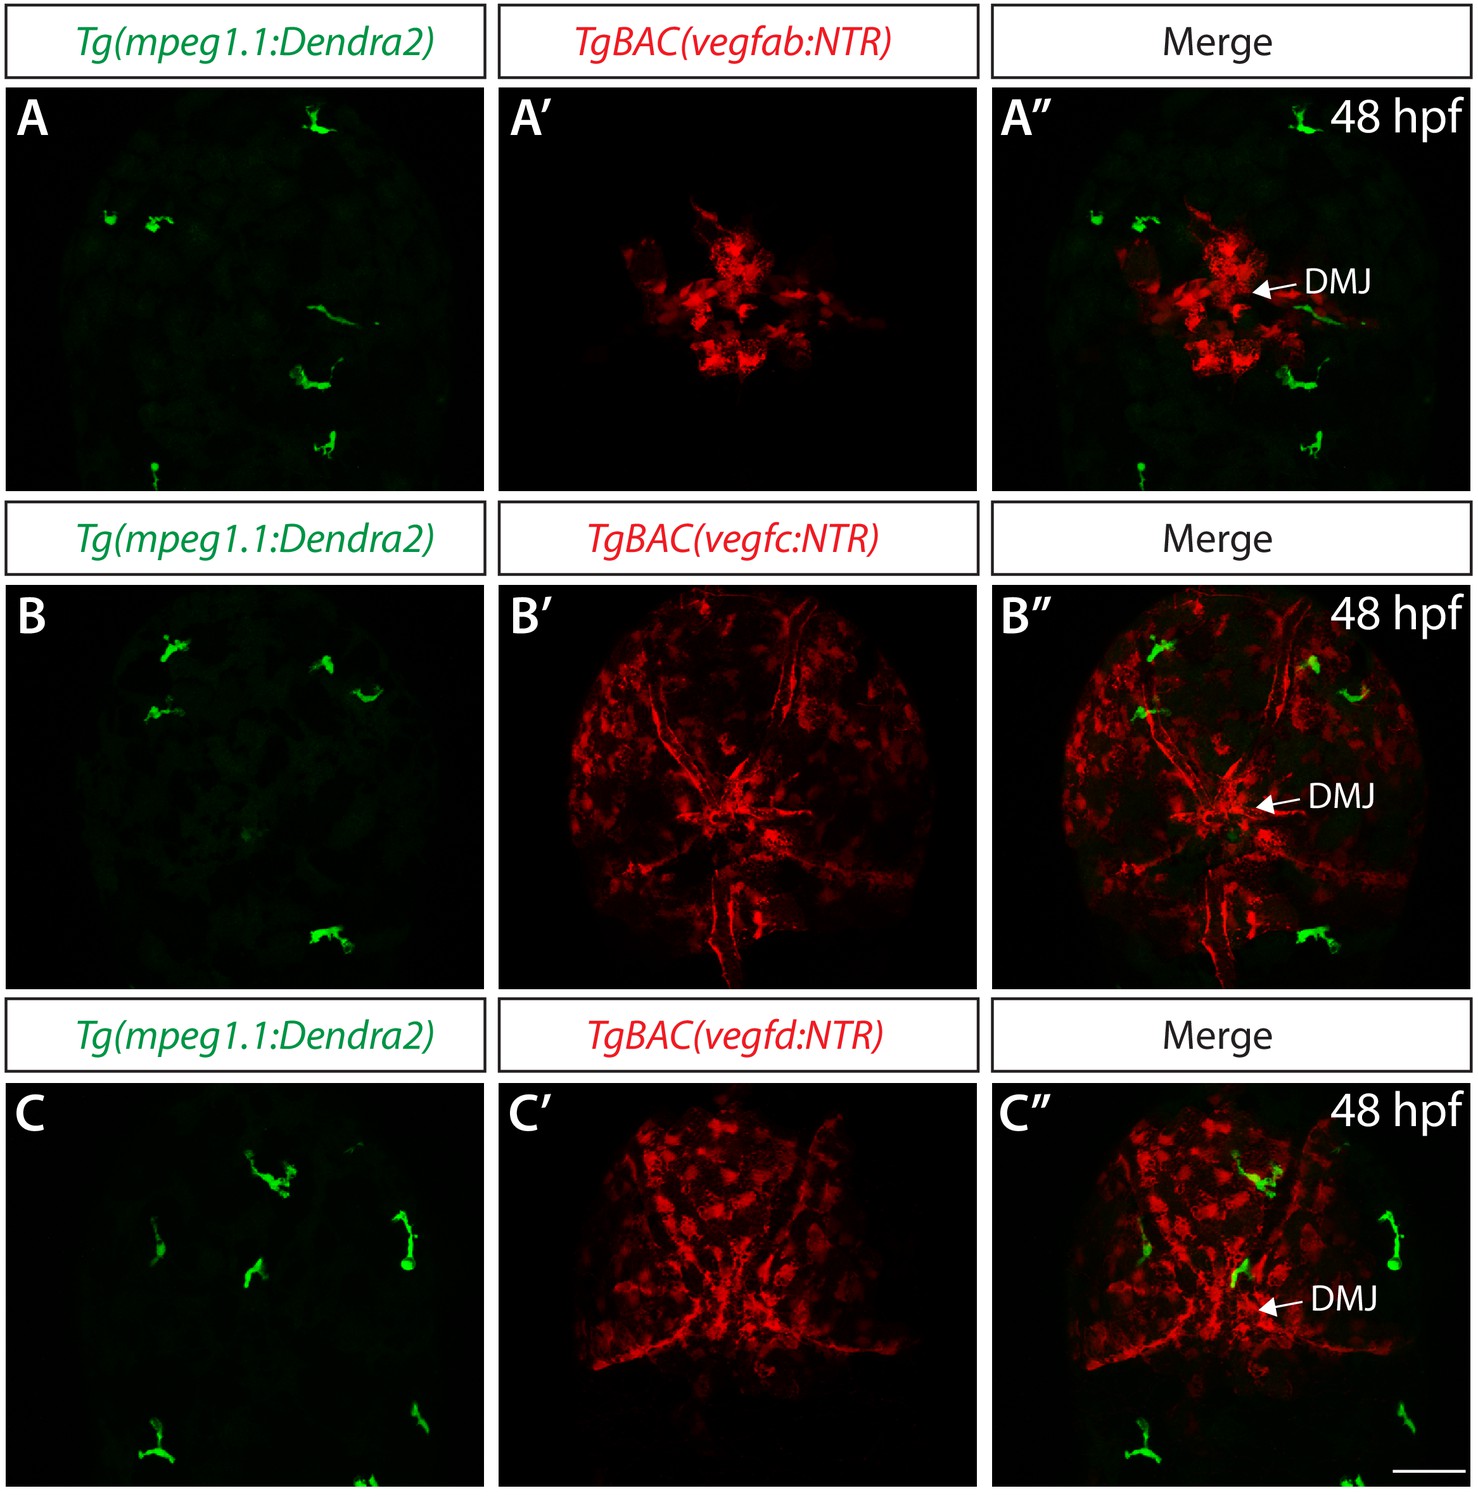
(A–A") Confocal maximum projection images of the dorsal views of a 48 hpf Tg(mpeg1.1:Dendra2);TgBAC(vegfab:NTR) embryo, showing non-overlapping distribution of EGFP+ and NTR-mCherry+ meningeal cells (n = 16 embryos; 89 Tg(mpeg1.1:Dendra2)+ cells examined; 0 cells co-localized with TgBAC(vegfab:NTR)+ cells). (B–B") Confocal maximum projection images of the dorsal views of a 48 hpf Tg(mpeg1.1:Dendra2);TgBAC(vegfc:NTR) embryo, showing non-overlapping distribution of EGFP+ and NTR-mCherry+ meningeal cells (n = 17 embryos; 95 Tg(mpeg1.1:Dendra2)+ cells examined; 0 cells co-localized with TgBAC(vegfc:NTR)+ cells). (C–C") Confocal maximum projection images of the dorsal views of a 48 hpf Tg(mpeg1.1:Dendra2);TgBAC(vegfd:NTR) embryo, showing non-overlapping distribution of EGFP+ and NTR-mCherry+ meningeal cells (n = 8 embryos; 39 Tg(mpeg1.1:Dendra2)+ cells examined; 0 cells co-localized with TgBAC(vegfd:NTR)+ cells). Scale bar: 50 μm.
Figure 6—figure supplement 5

Co-localization of the mesodermal cell marker and TgBAC(vegfc:NTR)+ meningeal cells, and close similarity in cell morphology between mesoderm-derived meningeal fibroblasts and vegf-expressing meningeal cells.
(A) Schematic of the ntla:EGFP construct used for injection experiments (B–E"). (B–E") Dorsal views of 48 hpf Tg(ntla:NTR) (B–C") and TgBAC(vegfc:NTR) (D–E") heads of embryos that were injected with the ntla:EGFP construct at the one-cell stage. Magnified images of the boxed area in (B) and (D) are shown in (C–C") and (E–E"), respectively. Most of the EGFP+ cells (C and E) were co-localized with NTR-mCherry+ meningeal cells (C’ and E’) in Tg(ntla:NTR) (C–C") and TgBAC(vegfc:NTR) (E–E") embryos. Yellow arrows point to the co-localized cells (n = 5 embryos, 71 co-localized cells observed for Tg(ntla:NTR); n = 3 embryos, 10 co-localized cells observed for TgBAC(vegfc:NTR)). (F–H) Dorsal magnified views of 48 hpf Tg(ntla:Gal4-VP16);Tg(UAS:EGFP-CAAX), abbreviated Tg(ntla:EGFP), TgBAC(vegfd:EGFP), and TgBAC(vegfab:EGFP) embryonic heads near the DMJ in the dorsal surfaces of the brain meninges. Close similarity in the morphology of the EGFP+ meningeal cells marked by each of the lines was observed. Scale bars: 50 μm in (B–E"); 25 μm in (H).
Figure 7
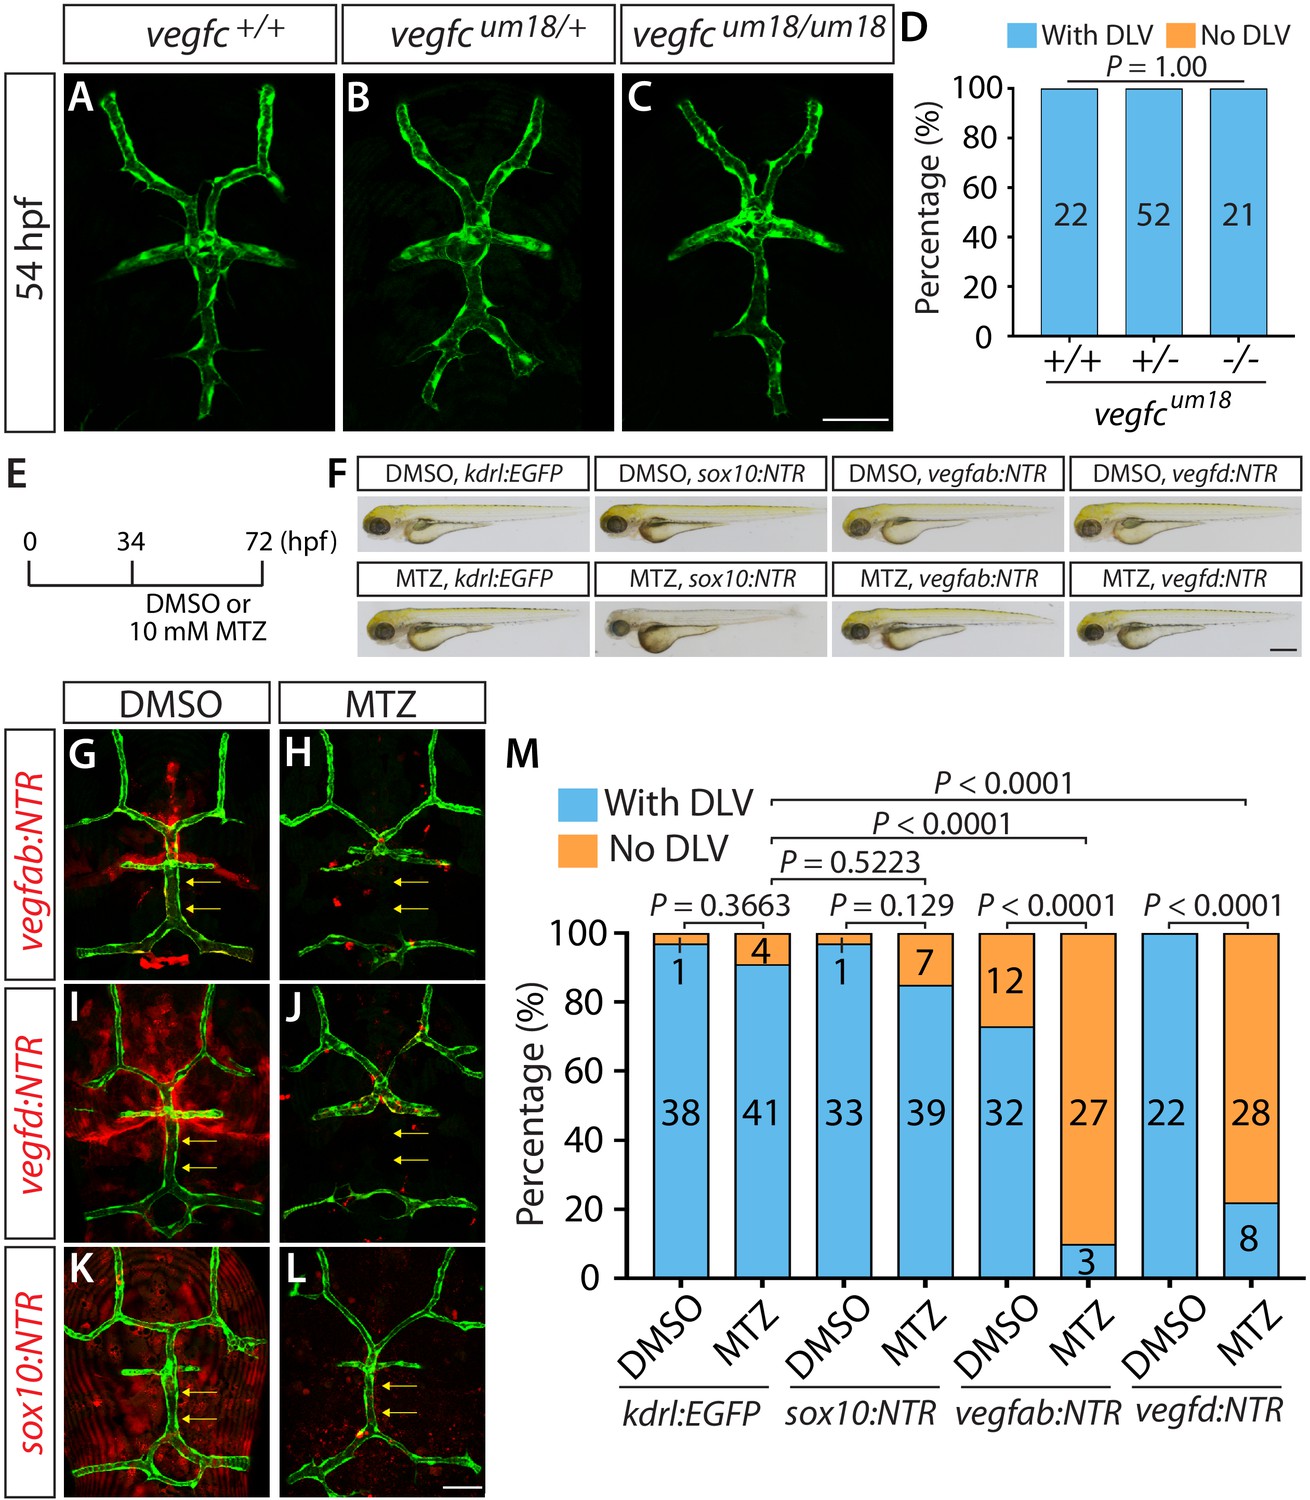
Endothelial-autonomous Vegfc and meningeal fibroblast-derived Vegfab and Vegfd are important for DLV formation.
(A–C) Dorsal views of 54 hpf vegfc+/+ (A), vegfcum18/+ (B), and vegfcum18/um18 (C) cranial vasculature visualized by Tg(kdrl:EGFP) expression. vegfcum18/um18 fish did not exhibit a defect in DLV formation (C) in contrast to the ‘No DLV’ phenotype found in vegfchu6410/hu6410 fish (Figure 1N). (D) Percentage of 54 hpf fish of indicated genotype with and without the DLV (n = 22 for vegfc+/+, n = 52 for vegfcum18/+, and n = 21 for vegfcum18/um18 fish). (E) Time course of the cell ablation experiments for panels (F–M). (F) Brightfield images of 72 hpf Tg(kdrl:EGFP), Tg(sox10:NTR), TgBAC(vegfab:NTR), and TgBAC(vegfd:NTR) larvae after treatment with DMSO or 10 mM Metronidazole (MTZ) from 34 to 72 hpf. (G–L) Dorsal views of 72 hpf Tg(kdrl:EGFP);TgBAC(vegfab:NTR) (G and H), Tg(kdrl:EGFP);TgBAC(vegfd:NTR) (I and J), and Tg(kdrl:EGFP);Tg(sox10:NTR) (K and L) cranial vasculature after treatment with DMSO (G, I, K) or MTZ (H, J, L) from 34 to 72 hpf. Efficient ablation of NTR-mCherry+ cells was observed after treatment with MTZ (H, J, L) compared to their respective DMSO-treated controls (G, I, K). MTZ-treated TgBAC(vegfab:NTR) and TgBAC(vegfd:NTR), but not Tg(sox10:NTR), larvae lacked the DLV (arrows). (M) Percentage of the indicated 72 hpf transgenic fish with and without the DLV after treatment with DMSO or MTZ (the number of the animals examined per each treatment group is listed in the graph). MTZ-treated TgBAC(vegfab:NTR) and TgBAC(vegfd:NTR) larvae exhibited a drastic increase in the ‘No DLV’ phenotype when compared to their corresponding DMSO treatment groups and the MTZ-treated Tg(kdrl:EGFP) larval group. In contrast, MTZ-treated Tg(kdrl:EGFP) and Tg(sox10:NTR) animals showed no significant differences compared to their corresponding DMSO treatment groups. Scale bars: 1 mm in (F); 50 μm in (C and L).
Figure 8
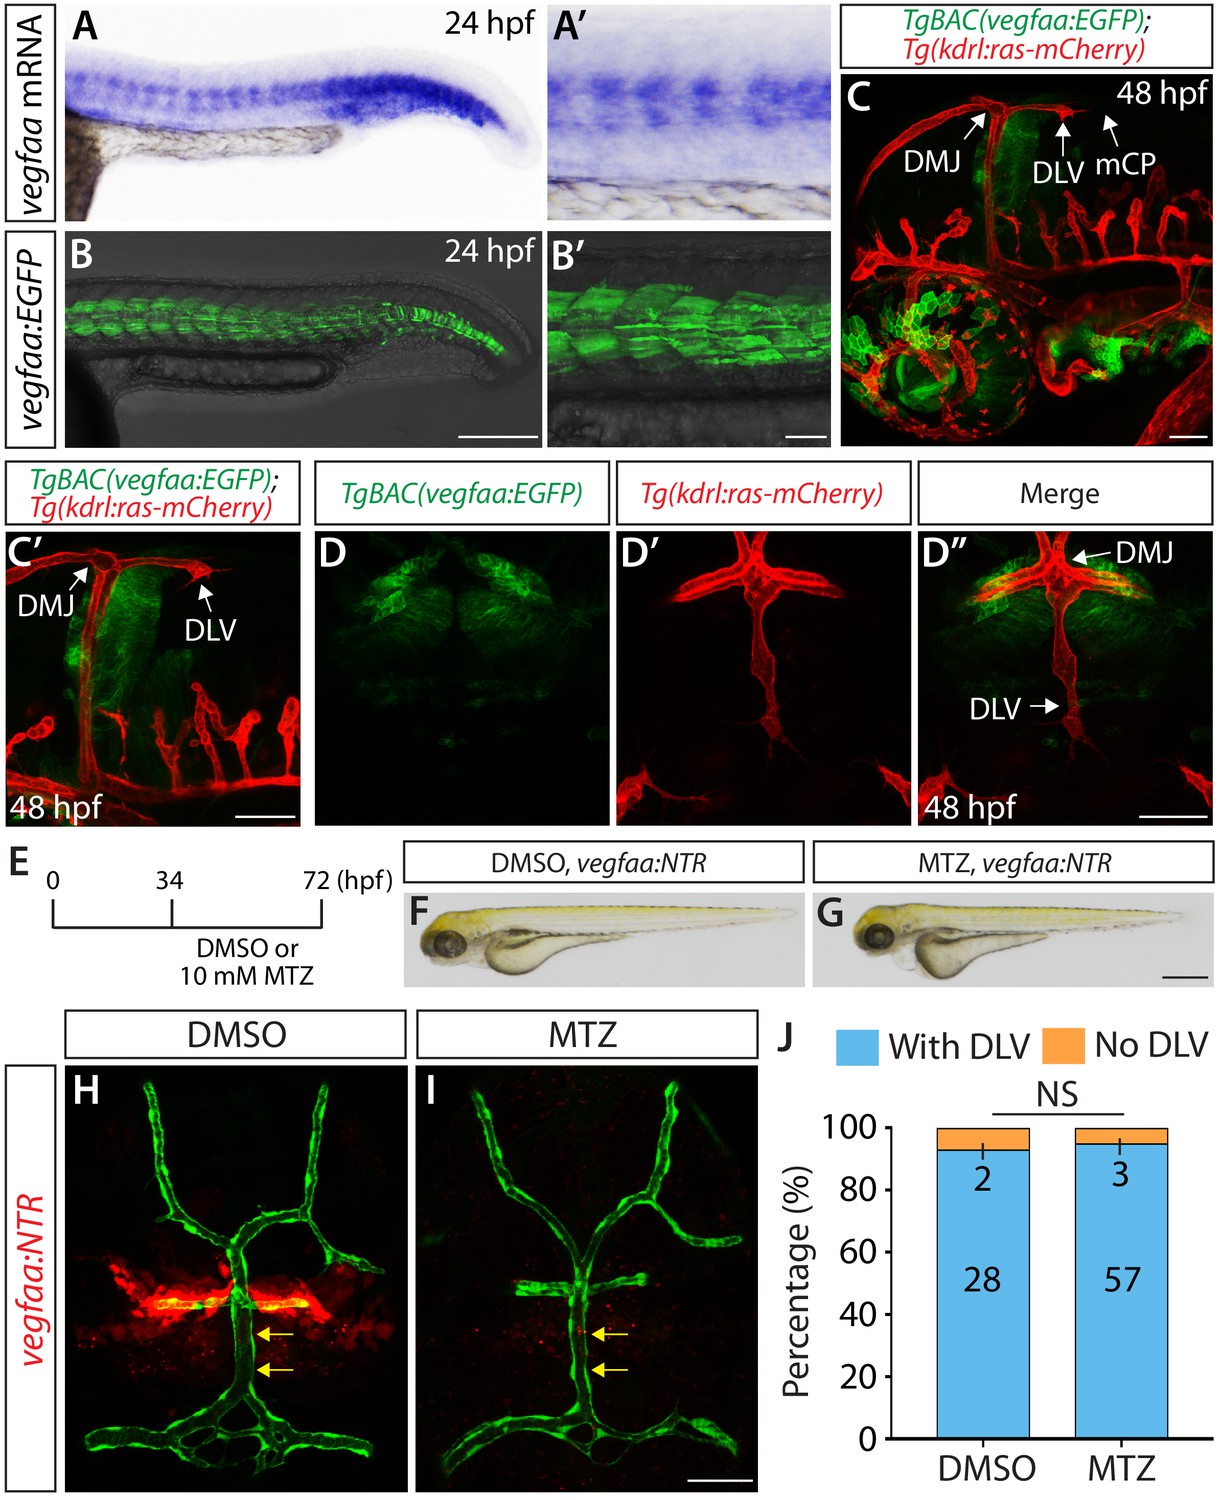
Expression patterns of vegfaa and its requirement for mCP vascular formation.
(A–B’) Lateral views of endogenous vegfaa mRNA expression patterns detected by in situ hybridization at 24 hpf (A and A’). Lateral views of the EGFP expression patterns driven by the Tg(UAS:EGFP) embryo carrying the TgBAC(vegfaa:gal4ff) transgene (B and B’). The EGFP expression domains closely matched the endogenous vegfaa mRNA expression patterns. (C, C’ and D–D") Lateral (C and C’) and dorsal (D–D") views of 48 hpf TgBAC(vegfaa:EGFP);Tg(kdrl:ras-mCherry) embryos, showing the TgBAC(vegfaa:EGFP) expression in the cells located ventrally to the DLV. TgBAC(vegfaa:EGFP) expression was not observed in the extending DLV or in the dorsal surfaces of the brain meninges. (E) Time course of the cell ablation experiments for panels (F–J). (F and G) Brightfield images of 72 hpf TgBAC(vegfaa:NTR) larvae after treatment with DMSO (F) or 10 mM MTZ (G) from 34 to 72 hpf. (H and I) Dorsal views of 72 hpf TgBAC(vegfaa:NTR) cranial vasculature visualized by Tg(kdrl:EGFP) expression after treatment with DMSO (H) or MTZ (I) from 34 to 72 hpf. Efficient ablation of NTR-mCherry+ cells was observed after treatment with MTZ (I) compared to the DMSO-treated control (H). MTZ-treated TgBAC(vegfaa:NTR) larvae formed the DLV (yellow arrows) and PCeV. (J) Percentage of the 72 hpf transgenic fish with and without the DLV after treatment with DMSO or MTZ. No significant difference was observed between MTZ-treated (n = 60) and DMSO-treated (n = 30) groups. Scale bars: 1 mm in (G); 200 μm in (B); 100 μm in (B’); 50 μm in (C), (C’), (D’ and I).
Tables
Key resources table
| Reagent type (species) or resource | Designation | Source or reference | Identifiers | Additional information |
|---|---|---|---|---|
| Genetic reagent (Danio rerio) | Tg(kdrl:EGFP)s843 | Jin et al., 2005 | ZFIN: s843 | |
| Genetic reagent (Danio rerio) | Tg(kdrl:Has.HRAS-mcherry)s896 | Chi et al., 2008 | ZFIN: s896 | |
| Genetic reagent (Danio rerio) | Tg(UAS:EGFP)nkuasgfp1a | Asakawa et al., 2008 | ZFIN: nkuasgfp1a | |
| Genetic reagent (Danio rerio) | Tg(UAS:EGFP-CAAX)m1230 | Fernandes et al., 2012 | ZFIN: m1230 | |
| Genetic reagent (Danio rerio) | Tg(UAS-E1b:NfsB-mCherry)c264 | Davison et al., 2007 | ZFIN: c264 | |
| Genetic reagent (Danio rerio) | Tg(UAS:Kaede)rk8 | Hatta et al., 2006 | ZFIN: rk8 | |
| Genetic reagent (Danio rerio) | Tg(hsp70l:sflt1, cryaa-cerulean)bns80 | Matsuoka et al., 2016 | ZFIN: bns80 | |
| Genetic reagent (Danio rerio) | Tg(hsp70l:sflt4, cryaa-cerulean)bns82 | Matsuoka et al., 2016 | ZFIN: bns82 | |
| Genetic reagent (Danio rerio) | Tg(−4.9sox10:EGFP)ba2 | Carney et al., 2006 | ZFIN: ba2 | |
| Genetic reagent (Danio rerio) | Tg(sox10:mRFP)vu234 | Kucenas et al., 2008 | ZFIN: vu234 | |
| Genetic reagent (Danio rerio) | Tg(sox10:Gal4-VP16)sq9 | Lee et al., 2013 | ZFIN: sq9 | |
| Genetic reagent (Danio rerio) | Tg(ntla:Gal4-VP16)sq12 | Lee et al., 2013 | ZFIN: sq12 | |
| Genetic reagent (Danio rerio) | TgBAC(vegfab:gal4ff)bns273 | Mullapudi et al., 2019 | ZFIN: bns273 | |
| Genetic reagent (Danio rerio) | Tg(glut1b:mCherry)sj1 | Umans et al., 2017 | ZFIN: sj1 | |
| Genetic reagent (Danio rerio) | Tg(plvapb:EGFP)sj3 | Umans et al., 2017 | ZFIN: sj3 | |
| Genetic reagent (Danio rerio) | Et(cp:EGFP)sj2 | Henson et al., 2014 | ZFIN: sj2 | |
| Genetic reagent (Danio rerio) | Tg(mpeg1.1:Dendra2)uwm12 | Harvie et al., 2013 | ZFIN: uwm12 | |
| Genetic reagent (Danio rerio) | Tg(lyz:EGFP)nz117 | Hall et al., 2007 | ZFIN: nz117 | |
| Genetic reagent (Danio rerio) | Tg(lyve1:DsRed)nz101 | Okuda et al., 2012 | ZFIN: nz101 | |
| Genetic reagent (Danio rerio) | vegfaabns1 | Rossi et al., 2016 | ZFIN: bns1 | |
| Genetic reagent (Danio rerio) | vegfabbns92 | Rossi et al., 2016 | ZFIN: bns92 | |
| Genetic reagent (Danio rerio) | vegfchu6410 | Helker et al., 2013 | ZFIN: hu6410 | |
| Genetic reagent (Danio rerio) | vegfcum18 | Villefranc et al., 2013 | ZFIN: um18 | |
| Genetic reagent (Danio rerio) | vegfdbns257 | Gancz et al., 2019 | ZFIN: bns257 | |
| Genetic reagent (Danio rerio) | TgBAC(vegfc:gal4ff)bns270 | This paper | ZFIN: bns270 | |
| Genetic reagent (Danio rerio) | TgBAC(vegfd:gal4ff)lri95 | This paper | ZFIN: lri95 | |
| Genetic reagent (Danio rerio) | TgBAC(vegfaa:gal4ff)lri96 | This paper | ZFIN: lri96 | |
| Antibody | anti-GFP (chicken polyclonal) | Aves Labs | Cat#: GFP-1010 | 1:1000 |
| Antibody | anti-DsRed (rabbit polyclonal) | Clontech Labs | Cat#: 632496 | 1:300 |
| Antibody | anti-Claudin 5 (mouse monoclonal) | Thermo Fisher Scientific | Cat#: 35–2500 | 1:500 |
| Sequence-based reagent | ccbe1 crRNA1 | This paper | CRISPR RNA | TTCTCCTCTCGGAAAGTCCA |
| Sequence-based reagent | ccbe1 crRNA2 | This paper | CRISPR RNA | TACCCGTGCGTAAAGTCCAC |
| Sequence-based reagent | ccbe1 crRNA3 | This paper | CRISPR RNA | CTTCTGGAATACACTGACCC |
| Peptide, recombinant protein | Alt-R S.p. Cas9 Nuclease V3 | Integrated DNA Technologies | Cat#: 1081058 | |
| Commercial assay or kit | DIG RNA Labeling Kit (SP6/T7) | Millipore Sigma | Cat#: 11175025910 | |
| Commercial assay or kit | mMessage mMachine T3 Transcription Kit | Thermo Fisher Scientific | Cat#: AM1348 | |
| Commercial assay or kit | RNA Clean and Concentrator-5 Kit | Zymo Research | Cat#: R1013 | |
| Chemical compound, drug | Qdot 655 Streptavidin Conjugate | Thermo Fisher Scientific | Cat#: Q10123MP | |
| Chemical compound, drug | Metronidazole | Millipore Sigma | Cat#: M3761 | |
| Software, algorithm | LAS X Version 3.7.0.20979 | Leica | ||
| Software, algorithm | NIS-Elements BR Imaging Software Version 5.10.01 | Nikon | ||
| Software, algorithm | GraphPad Prism 8 | GraphPad Software | ||
| Software, algorithm | Adobe Photoshop CS6 | Adobe | ||
| Software, algorithm | Adobe Illustrator CS6 | Adobe |
Additional files
Download links
A two-part list of links to download the article, or parts of the article, in various formats.
Downloads (link to download the article as PDF)
Open citations (links to open the citations from this article in various online reference manager services)
Cite this article (links to download the citations from this article in formats compatible with various reference manager tools)
Endothelial cell-type-specific molecular requirements for angiogenesis drive fenestrated vessel development in the brain
eLife 10:e64295.
https://doi.org/10.7554/eLife.64295


