Coupling between motor cortex and striatum increases during sleep over long-term skill learning
- Neuroscience Graduate Program, University of California, San Francisco, United States
- Neurology Service, San Francisco Veterans Affairs Medical Center, United States
- Department of Neurology, University of California, San Francisco, United States
- Istituto Italiano di Tecnologia, Italy
- Department of Psychiatry, University of California, San Diego, United States
- Weill Institute for Neurosciences and Kavli Institute for Fundamental Neuroscience, University of California, San Francisco, United States
Figures
Figure 1 with 5 supplements
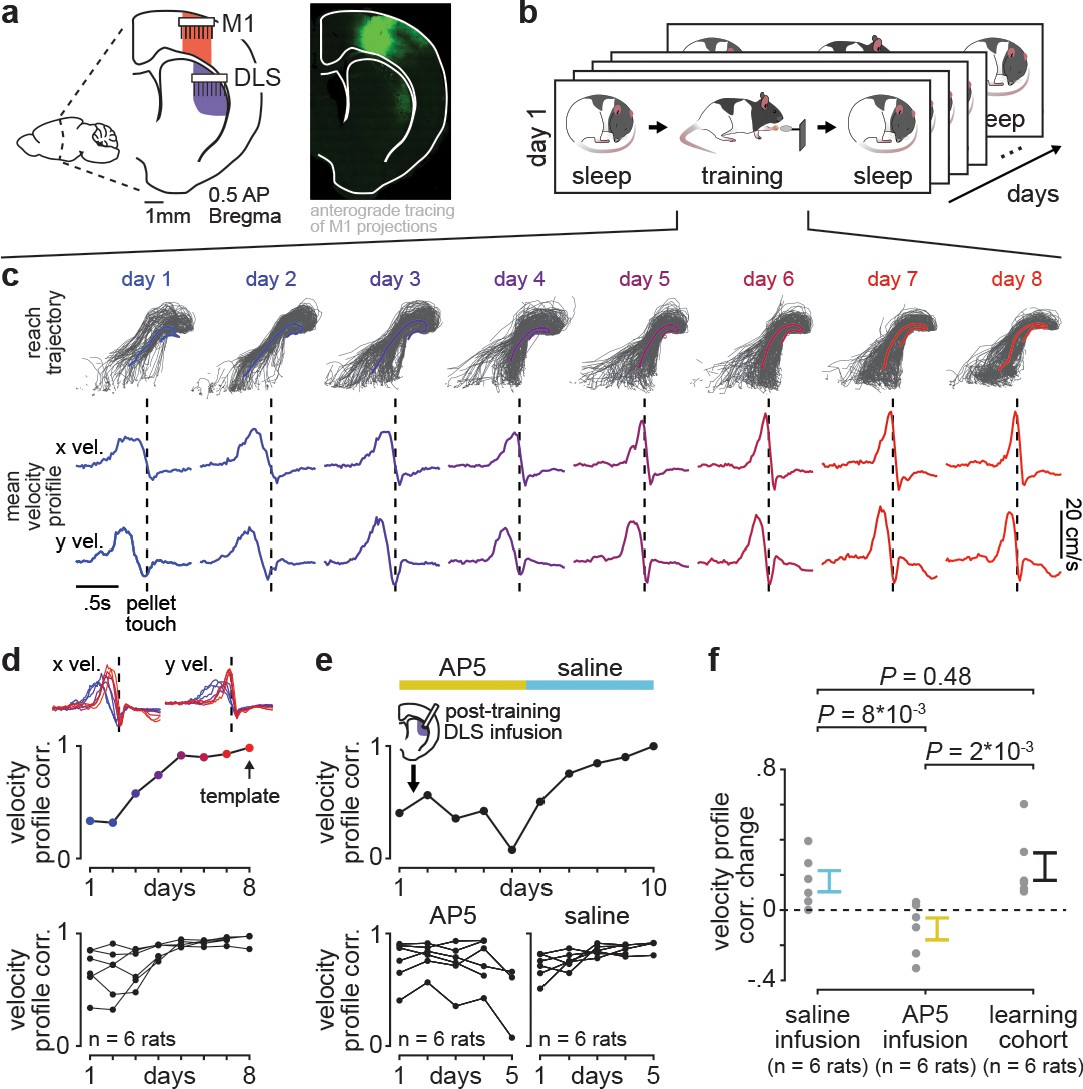
Blocking offline striatal NMDA receptor activation disrupts skill learning.
(a) Schematic of recording locations in primary motor cortex (M1) and dorsolateral striatum (DLS) and anterograde tracing of M1 projections showing direct input to the DLS. (b) Schematic of each day’s recording periods throughout long-term training. (c) Spatial reaching trajectories (individual trials in gray overlaid with mean trajectory in color) and mean reaching velocity profiles on each day of training in example animal. (d) Correlation between each day’s mean velocity profile and the final day’s mean velocity profile (average of x and y dimensions) for each day of training in example animal (top) and across animals (bottom; individual animals as black lines; last day of training, which served as template, is excluded in each animal). (e) Correlation between each day’s mean velocity profile and the final day’s mean velocity profile for example animal with post-training DLS infusions of AP5 or saline (top) and across animals (bottom; individual animals as black lines; last day of training, which served as template, is excluded in each animal). (f) Comparison of total change in velocity profile correlation across days with either post-training saline infusions, post-training AP5 infusions, or no infusions as in learning cohort animals (individual animals as gray dots and mean± SEM across animals in color; last day of training, which served as template, is excluded from calculations).
Figure 1—figure supplement 1

Electrophysiology recordings from M1 and DLS.
(a) Schematic of target electrode locations in primary motor cortex (M1) and dorsolateral striatum (DLS). (b) Example electrode array localization by electrolytic lesion. (c) Dimensions of microwire electrode array and high-density silicon probe.
Figure 1—figure supplement 2
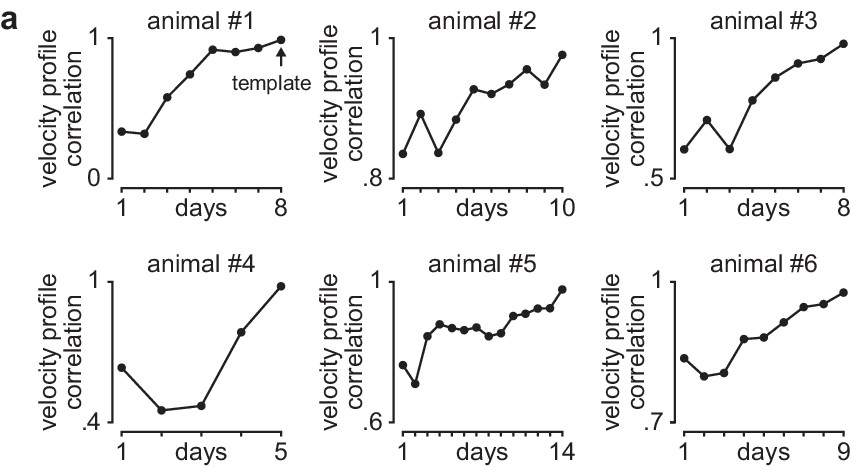
Learning curves in individual animals.
(a) Correlation between each day’s mean velocity profile (average of x and y dimensions) and final day’s mean velocity profile for each day of training in individual animals.
Figure 1—figure supplement 3

Reaching velocity across learning in individual animals.
(a) Single-trial peak reaching velocity (mean± SEM) for each day of training in individual animals. (b) Scatterplot between each day’s mean single-trial peak reaching velocity and velocity profile correlation across animals.
Figure 1—figure supplement 4
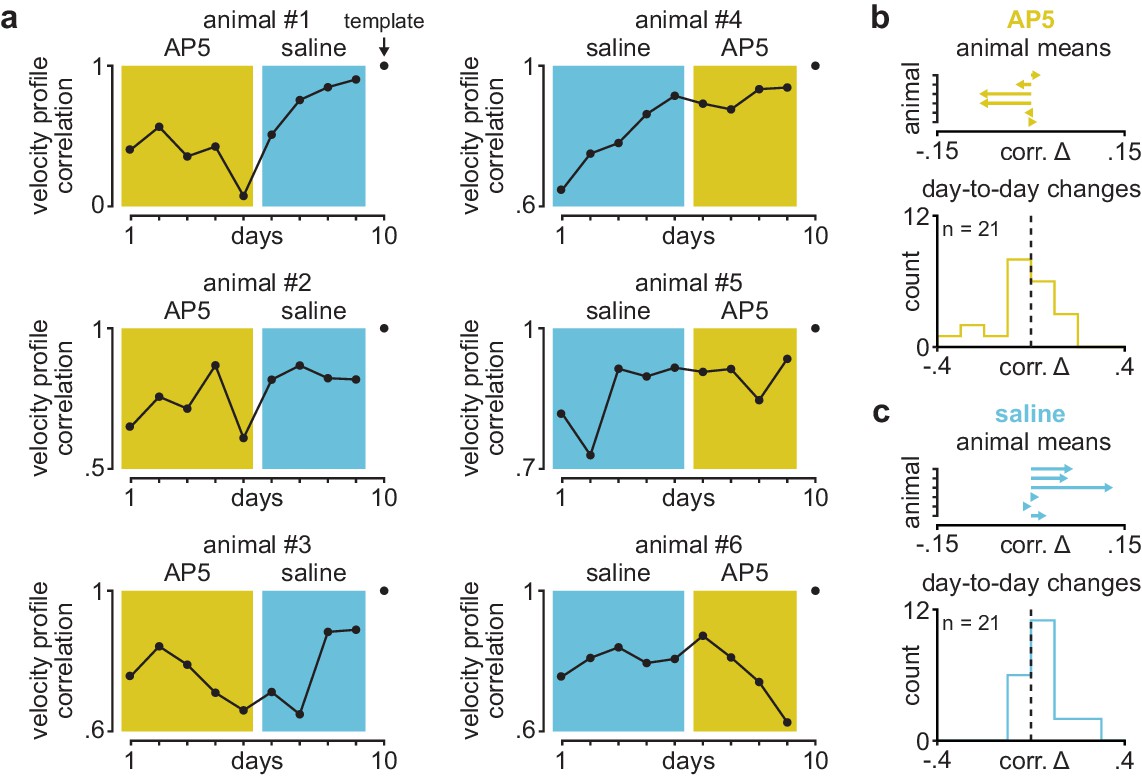
Velocity profile correlation across days in individual animals receiving post-training DLS infusions of AP5 or saline.
(a) Correlation between each day’s mean velocity profile and final day’s mean velocity profile in individual animals receiving post-training DLS infusions of either AP5 or saline. Background color (yellow for AP5, blue for saline) denotes days used for comparison in Figure 1g. (b) Mean day-to-day change in velocity profile correlation with AP5 infusions in each animal (top) and histogram of all day-to-day changes in velocity profile correlation across animals (bottom). (c) Mean day-to-day change in velocity profile correlation with saline infusions in each animal (top) and histogram of all day-to-day changes in velocity profile correlation across animals (bottom). DLS, dorsolateral striatum.
Figure 1—figure supplement 5
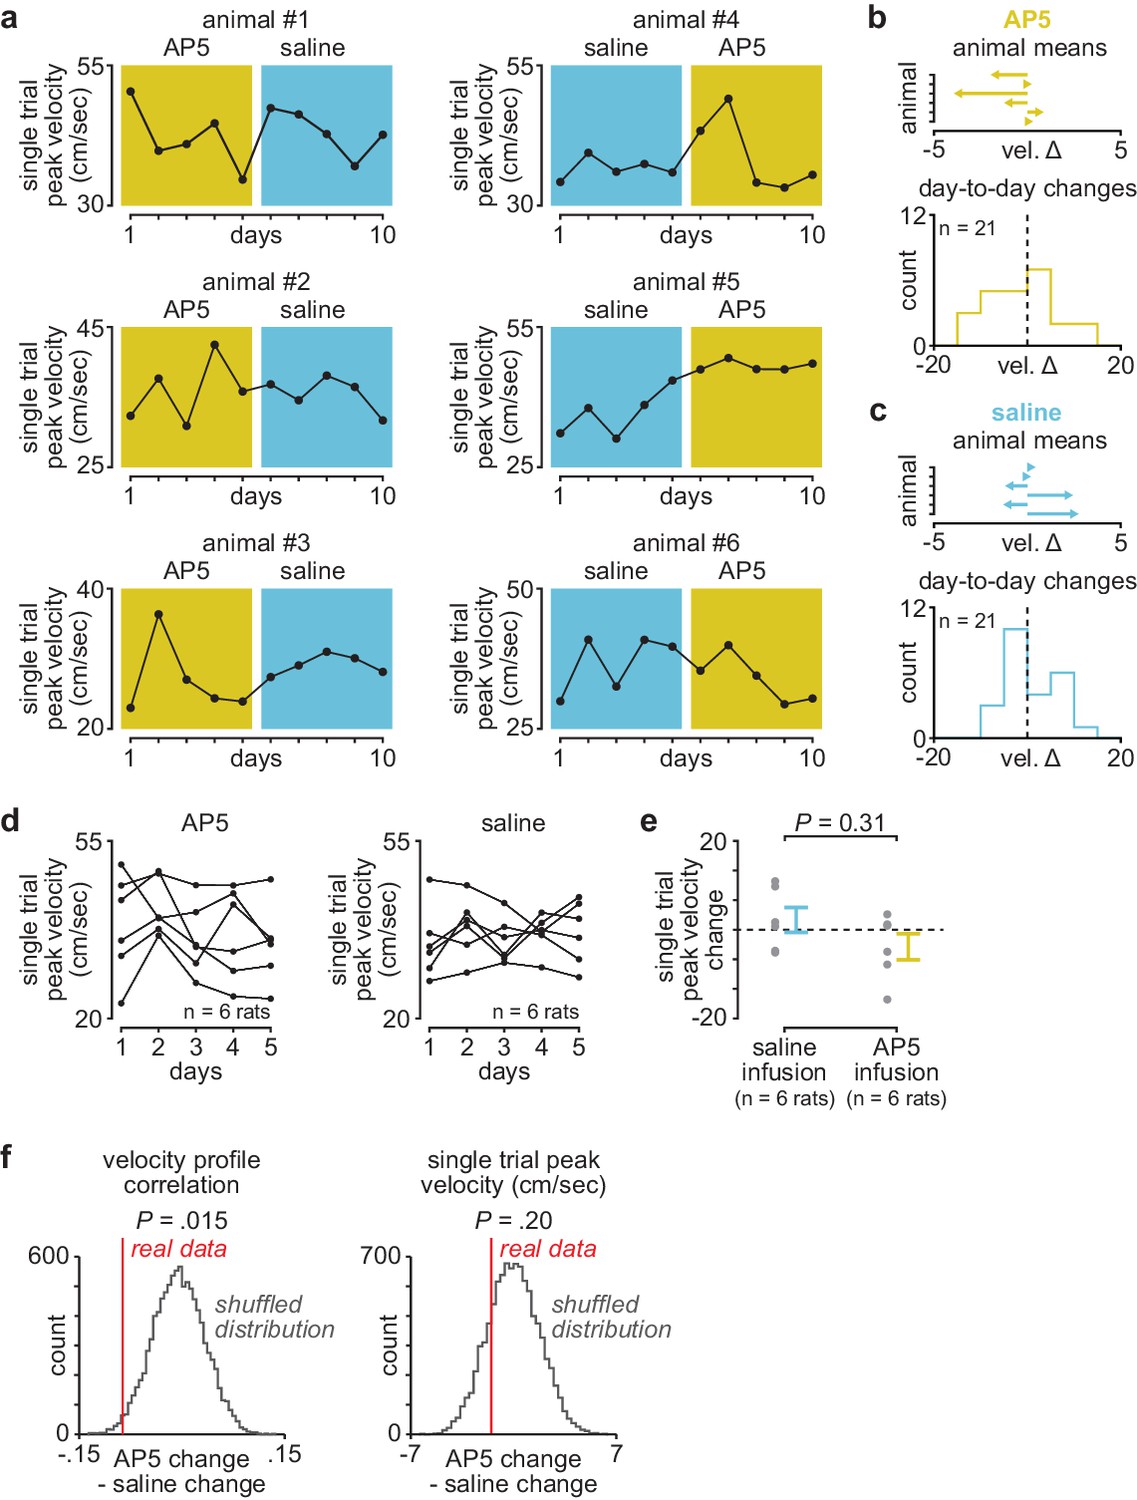
Day-to-day changes in single-trial peak reaching velocity with post-training DLS infusions of AP5 or saline.
(a) Mean single-trial peak reaching velocity across days in individual animals receiving post-training DLS infusions of either AP5 or saline. Background color (yellow for AP5, blue for saline). (b) Mean day-to-day change in single-trial peak velocity with AP5 infusions in each animal (top) and histogram of all day-to-day changes in single-trial peak velocity across animals (bottom). (c) Mean day-to-day change in single-trial peak velocity with saline infusions in each animal (top) and histogram of all day-to-day changes in single-trial peak velocity across animals (bottom). (d) Mean single-trial peak reaching velocity for animals receiving post-training AP5 or saline infusions (individual animals in black lines). (e) Comparison of total change in single-trial peak reaching velocity across days with either post-training saline or AP5 infusions (individual animals as gray dots and mean± SEM across animals in color). (f) Shuffled distribution of the difference in mean day-to-day change in velocity profile correlation (left) or single-trial peak velocity (right) between post-training AP5 or saline infusion, generated by shuffling AP5 and saline labels and recalculating the difference 10,000 times, with a vertical line denoting the difference in the real data (P value represents the percentile of real data within the shuffled distribution). DLS, dorsolateral striatum.
Figure 2 with 2 supplements
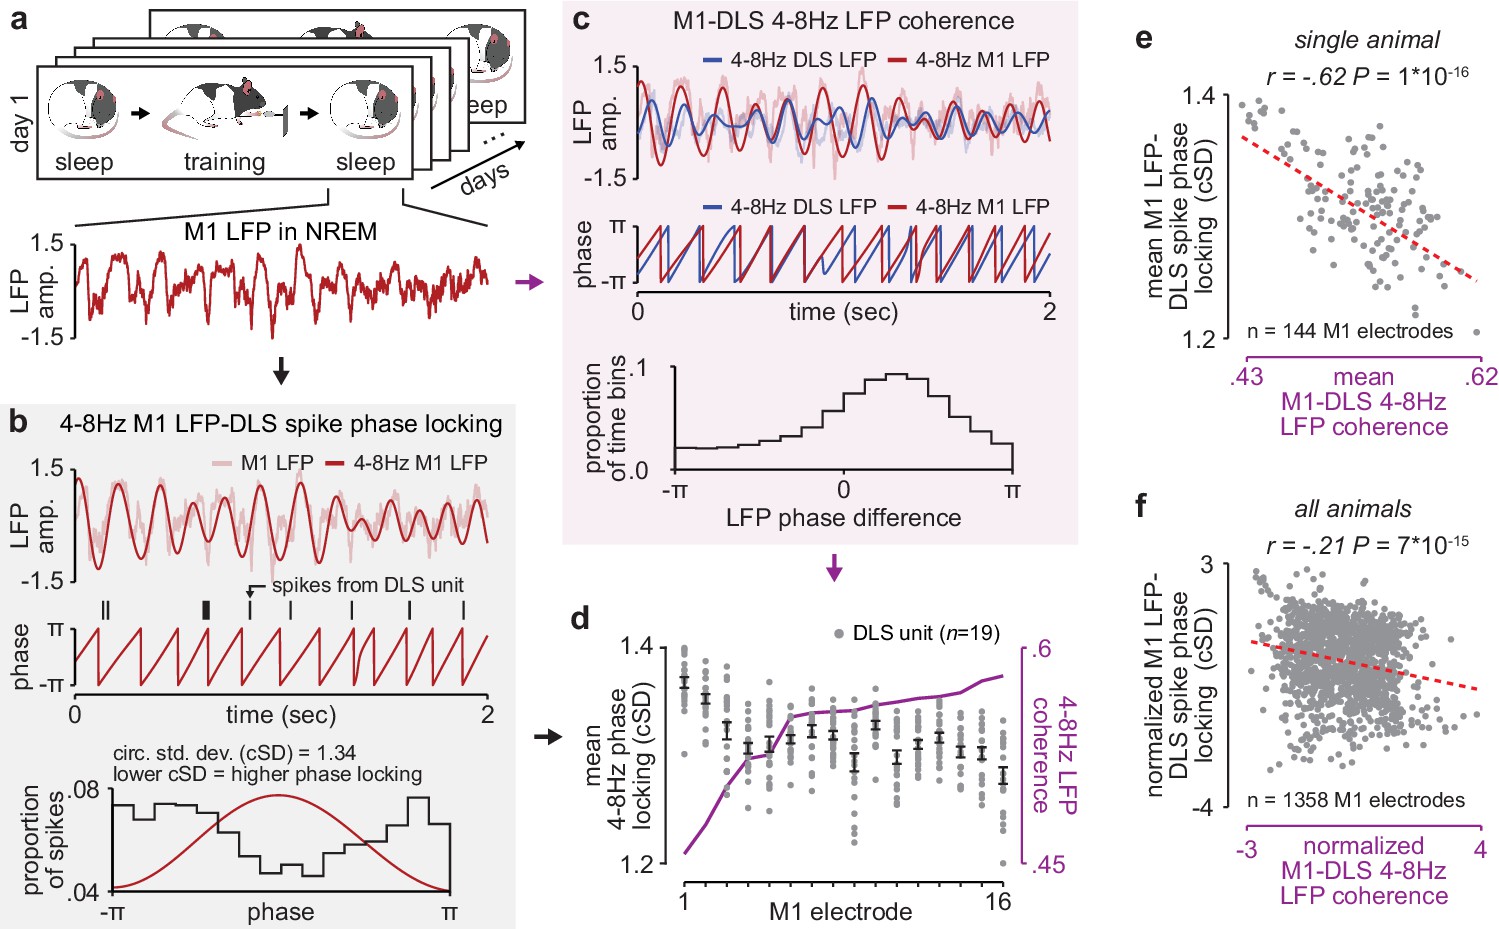
NREM M1-DLS 4–8 Hz LFP coherence reflects M1 LFP-DLS spike phase locking.
(a) Example snippet of M1 LFP during NREM. (b) Example computation of M1 LFP-DLS spike phase locking. Lower circular standard deviation (cSD) is equivalent to greater phase locking. (c) Phase difference between M1 and DLS 4–8 Hz LFP signals for example electrode pair with high coherence. (d) Relationship between mean M1 LFP-DLS spike phase locking and 4–8 Hz M1-DLS LFP coherence for all M1 electrodes in example animal on example day. (e) Scatterplot between mean M1 LFP-DLS spike phase locking and 4–8 Hz M1-DLS LFP coherence for M1 electrodes across all days in example animal. (f) Same as (e) for M1 electrodes across all animals. M1, primary motor cortex, DLS, dorsolateral striatum; LFP, local field potential; NREM, non-rapid-eye-movement sleep.
Figure 2—figure supplement 1
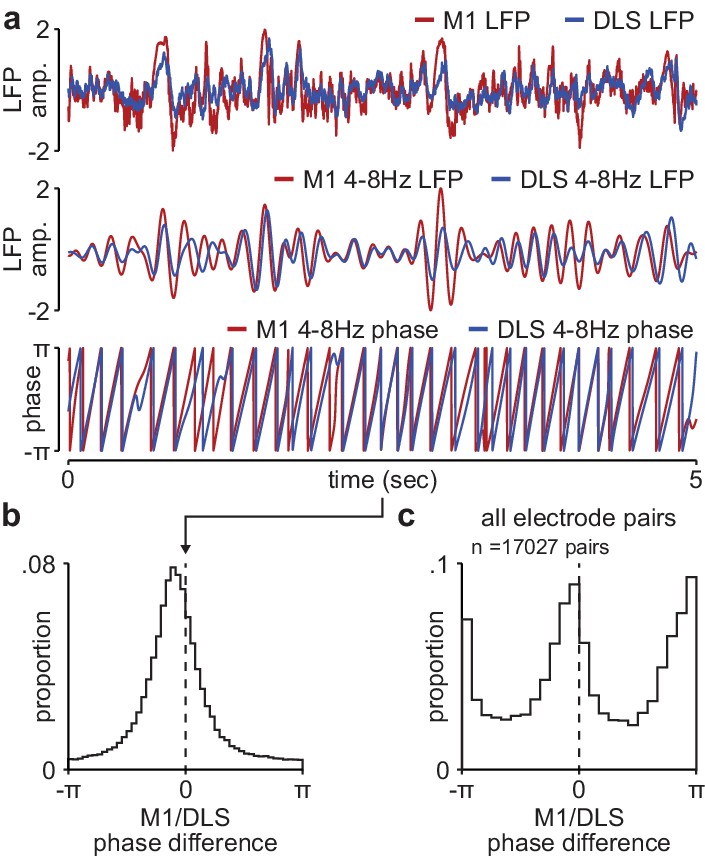
Phase difference between M1 and DLS 4–8 Hz LFP signals during NREM is not compatible with volume conduction.
(a) Example broadband LFP signals (top), 4–8 Hz filtered LFP signals (middle), and 4–8 Hz LFP phase (bottom) for example M1 and DLS electrodes. (b) Histogram of phase differences across 4–8 Hz filtered M1 and DLS LFP signals measured in NREM for example M1 and DLS electrode pair. (c) Histogram of mean phase difference for all M1 and DLS electrode pairs across animals. M1, primary motor cortex; DLS, dorsolateral striatum; LFP, local field potential.
Figure 2—figure supplement 2
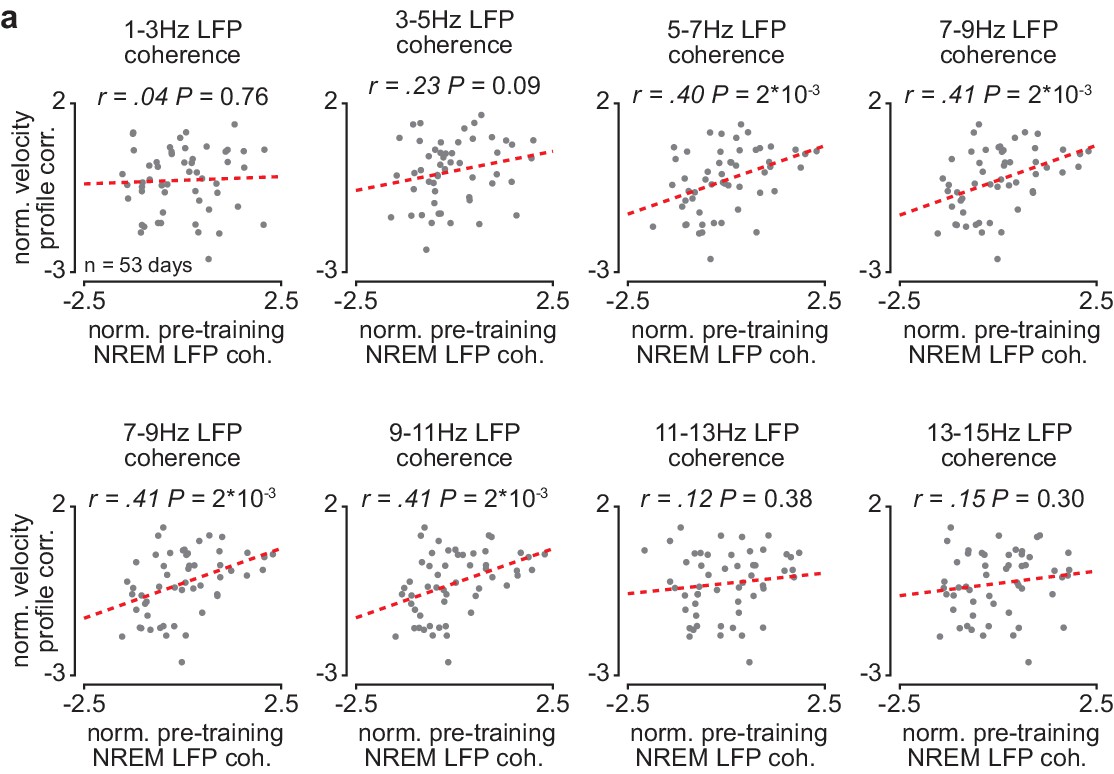
Corticostriatal NREM LFP coherence between ~5 and 11 Hz is correlated to skill learning.
(a) Scatterplots comparing normalized mean M1-DLS LFP coherence at different frequencies measured during NREM within the pre-training period (normalized within each animal by z-scoring the values across days) and the reach velocity profile correlation value for the subsequent training period on that day (normalized within each animal by z-scoring the values across days). For these scatterplots, LFP coherence is averaged over all M1 and DLS electrode pairs (in contrast, for the scatterplot in Figures 3e, 4–8 Hz LFP coherence is averaged over all M1 and DLS electrode pairs that increased in 4–8 Hz LFP coherence from the first to last day of training). M1, primary motor cortex; DLS, dorsolateral striatum; LFP, local field potential; NREM, non-rapid-eye-movement sleep.
Figure 3 with 1 supplement
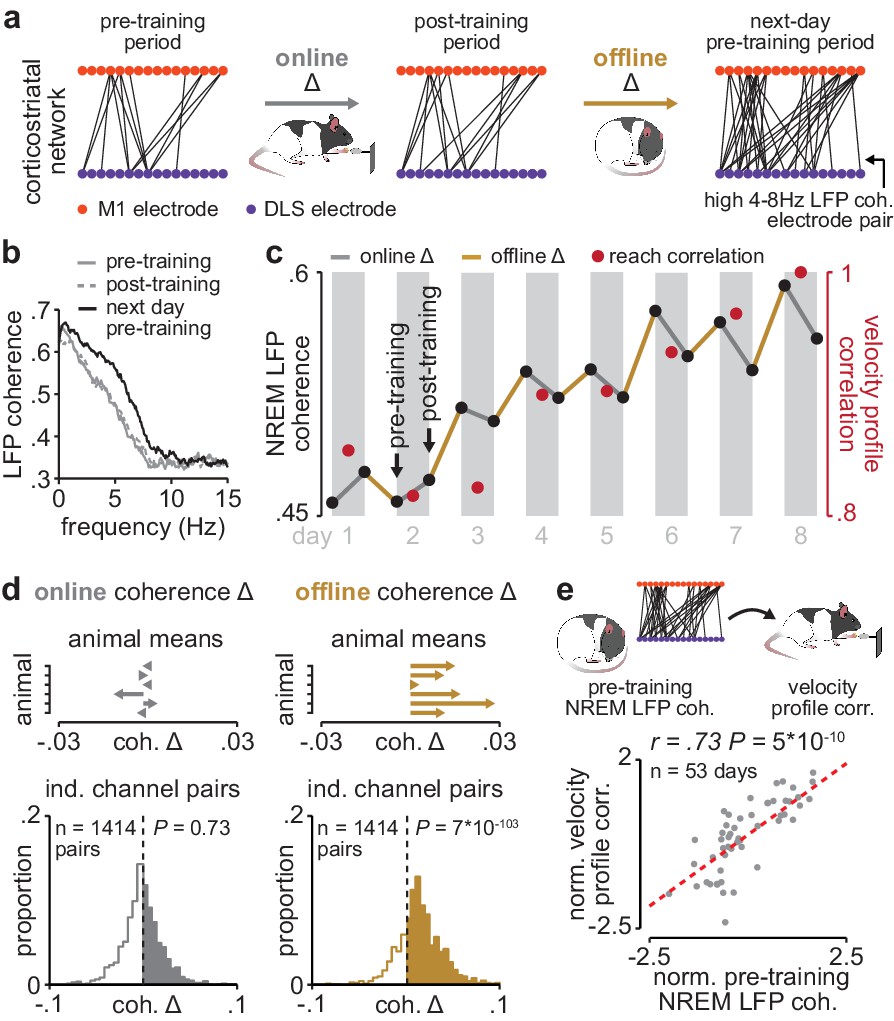
Corticostriatal functional connectivity increases offline during skill learning.
(a) Depiction of M1 and DLS electrode pairs with high 4–8 Hz LFP coherence (>0.6 coherence value measured in NREM) during pre- and post-training periods on one day of training, and the pre-training period on the subsequent day of training, in example animal. (b) LFP coherence spectrums across an example M1 and DLS electrode pair measured during NREM in the pre- and post-training periods on one day of training, and the pre-training period on the subsequent day of training. (c) 4–8 Hz LFP coherence measured during NREM on each pre- and post-training period throughout learning for example M1 and DLS electrode pair, overlaid with reach velocity profile correlation values on each day of training. (d) Comparison of the mean online (left) and offline (right) change in LFP coherence (4–8 Hz, measured in NREM) across training days for all M1 and DLS electrode pairs that increased in coherence from the first to last day of training, mean in each animal (top), and histogram of all electrode pairs across animals (bottom). (e) Scatterplot between each day’s 4–8 Hz LFP coherence measured during the pre-training period and reach velocity profile correlation value for the subsequent training period. Both values are normalized within each animal by z-scoring the values across days. M1, primary motor cortex; DLS, dorsolateral striatum; LFP, local field potential; NREM, non-rapid-eye-movement sleep.
Figure 3—figure supplement 1

Online and offline changes in 4–8 Hz LFP coherence in individual animals.
(a) 4–8 Hz LFP coherence measured during NREM within each pre- and post-training period, averaged across all M1 and DLS electrode pairs that increased in 4–8 Hz LFP coherence from the first to last day of training, in each individual animal, overlaid with reach velocity profile correlation values for each day of training (left), and histograms comparing mean online and offline change in LFP coherence (4–8 Hz, measured in NREM) for M1 and DLS electrode pairs in each individual animal (right). M1, primary motor cortex; DLS, dorsolateral striatum; LFP, local field potential; NREM, non-rapid-eye-movement sleep.
Figure 4 with 1 supplement

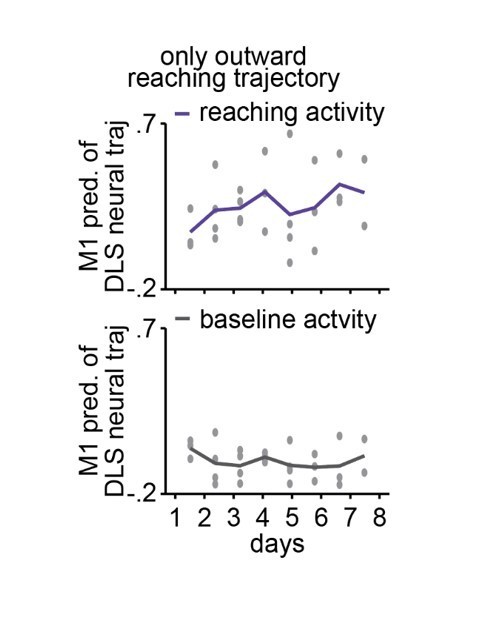
Offline increases in corticostriatal functional connectivity predict emergence of cross-area neural dynamics during subsequent skill execution.
(a) Trial-averaged neural trajectory (PC1 and PC2) of DLS activity during reaching (1 s before to 1 s after pellet touch) on day 1 (left) and day 8 (right) of training in example animal, overlaid with prediction of DLS neural trajectory from M1 spiking activity. (b) Ability to predict DLS neural trajectory (PC1–3) during reaching and during a baseline, non-reaching, period from M1 spiking activity on each day of training (gray dots represent days for individual animals, mean± SEM across animals in color). (c) Correlation between each day’s mean 4–8 Hz NREM LFP coherence during the pre-training period and ability to predict DLS neural trajectory (PC1–3) during reaching from M1 spiking activity during the subsequent training period. Both values are normalized within each animal by z-scoring the values across days. M1, primary motor cortex; DLS, dorsolateral striatum; LFP, local field potential; NREM, non-rapid-eye-movement sleep; PC, principal component.
Figure 4—figure supplement 1
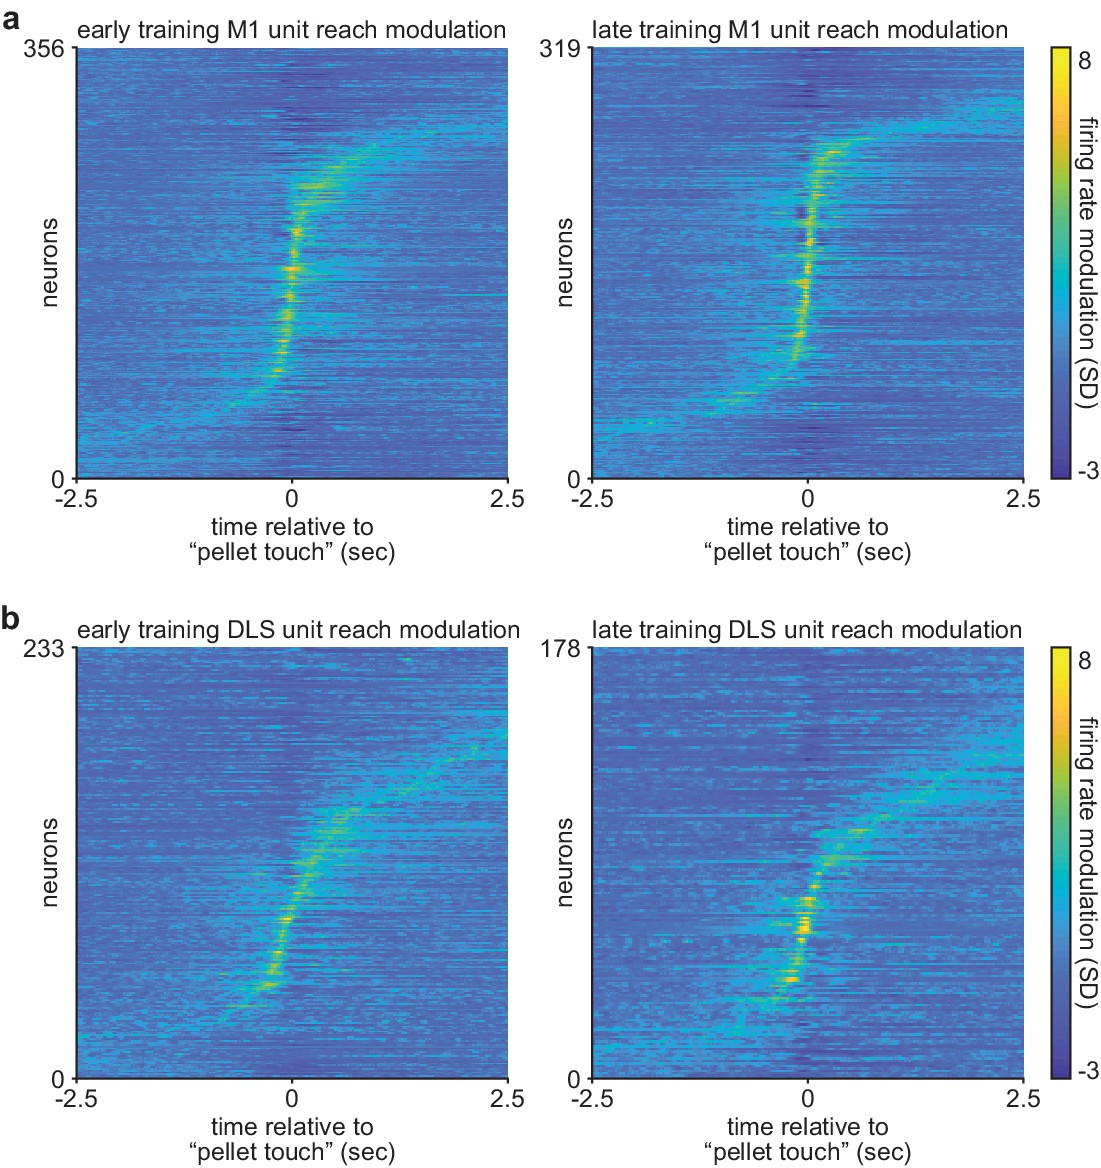
Comparison of corticostriatal spiking modulation during action execution on early and late training days.
(a) Trial-averaged M1 spiking activity during reaching, locked to ‘pellet touch,’ for neurons recorded on the first 3 days (early; left) and last 3 days (late; right) of training. (b) Same as (a) for DLS spiking activity. M1, primary motor cortex; DLS, dorsolateral striatum.
Figure 5 with 5 supplements
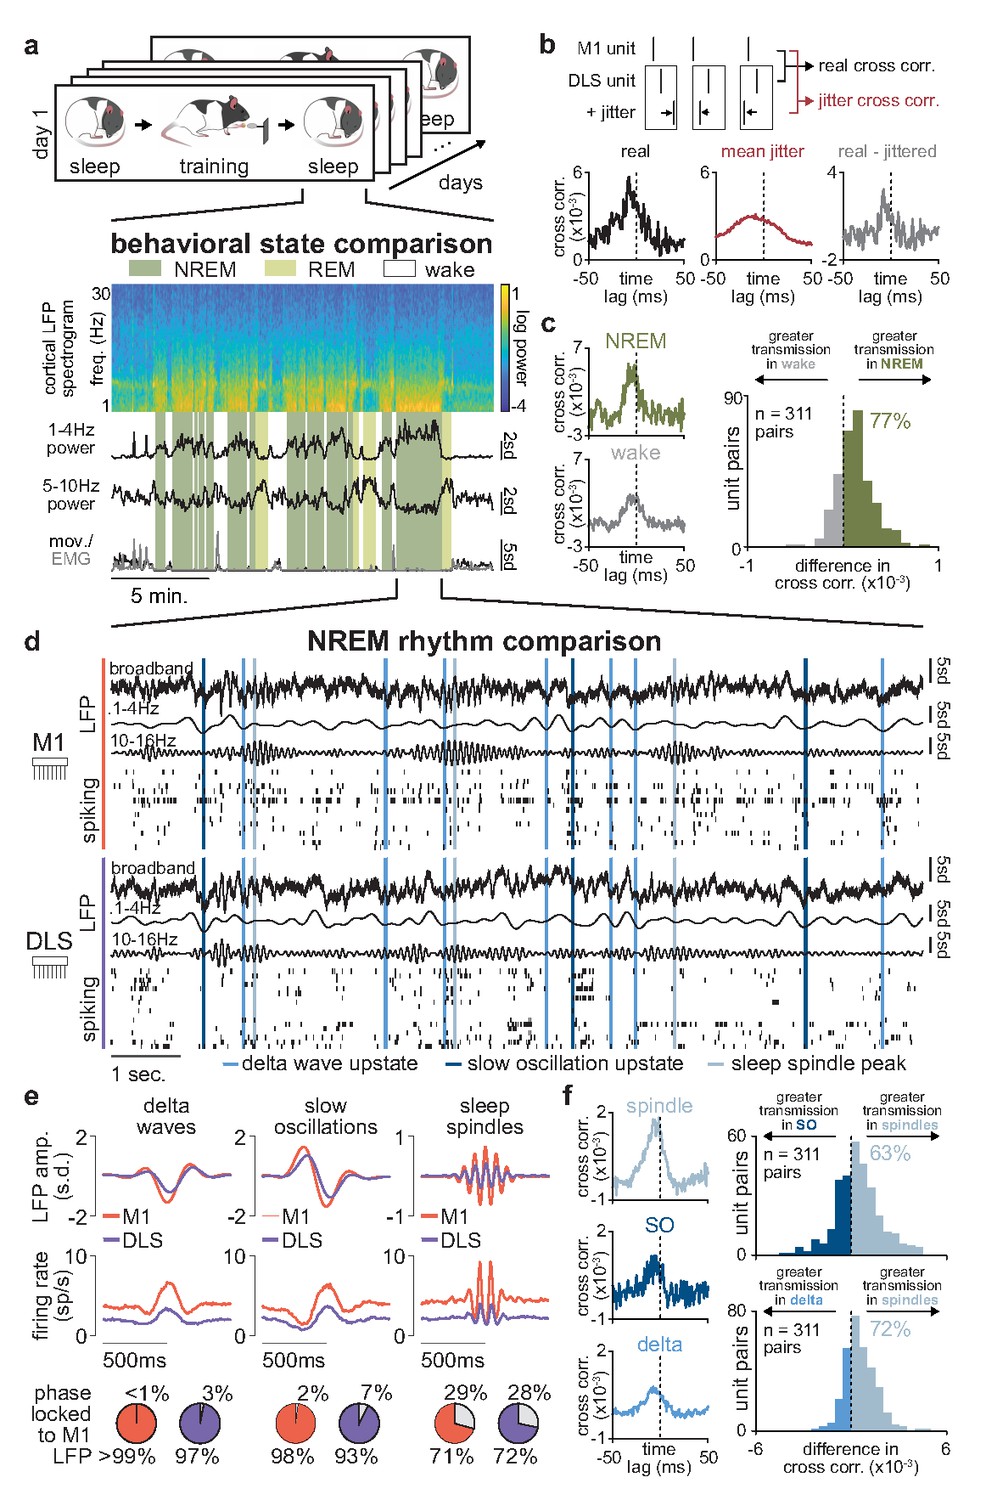
Sleep spindles in NREM facilitate corticostriatal transmission.
(a) M1 local field potential (LFP) spectrogram and behavioral state detection from example session. (b) Schematic depicting basic spike jitter method for detecting coupled M1 and DLS neurons (top) and normalization by subtracting mean jittered cross-correlation from real cross-correlation (bottom). (c) Comparison of normalized cross-correlations of spiking activity during NREM and wake from example coupled pair of M1 and DLS units (left) and histogram of differences in short-latency cross-correlation magnitude (1–15 ms) between NREM and wake for all pairs of coupled M1 and DLS neurons (right). (d) Snippet of LFP and single-unit spiking activity from M1 and DLS during NREM overlaid with detected NREM rhythms in M1. (e) Mean LFP and spiking activity during slow oscillations, delta waves, and sleep spindles in both M1 and DLS in example animal (top) and percentage of M1 and DLS units across animals significantly phase locked to M1 LFP during each NREM rhythm (bottom; significance threshold of P=0.05, Rayleigh test of uniformity). (f) Comparison of normalized cross-correlations of spiking activity during NREM rhythms from example coupled pair of M1 and DLS units (left) differences in short-latency cross-correlation magnitude (1–15 ms) between NREM rhythms for all pairs of coupled M1 and DLS neurons (right). M1, primary motor cortex; DLS, dorsolateral striatum; NREM, non-rapid-eye-movement sleep.
Figure 5—figure supplement 1

DLS unit classification.
(a) Scatterplot of spike width and amplitude, with classification of medium spiny neuron (MSN) or fast-spiking interneuron (FSI) in color, for DLS units recorded in example animal. (b) Percentage of units classified as MSN or FSI in individual animals. DLS, dorsolateral striatum.
Figure 5—figure supplement 2
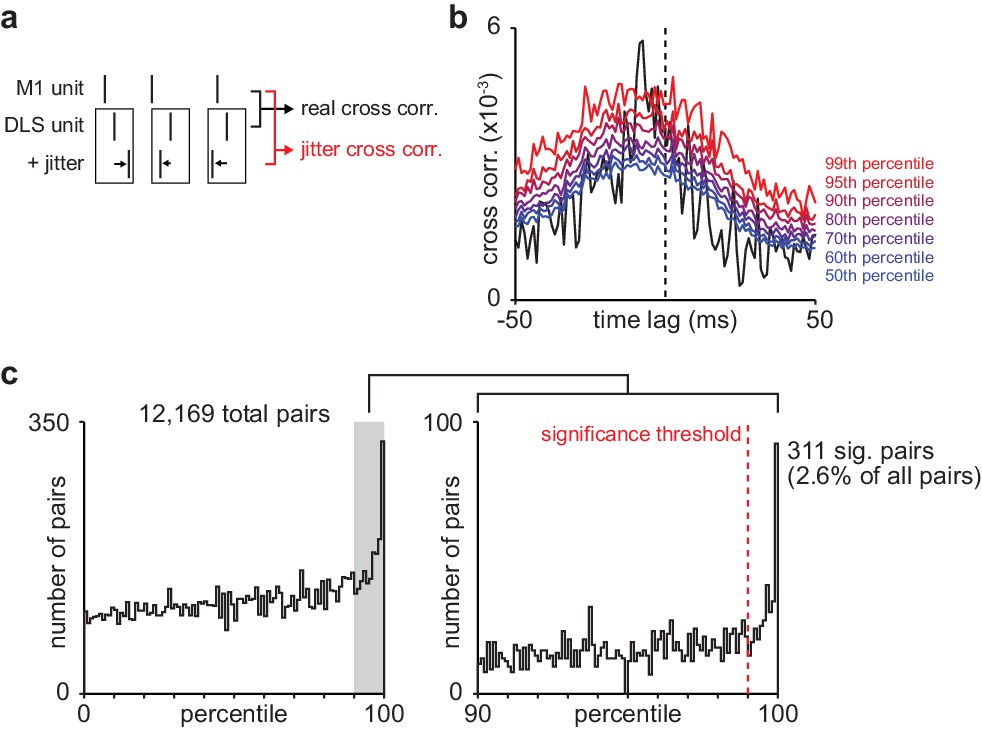
Basic spike jitter method to identify pairs of M1 and DLS neurons with consistent short-latency spike-timing relationships.
(a) Schematic depicting basic spike jitter method (b) Cross-correlation between example M1 and DLS neurons with percentiles from distribution of jittered cross-correlations overlaid in color. (c) Histogram of percentiles of the mean short-latency cross-correlation magnitude (1–15 ms) of each real cross-correlation between M1 and DLS neurons within a distribution of mean short-latency cross-correlation magnitudes from jittered cross-correlations (1000 jittered cross-correlations), significance threshold (99th percentile) overlaid. M1, primary motor cortex; DLS, dorsolateral striatum.
Figure 5—figure supplement 3

Firing rates in M1 and DLS across behavioral states.
(a) Comparison of firing rates in M1 across behavioral states, before and after training (1100 M1 units; 3.4±0.1 spikes/s in pre NREM vs. 3.7±0.1 spikes/s in post NREM, mean± SEM, paired-sample t-test: t(1099)=−6.8, P=1×10⁻¹¹; 4.2±0.1 spikes/s in pre REM vs. 4.4±0.1 spikes/s in post REM, mean± SEM, paired-sample t-test: t(1099)=−5.5, P=6×10⁻⁸; 4.0±0.1 spikes/s in pre wake vs. 4.4±0.1 spikes/s in post wake, mean± SEM, paired-sample t-test: t(1099)=−9.5, P=1×10⁻²⁰). (b) Comparison of firing rates in DLS across behavioral states, before and after training (579 DLS units; 1.9±0.1 spikes/s in pre NREM vs. 2.1±0.1 spikes/s in post NREM, mean± SEM, paired-sample t-test: t(578)=−6.5, P=1×10⁻¹⁰; 2.5±0.1 spikes/s in pre REM vs. 2.7±0.1 spikes/s in post REM, mean± SEM, paired-sample t-test: t(578)=−5.5, P=8×10⁻⁸; 2.4±0.1 spikes/s in pre wake vs. 2.8±0.1 spikes/s in post wake, mean± SEM, paired-sample t-test: t(578)=−6.8, P=3×10⁻¹¹). M1, primary motor cortex; DLS, dorsolateral striatum; NREM, non-rapid-eye-movement sleep.
Figure 5—figure supplement 4
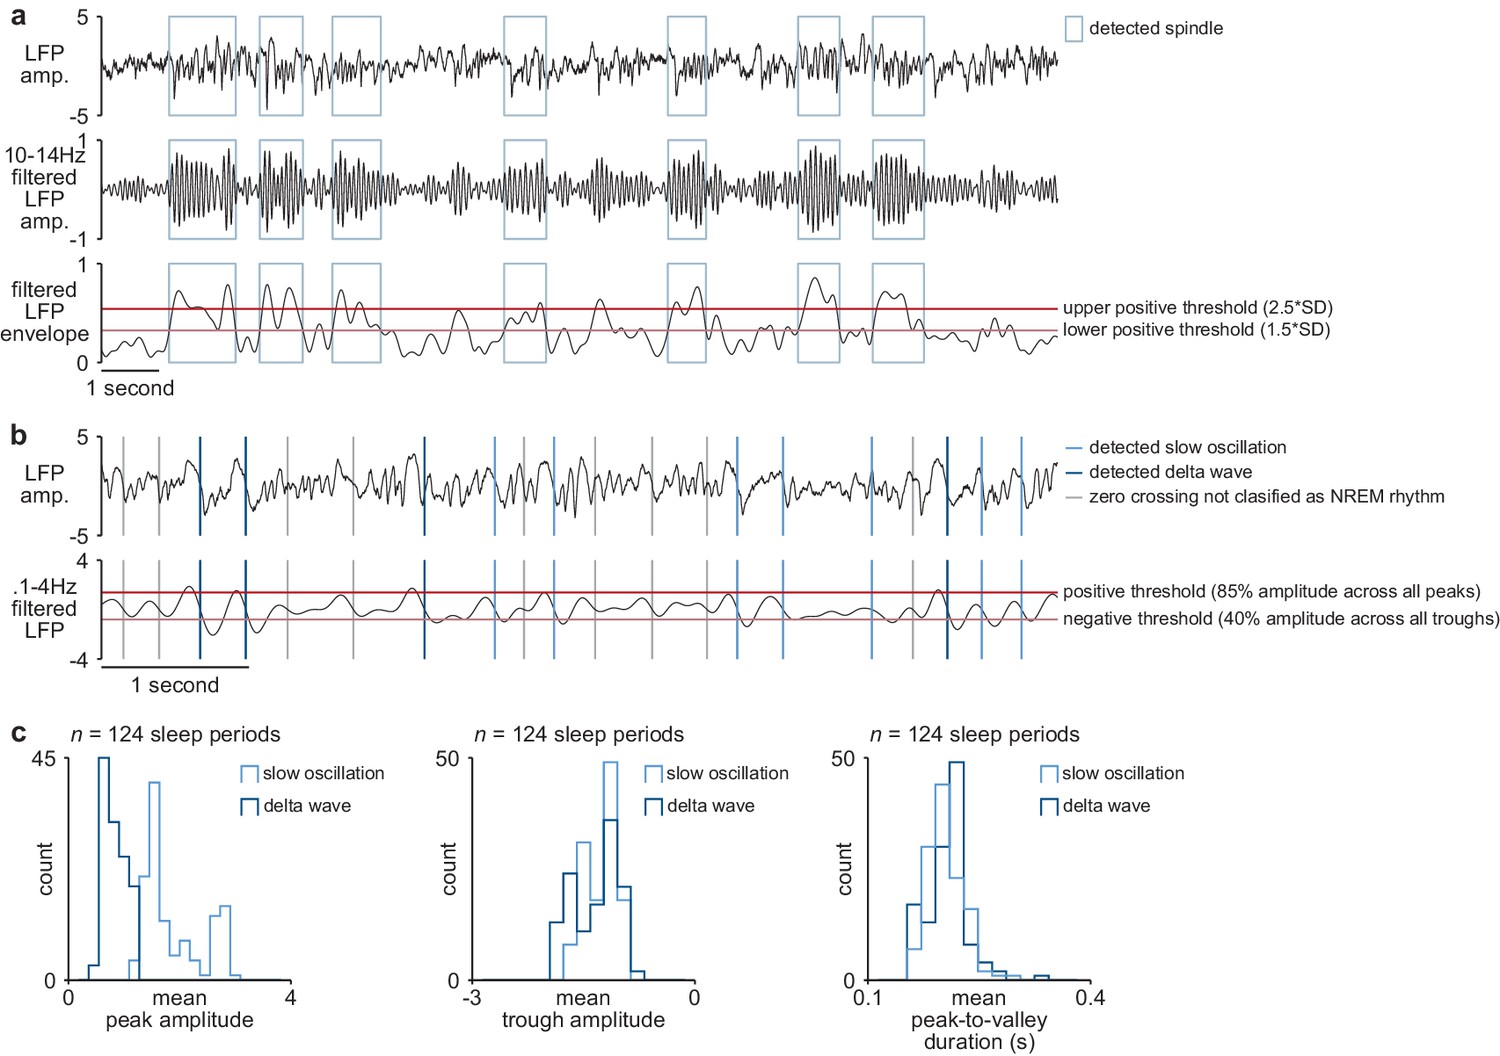
NREM rhythm detection.
(a) Examples of detected sleep spindles in broadband M1 LFP signal (top), 10–14 Hz filtered M1 LFP signal (middle), and envelope of filtered LFP signal with thresholds for spindle detection overlaid (bottom). (b) Examples of detected slow oscillation and delta wave zero crossings in broadband M1 LFP signal (top) and 0.1–4 Hz filtered M1 LFP signal with thresholds for slow oscillation and delta wave detection overlaid (bottom). (c) Comparison of slow oscillation and delta wave features, including peak amplitude (left), trough amplitude (middle), and mean peak-to-valley duration (right). M1, primary motor cortex; LFP, local field potential; NREM, non-rapid-eye-movement sleep.
Figure 5—figure supplement 5
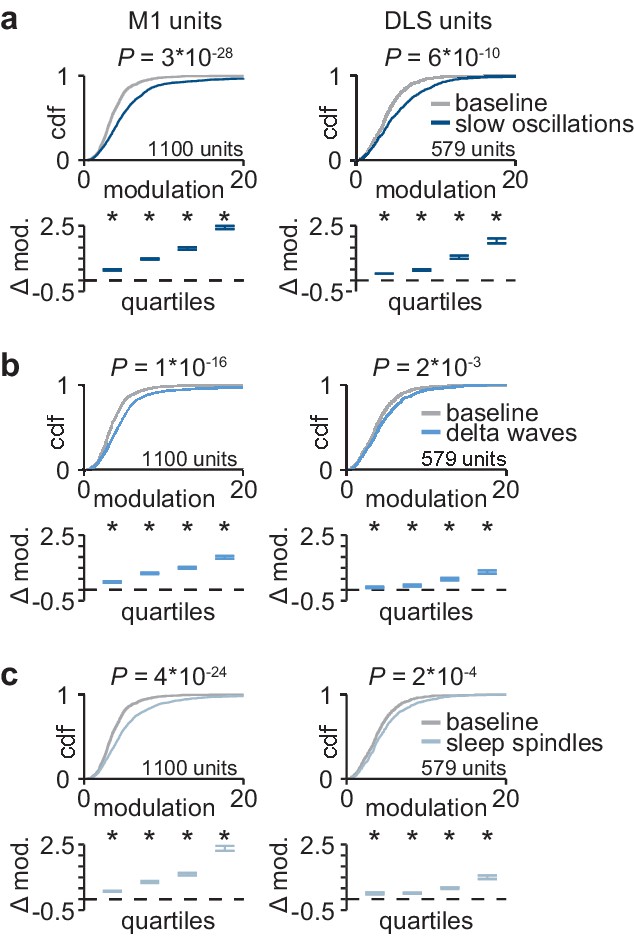
Corticostriatal modulation across NREM rhythms.
(a) Comparison of firing rate modulation distributions for M1 (left) and DLS (right) units during slow oscillations and a baseline NREM period (M1: P=3×10⁻²⁸, DLS: P=6×10⁻¹⁰, two-sample Kolmogorov–Smirnov test, followed by a shift test to assess how quartiles of the distribution differ). (b) Comparison of firing rate modulation distributions for M1 (left) and DLS (right) units during delta waves and a baseline NREM period (M1: P=1×10⁻¹⁶, DLS: P=2×10⁻³, two-sample Kolmogorov–Smirnov test, followed by a shift test to assess how quartiles of the distribution differ). (c) Comparison of firing rate modulation distributions for M1 (left) and DLS (right) units during sleep spindles and a baseline NREM period (M1: P=4×10⁻²⁴, DLS: P=2×10⁻⁴, two-sample Kolmogorov–Smirnov test, followed by a shift test to assess how quartiles of the distribution differ). M1, primary motor cortex; DLS, dorsolateral striatum; NREM, non-rapid-eye-movement sleep.
Figure 6 with 2 supplements
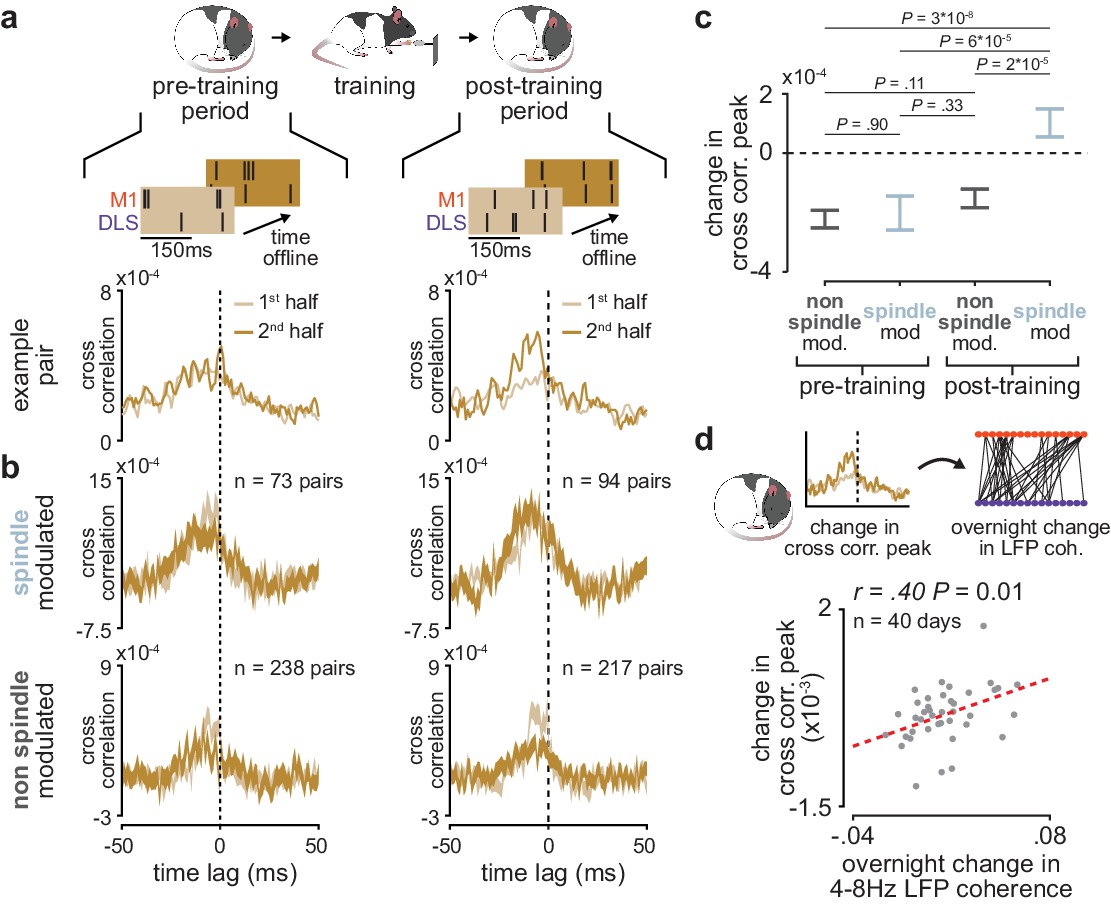
Short-latency spike-timing relationships are uniquely preserved within the post-training period for sleep spindle modulated M1 and DLS neuron pairs.
(a) Schematic of changes in short-latency spike-timing relationships measured by cross-correlations of spiking activity during NREM from the first and second half of pre- (left) and post-training (right) periods for example M1 and DLS neuron pair. (b) Cross-correlations of spiking activity during NREM for coupled pairs of M1 and DLS neurons that are spindle-modulated (top) or non-spindle modulated (bottom) during the first and second half of pre- (left) and post-training (right) periods (width of line represents mean± SEM). (c) Comparison of change in short-latency cross-correlation peak (1–15 ms time lag) between spindle-modulated and non-spindle modulated M1 and DLS pairs during the pre- and post-training periods (mean± SEM). (d) Scatterplot of mean change in short-latency cross-correlation magnitude (post-training change normalized by pre-training change) across coupled M1 and DLS neurons pairs and mean overnight change in 4–8 Hz LFP coherence across M1 and DLS electrodes. M1, primary motor cortex; DLS, dorsolateral striatum; NREM, non-rapid-eye-movement sleep.
Figure 6—figure supplement 1

Comparison of time spent in each behavioral state during the pre- and post-training periods.
(a) Comparison of durations spent in each behavioral state during the pre- and post-training periods across days and animals (NREM: 41.2±2.4 min of pre NREM vs. 44.3±2.5 min of post NREM, mean± SEM, paired-sample t-test: t(51)=−1.03, P=0.31; REM: 17.2±1.4 min of pre REM vs. 16.3±1.4 min of post REM, mean± SEM, paired-sample t-test: t(51)=0.56, P=0.58; wake: 98.8±3.6 min of pre wake vs. 106.0±4.3 min of post wake, mean± SEM, paired-sample t-test: t(51)=−1.5, P=0.14). NREM, non-rapid-eye-movement sleep; REM, rapid-eye-movement sleep.
Figure 6—figure supplement 2
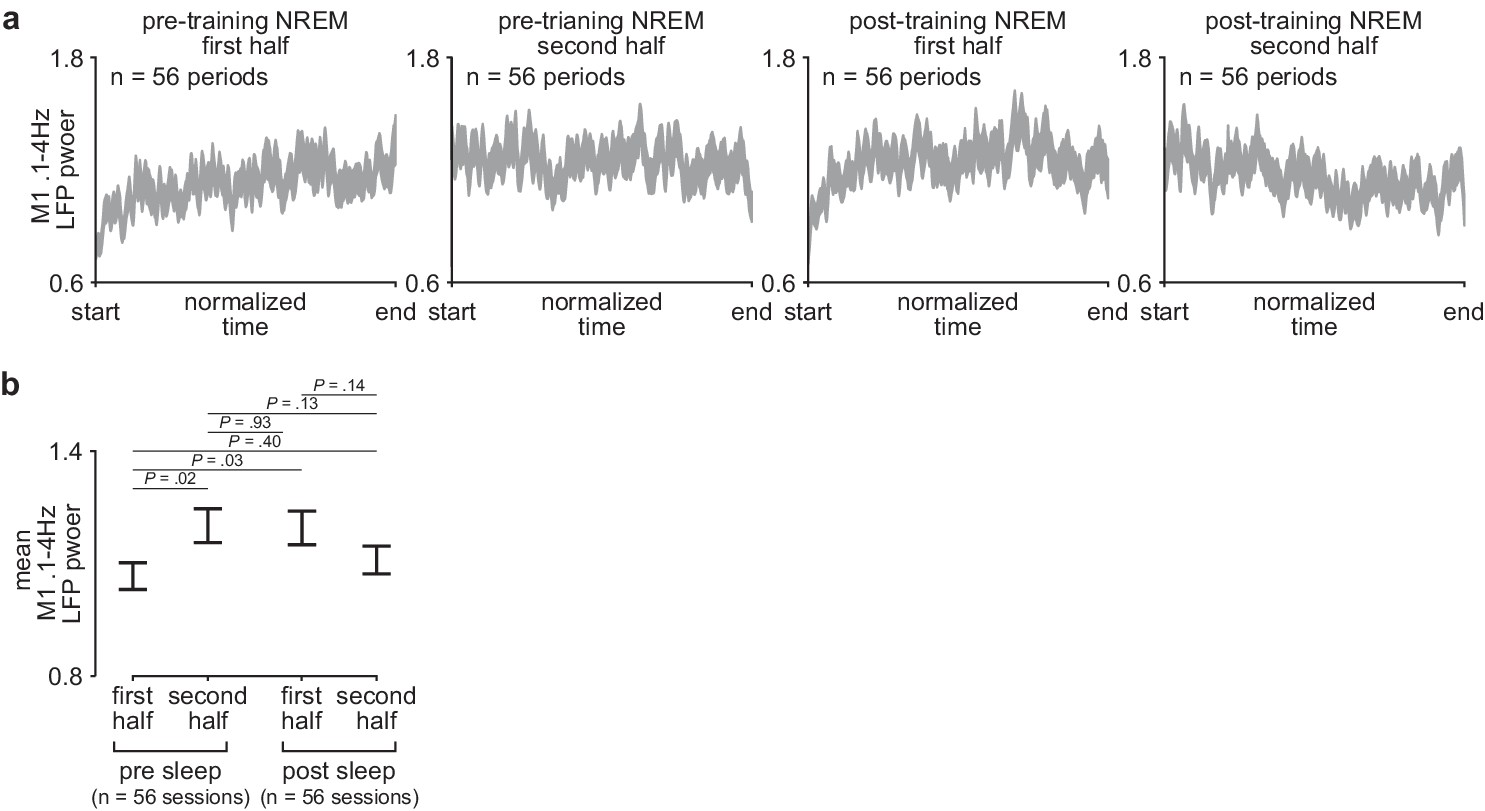
Comparison of sleep depth within and across the pre- and post-training periods.
(a) M1 0.1–4 Hz LFP power over each half of pre- and post-training periods. Each pre- and post-training period was divided into two halves and each half was interpolated to a normalized length across days and animals (width of line represents mean± SEM). (b) Comparison of mean 0.1–4 Hz M1 LFP power during the first and second half of each pre- and post-training period across days and animals (mean± SEM). LFP, local field potential.
Figure 7 with 1 supplement

The impact of sleep spindles on corticostriatal connectivity is influenced by temporal proximity to preceding slow oscillations (SOs).
(a) Distributions of the temporal proximity to preceding SOs for all sleep spindles during NREM in pre- and post-training periods, across days and animals. (b) Short-latency cross-correlation magnitude (1-15ms time lag) across coupled M1 and DLS neuron pairs calculated from spiking occurring in 30 s bins around SO-nested spindles (sleep spindles occurring within 1 s after a SO zero-crossing) and non-SO nested spindles (sleep spindles occurring 5 s or more after a SO zero-crossing; top), and the difference in short-latency cross-correlation magnitude between SO-nested and non-SO-nested spindles. M1, primary motor cortex; DLS, dorsolateral striatum; NREM, non-rapid-eye-movement sleep.
Figure 7—figure supplement 1
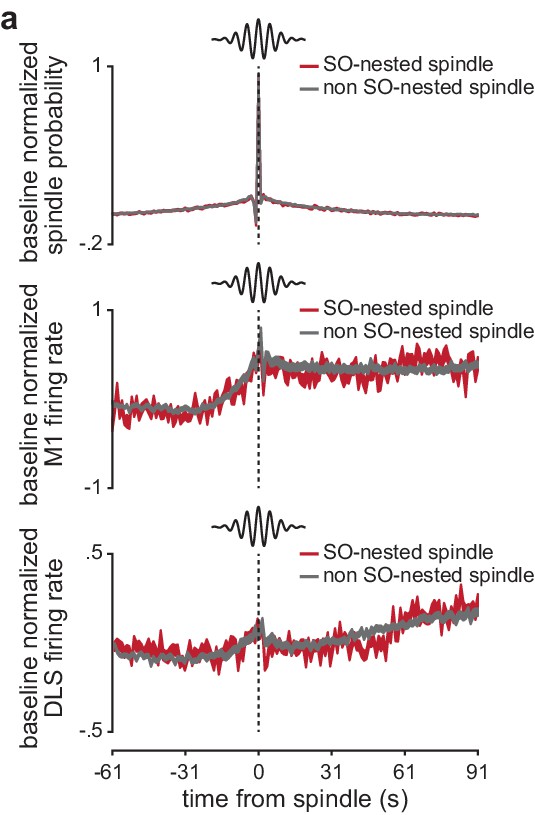
Spindle probability and corticostriatal firing rates around SO-nested and non-SO-nested sleep spindles.
(a) Comparison of the probability of a spindle occurring before and after a SO-nested or non-SO-nested spindle (normalized by the period 91–61 s before the spindle; top), as well as comparison of firing rate in M1 (middle) and DLS (bottom) before and after a SO-nested or non-SO-nested spindle (normalized by the period 91–61 s before the spindle; width of line represents mean± SEM). M1, primary motor cortex; DLS, dorsolateral striatum.
Author response image 1
Additional files
Download links
A two-part list of links to download the article, or parts of the article, in various formats.
Downloads (link to download the article as PDF)
Open citations (links to open the citations from this article in various online reference manager services)
Cite this article (links to download the citations from this article in formats compatible with various reference manager tools)
Coupling between motor cortex and striatum increases during sleep over long-term skill learning
eLife 10:e64303.
https://doi.org/10.7554/eLife.64303


