A putative structural mechanism underlying the antithetic effect of homologous RND1 and RhoD GTPases in mammalian plexin regulation
- Center for Quantitative Biology, Academy for Advanced Interdisciplinary Studies, Peking University, China
- Beijing Computational Science Research Center, China
- Department of Pharmacology, University of Texas Southwestern Medical Center, United States
- Peking-Tsinghua Center for Life Sciences, Academy for Advanced Interdisciplinary Studies, Peking University, China
- Antidote Health Foundation for Cure of Cancer, United States
Figures
Figure 1 with 1 supplement
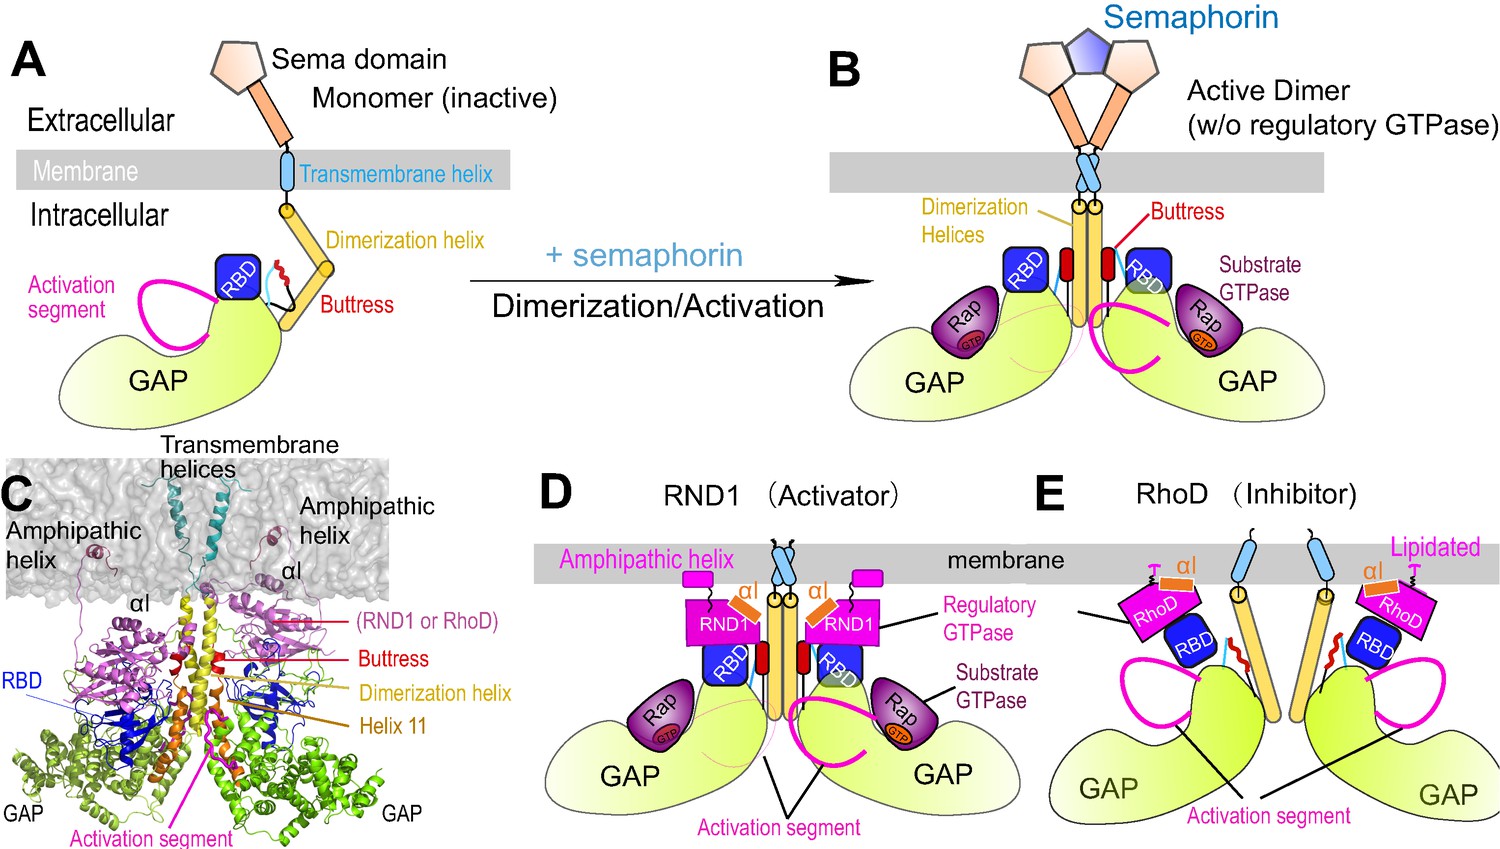
Plexin architecture, dimerization, and GTPase binding of the RBD domain.
(A) Components of a plexin molecule. Each RBD domain is connected with a GAP domain by the N and C linkers. (B) Architecture of the semaphorin-induced plexin dimer. A buttress segment is positioned between the RBD domain and the dimerization helix. Helix 11 is C-terminal to the buttress. The activation segments are held in the active conformations by the dimerization helices in trans. A Rap GTPase is bound to each GAP domain as a substrate at the active site. (C) The RND1- or RhoD-bound plexin dimer systems simulated in this study. The extracellular portions of the dimers were excluded. (D, E) Structural basis of RND1 stabilization and RhoD destabilization of the plexin dimer according to this study. The key difference is that the catalytic domain of RND1 is relatively detached from the membrane.
Figure 1—figure supplement 1
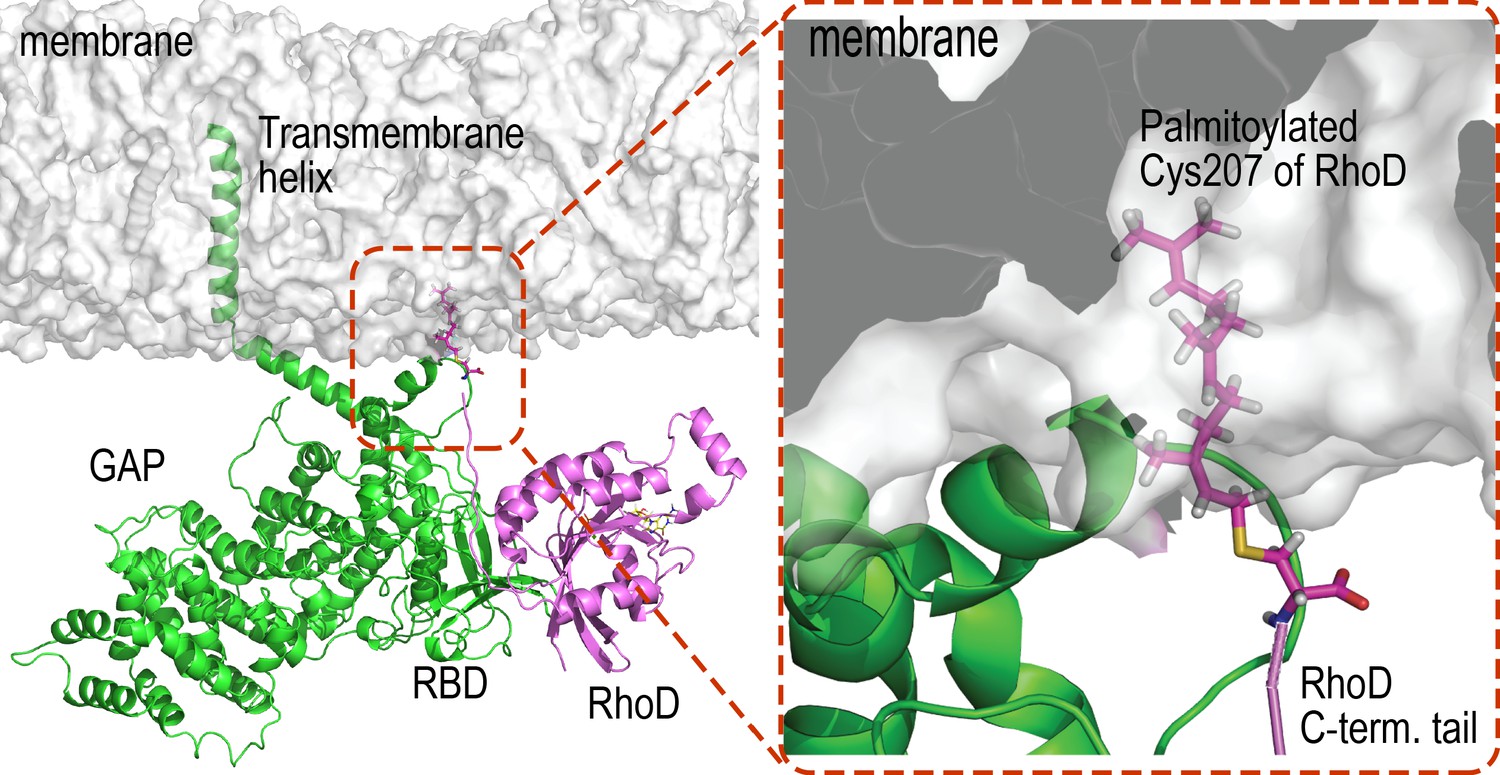
RhoD binding with plexin RBD domain and anchoring to the membrane.
As shown, an RBD-bound RhoD is anchored to the membrane in our simulations by embedding the palmitoylated Cys207 at the C-terminal tail of the RhoD into the membrane.
Figure 2 with 1 supplement
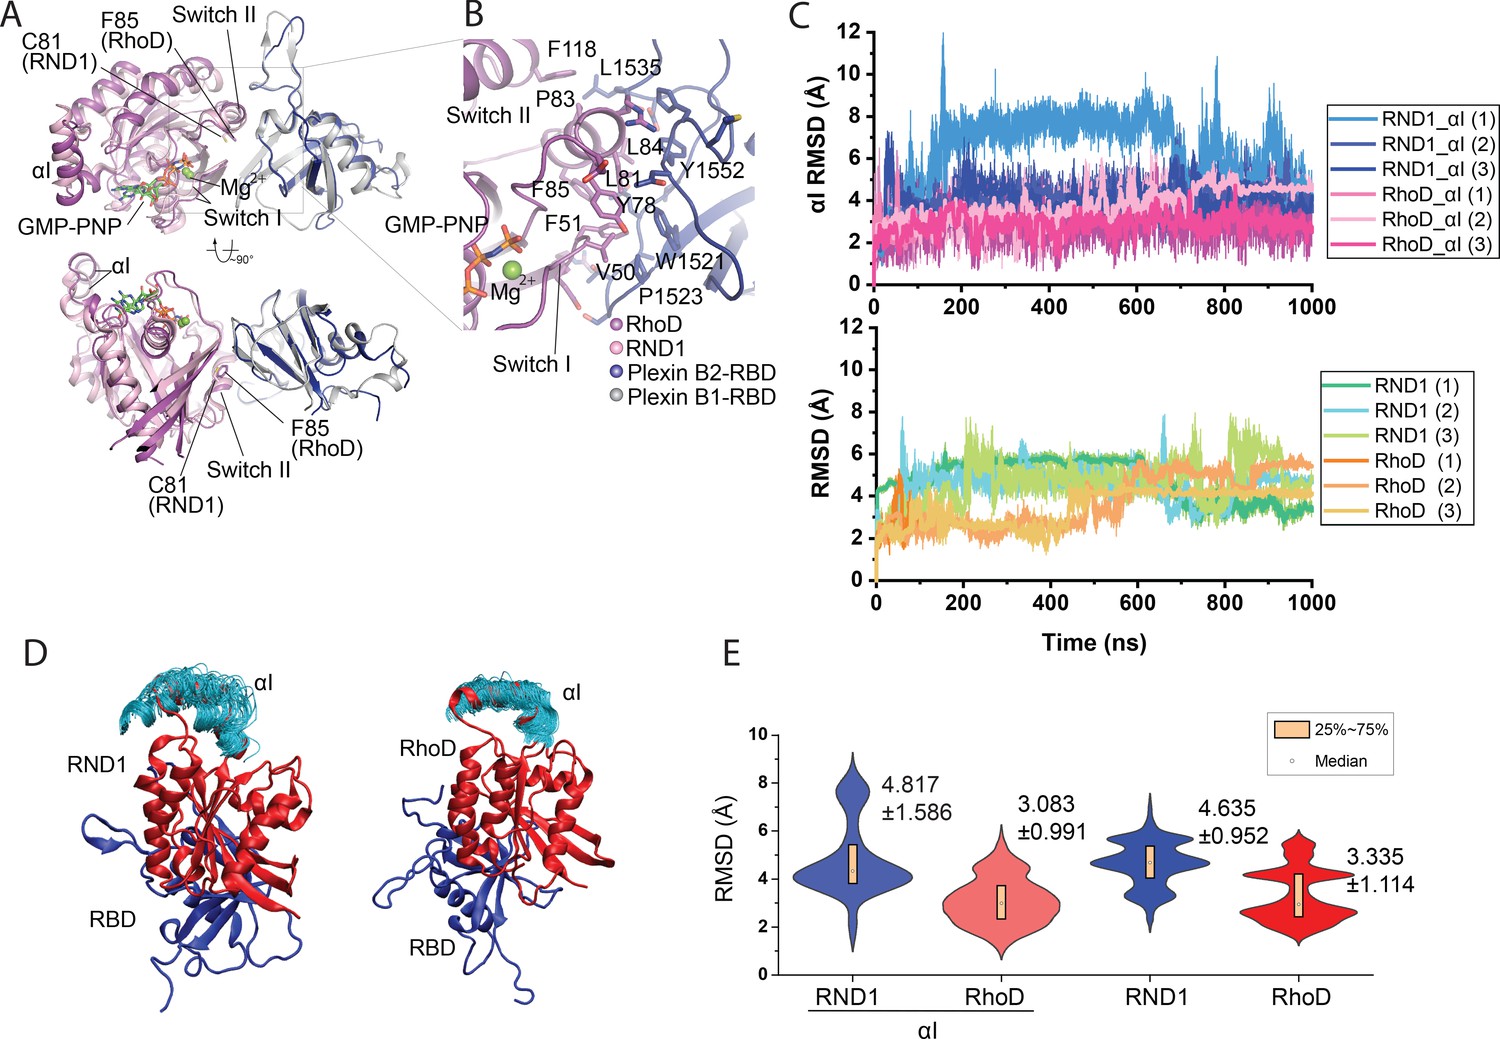
Crystal structure of the RhoD/plexin B2-RBD complex.
(A) Overall structure of the RhoD/plexin B2-RBD complex based on the domain-swapped dimeric structure (Figure 1—figure supplement 1). The structure of RND1/plexin B1-RBD complex (PDB ID: 2REX) is superimposed based on the RBD for comparison. (B) Expanded view of the binding interface between RhoD and plexin B2-RBD. (C) The Cα root mean square deviation (RMSD) of the RND1 and RhoD catalytic domains and their respective αI helices with respect to the initial positions in simulations of the RND1-RBD and RhoD-RBD complex structures (three 1-μs-long simulations for each system). In calculating the RMSDs, the RBD domains were aligned. (D) Multiple snapshots of the αI helix in the simulations (with the RBD aligned). As shown, the αI of RND1 appears more flexible in the simulations. (E) The RMSD data shown in (C) represented in violin plots; the average and RMSD of the distributions are labeled. Consistent with the visualization shown in (D), RND1 appears to be more flexible conformationally when bound with RBD.
Figure 2—figure supplement 1
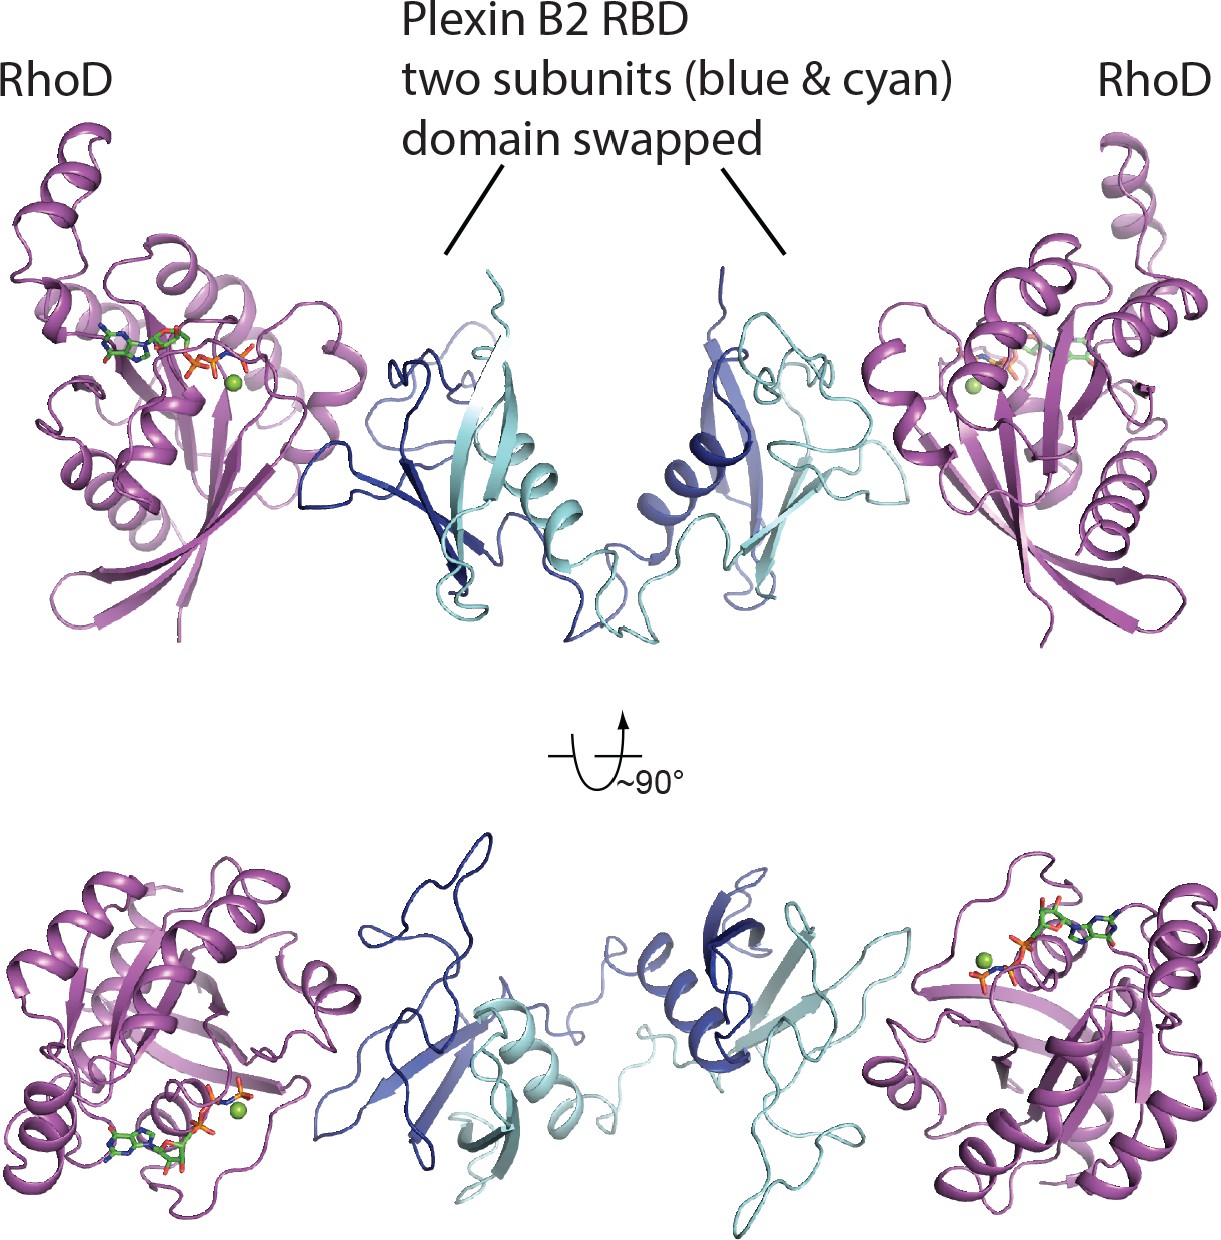
Two orthogonal views of the asymmetric unit of the RhoD/plexin B2-RBD complex crystal.
The two copies of the RBD, colored blue and cyan, respectively, form a domain-swapped dimer, which binds two RhoD molecules (magenta).
Figure 3 with 1 supplement
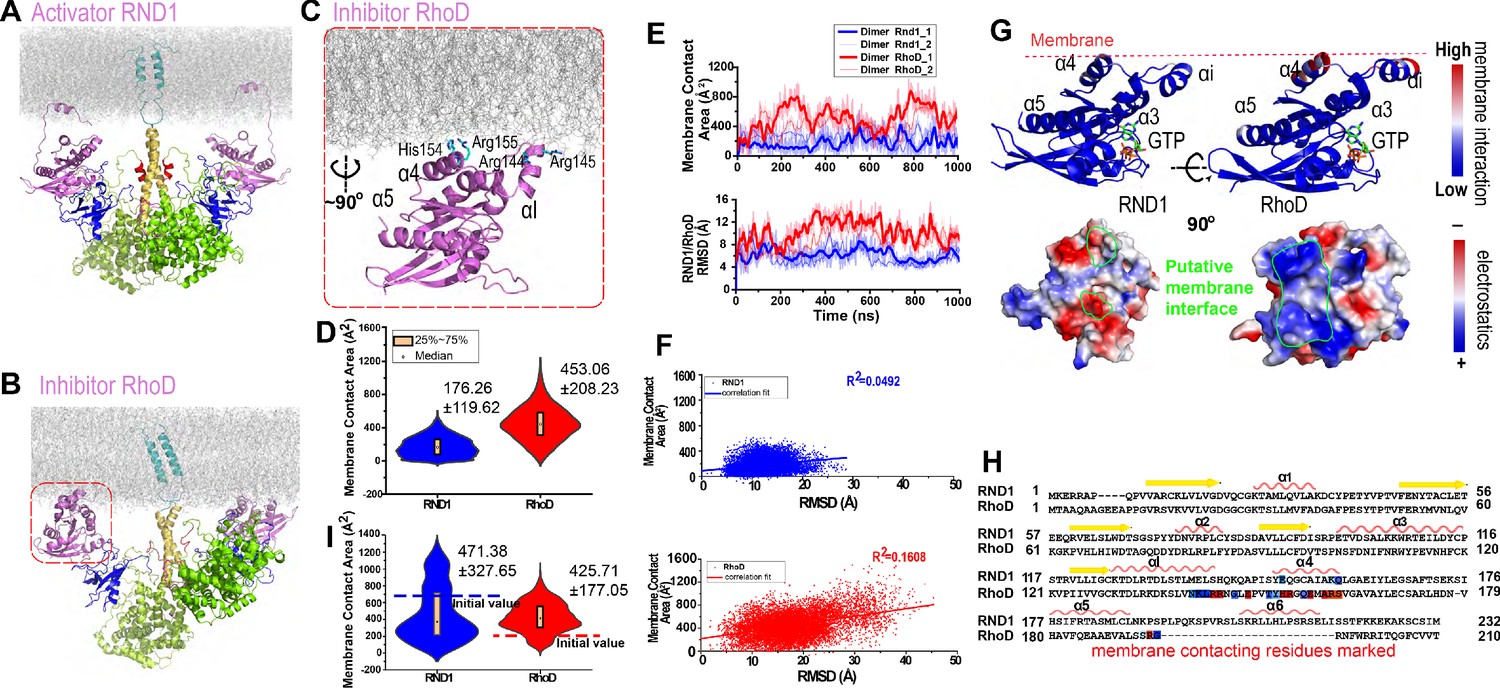
Plexin-bound RND1 and RhoD interact with the membrane differently.
(A, B) Representative snapshots of the simulations of RND1- and RhoD-bound plexin dimer. (C) Close-up view of the membrane interaction of RhoD bound with the plexin dimer. Primarily the membrane interface consists of the positive-charged residues of RhoD at the α4 and the αI helices. (D) Distributions of the membrane contact area of RND1 and RhoD bound with the plexin dimer. The data was compiled from three simulations each for the RND1- or RhoD-bound dimers. The average and root mean square deviation (RMSD) of each distribution are shown. The occurrence of apparent negative contact area is due to irregularity of the solvent-area program in cases of two objects being adjacent but not in contact with one another. (E) The time series of the membrane contact area of RND1 or RhoD in juxtaposition with the time series of the RMSD of the RND1 or RhoD catalytic domains with respect to their initial positions in two representative simulations. (F) Scatter plots of the membrane contract area and RMSD data shown in (E). As shown, the correlation is stronger for RhoD than for RND1. (G) Upper panels: the membrane contact residues of RND1 and RhoD indicated by color coding (the color coding indicates the number of lipid residues within 5 Å of the residue average in all simulations of the RND1- or RhoD-bound plexin dimer); lower panels: the surface electrostatic properties of RND1 and RhoD around their respective membrane-contacting regions. (H) Sequence alignment of RND1 against RhoD showing that (1) the positively charged membrane-contacting residues of RhoD are mostly not conserved in RND1, and (2) the C-terminal tail of RhoD is much shorter than that of RND1. The color coding of the membrane contact residues is inherited from (G). (I) RND1 and RhoD membrane contact areas obtained from the control simulations of plexin dimer, in which RND1 molecules were initiated at positions with large membrane contact while RhoD molecules were initiated at positions with little membrane contact (marked by the dashed lines). Further data from these control simulations are shown in Figure 3—figure supplement 1B, C. The average and RMSD for each distribution are shown.
Figure 3—figure supplement 1
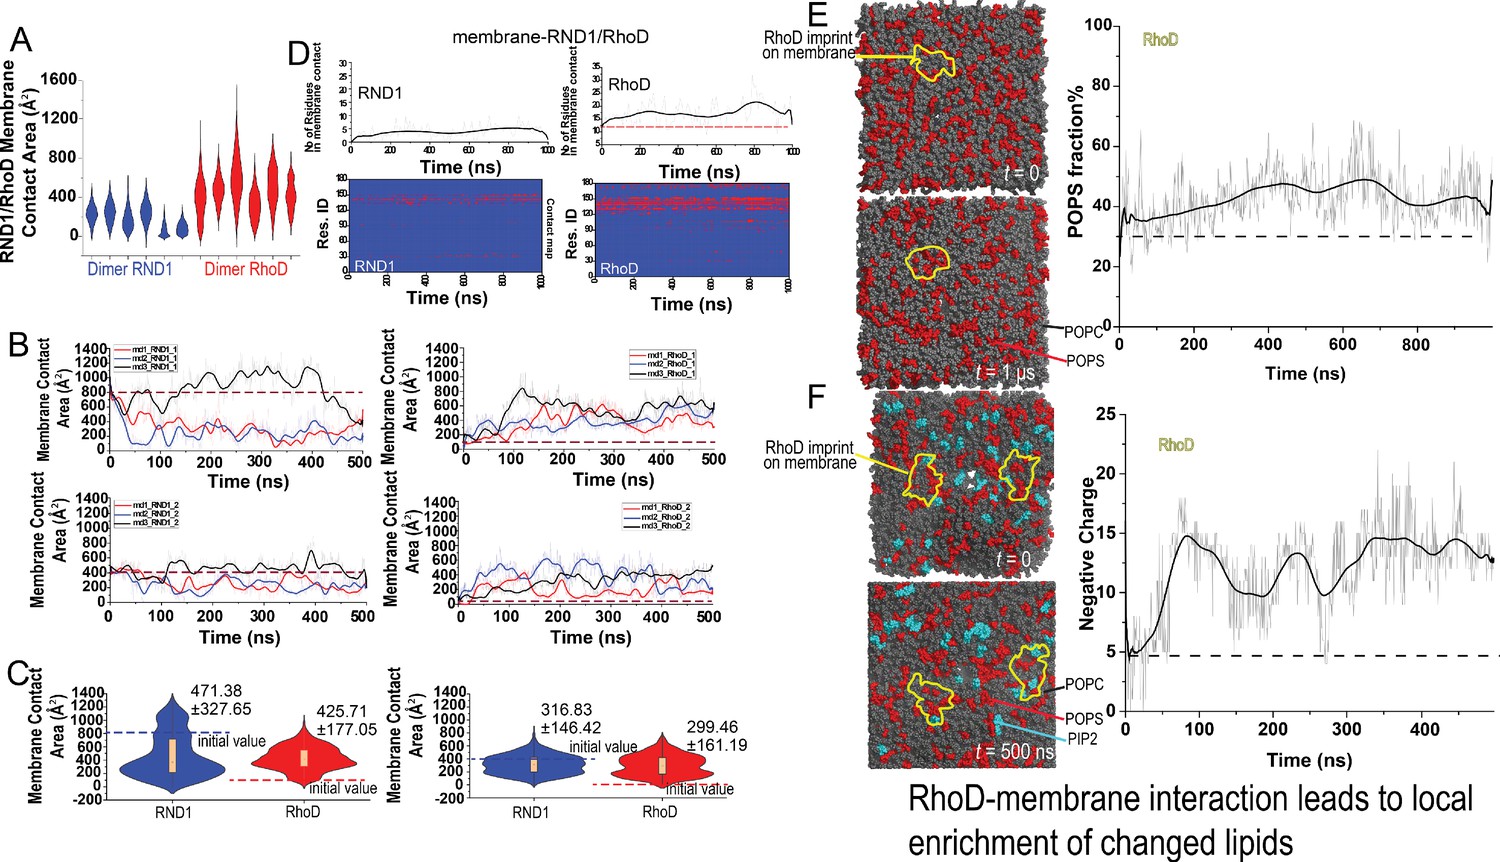
Additional data on RND1/RhoD-membrane contact and charged lipid enrichment.
(A) Distributions of the membrane contact area of RND1 and RhoD bound with the plexin dimer. The data was from three simulations each of the RND1- and RhoD-bound dimers; each system contained two RND1 or RhoD molecules, hence the six sets of data. The compiled data are shown in Figure 3D. (B) The membrane contact area or RND1 or RhoD from the three simulations each of the RND1- and RhoD-bound dimers; each system contained two RND1 or RhoD molecules, hence the six sets of data, respectively. The initial positions of RND1 were inherited from the end of a RhoD-bound plexin dimer simulation, with extensive RND1-membrane contact (the dashed line). Conversely, the initial positions of RhoD were inherited from the end of an RND1-bound plexin dimer, with limited RhoD-membrane contact (the dashed line). As shown, the RND1 membrane contact area generally decreased while the RhoD membrane contract area increased in the simulations. (C) The membrane contact area data (B) shown in violin plots. The left and the right regulatory GTPases are shown separately. The left panel is shown in Figure 3I and here again for completeness. (D) RND1/RhoD-membrane contact map in a simulation of RND1-bound plexin dimer and another of RhoD-bound plexin dimer. The lower panels show the residue contact maps, and the upper panel show the total numbers of residues as functions of time. (E) 1-Palmitoyl-2-oleoyl-sn-glycero-3-phospho-L-serine (POPS) (negatively charged) lipids (red) are enriched at the RhoD interface (left panels); the percentage of POPS relative to all lipids in the interface is consistently higher than the 30% average (right panel). This is a plexin dimer system with two RhoD molecules, but membrane imprint for only one is shown because the other RhoD molecule bears much less membrane contact. (F) POPS (red) and phosphatidylinositol (4,5)-bisphosphate (PIP2) (green) charged lipids are enriched at the RhoD interfaces (left panels) in simulations. The number of lipid charges in interaction with RhoD increased in the simulation (right panel).
Figure 4 with 1 supplement

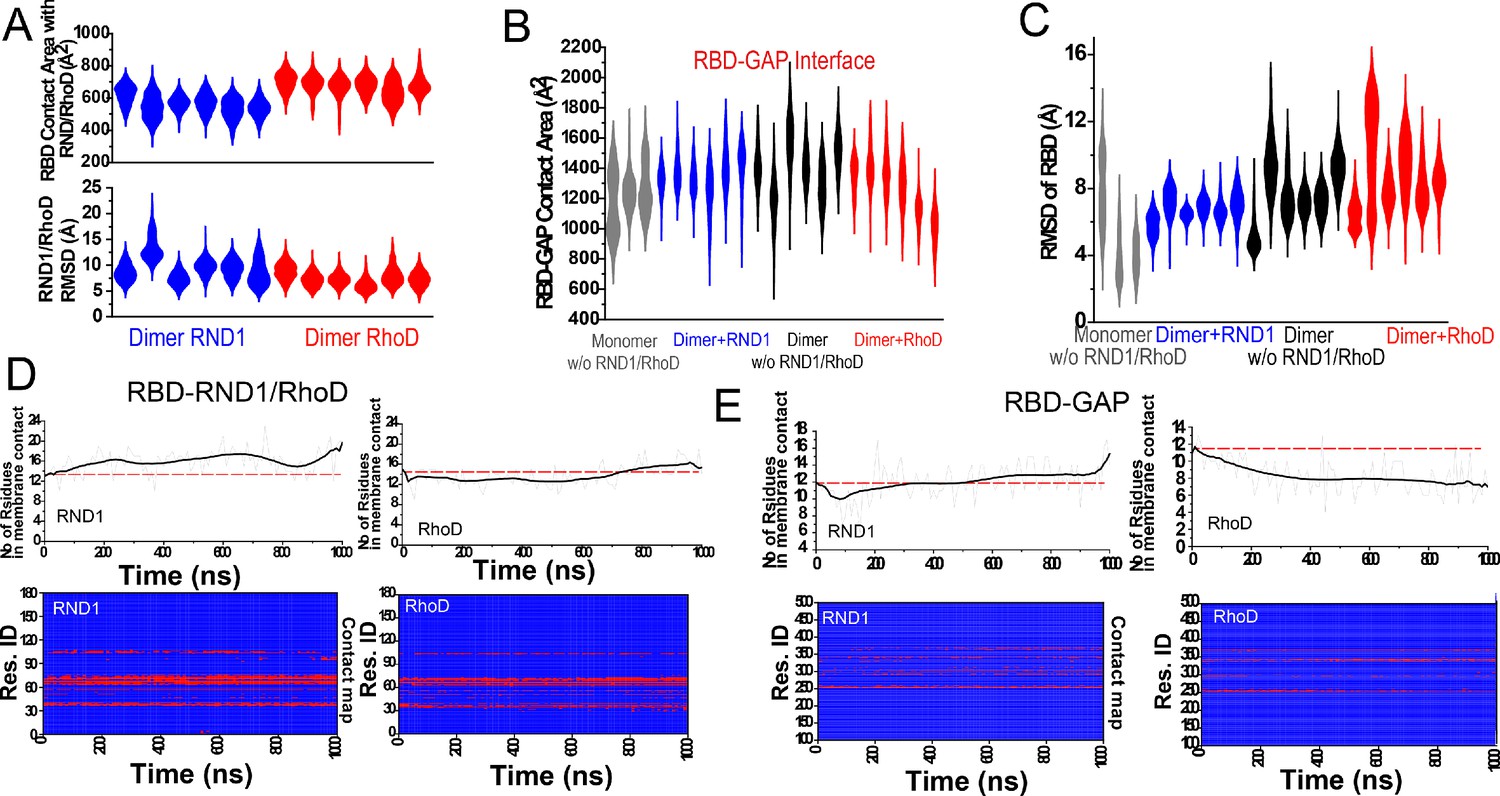
RND1- and RhoD-bound RBD domains are positioned differently with respect to their respective GAP domains.
(A) RhoD-bound plexin dimer. (B) A close-up of a part of the plexin dimer illustrating the relative positions of the membrane, the RhoD (or RND1) GTPase (purple), the RBD domain (blue), the GAP domain (green), and the dimerization helices (yellow). (C) The RBD contact area of RND1 and RhoD, together with the relative flexibility of RND1 or RhoD relative to the respective RBD domains in terms of root mean square deviation (RMSD) of the catalytic domains with the RBD domains aligned. The RBD complexes of both RND1 and RhoD appear stable. The data sets were compiled from three 1-μs-long simulations each for RND1- and RhoD-bound plexin dimer; the individual distributions are shown in Figure 3—figure supplement 1D. As in similar panels, the average and RMSD for each distribution are shown. (D) The contact area of the RBD domains with their respective GAP domains. In addition to simulations of the RND1- and RhoD-bound plexin dimers, simulations of the plexin dimer and monomer with the RBD domains unoccupied are also included. RhoD-binding appears to moderately reduce the RBD-GAP contact area. The individual data sets from the simulations are shown in Figure 3—figure supplement 1E. (E) RBD flexibility relative to the GAP domain indicated by RMSD of the RBD domain measured with the GAP domain aligned. The data suggest that RND1 binding stabilizes the RBD conformation and RhoD binding destabilizes it. The data from simulations of the plexin monomer and dimer with unoccupied RBD suggests that the RBD domain is inherently flexible relative to the GAP domain. The individual data sets from the simulations are shown in Figure 3—figure supplement 1F. (F) Conformations of the RBD domain relative to the GAP domain in existing crystal structures of plexins. The GAP domain is aligned in generating this figure.
Figure 4—figure supplement 1
Additional data on root mean square deviation (RMSD) and domain-domain contact.
(A) The RBD contact area with RND1 and RhoD, and RMSD of the RND1 and RhoD catalytic domains with the RBD domains aligned from three 1-μs simulations each for RND1- and RhoD-bound plexin dimer. (B) The contact area of the RBD domains with their respective GAP domains. In addition to the six simulations of the RND1- and RhoD-bound plexin dimers, three simulations each for RBD-unoccupied plexin dimer and RBD-unoccupied monomer are also included. The compiled data are shown in Figure 4D. (C) RBD flexibility relative to the GAP domain indicated by RMSD of the RBD domain measured with the GAP domain aligned. (B) and (C) represent the same sets of simulations, and the same data in compiled form are shown in Figure 4D, E. (D) RND1 and RhoD contact with the RBD domain in a simulation of RND1-bound plexin dimer and another of RhoD-bound plexin dimer. The lower panels show the residue contact maps, and the upper panel shows the total numbers of residues as functions of time. (E) RBD contact with the GAP domain. These data in Figure 3—figure supplement 1D (D, E) together showed that in the simulation of RhoD-bound plexin dimer RhoD interaction with the membrane developed in concert with the weakening of the RBD-GAP interaction. The analysis is consistent with the notion that RND1 interaction with the membrane is limited.
Figure 5 with 1 supplement
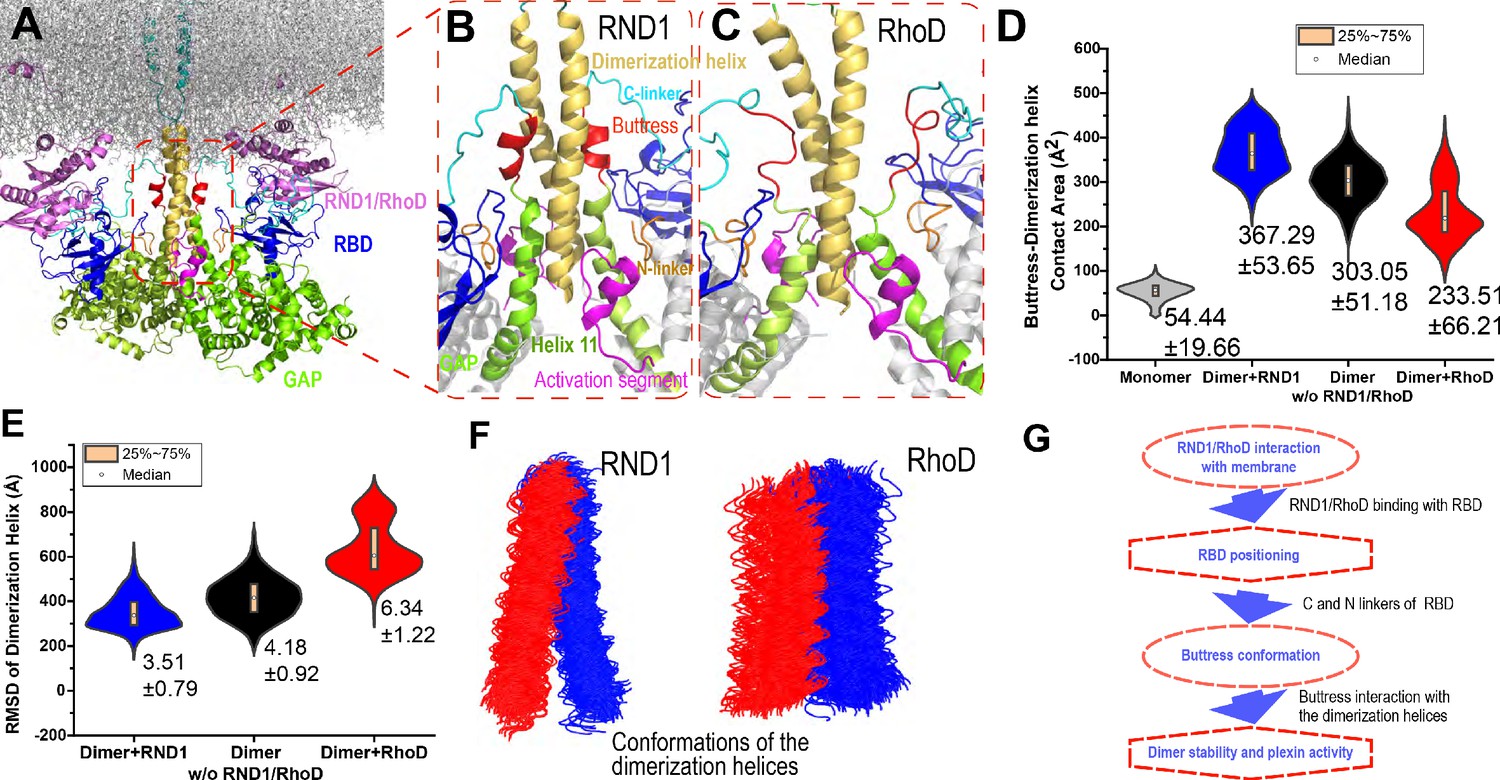
Interaction between the buttress segment and the dimerization helices.
(A) RhoD- or RND1-bound plexin dimer. (B) Close-up of the RND1-bound dimer centered at the dimerization helices (yellow). The buttress segments (red), Helix 11 (green), the RBD domains (blue), the N (orange) and C (cyan) linkers of the RBD domains, and the activation segments (purple) are shown. (C) A similar close-up of the RhoD-bound dimer. (D) Contact area of the buttress segment with the dimerization helix. As shown, RND1 binding moderately raises the contact area, and RhoD reduces the contact area. The individual data sets from the simulations are shown in Figure 3—figure supplement 1G. (E) The root mean square deviation (RMSD) of the dimerization helices in plexin dimers as a measurement of the stability of the dimerization interface. RhoD binding clearly destabilizes the dimerization interface. The individual data sets from the simulations are shown in Figure 3—figure supplement 1H. The average and RMSD for each distribution are shown. (F) Snapshots of the dimerization helices. As shown, the dimerization helices are more flexible with respect to one another in the RhoD-bound plexin dimer. (G) A schematic summary of the mechanism by which RhoD and RND1 binding regulate plexin dimerization.
Figure 5—figure supplement 1
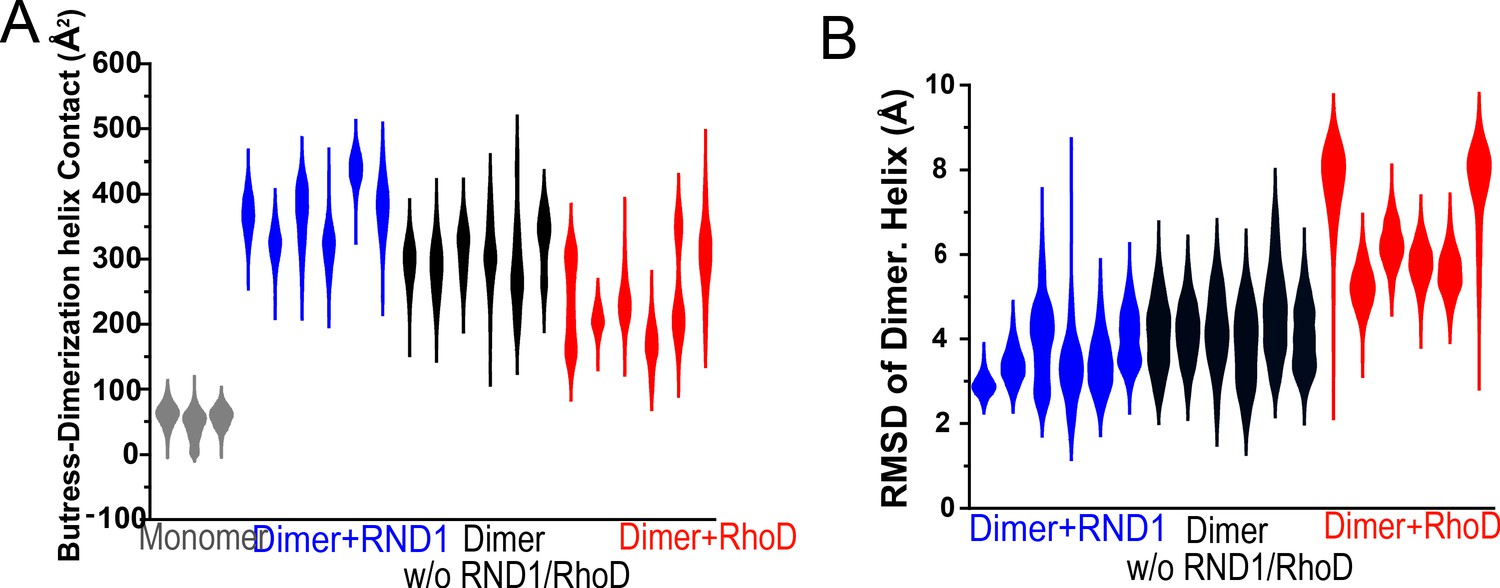
Additional data on root mean square deviation (RMSD) and the buttress-dimerization helices contact.
(A) Contact area of the buttress segment with the dimerization helix in three simulations each for RBD-free, RND1-bound, RhoD-bound dimers, and for plexin monomer. (B) The RMSDs of the dimerization helices in plexin dimers as a measurement of the stability of the dimerization interface. It represents three simulations each for RBD-free, RND1-bound, RhoD-bound dimers. This panel represents all of the dimer simulations represented in S4B, S4C, and S5A. The compiled data are shown in Figure 5E.
Figure 6
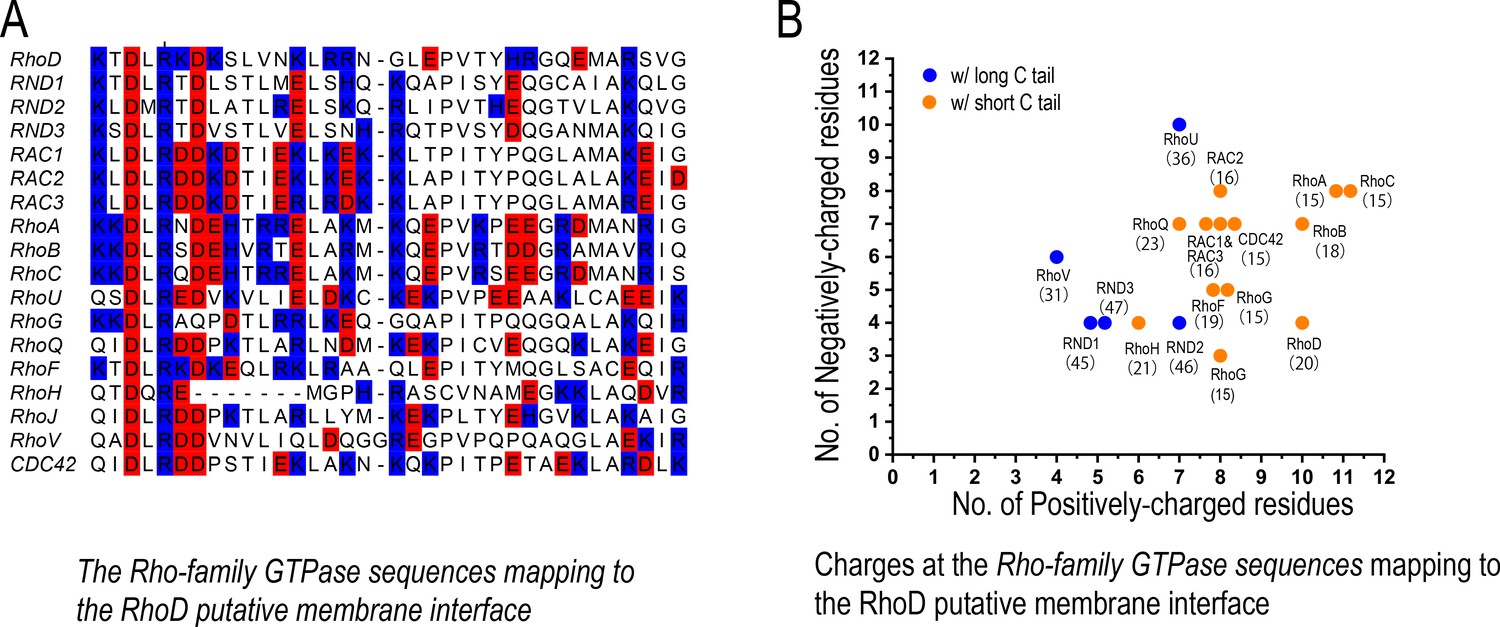
The charge distribution at the putative membrane interface of Rho-family GTPases.
(A) Sequence alignment of Rho-family GTPases at the region of the putative membrane interface; red denotes negatively charged residues, and blue denotes positively charged residues. All members of the Rho family are included in this analysis with the exception of RHBT1, RHBT2, and RHBT3, which furnish another domain C-terminal to the catalytic domain. (B) The number of positively and negatively charged residues at the membrane interface. The protein name and the number of residues of its C-terminal tail are marked next to each data point herein. Long and short C tails are also color-coded.
Additional files
-
Supplementary file 1
Diffraction data and refinement statistics of the crystal structure.
- https://cdn.elifesciences.org/articles/64304/elife-64304-supp1-v2.docx
-
Transparent reporting form
- https://cdn.elifesciences.org/articles/64304/elife-64304-transrepform-v2.docx
Download links
A two-part list of links to download the article, or parts of the article, in various formats.
Downloads (link to download the article as PDF)
Open citations (links to open the citations from this article in various online reference manager services)
Cite this article (links to download the citations from this article in formats compatible with various reference manager tools)
A putative structural mechanism underlying the antithetic effect of homologous RND1 and RhoD GTPases in mammalian plexin regulation
eLife 10:e64304.
https://doi.org/10.7554/eLife.64304


