SATB2 induction of a neural crest mesenchyme-like program drives melanoma invasion and drug resistance
- Howard Hughes Medical Institute, Stem Cell Program and the Division of Pediatric Hematology/Oncology, Boston Children’s Hospital and Dana-Farber Cancer Institute, Harvard Medical School, United States
- Department of Stem Cell and Regenerative Biology, Harvard Stem Cell Institute, United States
- Brigham and Women’s Hospital, Department of Pathology, United States
- Stem Cell Program and the Division of Pediatric Hematology/Oncology, Boston Children’s Hospital and Dana-Farber Cancer Institute, Harvard Medical School, United States
- Division of Medical Oncology, Department of Medicine, Washington University in Saint Louis, United States
- Department of Developmental Biology, Washington University in Saint Louis, United States
- Memorial Sloan Kettering Cancer Center and Weill-Cornell Medical College, United States
Figures
Figure 1 with 4 supplements
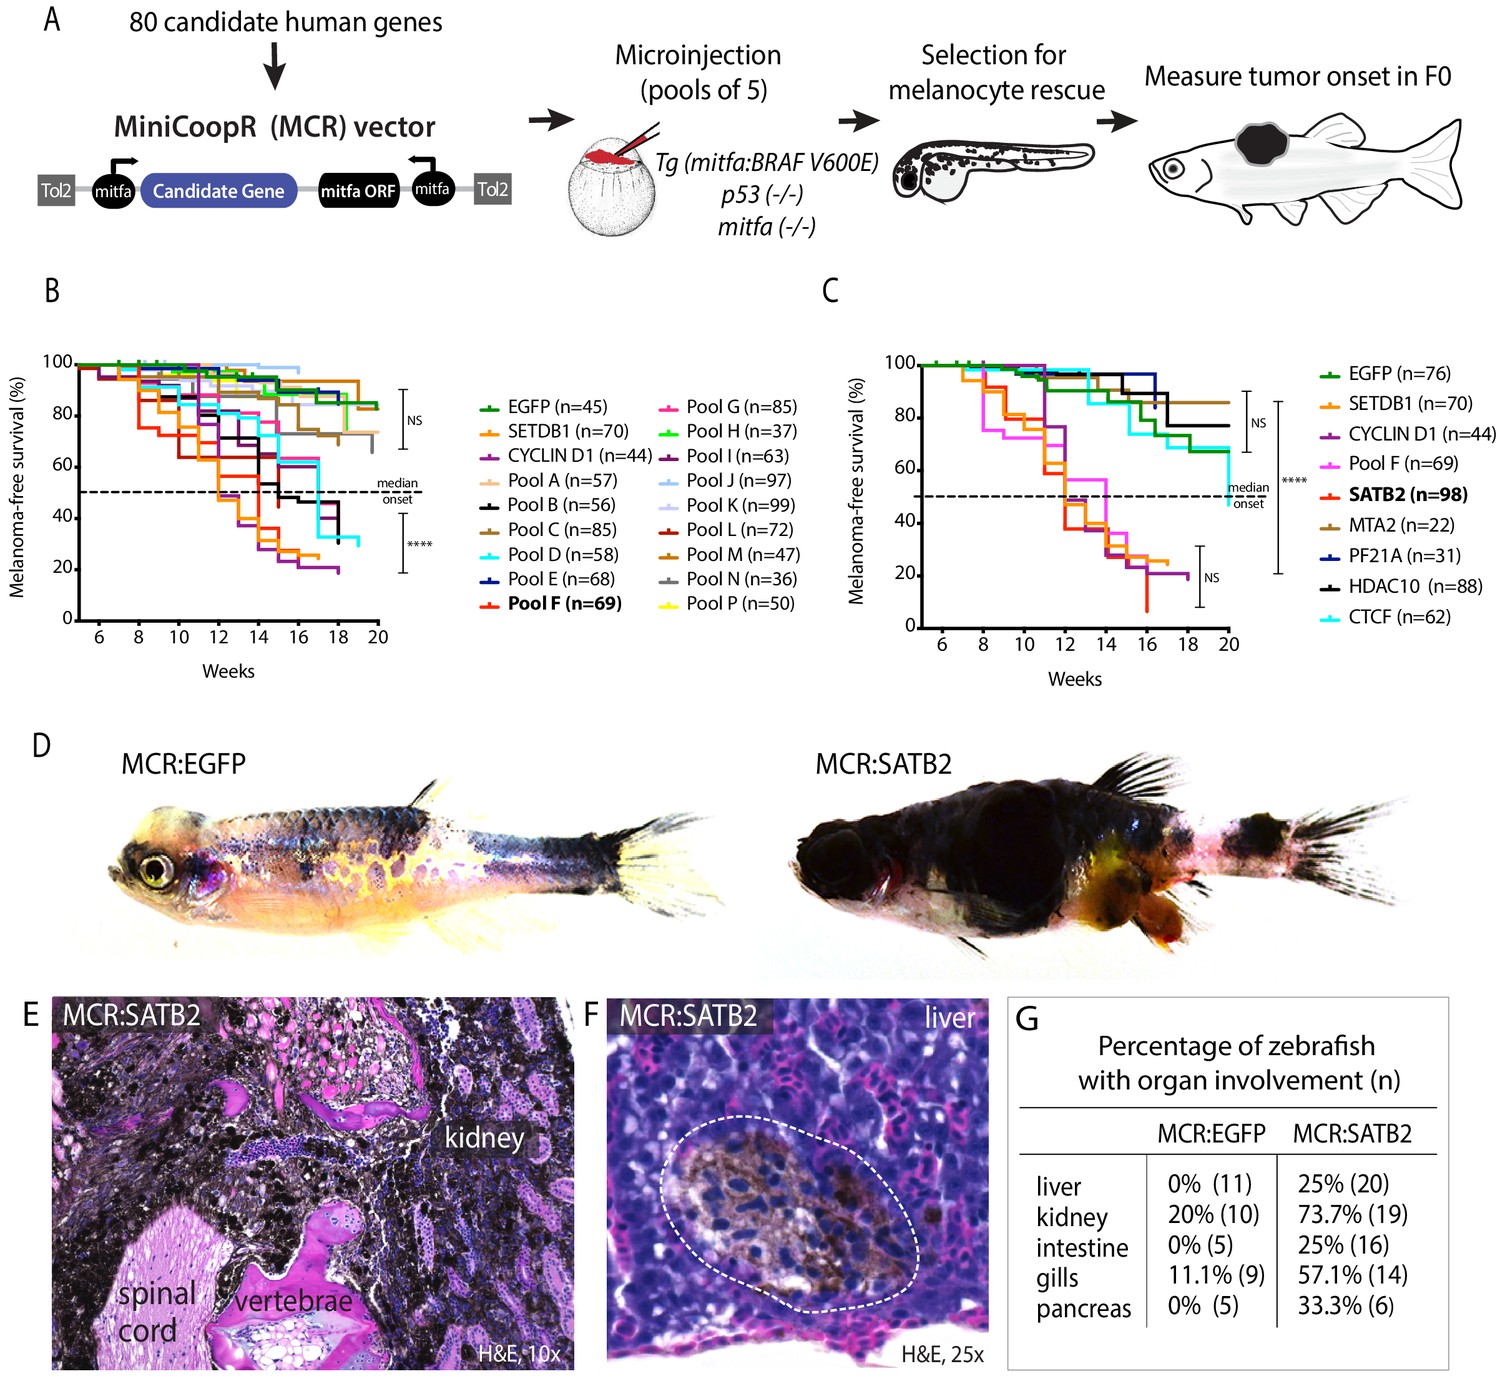
Overexpression screen of epigenetic regulators identifies SATB2 as an accelerator of melanoma formation in zebrafish.
(A) Schematic overview of screening strategy: MCR expression vector-based reintroduction of the melanocyte master transcription factor mitfa, rescues melanocytes and melanoma development. All rescued melanocytes in F0 microinjected embryos also express a candidate human factor. (B) Kaplan-Meier melanoma-free survival curves of pooled chromatin factor screen. Six pools were significant [Log-rank (Mantel-Cox) test p<0.0001****]. Pool F (red) had the strongest acceleration effect (Median onset 14 weeks). (C) Single factor validation of pool F identifies SATB2 to induce accelerated melanoma onset [Median onset 12 weeks, Log-rank (Mantel-Cox) test, p<0.0001****]. (D) Zebrafish MCR:SATB2 tumors are aggressive compared to an MCR:EGFP age-matched control. (E) Histopathological analysis revealed that MCR:SATB2 tumors are highly invasive, here shown to invade through the spinal cord, vertebrae, and kidney. (F) Isolated melanoma cell clusters were found in the liver, and (G) frequent organ involvement is observed in MCR:SATB2 compared to MCR:EGFP controls.
-
Figure 1—source data 1
Kaplan-Meier melanoma-free survival curves input files in weeks showing (1 = tumor, 0 = no tumor/censored, no value = lost at follow up).
- https://cdn.elifesciences.org/articles/64370/elife-64370-fig1-data1-v2.xlsx
Figure 1—figure supplement 1

Single factor validation of additional pools.
Kaplan-Meier melanoma-free survival curves of single factor validation of non-significant pool C (A) and significantly accelerating pool G (B), pool I (C), and pool B (D) from Figure 1B. MCR:EGFP (green), MCR:SATB2 (red), and the respective pool (orange) are plotted as controls in each panel. Log-rank (Mantel-Cox) test p values for significant individual genes in the pool vs. MCR:EGFP control are shown (n.s.; not significant). SMARCAL1 and PCAF follow up ended at 13 weeks.
-
Figure 1—figure supplement 1—source data 1
Kaplan-Meier melanoma-free survival curves input files in weeks showing (1 = tumor, 0 = no tumor/censored, no value = lost at follow up).
- https://cdn.elifesciences.org/articles/64370/elife-64370-fig1-figsupp1-data1-v2.xlsx
Figure 1—figure supplement 2
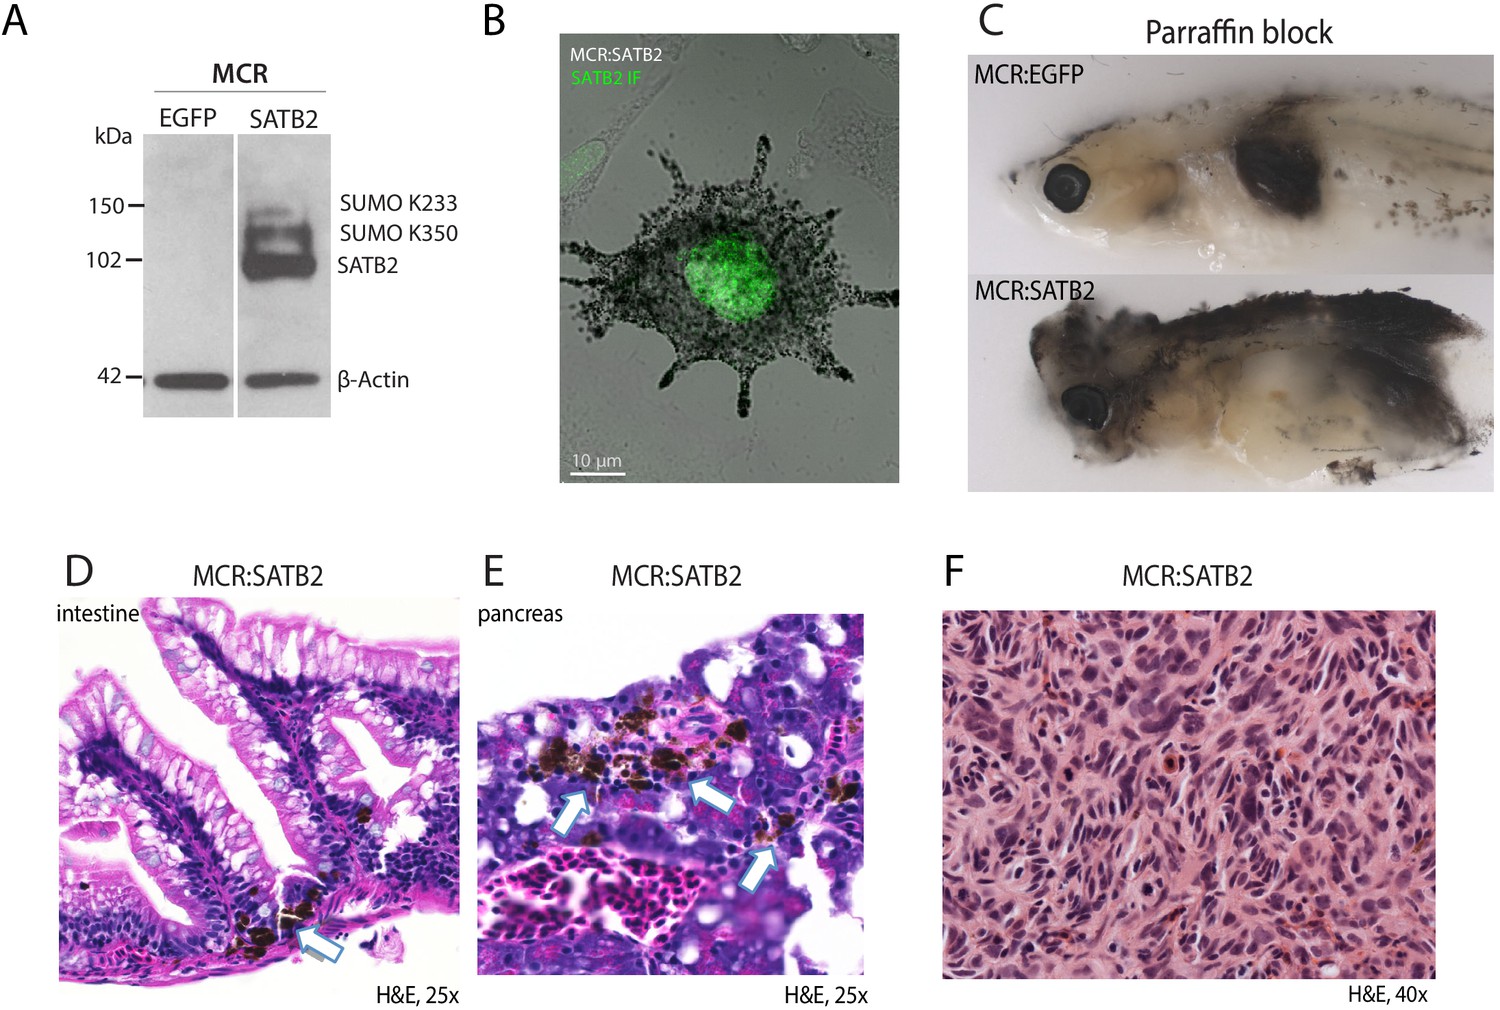
SATB2 overexpression leads to invasive melanoma with organ involvement.
(A) Western blot and (B) immunofluorescence validation of human SATB2 protein expression in MCR:SATB2 zebrafish primary tumors. (C) Cross-section through zebrafish mounted in a paraffin block. Compared to the MCR:EGFP-injected zebrafish which has a pigmented tumor with confined borders, in the MCR:SATB2-injected zebrafish dispersed pigmented tumor cells can be observed throughout the body. MCR:SATB2-injected zebrafish have increase organ involvement, as shown by pigmented melanoma cells (white arrow) in the (D) intestine, and (E) pancreas. (F) Histological aspect of MCR:SATB2 tumors illustrating spindle morphology of melanoma cells.
Figure 1—figure supplement 3

SATB2 is not sufficient and unlikley necessary for melanoma initiation in zebrafish.
(A) Kaplan-Meier survival curves showing that MCR:SATB2 acceleration is dependent on BRAFV600E and p53-/-. Plotted: MCR:EGFP (n = 44) and MCR:SATB2 (n = 98) into Tg(mitfa:BRAFV600E); p53-/-; mitfa-/-, compared to MCR:SATB2 into BRAF-/-; p53-/- (n = 44) and MCR:SATB2 into BRAF+/+; p53+/+ (n = 49). Log-rank (Mantel-Cox) test p values are shown. (B) T7E1 mutagenesis assay at the CRISPR target site in the satb2 gene. The assay was performed on genomic DNA from 2 dpf embryos injected at the one-cell stage with Cas9 mRNA and either a control gRNA (left) or a gRNA against satb2 (right). Cleavage bands (arrowheads, expected sizes 167 and 303 bp) indicate efficient mutagenesis at the target site. (C) Kaplan-Meier survival curves for p53 CRISPR (n-46), satb2 CRISPR-1 (n = 74), satb2 CRISPR-2 (n = 76) injected into [Tg(mitfa:BRAFV600E); p53-/-; mitfa-/-] suggest satb2 to likely be dispensable for melanoma initiation. Log-rank (Mantel-Cox) test, NS; not significant, ****p<0.0001. (D) Kaplan-Meier survival curves for MCR:SATB2 (n = 98), MCR:SATB1 (n = 107), and MCR:EGFP (n = 44) into Tg(mitfa:BRAFV600E); p53-/-; mitfa-/- showing that unlike SATB2, closely related gene SATB1 does not accelerate melanoma onset. Log-rank (Mantel-Cox) test, NS; not significant, ****p<0.0001.
Figure 1—figure supplement 4
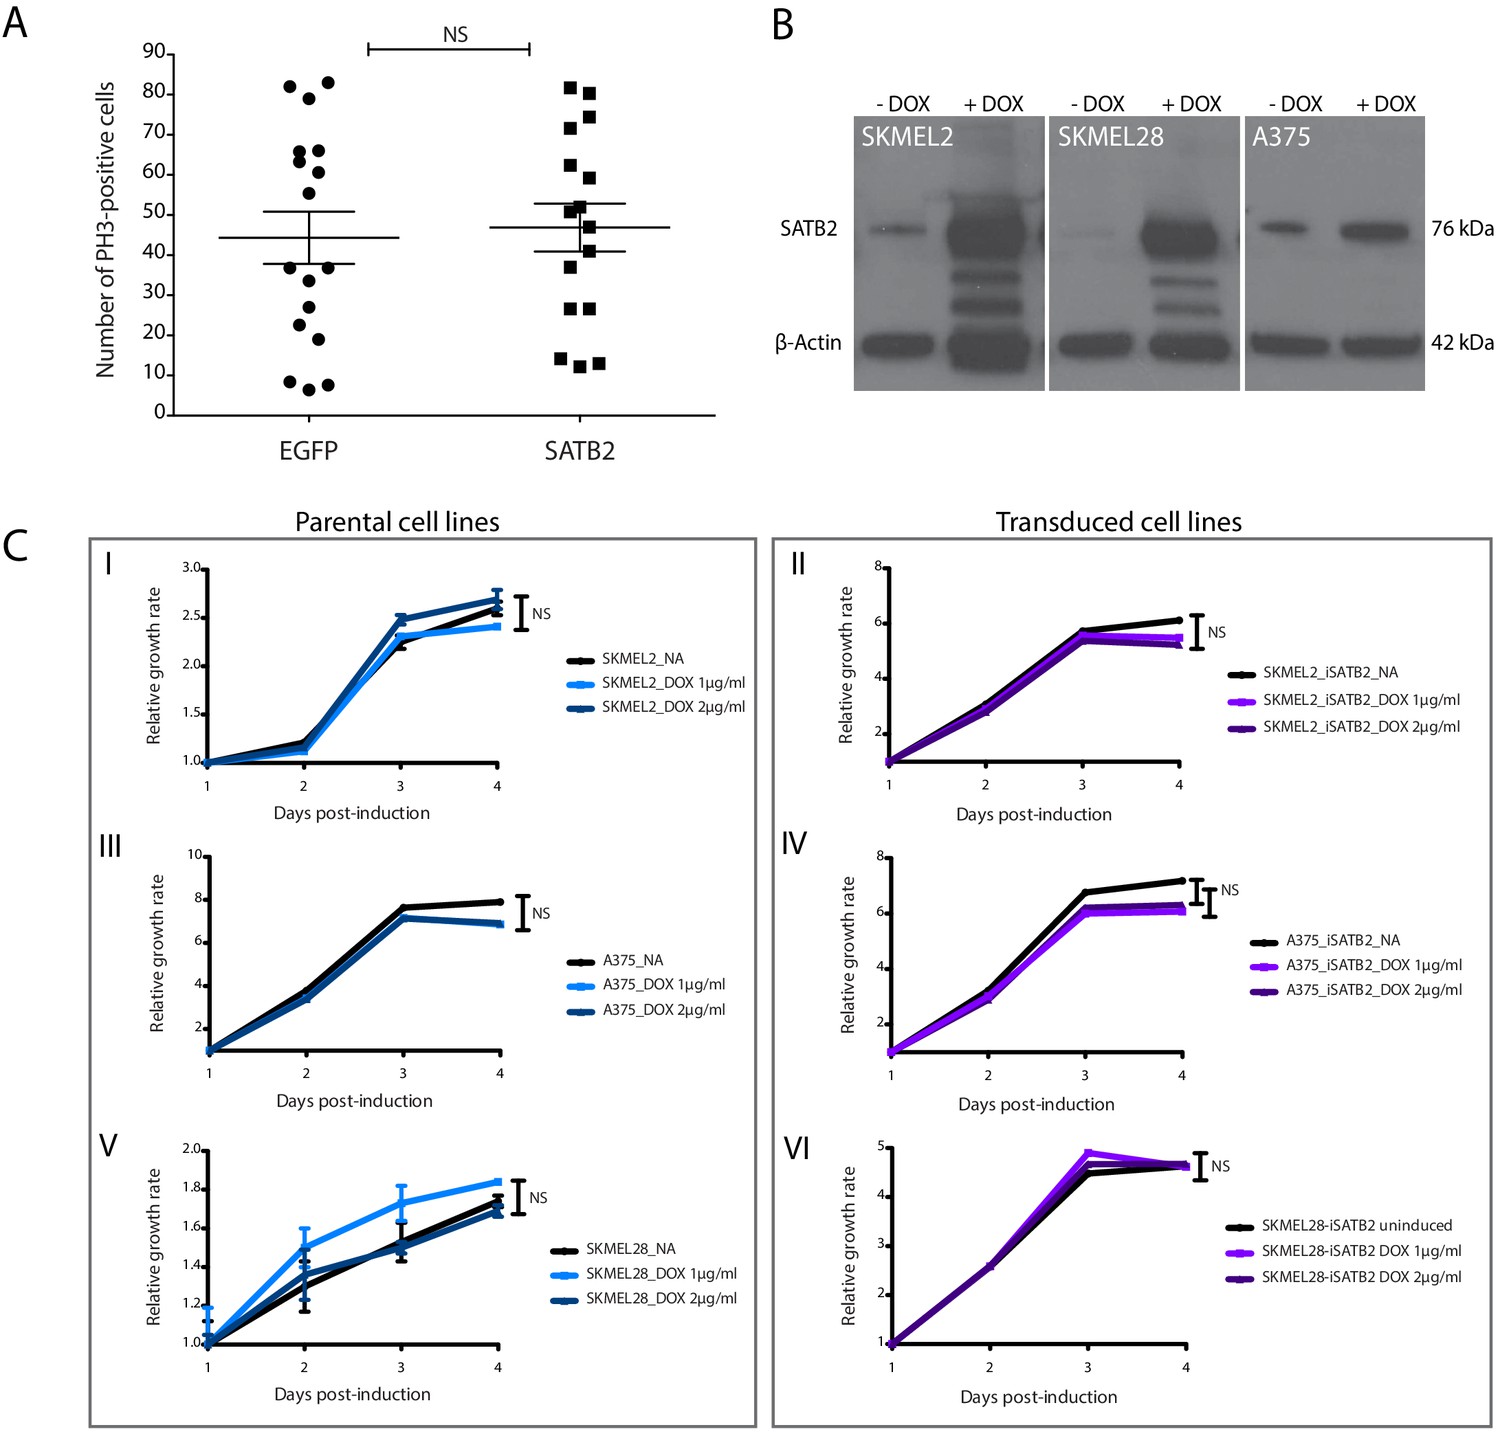
SATB2 overexpression does not affect proliferation.
(A) Proliferation rates in primary MCR:EGFP (n = 17) and MCR:SATB2 (n = 16) tumors are not statistically different (unpaired two-tailed t-test,), as determined by PH3 immunohistochemistry. (B) Western blot for SATB2 after DOX-induction in SKMEL2, SKMEL28 and A375 human melanoma cell lines. β-Actin was used as a loading control. The two lower bands in SKMEL2 and SKMEL28 are likely degradation products of SATB2 due to the overexpression. (C) Induction of SATB2 does not affect proliferation rates between parental and transduced cell lines, as determined by CellTiterGLO (NS; not significant).
Figure 2 with 3 supplements
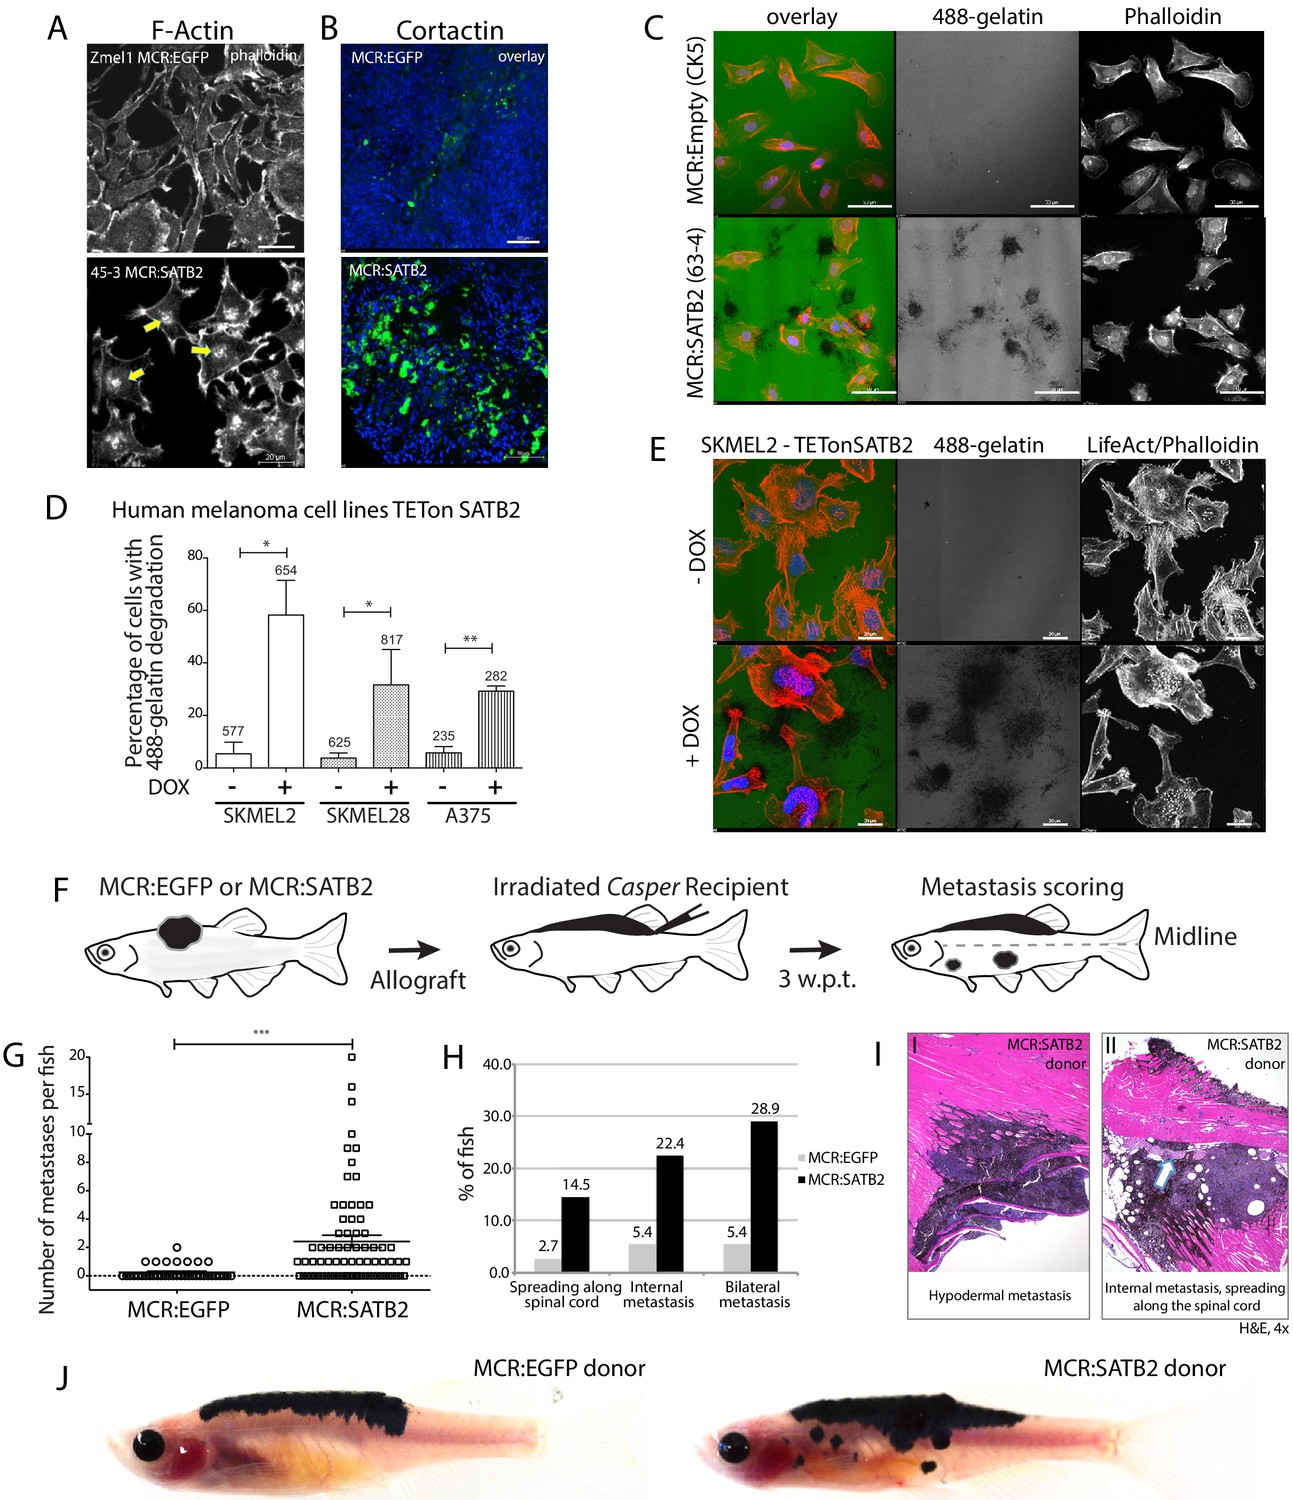
SATB2 leads to invadopodia formation and increased migration potential in vitro and in vivo.
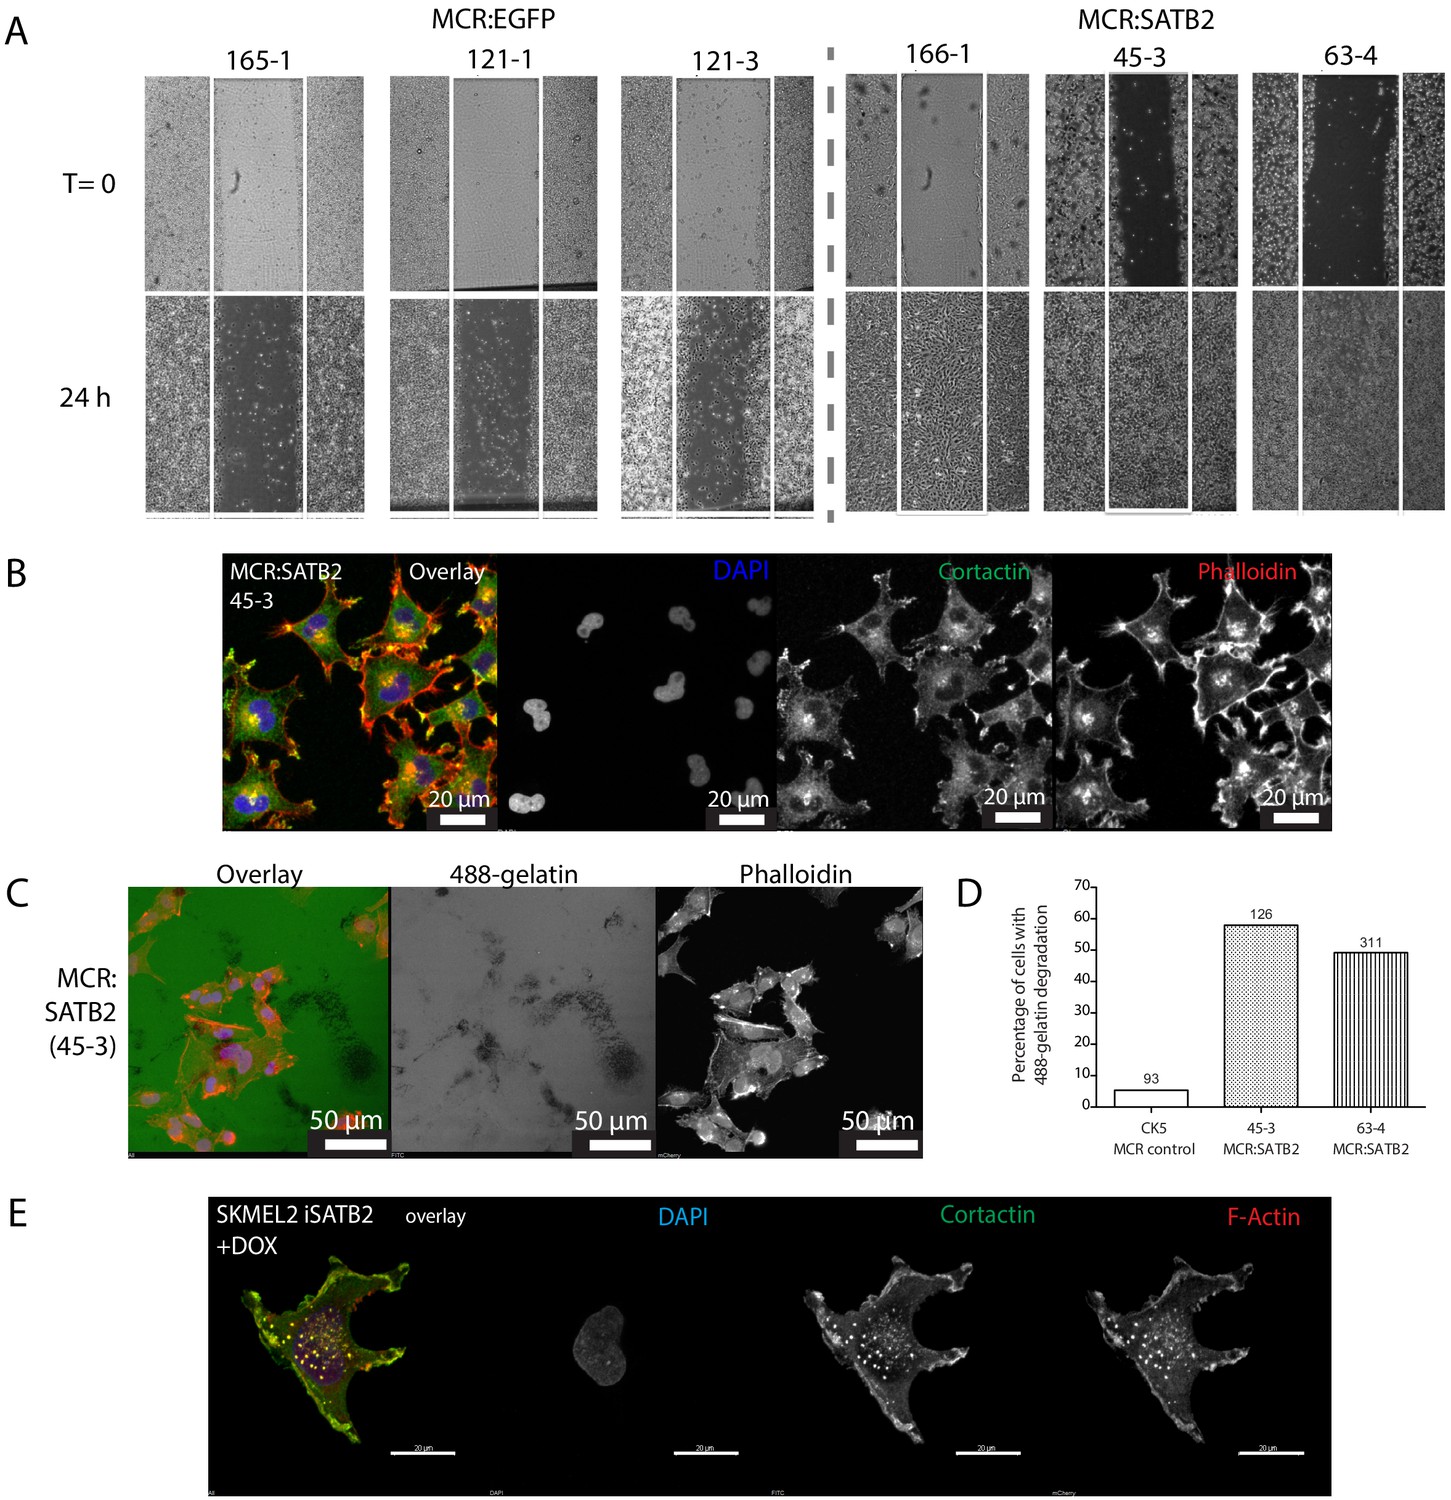
(A) Phalloidin staining for F-Actin in primary zebrafish melanoma cell culture, reveals the presence of F-actin-positive foci in MCR:SATB2 (45–3) cells, which are not present in MCR:EGFP (zmel1) cells. Scale bar is 20 μm. Primary tumor immunohistochemistry shows MCR:SATB2 tumors abundantly express Cortactin. Scale bar 50 μm. (B) MCR:SATB2 (63–4) cells show increased Oregon green 488-conjungated gelatin degradation, compared to MCR (CK5) cells 24–25 hr post-seeding. Scale bar is 50 μm. (C) Percentage of cells with degraded gelatin after SATB2 induction in iSATB2 human melanoma cell lines A375, SKMEL2, and SKMEL28 transduced with pInducer20-SATB2. Cells were seeded on gelatin in media +/- doxycycline after 48 hr +/- doxycycline induction. (D) Upon SATB2 induction in human melanoma cell line SKMEL2, cells form invadopodia and show increased matrix degradation Scale bar is 20 μm. (E) Orthotropic allograft migration assay in transparent Casper zebrafish. A total of 300,000 primary pigmented primary melanoma cells were transplanted into the dorsum of irradiated Casper recipients, which are monitored for the formation of pigmented distant metastasis that have spread past the anatomical midline. Metastases are represented as black circles. (F) Pooled recipient data at the experimental end point at 3.5 weeks post-transplantation, 59.4 ± 2.3% (SEM; n = 76 total recipients, grafted from seven individual donor tumors) of MCR:SATB2 transplants formed distant metastasis, compared to 21.8±4.5% (SEM; n = 37 total recipients grafted from five individual donor tumors) of EGFP-control transplants (p<0.0001). MCR:EGFP transplants developed an average 1.1 ± 0.4 (SD) distant metastasis per fish, versus 4 ± 4.2 (SD) in MCR:SATB2, where a maximum of 20 metastases per fish was observed. (G) MCR:SATB2 recipients more frequently developed bilateral (28.9%), and internal metastases (22.4%) compared to MCR:EGFP donors (5.4%), showing spreading along the neural tube (14.5% versus 2.7%). (H) At 3.5 weeks-post transplantation, compared to MCR:EGFP donor transplants, MCR:SATB2 transplants develop distant and internal metastases. Histopathology of MCR:SATB2 Casper recipients showing a (I–I) hypodermal metastasis, and (I–II) internal metastasis with spreading along neural tube.
Figure 2—figure supplement 1
SATB2 overexpression induces EMT, increased migration and invadopodia formation in zebrafish melanoma.
(A) Scratch assays on cultured MCR tumors show increased migration in MCR:SATB2 tumors. (B) Confocal analysis of immunohistochemistry of cultured MCR:SATB2 tumor shows co-localization of Cortactin (green) and F-actin (phalloidin, red), suggesting the formation of invadopodia. DAPI nuclear stain is shown in blue. (C) MCR:SATB2 (45–3) cells show increased Oregon green 488-conjungated gelatin degradation 24–25 hr post-seeding. Scale bar is 50 μm. (D) Percentage of zebrafish melanoma cells (n) with degraded 488-conjungated gelatin 24 hr post-seeding, observed in MCR (CK5, n = 93), MCR:SATB2 (45–3, n = 126), and MCR:SATB2 (63–4, n = 311) cell lines. (E) Immunofluorescence showing colocalization of F-actin and Cortactin in SKMEL2 overexpressing SATB2 in the presence of doxycycline (48 hr induction).
Figure 2—figure supplement 2
MCR:SATB2 primary tumors and long-term cultures have increase invasion potential in vivo.
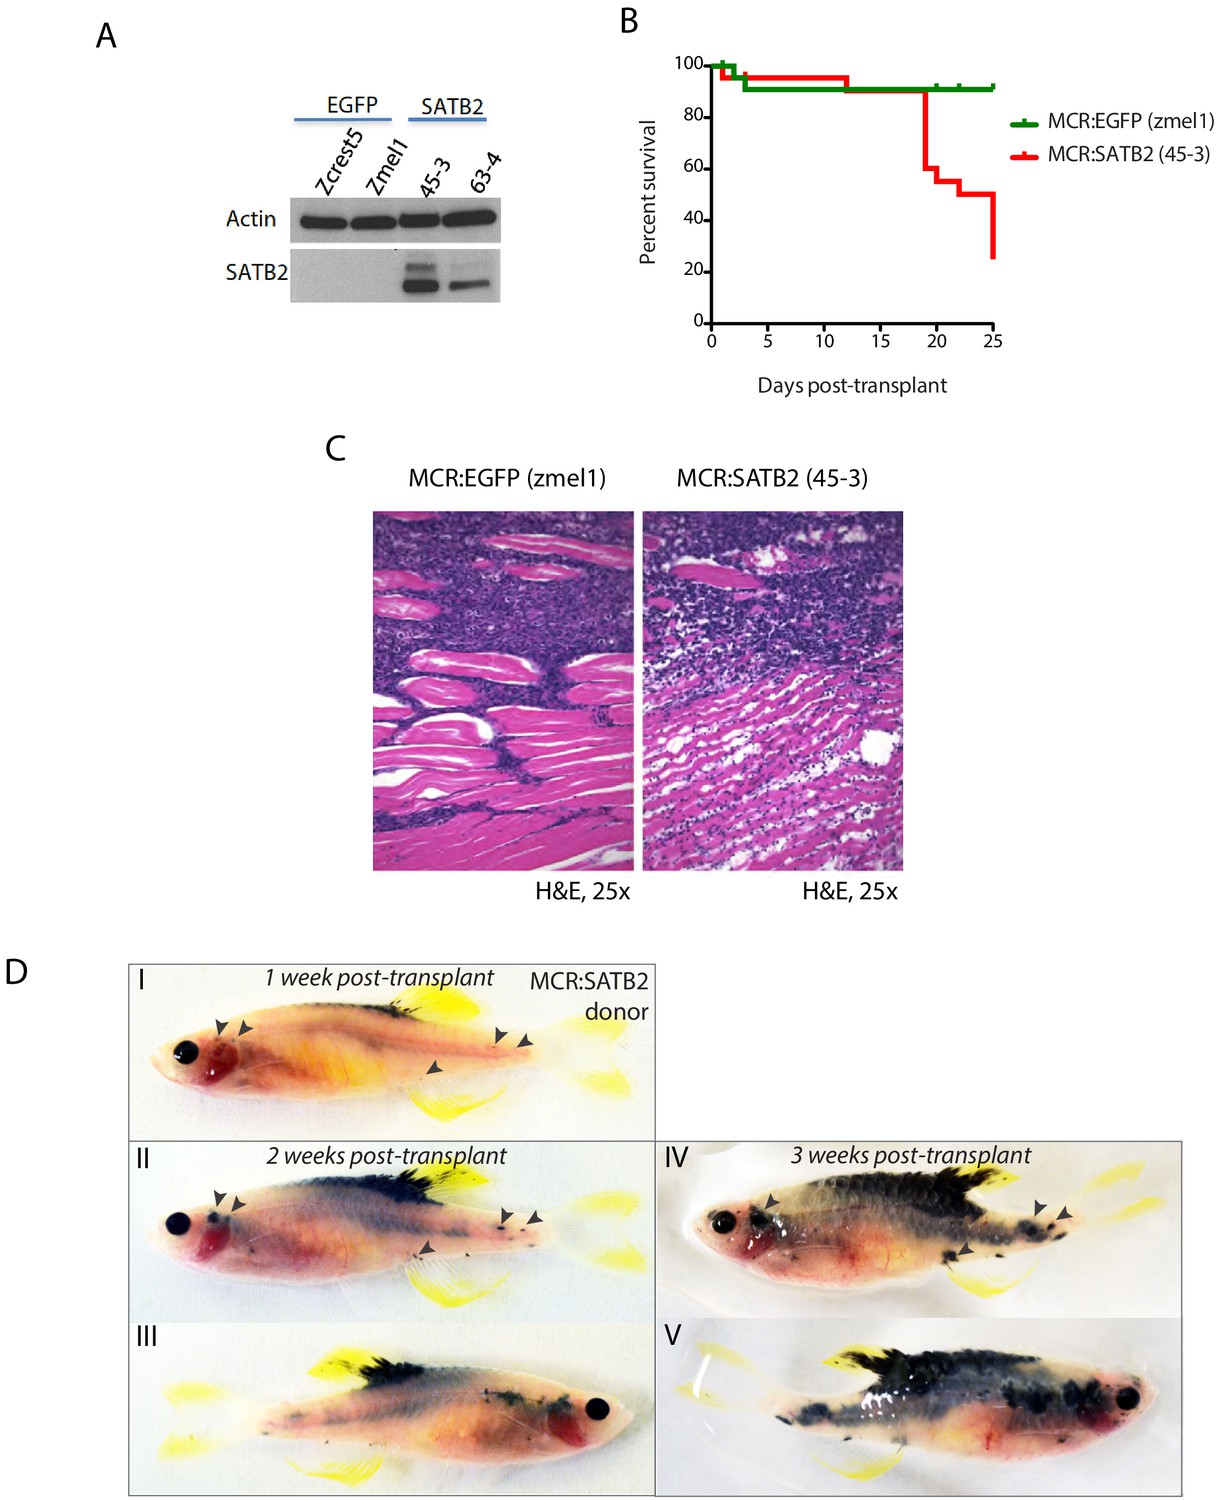
(A) Western blot of SATB2 showing retained expression in long term in vitro cultures derived from MCR:SATB2 tumors. Actin loading control is shown. (B) Overall survival and (C) histology of irradiated Casper recipients transplanted with MCR:EGFP Zmel1 (n = 31) or MCR:SATB2 45–3 (n = 31) zebrafish long term in vitro cultures. (D) Weekly prospective imaging of primary MCR:SATB2 individual tumor donor allograft in irradiated Casper recipient. Arrows indicate distant metastasis from injection site. Related to Figure 2H.
Figure 2—figure supplement 3
Analysis of SATB2 expression, amplification, and correlation with survival in human melanoma.
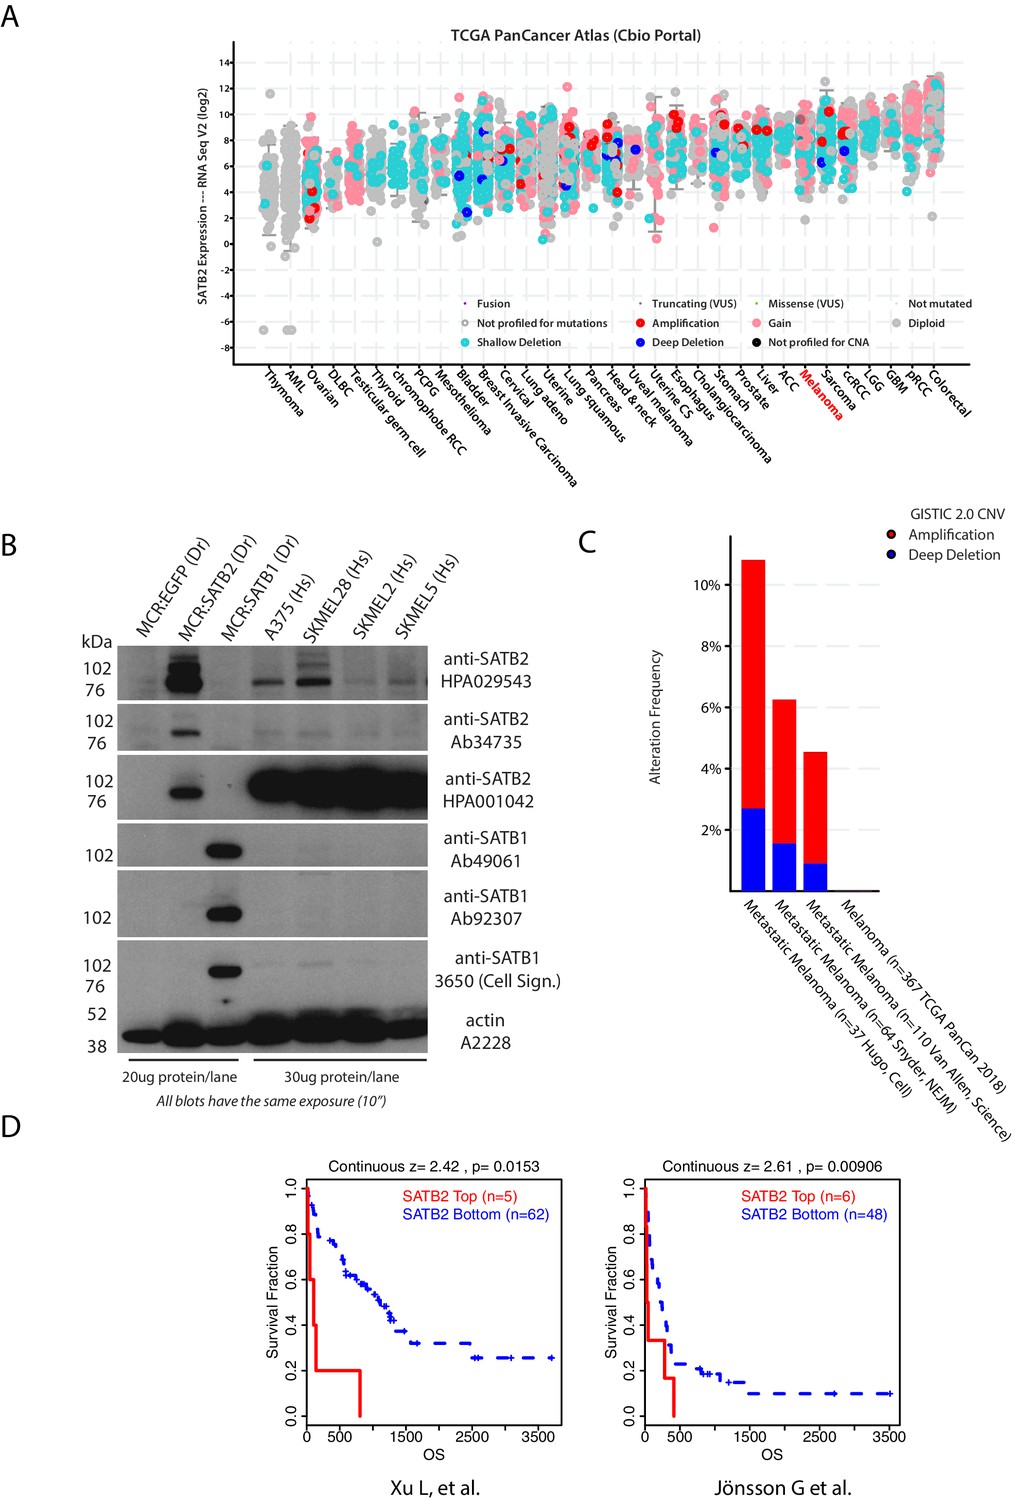
(A) Analysis of SATB2 expression across tumor types in TCGA PanCancer dataset using cBio portal (Gao et al., 2013). Melanoma (highlighted in red) SATB2 mRNA levels are comparable to other solid tumors where SATB2 has been established to play a role (i.e. RCC, Sarcoma, CRC). (B) Western blot of SATB2 and SATB1 with a panel of antibodies showing protein expression in a panel of human melanoma cell lines and zebrafish MCR:EGFP, MCR:SATB2, and MCR:SATB1 control tumors. Actin loading control is shown. (C) Frequency of SATB2 amplification in red across multiple available melanoma genomic studies (ICGC/TCGA Pan-Cancer Analysis of Whole Genomes Consortium, 2020; Hugo et al., 2015; Snyder et al., 2014; Van Allen et al., 2014). (D) Correlation between SATB2 expression and melanoma metastasis-related overall survival in two independent publicly available dataset (GSE8401 and GSE22153) of melanoma followed for metastatic progression risk. Continuous expression Z-score optimized plots (mRNA expression Z-score value separating high vs. low expression that results in maximal statistical separation of the two curves) from the default output of the TIDE Harvard Portal gene query http://tide.dfci.harvard.edu/ (Fu et al., 2020).
Figure 3 with 1 supplement
SATB2 binds and regulates EMT and neural crest-associated genes.
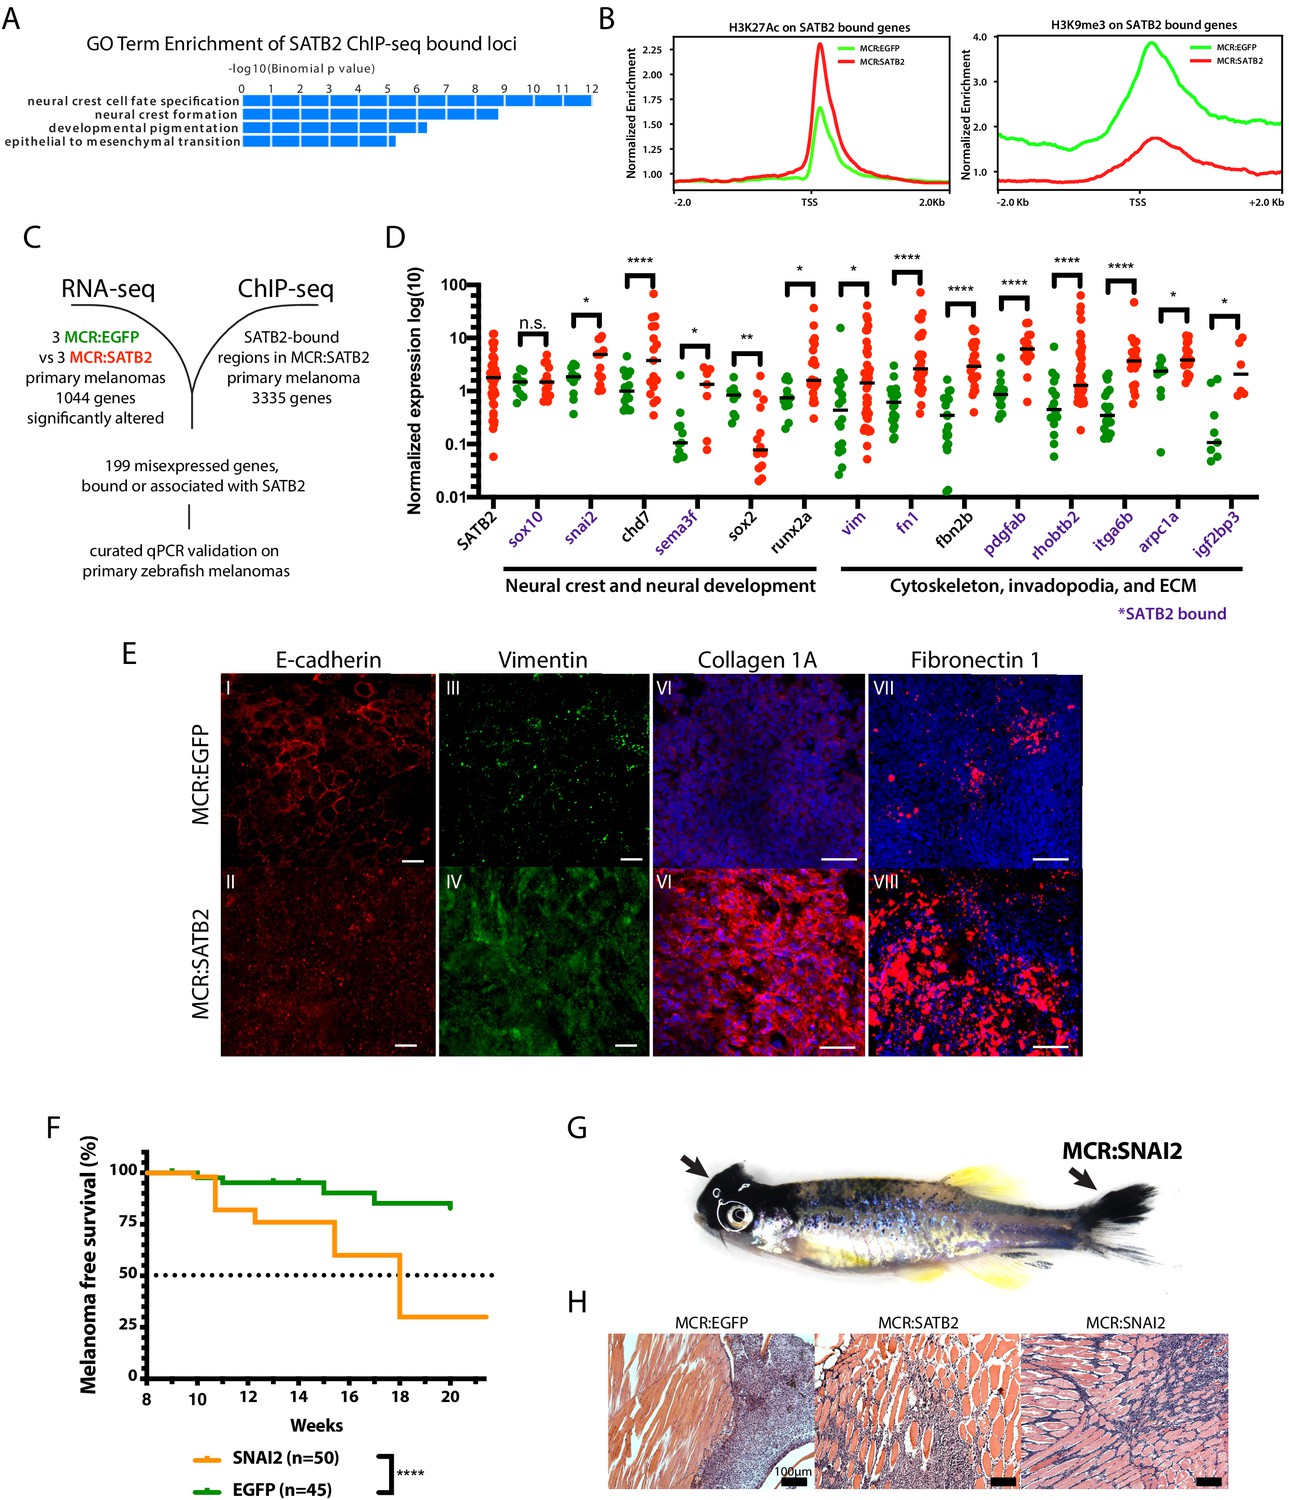
(A) GO-term enrichment of SATB2-bound loci (GREAT analysis) from anti-SATB2 ChIp-seq on MCR:SATB2 tumors. Genes are defined as bound if SATB2 peaks are found within 3 kb of the transcriptional start (TSS) or end site (TES), and the gene body (GB). (B) H3K27Ac and H3K9me3 TSS +/- 2 Kb profile of H3K27Ac at SATB2 bound targets comparing MCR:SATB2 in red and MCR:EGFP in green. (C) ChIP-seq and significant differentially expressed genes RNA-seq (p<0.05, q < 0.05, FC>|1.5|) overlap was performed on primary zebrafish tumors to identify SATB2-bound genes that are misregulated. (D) qRT-PCR validation of transcriptionally altered SATB2-bound and associated targets associated to neural crest development, and the actin cytoskeleton and extracellular matrix. Symbols indicate single primary tumors, normalized to β-actin. *p<0.05, ***p<0.0001, ****p<0.0001. SATB2-bound genes are highlighted in purple. (E) Whole mount primary tumor immunohistochemistry for E-cadherin (red), scale bar is 100 μm, Vimentin (green), scale bar is 100 μm, Fibronectin 1 (red), scale bar is 50 μm, and Collagen 1 (red), scale bar is 50 μm, Dapi (blue). (F) Injection in MCR model as described in Figure 1A of MCR:EGFP, and MCR:SNAI2. (Log-rank (Mantel-Cox) test p<0.0001****). (G) Gross anatomy of zebrafish injected with MCR:SNAI2. Arrows show melanomas. (H) H and E representative histology of MCR:EGFP, MCR:SATB2, and MCR:SNAI2 tumors. Black bar is 100 µm.
Figure 3—figure supplement 1
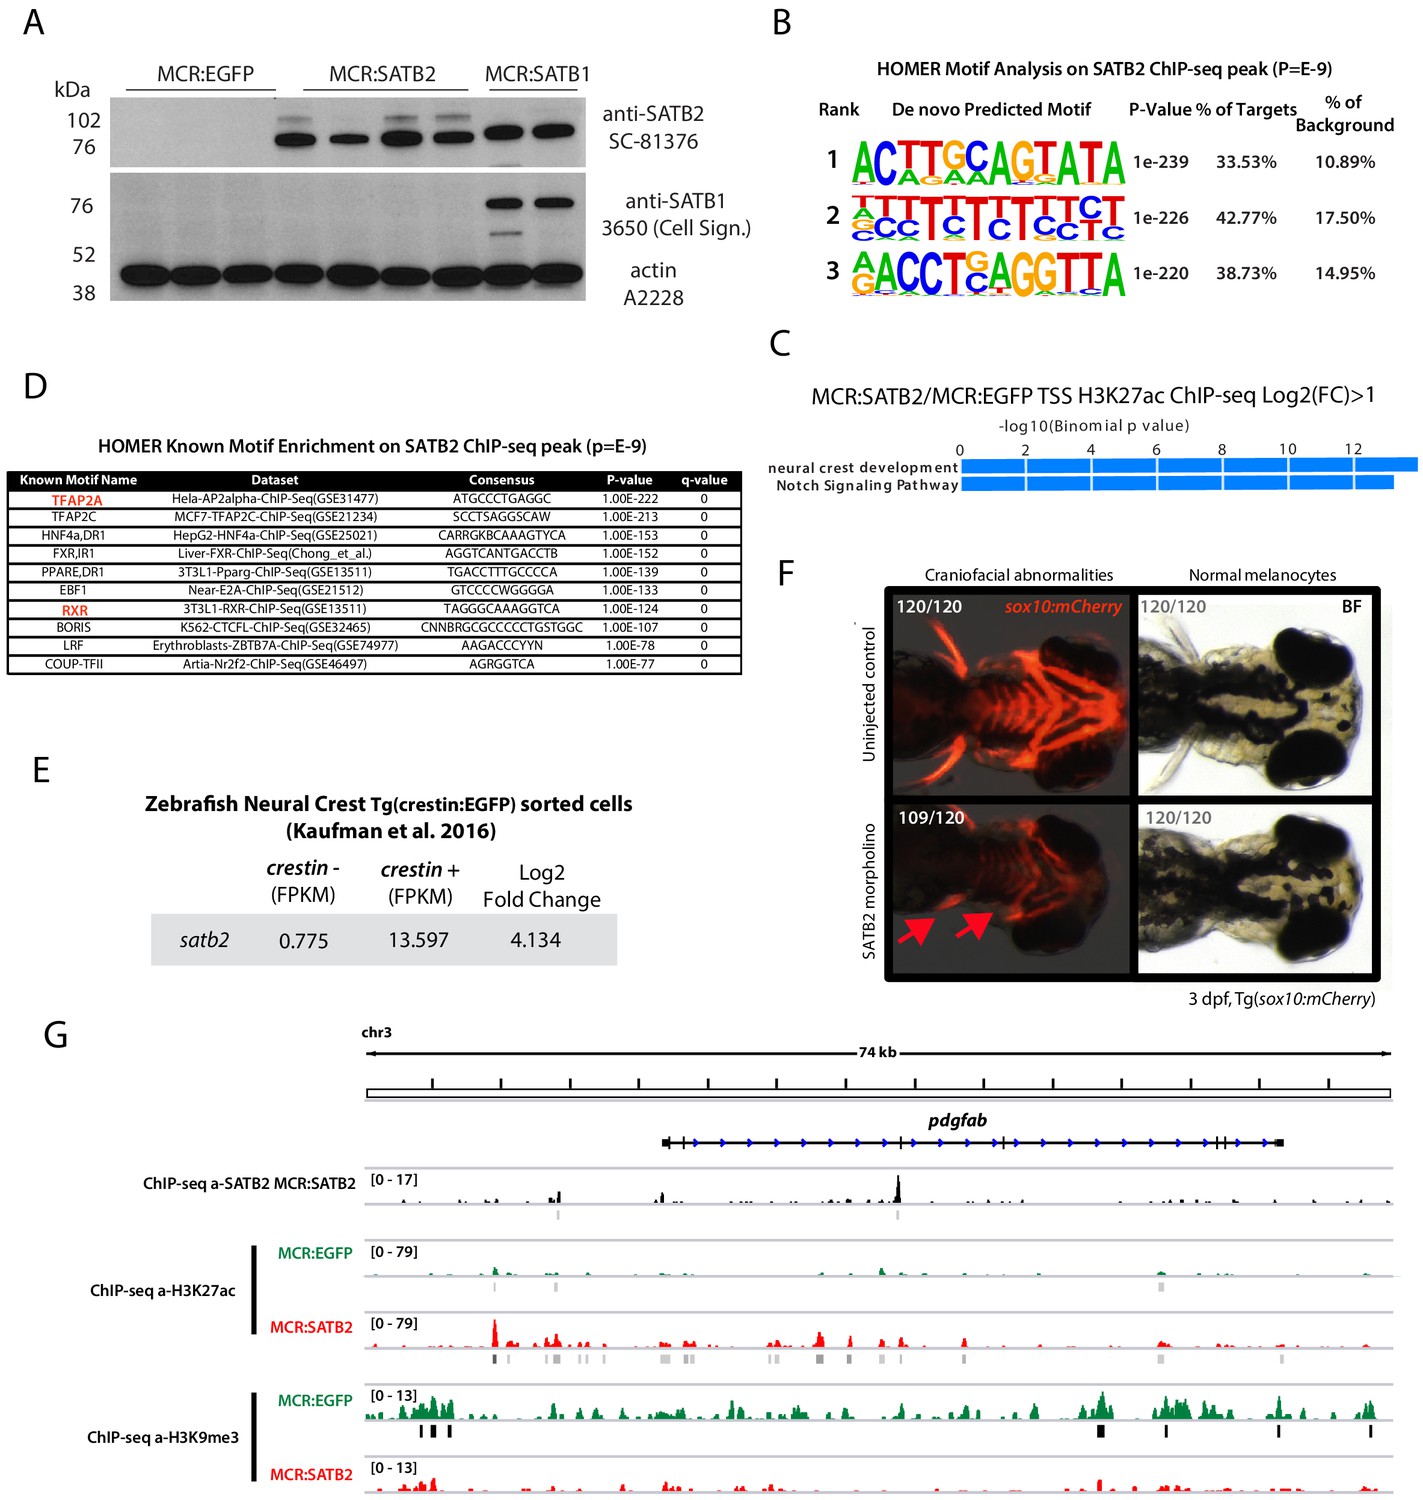
Analysis of SATB2 expression and chromatin effect in human and zebrafish melanoma.
(A) Western blot analysis in MCR:EGFP, MCR:SATB2, and MCR:SATB1 zebrafish tumors of SATB2 expression and antibody cross reactivity with human SATB1 (in MCR:SATB1) and lack of detection of endogenous zebrafish satb1. The SC-81376 antibody was used for anti-SATB2 ChIP-seq in MCR:SATB2 tumors, since the other anti-SATB2 antibodies shown in Figure 2—figure supplement 3B did not work in immunoprecipitation. (B) HOMER motif prediction analysis of significant peaks (P<E-9) from anti-SATB2 ChIP-seq enrichment over input in MCR:SATB2 tumors showing the top motif to be AT-rich as expected. (C) HOMER known motifs enrichment analysis on anti-SATB2 ChIP-seq peaks with p<E-9 in MCR:SATB2 (D) Go-term enrichment analysis of genome-wide H3K27Ac peaks enriched in MCR:SATB2 over MCR:EGFP Around TSS Log2FC > 1(GREAT analysis). (E) RNA-seq analysis of satb2 expression in sorted crestin:EGFP+ developing neural crest cells (data source7). (F) Knock-down of satb2 in the transgenic neural crest reporter line Tg(sox10:mCherry) using a validated morpholino for satb2. While satb2 knock down did not affect melanocyte development (0/120), satb2 morphants displayed severe cranio-facial abnormalities as observed by overall reduced sox10 reporter expression, reduced pectoral fins, and head size (109/120) (arrows). (G) Example analysis of the chromatin state of a direct SATB2 target showing the pdgfab locus. ChIP-Seq track in zebrafish MCR:SATB2 for SATB2 (in black). ChIP-seq tracks for H3K27Ac and H3K9me3 in primary tumors MCR:SATB2 (red) and MCR:EGFP controls (green).
Figure 4 with 1 supplement
Conservation between transcriptional effects induced by SATB2 in zebrafish and human melanoma, and between the SATB2-program and known drug-resistant cell states.
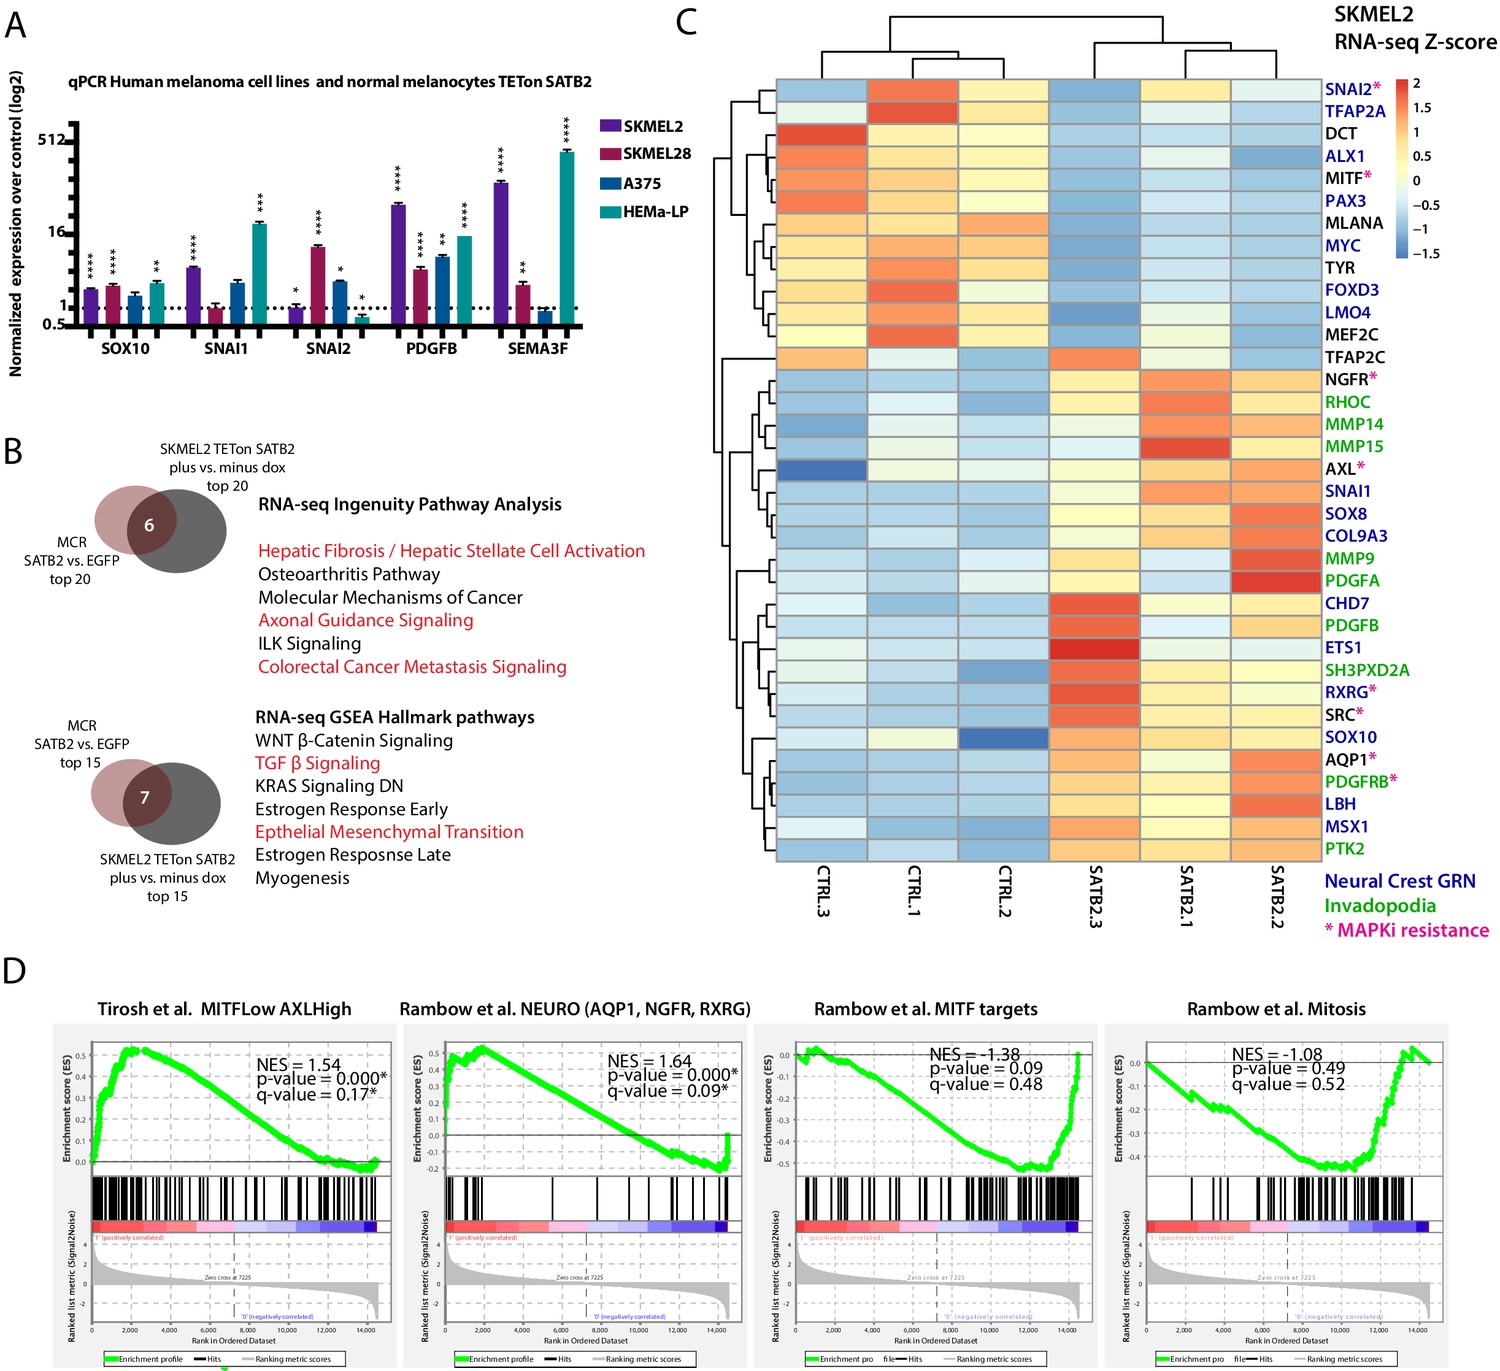
(A) Overexpression of SATB2 with TETon (iSATB2) in normal human epidermal melanocytes (HEMA-LP) and in SKMEL2, SKMEL28, and A375 melanoma cells is sufficient to induce transcriptional activation of SOX10, SNAI1/2, PDGFB, and SEMA3F mRNA. qRT-PCR Data was normalized to beta-actin, and fold change was determined compared to un-induced controls. *p<0.05, **p<0.001, ***p<0.0001, ****p<0.0001. (B) Overlap of Ingenuity Pathway Analysis and Gene Set Enrichment Analysis Hallmark pathways of RNA-seq in MCR zebrafish tumors and iSKMEL2 human (plus vs. minus doxycycline) melanoma cell line. For IPA humanized significant zebrafish genes were used (p<0.05, q < 0.05, FC>|1.5|=1044 zf->840 unique human orthologs), and significant SKMEL2 iSATB2 genes (p<0.05, q < 0.05, FC>|1|). (C) Curated heatmap of altered genes in RNA-seq of human SKMEL2 cells overexpressing SATB2 (plus DOX vs. minus DOX FC >1; p<0.01) that have been involved in neural crest or Rambow Neural crest-like state, PDGF-PDGFR-SRC invadopodia cascade, AXL/MITF state and melanocyte differentiation. All genes shown are significantly altered except for TFAP2C. Normalized RNA-seq heatmap of expression fold change Z-score is plotted. Genes part of the neural crest GRN are highlighted in blue, invadopodia related genes are highlighted in green, and MAPK inhibitors resistance genes are highlighted in magenta. (D) Gene set enrichment analysis (GSEA) of 1000 MSigDB signatures including the states described by Tirosh et al. and Rambow et al.
Figure 4—figure supplement 1
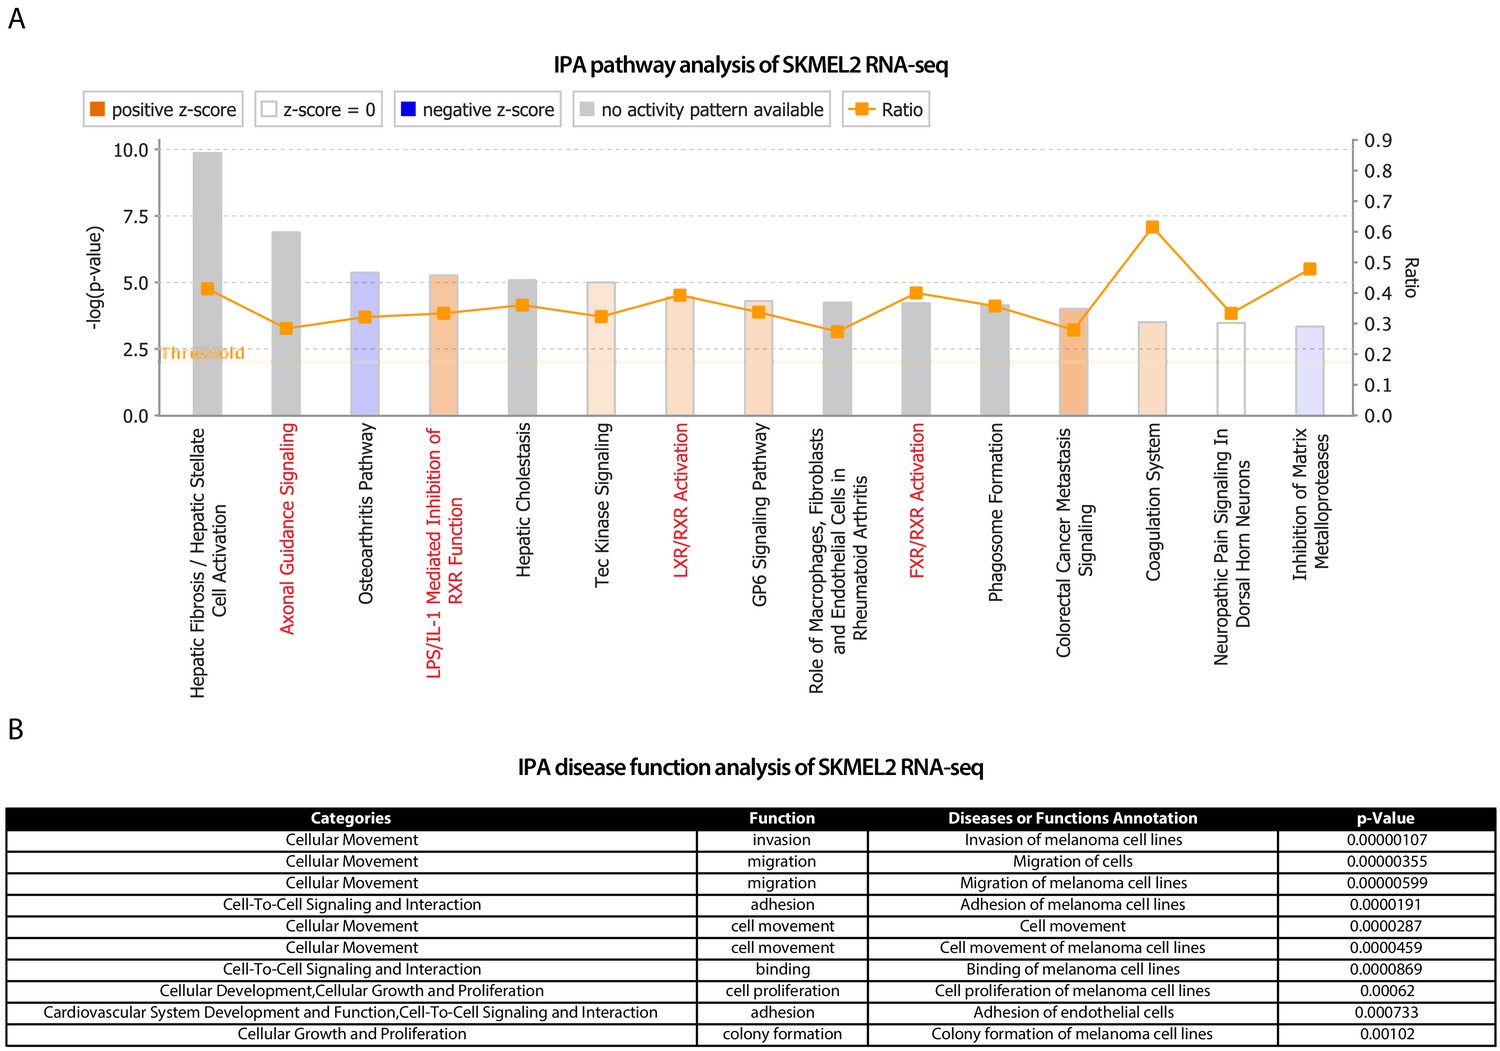
IPA analysis of significant differentially expressed genes in SKMEL2 iSATB2.
IPA analysis on (A) pathways and (B) disease functions on SKMEL2 iSATB2. Related to Figure 4B–C.
Figure 5

MCR:SATB2 tumor allografts have higher tumor propagating potential and resistance to Vemurafenib in vivo.
(A) Weekly time lapse photography of a representative MCR:SATB2 melanoma cell recipient. Black arrows indicate metastases, which can already be observed 1 week post-transplantation. Related to Figure 2E–I. (B) Subcutaneous primary melanoma limiting dilution transplantation model in transparent Casper zebrafish. 300,000, 3000, 300, or 30 primary pigmented primary melanoma cells were transplanted into a subcutaneous space in running along the dorsum of irradiated Casper recipients. Ten to 12 animals per condition were used, and a total of four MCR:EGFP and five MCR:SATB2 donors were transplanted over the course of two independent experiments. (C) Representative images of MCR:EGFP and MCR:SATB2 recipients transplanted with 30 cells. (D) Engraftment of surviving recipients at 3 weeks post-transplant was used to estimate the frequency of tumor propagating cell potential with Extreme Limiting Dilution Analysis (ELDA). Estimated frequency of tumor propagating cells between MCR:EGFP and MCR:SATB2 donors (Mann-Whitney, p<0.0159*). (D) In vivo drug treatment of allotransplanted primary MCR:EGFP or MCR:SATB2 tumors with FDA-approved BRAF inhibitor Vemurafenib shows confirms SATB2 as a resistance driver. Recipients casper fish were treated by daily oral gavage with 100 mg/kg of drug or vehicle control from day 10 post-transplant to day 24 post-transplant. Animals were imaged at day 10 and 24 and pigmented tumor area was estimated using digital calipers to assess treatment response. (E) Representative image of individual treated animals. (F) Mean normalized area % change in the treated cohorts: MCR:EGFP DMSO (n = 11) +12.45, SEM 2.55 vs. MCR:EGFP BRAFi (n = 12)–50.67, SEM 7.26 vs. MCR:SATB2 DMSO (n = 17) +11.06, SEM 1.84 vs. MCR:SATB2 BRAFi (n = 16) +22.06, SEM 2.81. Unpaired two-tailed t-test p values of pairwise comparisons are shown.
Videos
Video 1
Zebrafish MCR:EGFP (unpigmented) and MCR:SATB2 (pigmented) melanoma phenotype.
Video 2
Time-lapse video recording of Oregon Green 488-labeled gelatin degradation upon SATB2 induction in human melanoma cell line A375.
Video 3
MCR control primary tumor transplant into transparent Casper zebrafish, 3.5 weeks post-transplant.
Video 4
MCR:SATB2 primary tumor transplant into transparent Casper zebrafish, 3.5 weeks post-transplant.
Additional files
-
Supplementary file 1
Schematic of screened pools of epigenetic factors and source plasmid references.
- https://cdn.elifesciences.org/articles/64370/elife-64370-supp1-v2.xlsx
-
Supplementary file 2
Differential gene expression list of primary MCR:SATB2 vs MCR:EGFP tumors by RNA-seq (Sheet 1).
Genes confirmed by qPCR on a large panel of primary MCR:SATB2 tumors versus MCR:EGFP tumors. Red is upregulated, green is downregulated. (Sheet 2). Best human ortholog prediction with DIOPT (Sheet 3). MCR tumors RNA-seq data matched with human orthologs (Sheet 4). Input for GSEA analysis on MCR tumors (Sheet 5). Input for IPA analysis on MCR tumors (Sheet 6). SATB2 bound genes based on SATB2 ChIP-seq in MCR:SATB2 tumor (Sheet 7). DIOPT human ortholog prediction of SATB2 bound targets (Sheet 8), and humanized SATB2 bound target list (Sheet 9) used for overlap in Biovenn with published TFAP2A active targets in Figure 3D. Overlap of significant genes with with ChIP-seq to determine SATB2-bound and SATB2-associated loci that are misexpressed. (Sheet 10).
- https://cdn.elifesciences.org/articles/64370/elife-64370-supp2-v2.xlsx
-
Supplementary file 3
SATB2-associated genes that are neural crest related (Sheet 1) SATB2-associated genes, determined by using GREAT genomic region association ‘Basal plus extension’ (proximal 10 kb upstream of TSS, 5 kb downstream of TSS, distal up to 100 kb).
(Sheet 2) Neural-crest-associated genes. (Sheet 3) SATB2/neural-crest-associated genes. (Sheet 4) Human predicted orthologs (DIOPT) of SATB2-Bound genes (TSS+ gene body +/- 3 kb).
- https://cdn.elifesciences.org/articles/64370/elife-64370-supp3-v2.xlsx
-
Supplementary file 4
RNA-seq of SKMEL2 TetOn SATB2 48 hr +/- doxycycline.
(Sheet 1) Genes with a log(2) fold change >1.0 and a p-value<0.05. (Sheet 2) Unfiltered RNA-seq expression data.
- https://cdn.elifesciences.org/articles/64370/elife-64370-supp4-v2.xlsx
-
Supplementary file 5
qRT-PCR primers.
- https://cdn.elifesciences.org/articles/64370/elife-64370-supp5-v2.xlsx
-
Transparent reporting form
- https://cdn.elifesciences.org/articles/64370/elife-64370-transrepform-v2.docx
Download links
A two-part list of links to download the article, or parts of the article, in various formats.
Downloads (link to download the article as PDF)
Open citations (links to open the citations from this article in various online reference manager services)
Cite this article (links to download the citations from this article in formats compatible with various reference manager tools)
SATB2 induction of a neural crest mesenchyme-like program drives melanoma invasion and drug resistance
eLife 10:e64370.
https://doi.org/10.7554/eLife.64370


