A critical residue in the α1M2–M3 linker regulating mammalian GABAA receptor pore gating by diazepam
- University of Texas at Austin, Department of Neuroscience, United States
Figures
Figure 1 with 1 supplement
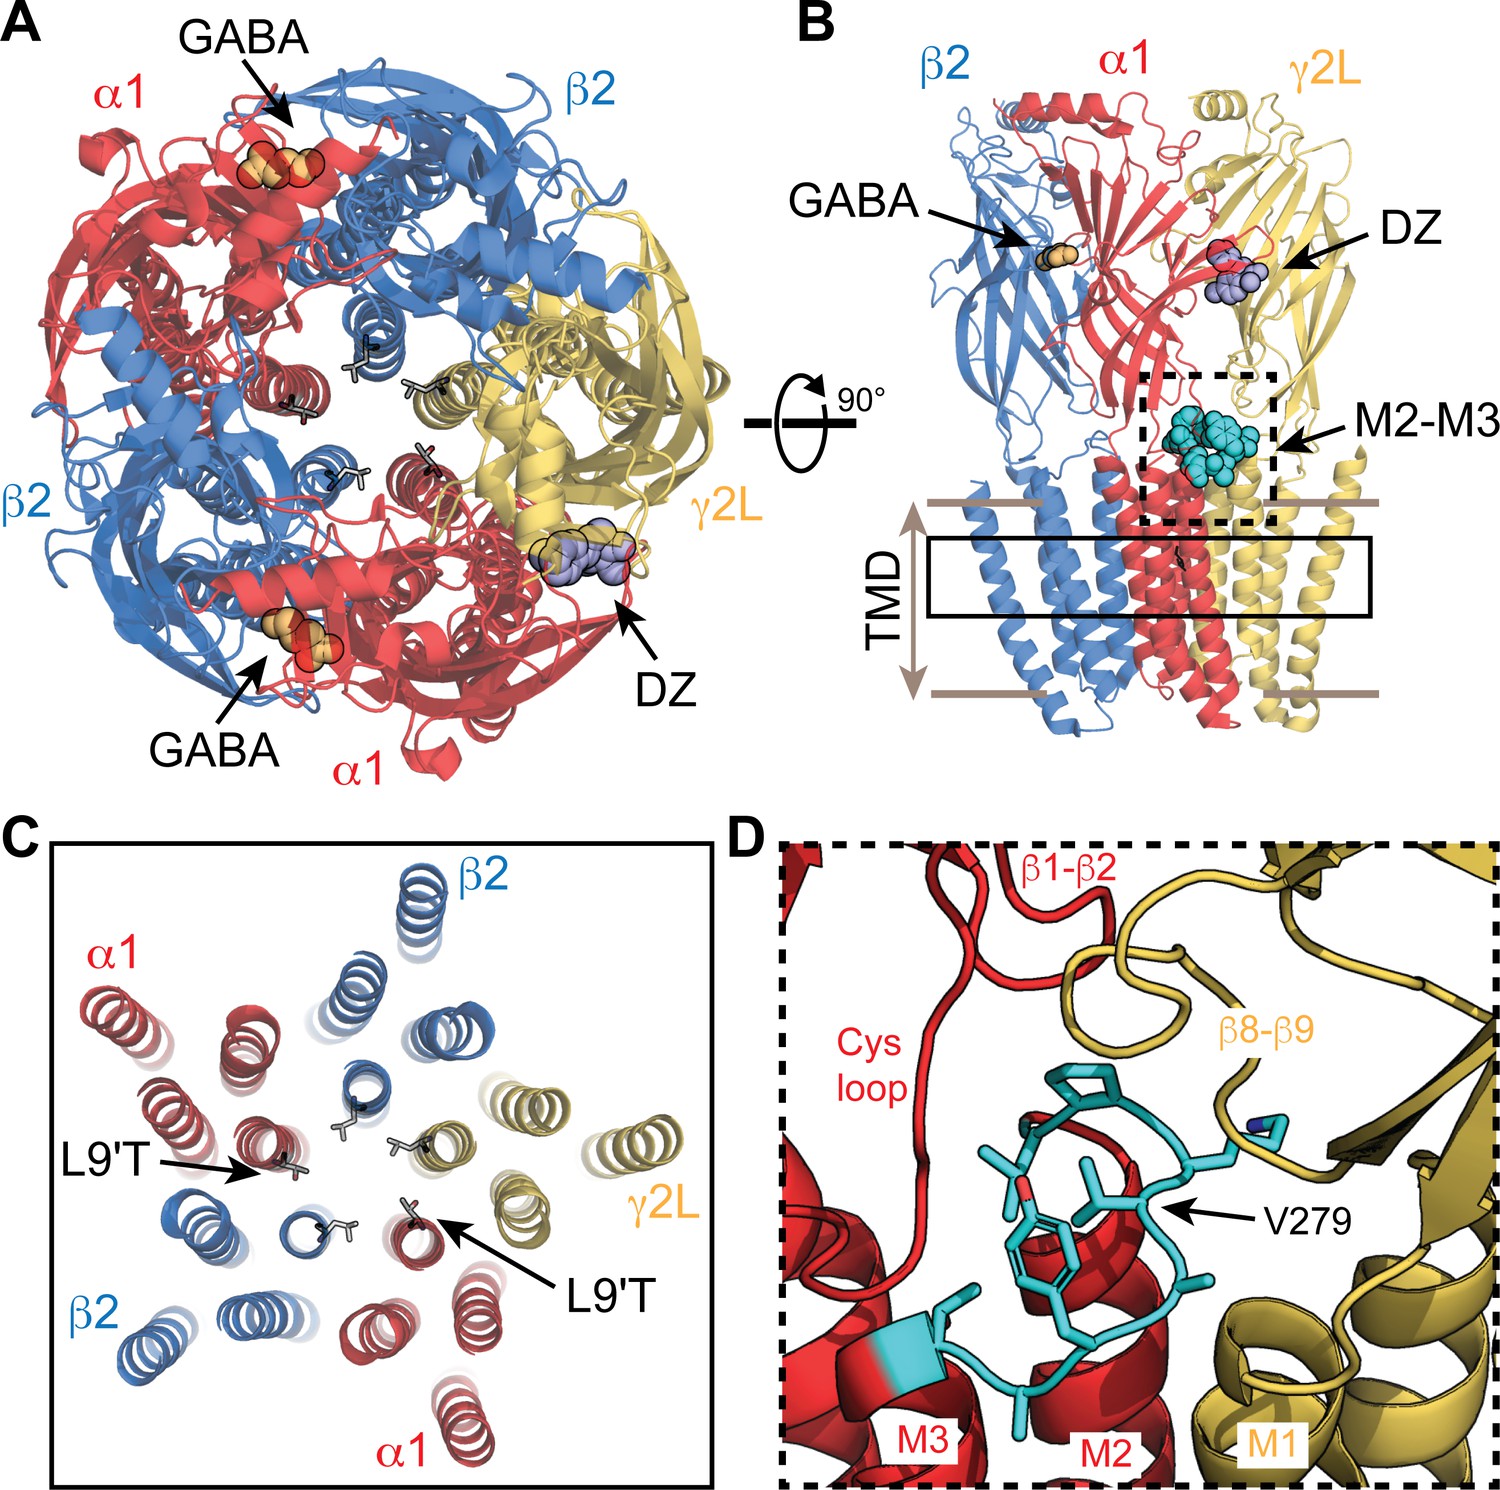
Visual representation of an α1β2γ2 GABAA receptor from cryo-EM map PDB 6X3X.
(A,B) View from the extracellular space (A) and parallel to the membrane plane (B). Bound GABA and DZ are shown as gold and lavender spheres, respectively. The 9' pore residue from each subunit is shown in stick representation, all leucine except for the mutation α1L9'T, which was generated in PyMol as a visualization aid. One of the two α1M2–M3 linkers is shown as cyan spheres in (B). (C) Same view as in (A) for a slice through the transmembrane domains indicated by the solid box in (B). (D) Detail for the dashed box in (B). The α1M2–M3 linker (L276-T283; rat numbering) is colored cyan with side chains shown in stick representation.
Figure 1—figure supplement 1
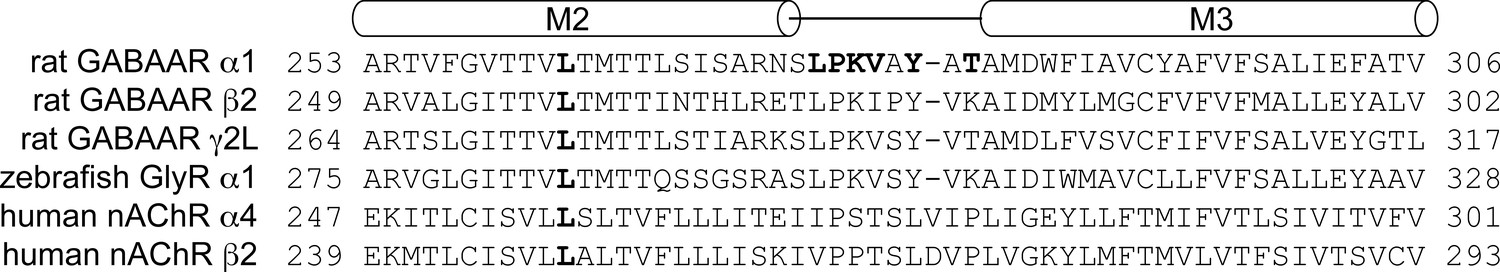
Sequence alignment of M2–M3 linker regions for subunits from several members of the pLGIC superfamily.
Position of M2 and M3 helices are indicated above the sequences. The pore gate L9' residue and mutated M2–M3 linker residues are shown in bold.
Figure 2 with 3 supplements
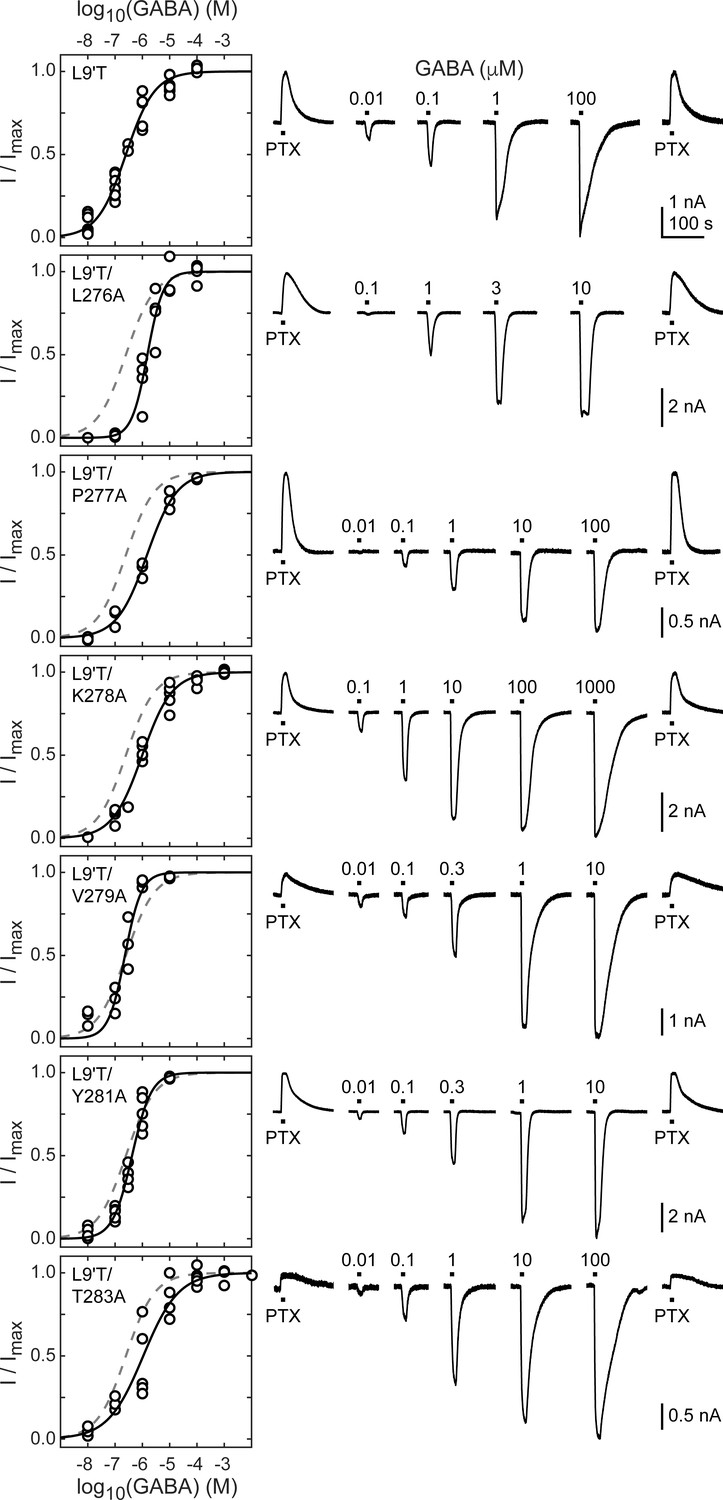
Spontaneous PTX-sensitive and GABA-evoked currents for α1M2–M3 linker alanine substitutions in the gain of function α1L9'Tβ2γ2L background.
(Left) Summary of normalized GABA concentration–response relationships for GABA-evoked currents with the zero current baseline set to the level of spontaneous activity. Solid line is a fit of the pooled data across oocytes to Equation 1, and the dashed line is the fit for the L9'T background. Fit parameters are EC50, hill slope (# oocytes): L9'T = 0.25 μM, 0.83 (7); L9'T/L276A = 1.53 μM, 1.51 (4); L9'T/P277A = 1.48 μM, 0.80 (3); L9'T/K278A = 0.99 μM, 0.79 (5); L9'T/V279A = 0.23 μM, 1.44 (4); L9'T/Y281A = 0.42 μM, 1.23 (5); L9'T/T283A = 1.08 μM, 0.67 (5). Parameters for fits to individual oocytes are summarized in Figure 2—figure supplement 2. (Right) Example currents in response to 10 second pulses of the pore blocker PTX (1 mM) or GABA (concentration in micromolar indicated above each pulse). Responses to GABA were bookended by application of PTX to assess the amount of spontaneous current and to normalize any drift or rundown during the experiment (see Figure 2—figure supplement 1).
Figure 2—figure supplement 1
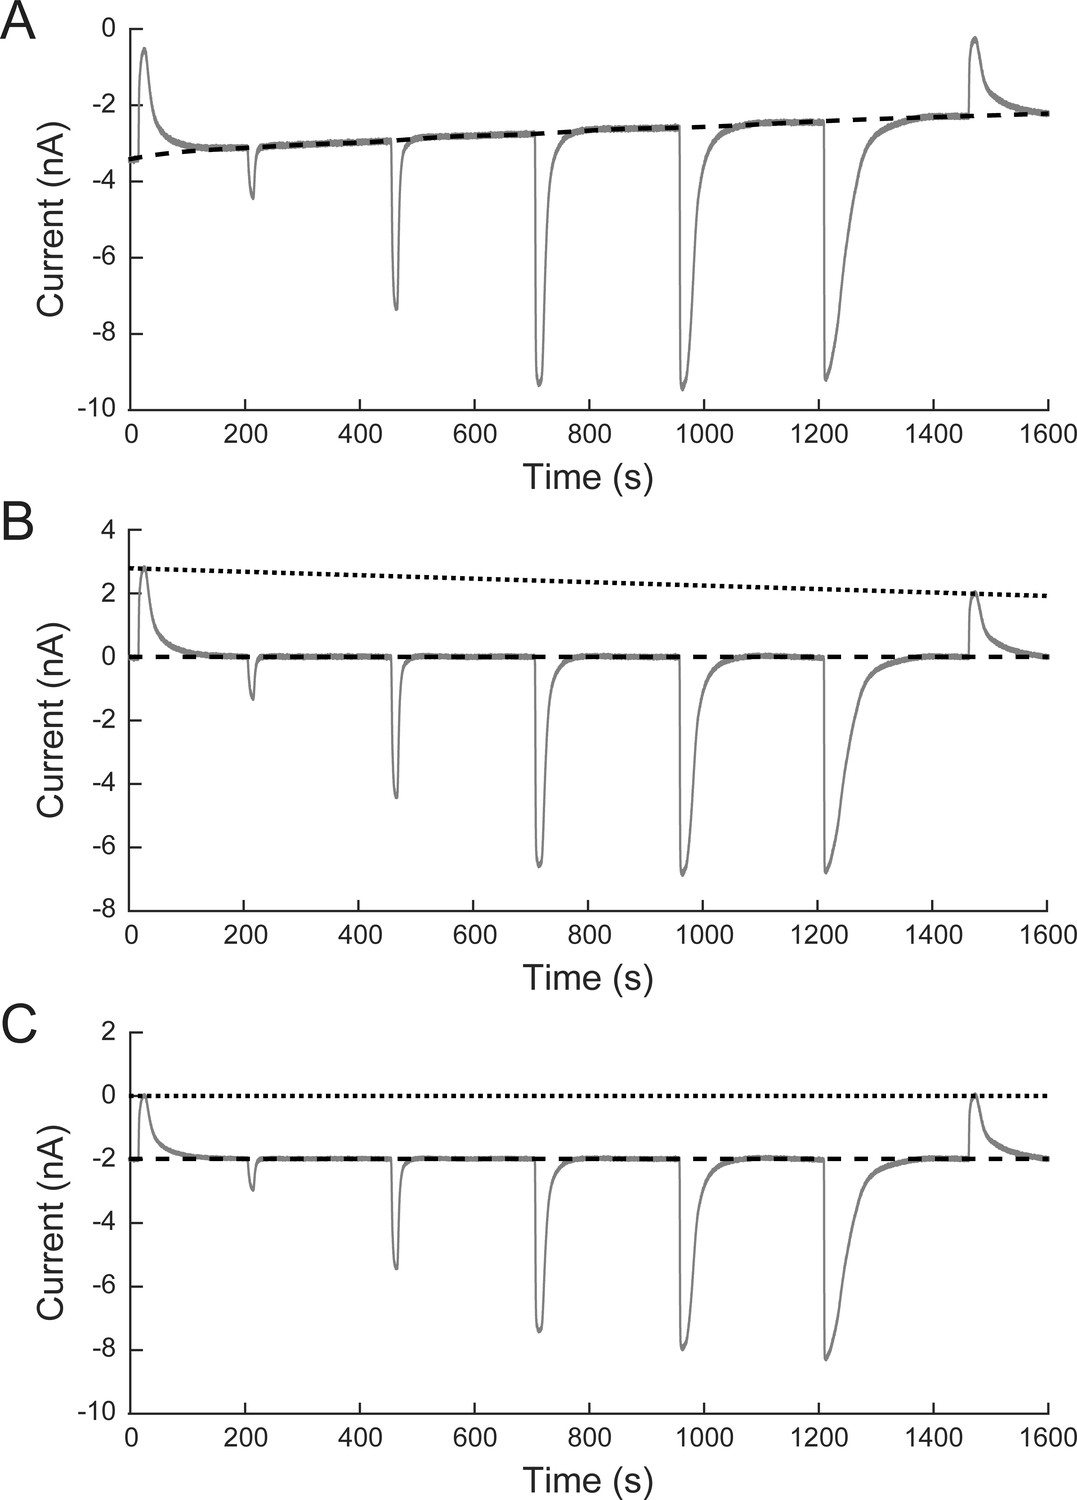
Correction for baseline drift and current rundown.
(A) Raw two-electrode voltage clamp current recording from α1L9'T/K278Aβ2γ2L receptors expressed in a Xenopus laevis oocyte. Responses to 10 second pulses of increasing concentrations of GABA (0.1, 1, 10, 100, and 1000 μM) were bookended by 10 second pulses of 1 mM PTX as shown in Figure 2. (B) Baseline drift was corrected by subtracting a spline fit to selected segments of baseline (dashed line in A). (C) Current rundown was corrected by linearly scaling the current record, so that the bookending PTX responses were of equal amplitude (dotted line in B). The resulting current trace was shifted, so that zero current coincides with the peak response to block by PTX.
Figure 2—figure supplement 2

Summary of GABA EC50 and hill slope from fitting Equation 1 to GABA concentration–response relationships as shown in Figure 2 for individual oocytes.
Gray box plots indicate the median and 25th and 75th percentiles. The vertical dashed line is the mean for L9'T.
Figure 2—figure supplement 3
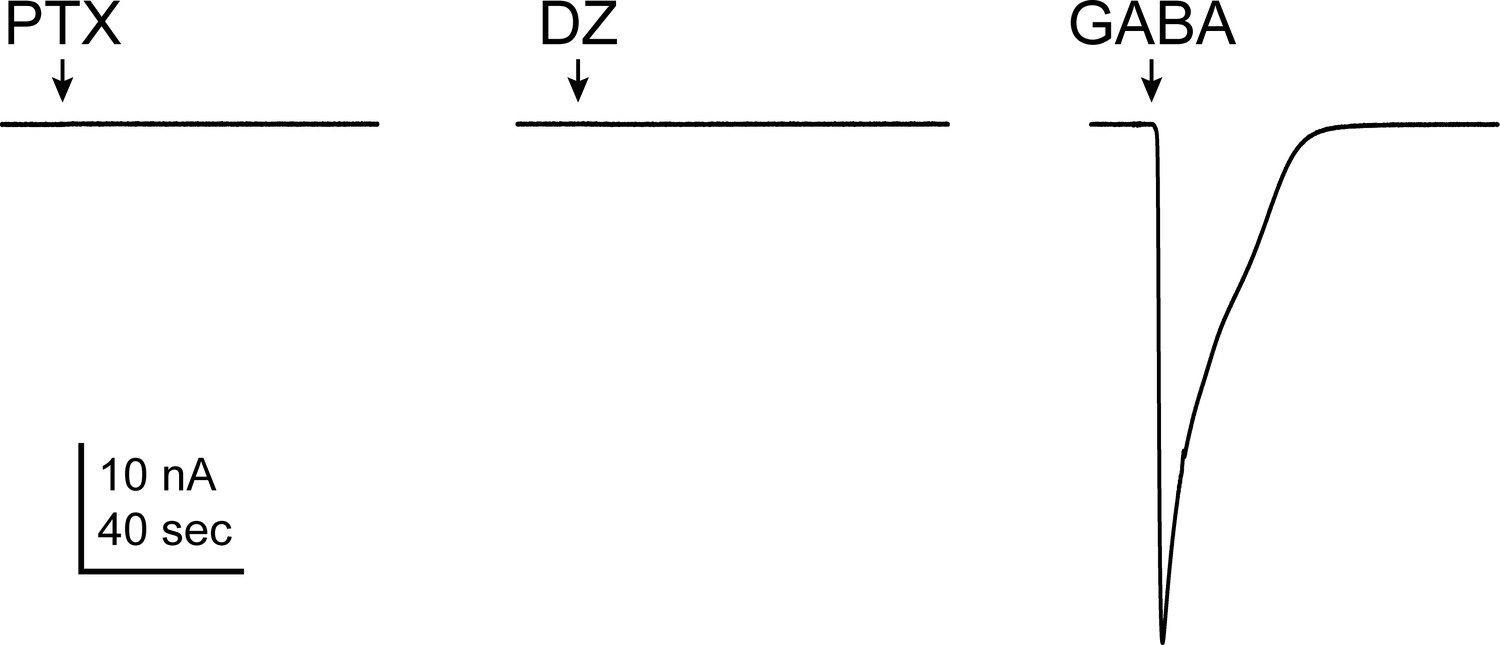
Responses of wild-type α1β2γ2L receptors to 10 second pulses of either 1 mM PTX, 3 μM DZ, or 3 mM GABA.
Figure 3
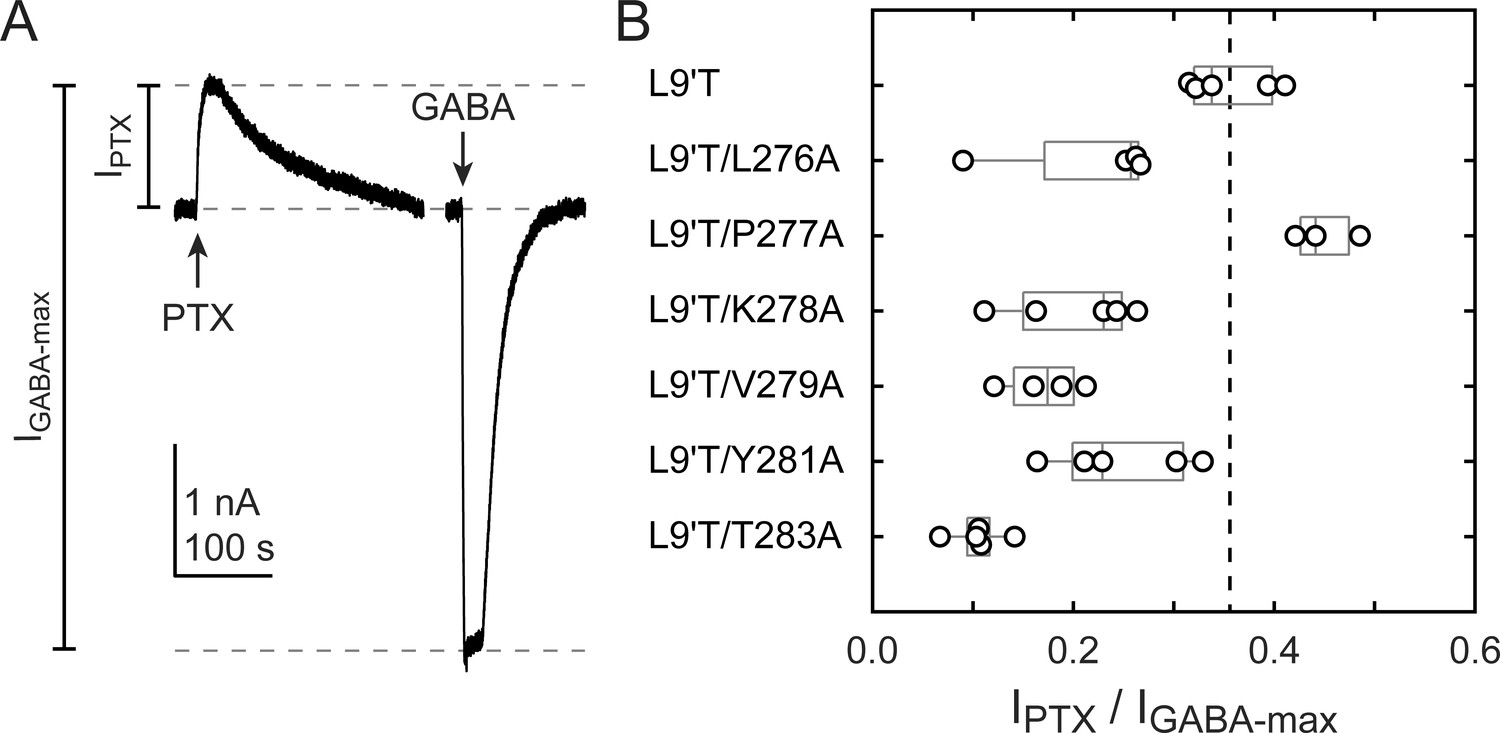
Ratio of PTX-sensitive to maximal GABA-evoked current amplitude.
(A) Example currents from α1L9'T/V279Aβ2γ2L receptors elicited by 10 second pulses of either 1 mM PTX or 10 μM GABA. (B) Summary of the ratio of PTX-sensitive to maximal GABA-evoked current amplitude for individual oocytes. Gray box plots indicate the median and 25th and 75th percentiles. The vertical dashed line is the mean for L9'T. These ratios were estimated as being approximately proportional to the unliganded open probability by a factor that is the open probability in saturating GABA.
Figure 4 with 1 supplement
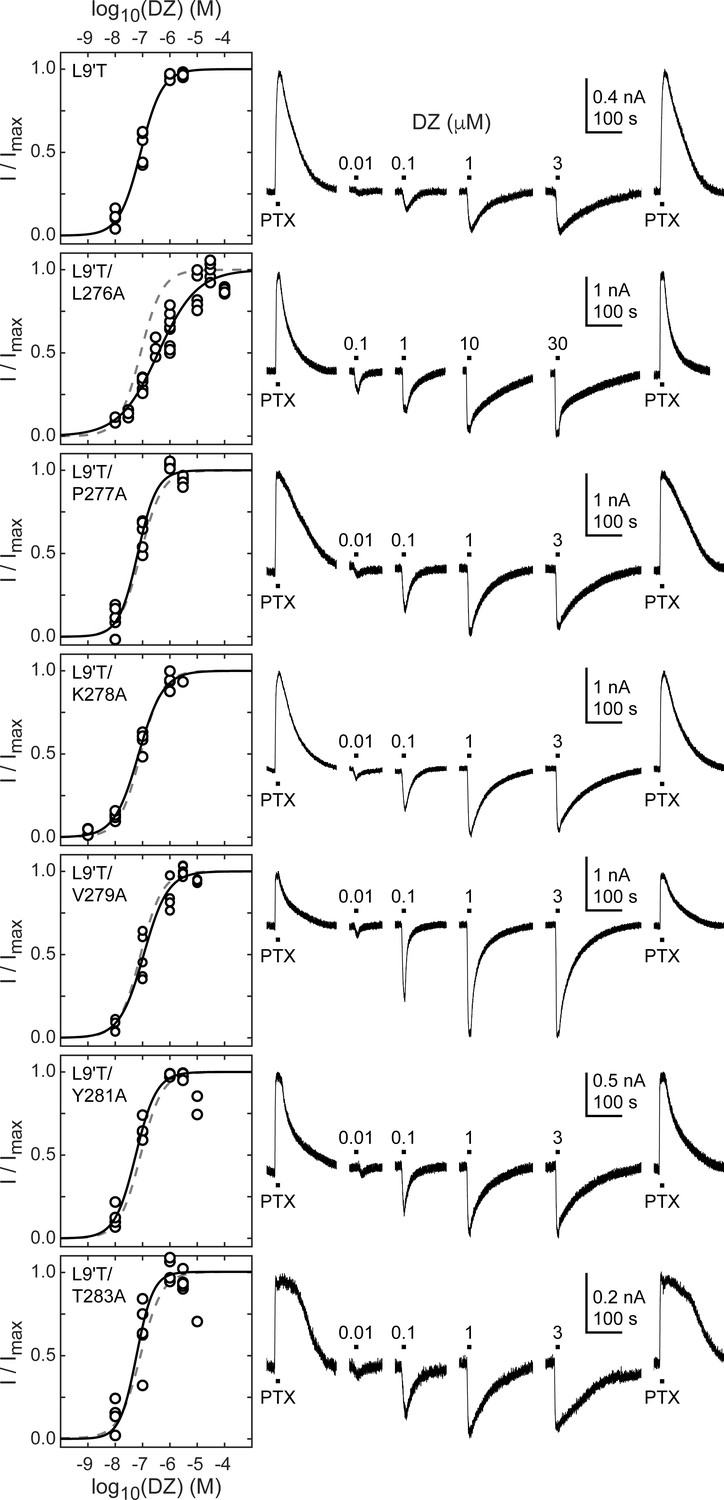
Spontaneous PTX-sensitive and DZ-evoked currents for α1M2–M3 linker alanine substitutions in the gain of function α1L9'Tβ2γ2L background.
(Left) Summary of normalized DZ concentration–response relationships for DZ-evoked currents with the zero current baseline set to the level of spontaneous activity. Solid line is a fit of the pooled data across oocytes to Equation 1, and the dashed line is the fit for the L9'T background. Reduced peak responses to 10 μM DZ for L9'T/Y281A and L9'T/T283A were omitted from the fits. Fit parameters are EC50, hill slope (# oocytes): L9'T = 85 nM, 1.10 (5); L9'T/L276A = 380 nM, 0.61 (8); L9'T/P277A = 67 nM, 1.24 (5); L9'T/K278A = 72 nM, 0.97 (4); L9'T/V279A = 110 nM, 0.98 (5); L9'T/Y281A = 56 nM, 1.14 (4); L9'T/T283A = 60 nM, 1.42 (6). Parameters for fits to individual oocytes are summarized in Figure 4—figure supplement 1. (Right) Example currents in response to 10 second pulses of the pore blocker PTX (1 mM) or DZ (concentration in micromolar indicated above each pulse). Responses to DZ were bookended by application of PTX to assess the amount of spontaneous current and to normalize any drift or rundown during the experiment (see Figure 2—figure supplement 1).
Figure 4—figure supplement 1
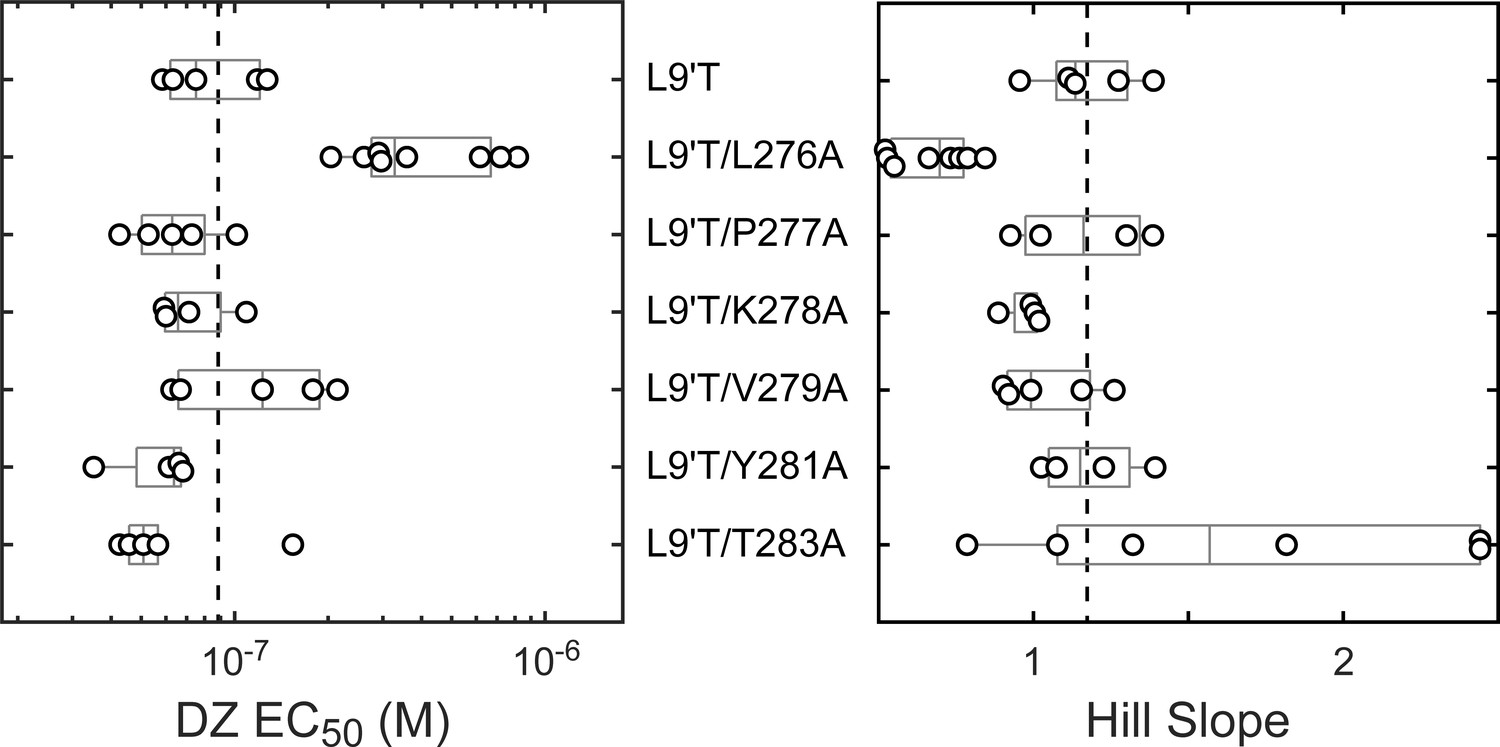
Summary of DZ EC50 and hill slope from fitting Equation 1 to DZ concentration–response relationships as shown in Figure 4 for individual oocytes.
Gray box plots indicate the median and 25th and 75th percentiles. The vertical dashed line is the mean for L9'T.
Figure 5
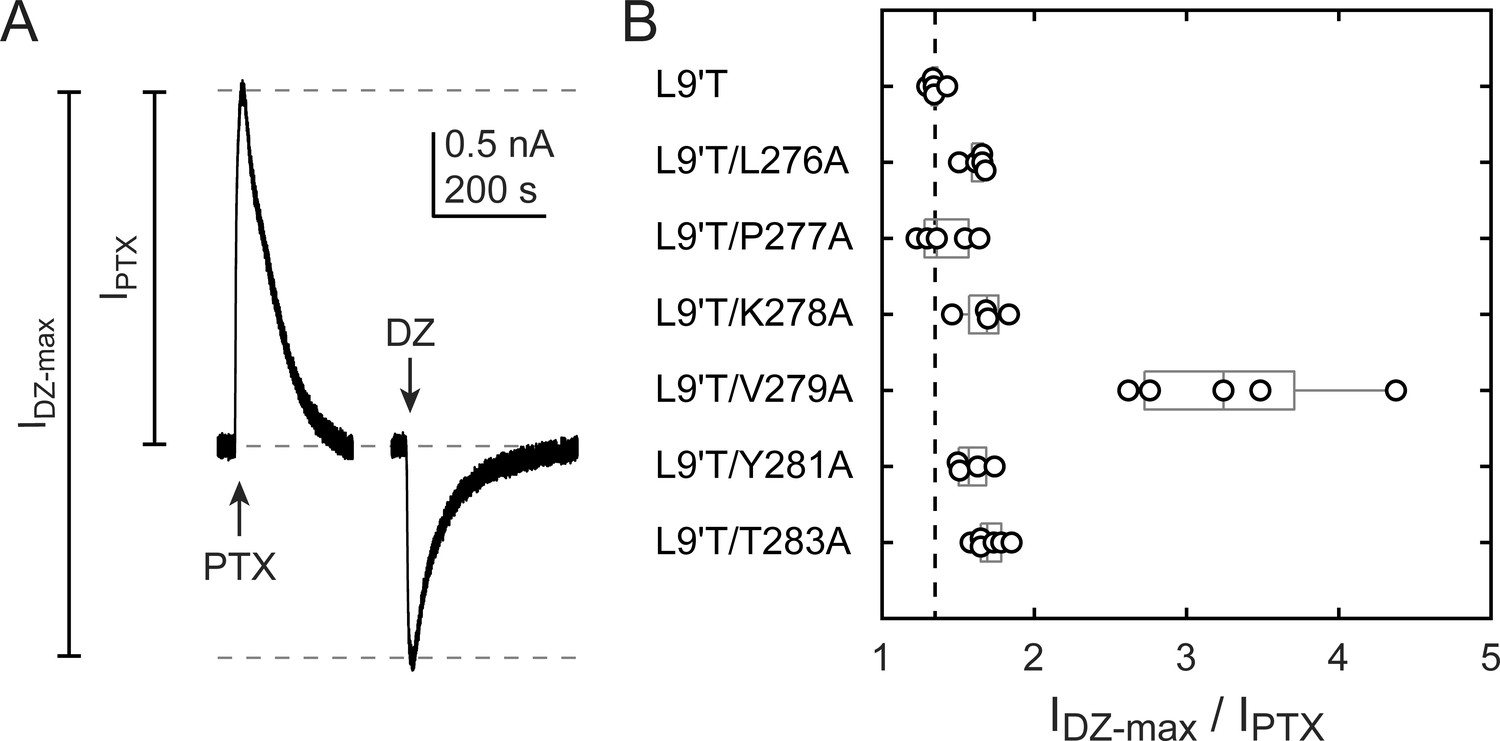
Ratio of maximal DZ-evoked to PTX-sensitive current amplitude.
(A) Example currents from α1L9'T/K278Aβ2γ2L receptors elicited by 10 second pulses of either 1 mM PTX or 1 μM DZ. (B) Summary of the ratio of maximal DZ-evoked to PTX-sensitive current amplitude for individual oocytes. Gray box plots indicate the median and 25th and 75th percentiles. The vertical dashed line is the mean for L9'T. These ratios were used as estimates for the approximate fold-change in open probability upon DZ binding.
Figure 6
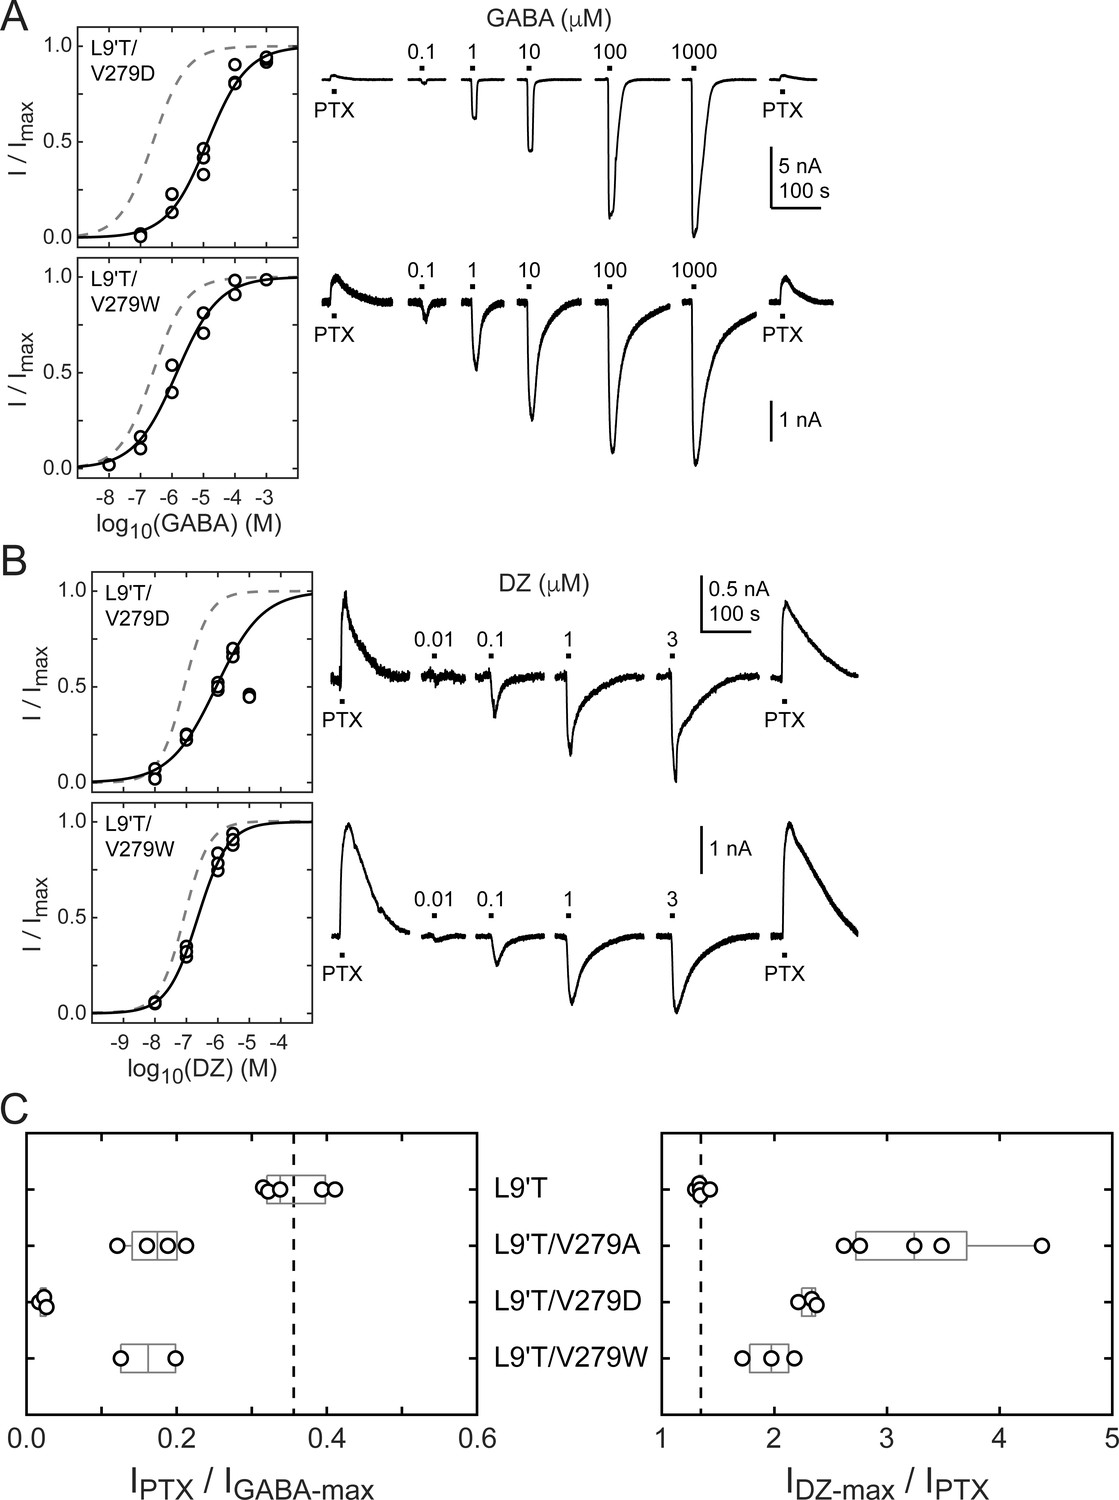
Spontaneous PTX-sensitive and GABA- or DZ-evoked currents for α1V279D and α1V279W in the gain of function α1L9'Tβ2γ2L background.
(A) Summary of normalized GABA concentration–response relationships for GABA-evoked currents with the zero current baseline set to the level of spontaneous activity (left). Solid line is a fit of the combined data across oocytes to Equation 1, and the dashed line is the fit for the L9'T background. Fit parameters are EC50, hill slope (# oocytes): L9'T/V279D = 13 μM, 0.68 (3); L9'T/V279W = 1.4 μM, 0.65 (2). Example currents in response to 10 second pulses of the pore blocker PTX (1 mM) or GABA (concentration in micromolar indicated above each pulse) (right). (B) Same as in (A) except for DZ-evoked currents. Responses from L9'T/V279D to 10 μM DZ were excluded from the fit. Fit parameters are EC50, hill slope (# oocytes): L9'T/V279D = 0.88 μM, 0.58 (3); L9'T/V279W = 0.23 μM, 0.90 (3). (C) Summary of the ratios of PTX-sensitive and either maximal GABA- or DZ-evoked current amplitudes for individual oocytes. Gray box plots indicate the median and 25th and 75th percentiles. The vertical dashed line is the mean for L9'T. These ratios were used as estimates for the approximate fold-change in open probability upon DZ binding.
Figure 7 with 1 supplement
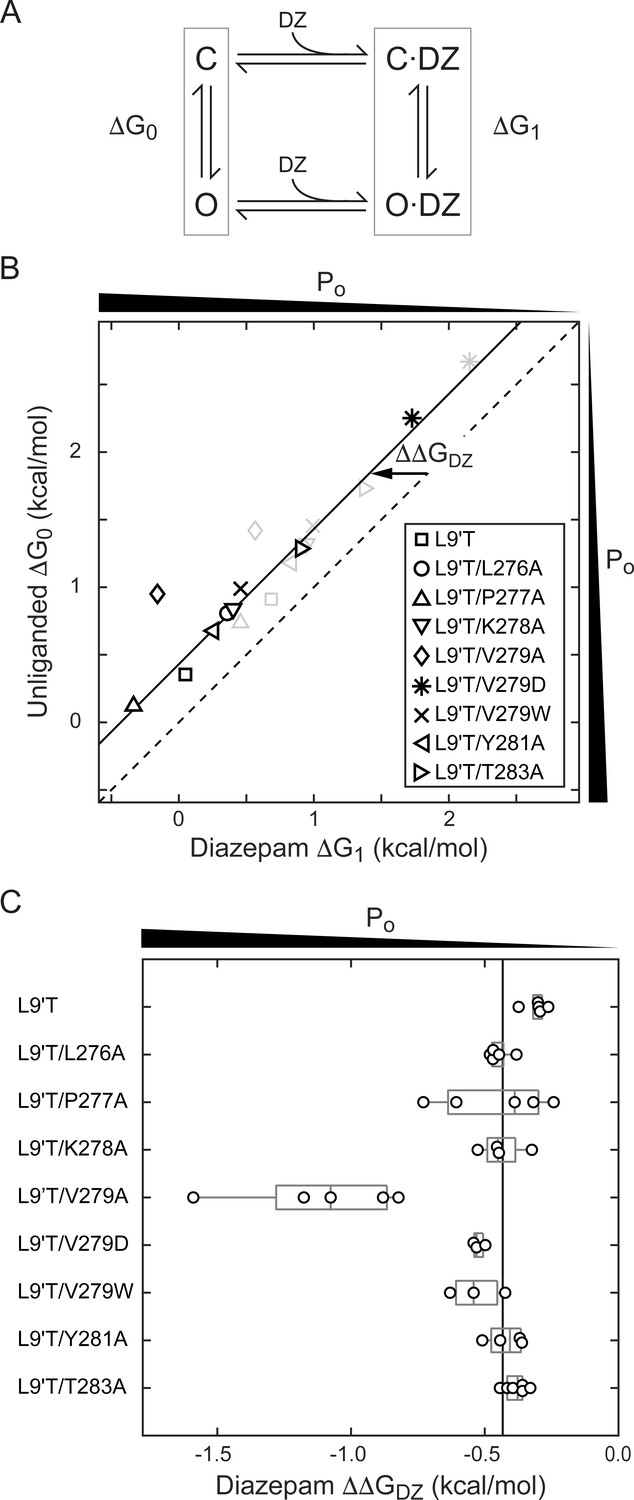
A critical residue in the α1M2–M3 linker regulating DZ’s energetic contribution to pore gating.
(A) A simple model approximating channel gating between closed (C) and open (O) pore states in both unliganded and DZ-bound conditions. (B) Relationship between gating free energy in unliganded (ΔG0) and DZ-bound (ΔG1) conditions for α1L9'Tβ2γ2L receptors and α1M2–M3 linker mutations assuming Po–GABA–max = 1 (bold symbols) or Po–GABA–max = 0.5 (light gray symbols) (Equations 2–3). ΔG values are the change in energy from closed to open states, such that negative values favor opening. To illustrate this, we indicate the direction of increasing open probability (Po) along each axis. Points are the mean across oocytes. The dashed line of symmetry reflects ΔG0 = ΔG1 where DZ would have no effect on pore gating. The solid line is a fit to ΔG1 = ΔG0 + ΔΔGDZ for all of the data points except the outlier α1V279A given Po-GABA-max = 1. The good description of the data suggests that DZ’s energetic contribution to pore gating is the same for all of the constructs on this line, estimated as ΔΔGDZ = −0.4 kcal/mol. In contrast, α1V279A more than doubles the energy that DZ binding transmits to the pore gate. A comparison of the bold and light gray symbols shows that reducing Po–GABA–max to 0.5 primarily shifts the data points along the fitted line with only minor changes in ΔΔGDZ, indicating that our assumption for the value of Po–GABA–max is not critical for interpretation of ΔΔGDZ. Nonetheless, we verified that single L9'T/V279A receptors open with high probability (Figure 7—figure supplement 1). (C) Summary of ΔΔGDZ for individual oocytes. Negative values of ΔΔGDZ increase channel open probability. Gray box plots indicate the median and 25th and 75th percentiles. The vertical line is the position of linear fit in (B) corresponding to −0.4 kcal/mol.
Figure 7—figure supplement 1
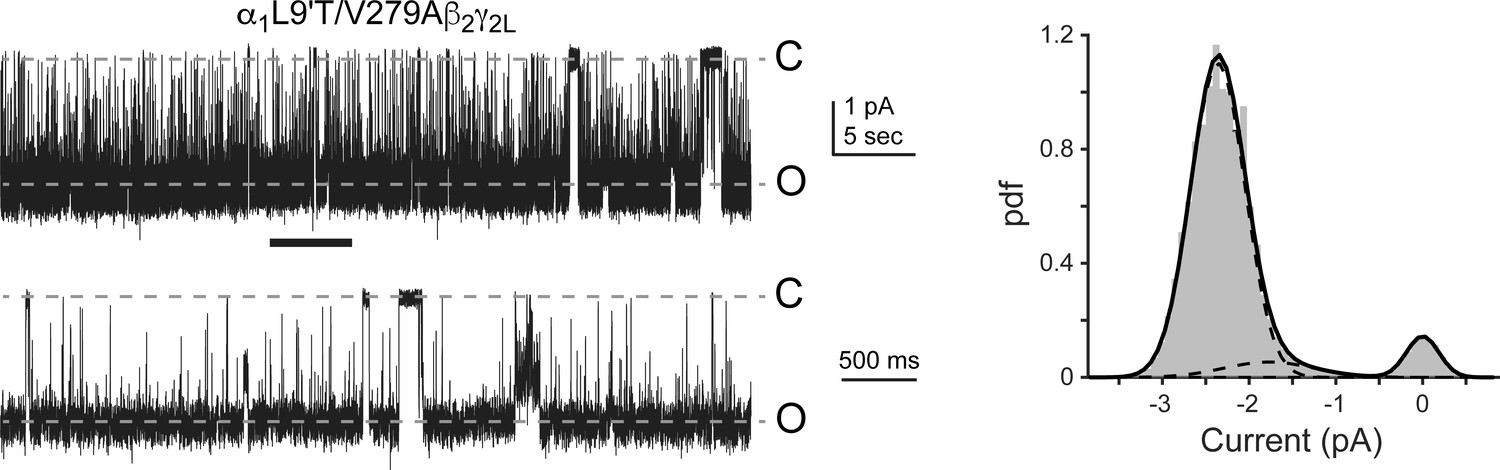
Single-channel opening for L9'T/V279A in saturating GABA.
(Left) Single-channel recording for an α1L9'T/V279Aβ2γ2L receptor in 100 μM GABA. Dashed lines indicate fully closed (C) and fully open (O) current levels. Bottom trace shows the portion of the top trace indicated by the black bar on an expanded timescale. At least one subconductance level was observed, although it was relatively infrequent as compared to the maximal conductance level. Trace was low-pass filtered at 1 kHz for display only. (Right) Histogram of current amplitudes from the trace on the left. Solid line is a fit to a mixture of three Gaussian components, and dashed lines show individual components. Components mean ± standard deviation (weight): −2.4 ± 0.3 (0.86), −1.8 ± 0.5 (0.07), 0.0 ± 0.2 (0.07).
Figure 8 with 1 supplement
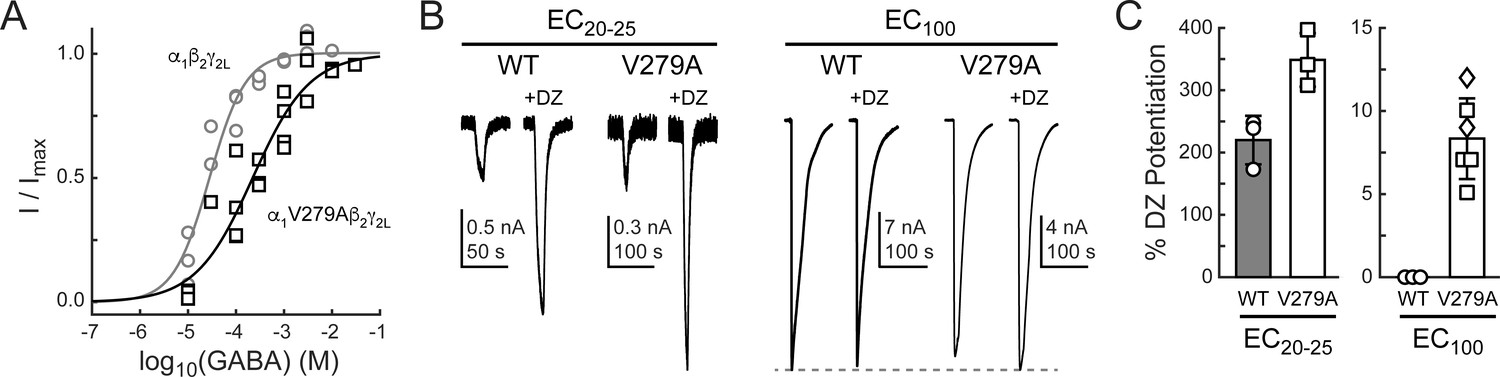
The mutation α1V279A enhances DZ potentiation of GABA-evoked current amplitudes in a wild-type (WT) α1β2γ2L background.
(A) Normalized GABA concentration–response relationships for WT (circles, three oocytes) and V279A (squares, four oocytes). Solid lines are fits to Equation 1 for all oocytes combined. Fit parameters are EC50, hill slope (# oocytes): WT = 28 μM, 1.2 (3); V279A = 222 μM, 0.7 (4). (B) Potentiation of current amplitudes evoked by 10 second pulses of either subsaturating EC20-25 (WT: 10 μM, V279A: 30 μM) or saturating EC100 (WT: 3 mM, V279A: 3–30 mM) GABA by 1 μM DZ. (C) Summary of potentiation as shown in (B) for individual oocytes. For V279A EC100, squares indicate 3 or 10 mM GABA and diamonds 30 mM GABA.
Figure 8—figure supplement 1
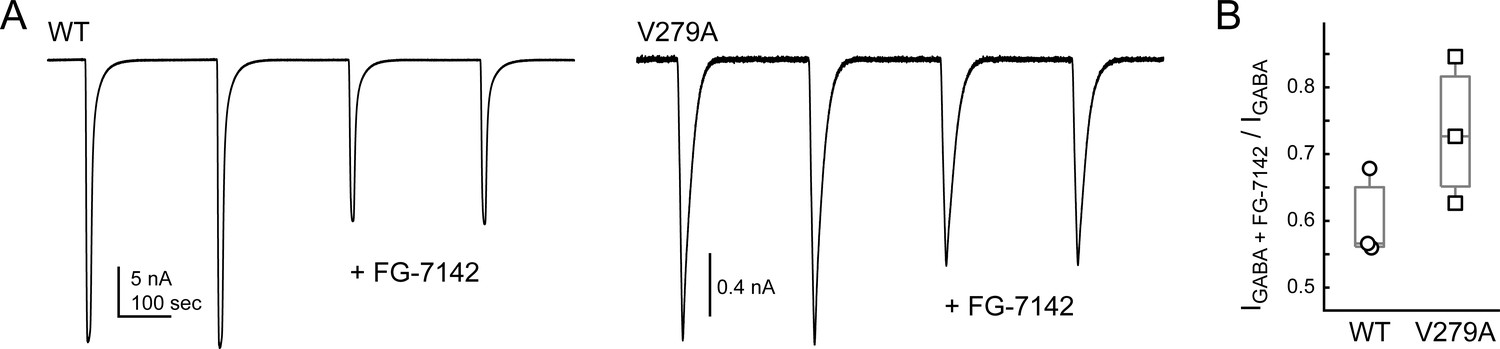
Reduction of GABA-evoked currents by the BZD negative modulator FG-7142 for α1β2γ2L (WT) and α1V279Aβ2γ2L (V279A) receptors.
(A) Pair of current responses to 10 second pulses of ~EC20-25 GABA (WT: 10 μM, V279A: 30 μM) followed by a pair of responses to ~EC20-25 GABA + 1 μM FG-7142. (B) Summary of the ratio of peak currents as shown in (A) in the presence and absence of FG-7142 for individual oocytes. Gray box plots indicate the median and 25th and 75th percentiles.
Figure 9 with 1 supplement
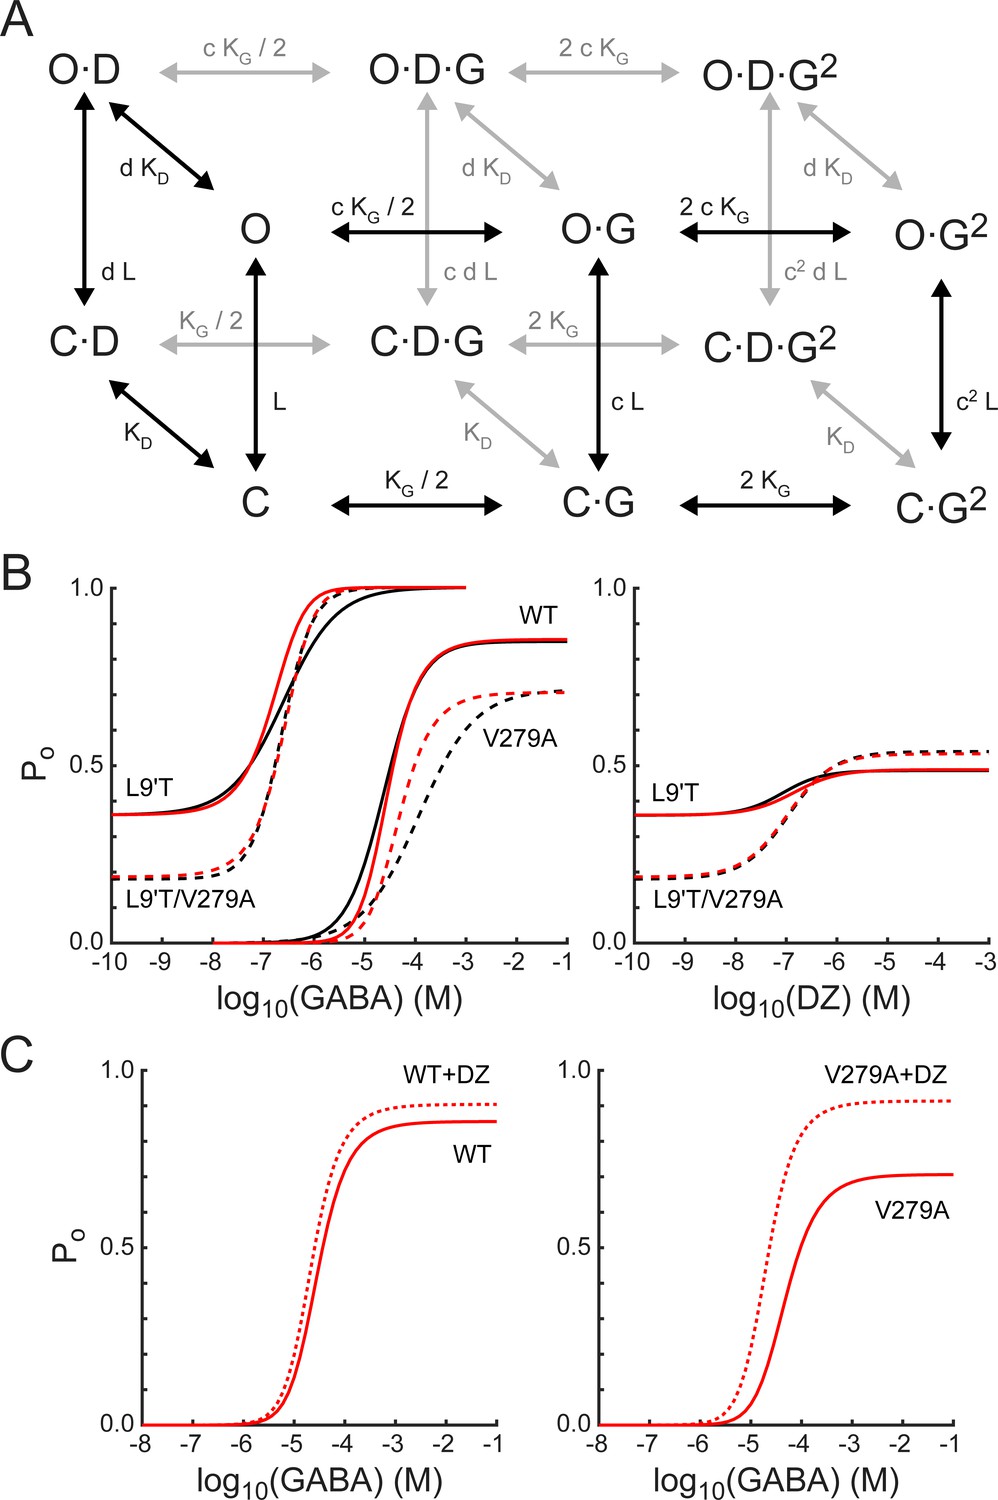
A simple MWC model of channel gating largely accounts for the observed effects of α1L9'T and α1V279A via independent and additive effects on the pore-gating equilibrium.
(A) The model depicts channel gating between closed (C) and open (O) states with independent binding of two GABA (G) and one DZ (D) molecule. L is the ratio of closed to open state probabilities in the absence of ligand, KG and KD are the respective dissociation constants for GABA or DZ, and c and d are the respective factors by which GABA or DZ binding influence channel opening. The probability to be in an open state is given by Equation 4. (B) Estimated open probability (Po) from the data in Figures 2–5 (black) overlaid with model simulations (Equation 4, red). See main text for a detailed description. Model parameters are: LL9'T = 1.8; LL9'T/V279A = 4.4; LWT = 18000; KG = 53 μM; KD = 180 nM; c = 0.0031; d = 0.59; dV279A = 0.20. (C) The model’s prediction for potentiation of WT and V279A GABA-evoked responses by 1μM DZ.
-
Figure 9—source code 1
MWC simulation code.
- https://cdn.elifesciences.org/articles/64400/elife-64400-fig9-code1-v2.zip
Figure 9—figure supplement 1
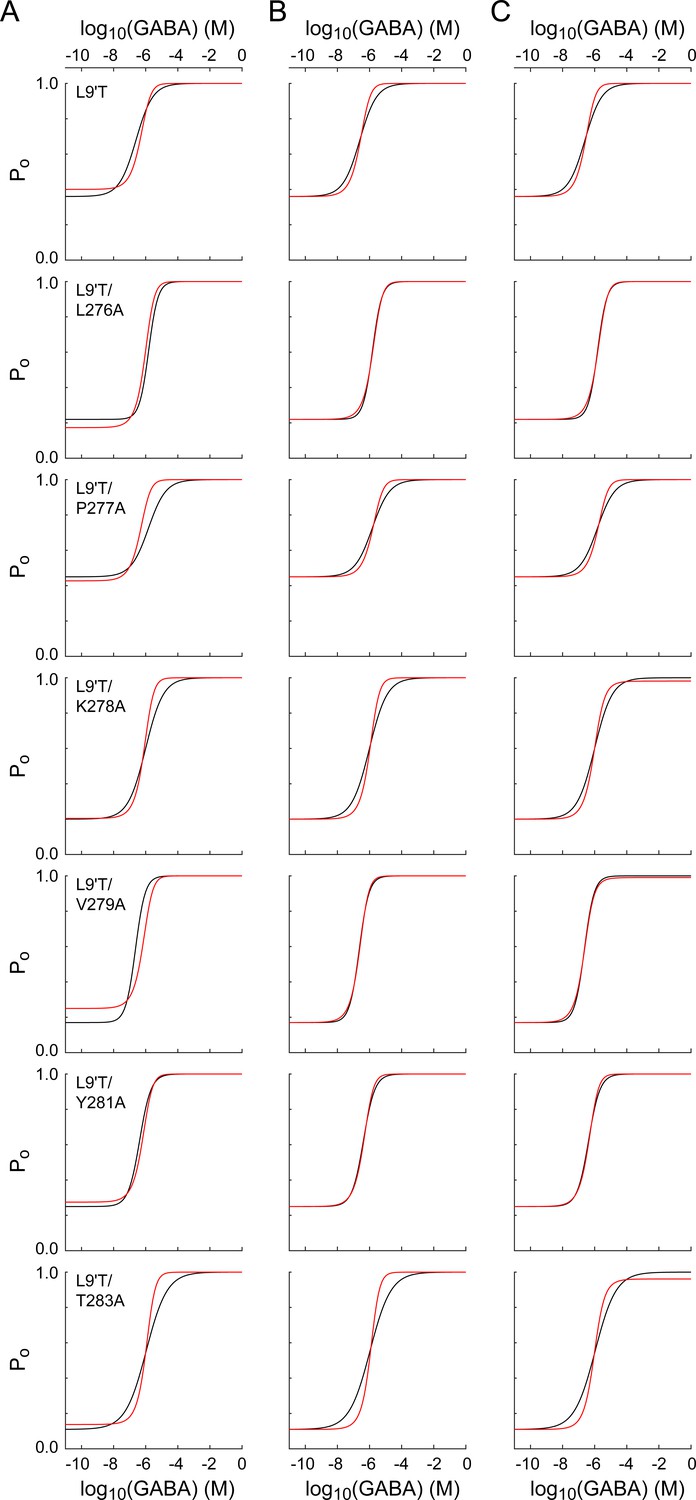
Estimated open probability (Po) from the data in Figure 2 (black) overlaid with simulations for the model in Figure 9A (red).
(A) Model fits assuming mutations have identical affinities for GABA (KG = 190 μM, c constrained to 0.003). L9'T: L = 1.5; L9'T/L276A: L = 0.9; L9'T/P277A: L = 1.3; L9'T/K278A: L = 3.9; L9'T/V279A: L = 0.7; L9'T/Y281A: L = 2.6; L9'T/T283A: L = 6.3. (B) Model fits with constraints L =(1 – Po–unliganded)/Po–unliganded and c = 0.003. L9'T: KG = 90 μM; L9'T/L276A: KG = 390 μM; L9'T/P277A: KG = 670 μM; L9'T/K278A: KG = 240 μM; L9'T/V279A: KG = 50 μM; L9'T/Y281A: KG = 120 μM; L9'T/T283A: KG = 180 μM. (C) Same as (B) except c was allowed to vary. L9'T: KG = 270 μM, c = 0.001; L9'T/L276A: KG = 250 μM, c = 0.005; L9'T/P277A: KG = 500 μM, c = 0.004; L9'T/K278A: KG = 8 μM, c = 0.07; L9'T/V279A: KG = 3 μM, c = 0.04; L9'T/Y281A: KG = 270 μM, c = 0.001; L9'T/T283A: KG = 5 μM, c = 0.07.
Tables
Table 1
Summary of peak current ratios and ΔΔGDZ for mutations in the L9'T background.
Data are mean ± standard deviation (# oocytes), and individual data points are shown in Figures 3B, 5B, 6C, and 7C.
| IPTX /IGABA-max | IDZ-max /IPTX | ΔΔGDZ (kcal/mol) | |
|---|---|---|---|
| L9'T | 0.36 ± 0.04 (5) | 1.35 ± 0.05 (5) | −0.31 ± 0.04 (5) |
| L9'T/L276A | 0.22 ± 0.09 (4) | 1.62 ± 0.07 (5) | −0.45 ± 0.04 (5) |
| L9'T/P277A | 0.45 ± 0.03 (3) | 1.41 ± 0.17 (5) | −0.46 ± 0.20 (5) |
| L9'T/K278A | 0.20 ± 0.06 (5) | 1.67 ± 0.15 (4) | −0.44 ± 0.08 (4) |
| L9'T/V279A | 0.17 ± 0.04 (4) | 3.30 ± 0.70 (5) | −1.11 ± 0.30 (5) |
| L9'T/V279D | 0.02 ± 0.005 (3) | 2.31 ± 0.08 (3) | −0.52 ± 0.02 (3) |
| L9'T/V279W | 0.16 ± 0.05 (2) | 1.96 ± 0.23 (3) | −0.53 ± 0.10 (3) |
| L9'T/Y281A | 0.25 ± 0.07 (5) | 1.59 ± 0.11 (4) | −0.42 ± 0.07 (4) |
| L9'T/T283A | 0.11 ± 0.03 (5) | 1.71 ± 0.10 (6) | −0.38 ± 0.04 (6) |
Additional files
Download links
A two-part list of links to download the article, or parts of the article, in various formats.
Downloads (link to download the article as PDF)
Open citations (links to open the citations from this article in various online reference manager services)
Cite this article (links to download the citations from this article in formats compatible with various reference manager tools)
A critical residue in the α1M2–M3 linker regulating mammalian GABAA receptor pore gating by diazepam
eLife 10:e64400.
https://doi.org/10.7554/eLife.64400


