Preserved sensory processing but hampered conflict detection when stimulus input is task-irrelevant
- Department of Psychology, University of Amsterdam, Netherlands
- Amsterdam Brain & Cognition, University of Amsterdam, Netherlands
- Department of Psychology, University of Cambridge, United Kingdom
- Vicerrectoría de Investigación y Posgrado, Universidad Católica del Maule, Chile
- Behavioural and Clinical Neuroscience Institute, United Kingdom
Figures
Figure 1

Experimental design of experiment 1.
(A, B) Schematic representation of the experimental design for auditory content discrimination task I (A) and vertical random dot-motion (RDM) task (B). In both tasks, the spoken words ‘left’ and “right were presented through either a speaker located on the left or right side of the participant. Note that auditory stimuli are only task-relevant in auditory content discrimination task I and not in the vertical RDM task. In this figure, sounds are only depicted as originating from the right, whereas in the experiment the sounds could also originate from the left speaker. (A) In content discrimination task I, participants were instructed to report the content (‘left’ or ‘right’) of an auditory stimulus via a button press with their left or right hand, respectively, and to ignore the spatial location at which the auditory stimulus was presented. (B) During the vertical RDM task, participants were instructed to report the overall movement direction of dots (up or down) via a button press with their right hand, whilst still being presented with the auditory stimuli, which were therefore task-irrelevant. In both tasks, content of the auditory stimuli could be congruent or incongruent with its location of presentation (50% congruent/incongruent trials). (C) Overview of the sequence of the four experimental sessions of this study. Participants performed two electroencephalography sessions during which they first performed the vertical RDM task followed by auditory content discrimination task I. Each session consisted of 1200 trials, divided over 12 blocks, allowing participants to rest in between blocks. In between experimental sessions, participants were trained on auditory content discrimination task I on two training sessions of 1 hr each.
Figure 2 with 1 supplement
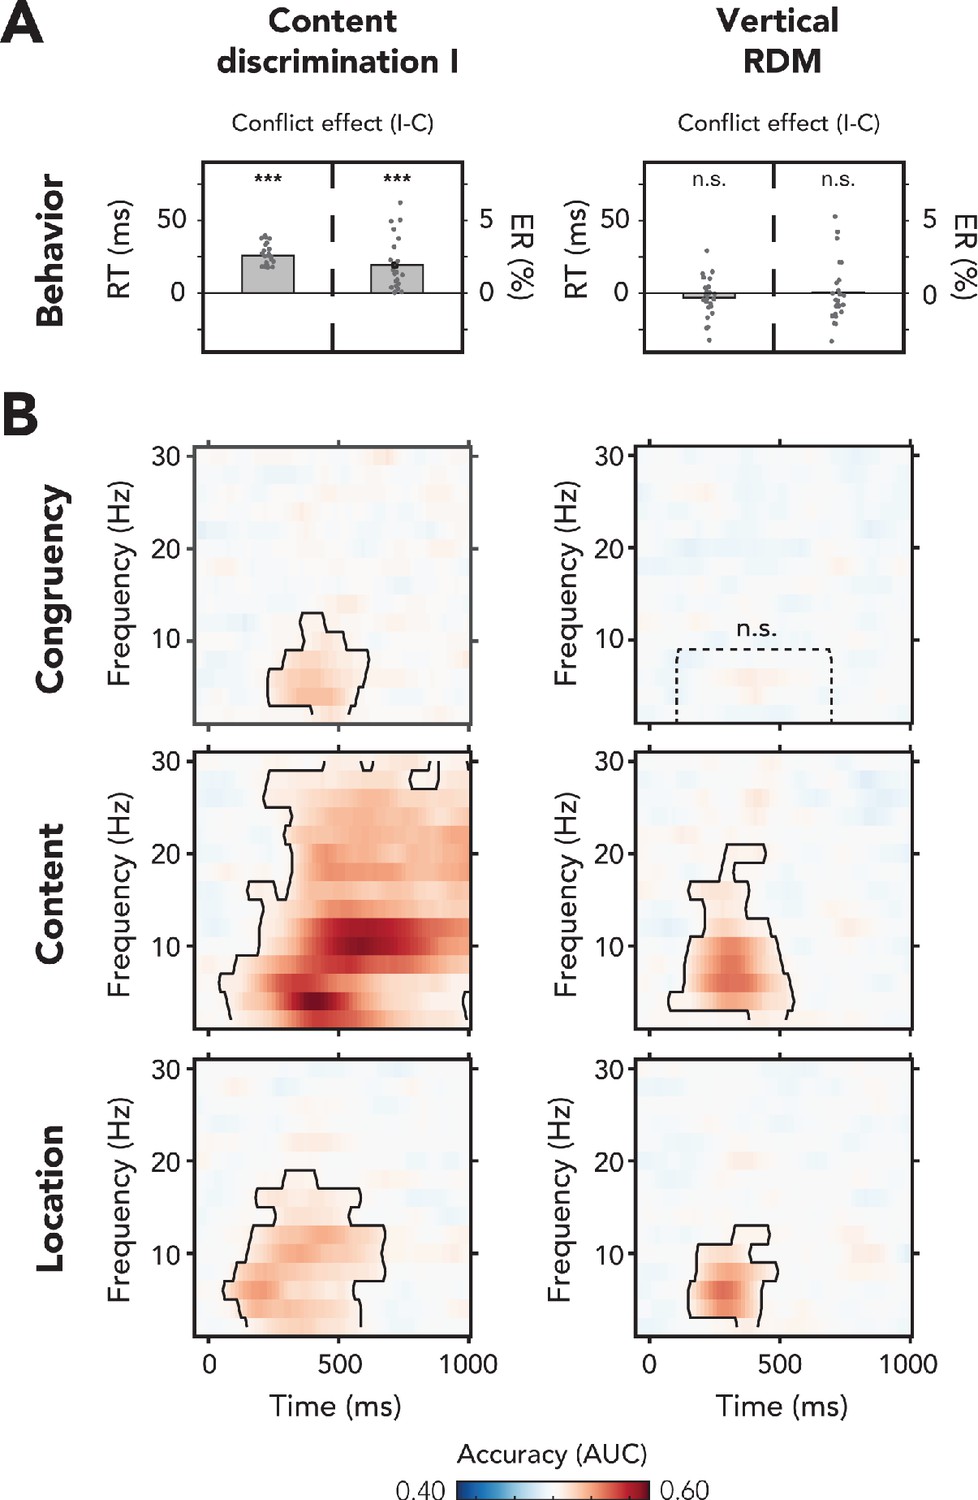
Behavioral and multivariate decoding results of experiment 1.
(A, B) All results depicted here are from the merged data of both experimental sessions. The left column of plots shows the results for content discrimination task I, where auditory stimuli and conflicting features were task-relevant. The right column of plots shows the results for the vertical random dot-motion (RDM), where neither the auditory stimulus nor its conflicting features were task-relevant. (A) The behavioral results are plotted as conflict effects (incongruent – congruent). Effects of conflict were present in content discrimination task I, with longer reaction times (RTs) (left bar) and increased error rates (ERs) (right bar) for incongruent compared to congruent trials. For the vertical RDM task, no significant effects of conflict were found in behavior. Dots represent individual participants. The behavioral data that is shown here can be found in Figure 2—source data 1. (B) Multivariate classifier accuracies for different stimulus features. We trained classifiers on three stimulus features: auditory congruency, auditory content, and auditory location. Classifier accuracies (area under the curve [AUC]) are plotted across a time-frequency window of −100 ms to 1000 ms and 2–30 Hz. Classifier accuracies are thresholded (cluster-based corrected, one-sided: >0.5, p<0.05), and significant clusters are outlined with a solid black line. The dotted box shows the predefined ROI on which we performed a hypothesis-driven analysis. The classifier accuracies within this ROI were not significantly greater than chance for the vertical RDM task. Note that conflicting features of the auditory stimulus, content and location, could be decoded from neural data regardless of attention to the auditory stimulus. Information related to auditory congruency was present in a theta-band cluster, but only when the auditory stimulus was attended. *** p<0.001, n.s.: p>0.05.
-
Figure 2—source data 1
Behavioral results of experiment 1.
- https://cdn.elifesciences.org/articles/64431/elife-64431-fig2-data1-v2.zip
Figure 2—figure supplement 1
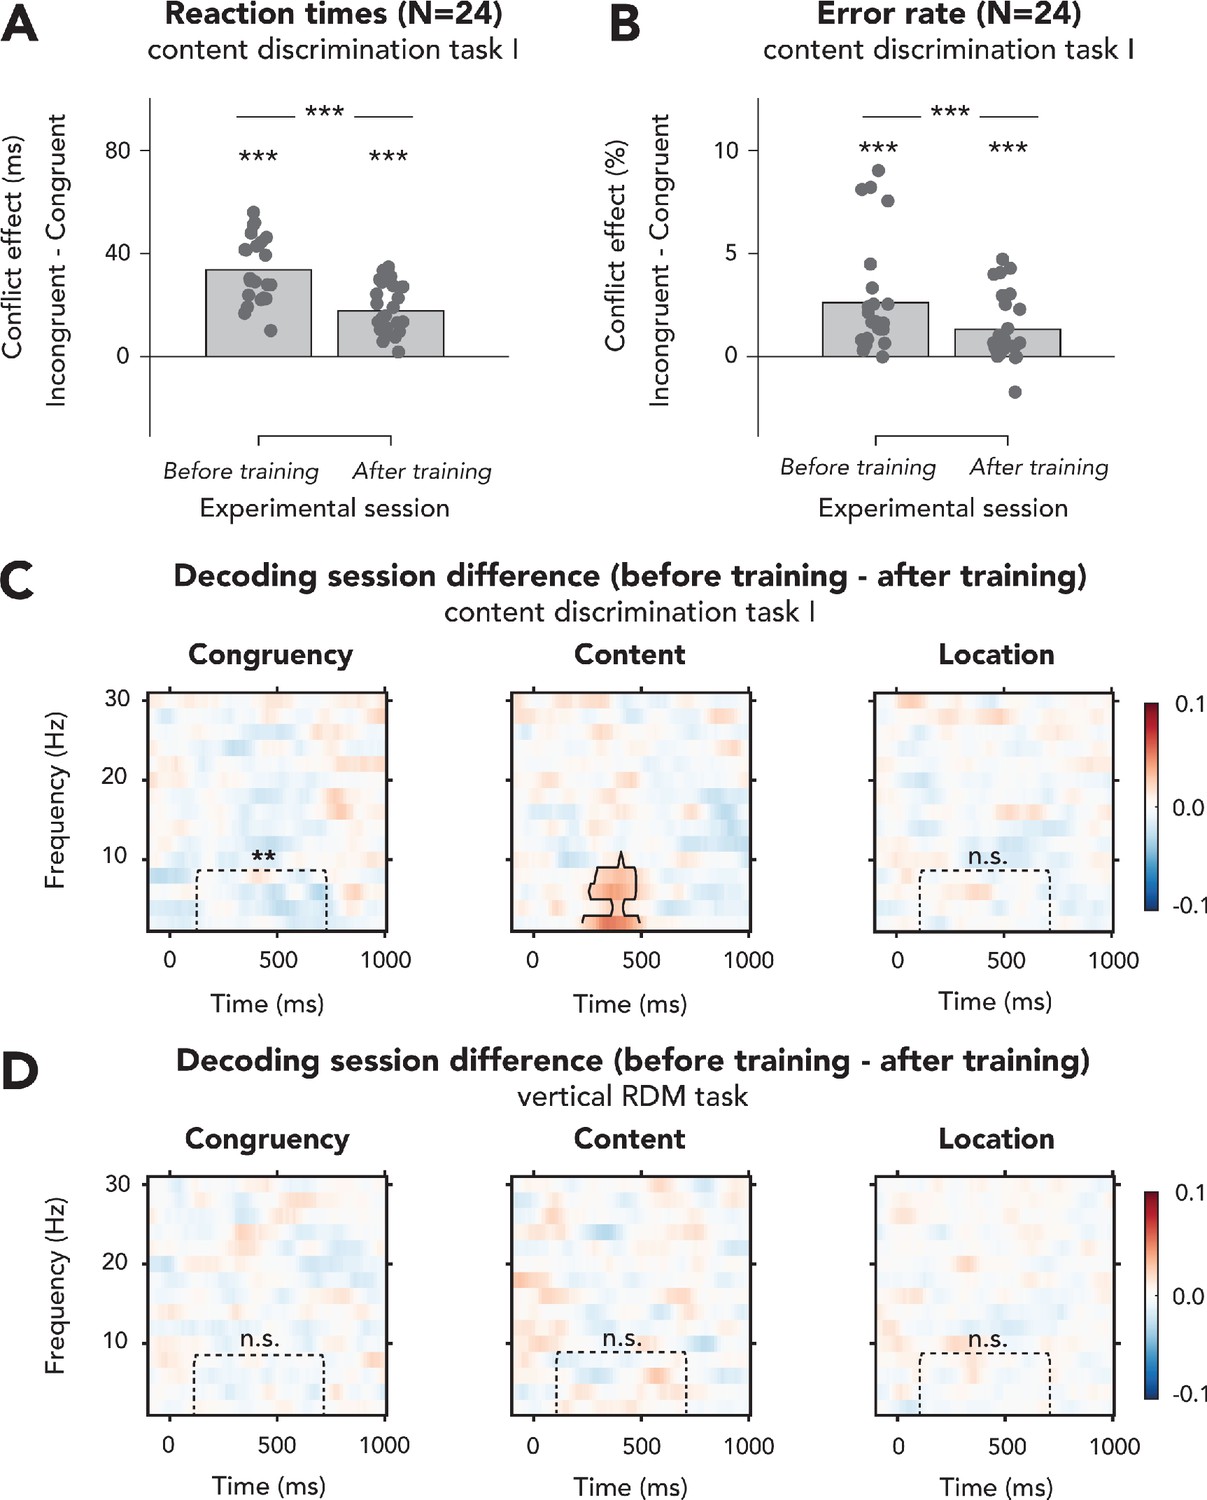
Effects of behavioral training on behavioral effects of conflict and decoding performance in experiment 1.
(A, B) We performed 2 × 2 repeated measures (rm)-ANOVAs on (A) reaction times (RTs) and (B) error rates (ERs) in content discrimination task I, with the factors being session and congruency of the auditory stimulus. In (A, B), data are plotted as conflict effects (incongruent – congruent) and for separate sessions. The top horizontal line shows significance of the interaction between session and congruency, and markers above the bars indicate significance of paired sample t-tests comparing incongruent and congruent for each run (shown data and results of t-tests can be found in Figure 2—figure supplement 1—source data 1). Effects of conflict on RTs (A) and ERs (B) significantly decreased after behavioral training on this task, suggesting more efficient processing of conflict. Effects of conflict on RTs and ERs were nonetheless present during both sessions. (C) There were no clusters for which the difference in congruency decoding between the two sessions in content discrimination task I was significant (left panel), although decoding accuracies within the preselected ROI did decrease with training for content discrimination task I, suggesting more efficient conflict resolution, in line with the behavioral results plotted in (A, B). Classifier accuracies for sound content (middle panel) were higher in a delta-theta band cluster after behavioral training, showing that the task-relevant feature was processed better. Location decoding accuracy was not affected by behavioral training as we observed no clusters where the differences between sessions and classifier accuracies within the ROI were also not different between sessions. (D) Behavioral training on the content discrimination task did not affect neural processing of auditory features in the vertical random dot-motion (no significant clusters and none of the results were significant when tested for the predefined ROI). Thresholded (cluster-based corrected, p<0.05) accuracies are depicted across the frequency range (2–30 Hz), and significant clusters are outlined with a solid black line. ***p<0.001, **p<0.01, n.s.: p>0.05.
-
Figure 2—figure supplement 1—source data 1
Behavioral results of experiment 1 - before and after training.
- https://cdn.elifesciences.org/articles/64431/elife-64431-fig2-figsupp1-data1-v2.zip
Figure 3

Experimental design of experiment 2.
(A–D) Schematic representation of the experimental design for auditory content discrimination task II (A), location discrimination task (B), volume oddball task (C), and horizontal random dot-motion (RDM) task (D). In all tasks, the spoken words ‘left’ and ‘right’ were presented through either a speaker located on the left or right side of the participant. (A) In auditory content discrimination task II, participants were instructed to report the content (‘left’ or ‘right’) of an auditory stimulus via a button press with their left or right hand, respectively, and to ignore the location of the auditory stimulus that was presented. (B) In the auditory location discrimination task, participants were instructed to report the location (left or right speaker) of an auditory stimulus via a button press with their left or right hand, respectively, and to ignore the content of the auditory stimulus that was presented. (C) During the volume oddball task, participants were instructed to detect auditory stimuli that were presented at a lower volume than the majority of the stimuli (i.e., oddballs) by pressing the spacebar with their right hand. (D) In the horizontal RDM, participants were instructed to report the overall movement of dots (left or right) via a button press with their left and right hands, respectively, whilst still being presented with the auditory stimuli. In all four tasks, content of the auditory stimuli could be congruent or incongruent with its location of presentation (50% congruent/incongruent trials). (E) Order of behavioral tasks in experiment 2. Participants always started with the volume oddball task, followed by the location discrimination task, content discrimination task, and horizontal RDM, in randomized order. Participants ended with another run of the volume oddball task.
Figure 4 with 2 supplements
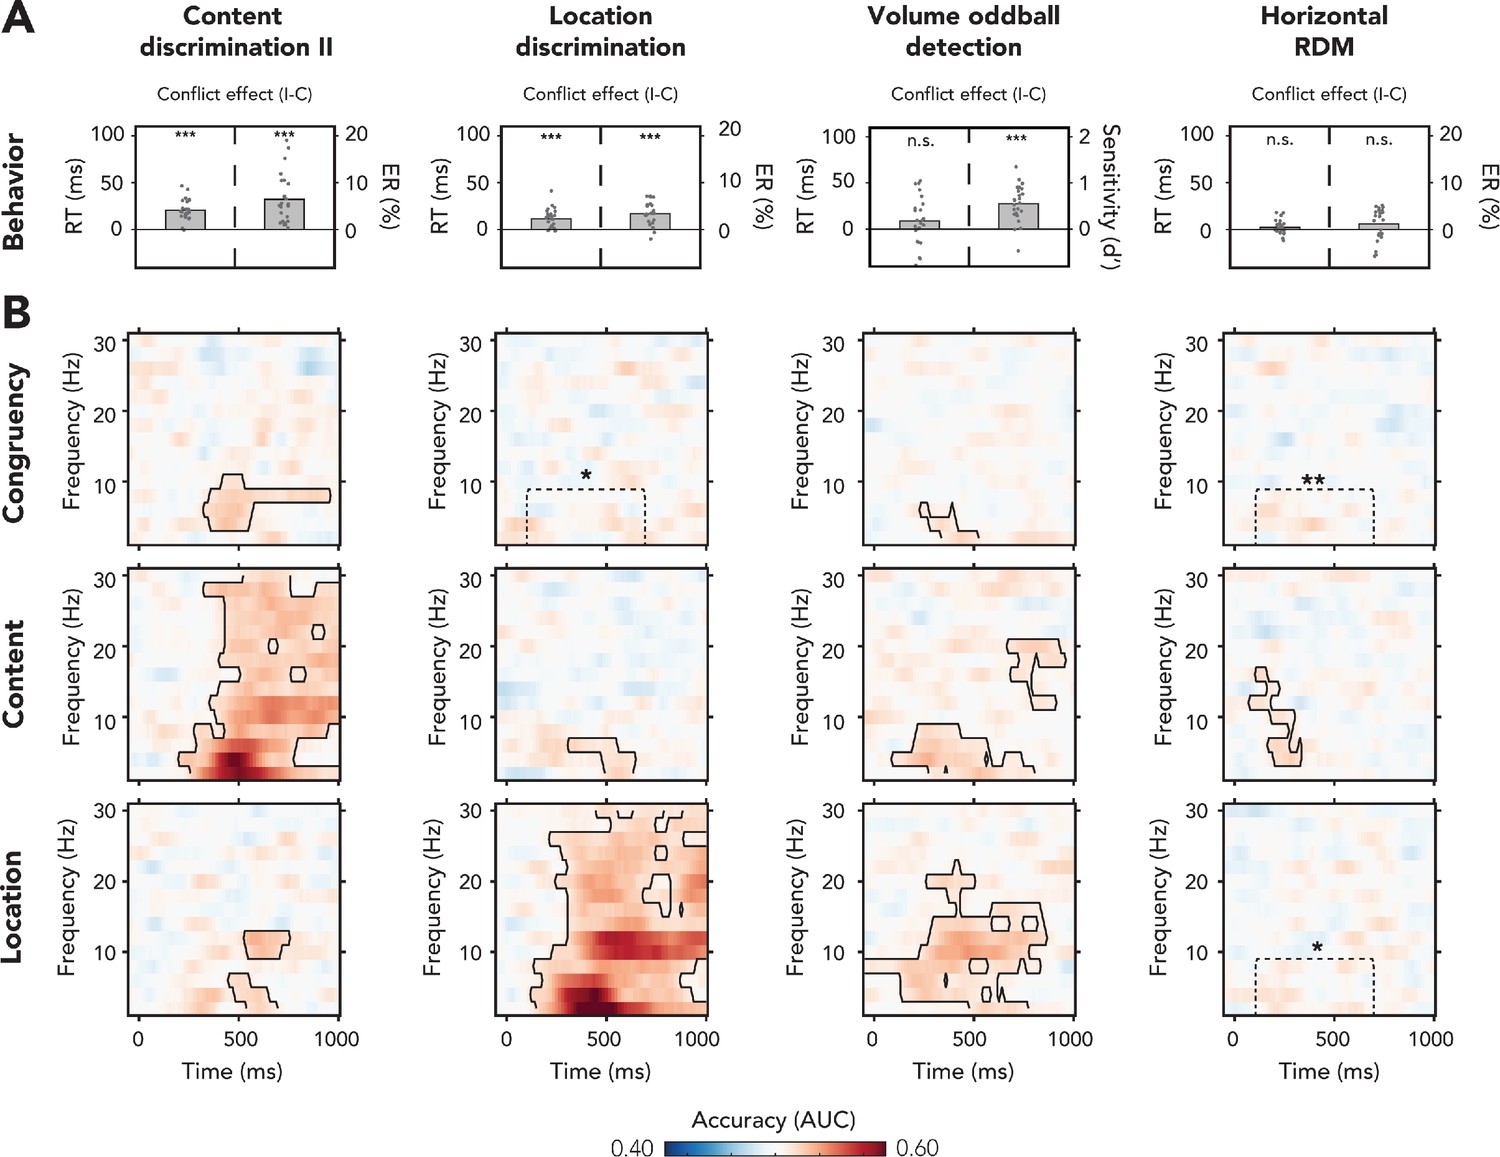
Behavioral and multivariate decoding results for experiment 2.
(A, B) The four columns show data belonging to, from left to right, content discrimination task II, the location discrimination task, the volume oddball detection task, and the horizontal random dot-motion (RDM) task. (A) Behavioral results are plotted as conflict effects (incongruent – congruent). Effects of conflict were present in all tasks where the auditory stimulus was task-relevant (content discrimination task II, location discrimination task, and volume oddball). In both auditory discrimination tasks, we observed longer reaction times (RTs) (left bar) and increased error rates (right bar) for incongruent compared to congruent trials. For the volume oddball, we did not observe an effect in RT, but increased sensitivity (d’) on incongruent compared to congruent trials. Dots represent individual participants. The data that is shown here can be found in Figure 4—source data 1. (B) Multivariate classifier accuracies for different stimulus features (auditory congruency, auditory content, and auditory location). Classifier accuracies (area under the curve [AUC]) are plotted across a time-frequency window of −100 ms to 1000 ms and 2–30 Hz. Classifier accuracies are thresholded (cluster-based corrected, one-sided: >0.5, p<0.05), and significant clusters are outlined with a solid black line. The dotted box shows the predefined ROI on which we performed a hypothesis-driven analysis. Note that the data shown for the volume oddball task was merged over both runs. *p<0.05, **p<0.01, ***p<0.001; n.s.: p>0.05.
-
Figure 4—source data 1
Behavioral results of experiment 2.
- https://cdn.elifesciences.org/articles/64431/elife-64431-fig4-data1-v2.zip
Figure 4—figure supplement 1
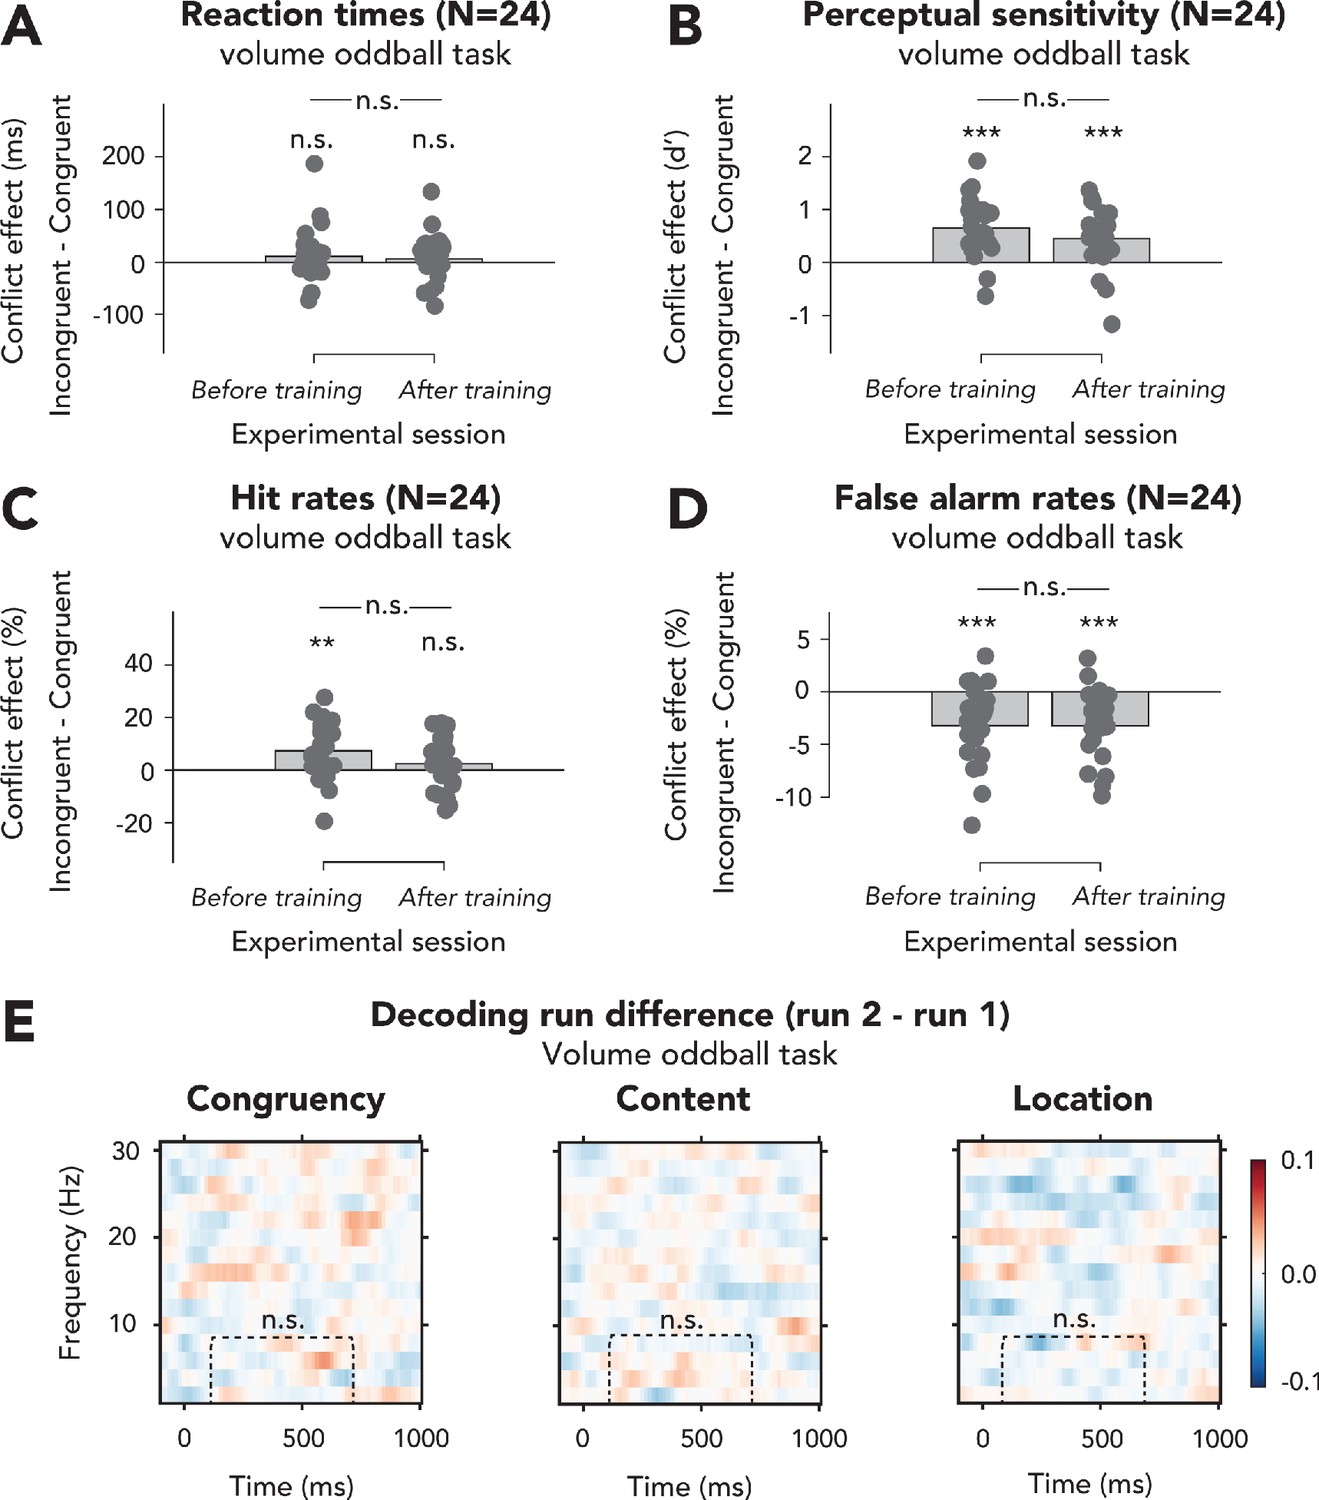
Effects of exposure to conflict inducing task on behavioral effects of conflict and decoding performance in the volume oddball task of experiment 2.
(A–D) We performed 2 × 2 repeated measures ANOVAs on (A) reaction times (RTs), (B) perceptual sensitivity (d’), (C) hit rates, and (D) false alarm rates with the factors run number and congruency of the auditory stimulus. In (A–D), data are plotted as conflict effects (incongruent – congruent) and for separate runs. The top horizontal line shows significance of the interaction between session and congruency, and markers above the bars indicate significance of paired sample t-tests comparing incongruent and congruent for each run (shown data and results of t-tests can be found in Figure 4—figure supplement 1—source data 1). (A) RTs were unaffected by auditory congruency and run number (statistics in Results). (B) There was no interaction effect between congruency and run number on perceptual sensitivity (d’; statistics in Results), and post-hoc paired sample t-tests (incongruent – congruent) revealed that the effect of congruency on d’ was present during both runs. (C) The interaction between congruency and run number was not significant (F(1,23) = 2.99, p=0.10, = 0.12, BF01 = 1.64), showing that the effect of conflict on hit rate was not different for both runs, although the effect of conflict was present during the first, but not second run. (D) False alarm rates were not modulated by the interaction between congruency and run number (F(1,23) = 0.00, p=0.99, = 0.00, BF01 = 3.45), showing that the effects of conflict were not different between runs. This conflict effect was present during both runs. (E) There were no clusters for which the difference in decoding of all features between the two runs of the volume oddball task was significant, and there were also no differences within the preselected ROI (congruency: t(22) = 0.07, p=0.95, d = 0.01, BF01 = 4.56; content: t(22) = 0.64, p=0.53, d = 0.13, BF01 = 3.81; location: t(22) = –1.25, p=0.22, d = –0.26, BF01 = 2.29), suggesting that processing of these features was not affected by training. Thresholded (cluster-based corrected, p<0.05) accuracies are depicted across the frequency range (2–30 Hz). Plots show the difference in classifier accuracy between the two runs (run 2 – run 1) of stimulus congruency (left panel), stimulus content (middle panel), and stimulus location (right panel) in the volume oddball task. n.s.: p>0.05.
-
Figure 4—figure supplement 1—source data 1
Behavioral results of the volume oddball task - first and second run.
- https://cdn.elifesciences.org/articles/64431/elife-64431-fig4-figsupp1-data1-v2.zip
Figure 4—figure supplement 2

Sensory feature decoding in the time-domain.
We trained classifiers on either sound content (A) or sound location (B) in order to see how neural representations of sensory processing were affected by our manipulation of task relevance of these features. (A) Sound content could be decoded from most tasks (except the horizontal random dot-motion [RDM]), and decoding accuracies for sound content were highest for the task in which sound content was the task-relevant feature, that is, content discrimination task II. Decoding accuracies were higher for content discrimination task II as compared to the other three tasks (difference start location discrimination: 328 ms; horizontal RDM: 313 ms; volume oddball: 344 ms). (B) Sound location could be decoded from all tasks. Again, the task in which the decoded feature was task-relevant, that is, the location discrimination task, showed the highest decoding accuracies. Location decoding performance was improved for the task in which this feature was task-relevant (i.e., location discrimination task) as compared to the other tasks. These differences started from 250 ms (vs. content discrimination task II), 234 ms (vs. horizontal RDM task), and 266 ms (vs. volume oddball task). Shaded areas represent the SEM. Bold traces indicate that feature decoding was significantly (cluster-corrected, one-sided t-test, >0.5, p<0.05) above chance. Horizontal black lines at the bottom depict where feature decoding is significantly different (cluster-corrected, two-sided t-test, p<0.05) between the task in which the feature was task-relevant versus where it was task-irrelevant. CD II: content discrimination task II; HRDM: horizontal RDM task; LD: location discrimination task; VO: volume oddball detection task.
Figure 5 with 1 supplement
Processing of sensory and conflict features for different levels of task relevance.
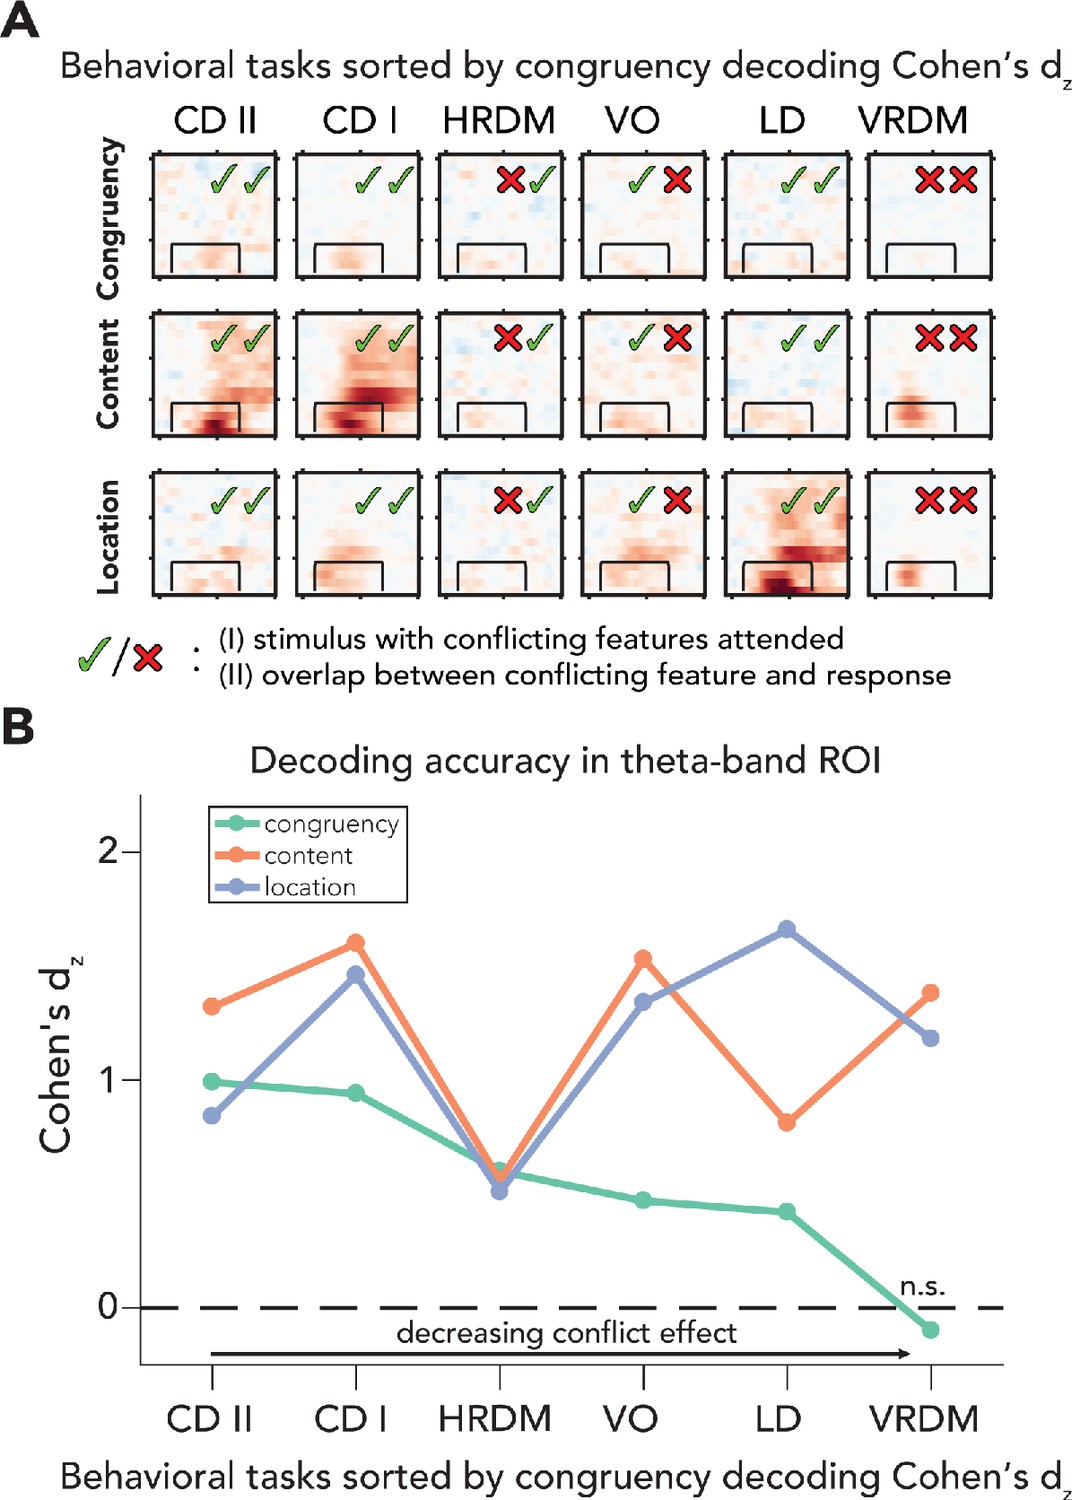
(A) Summary of the decoding results of all behavioral tasks, sorted by congruency decoding effect size (Cohen’s dz) in a preselected time-frequency ROI. The data in these plots are identical to the ones shown in Figures 2 and 4. (B) Effect sizes are shown for all task/feature combinations derived from a predefined ROI (2–8 Hz and 100–700ms) and sorted according to effect size of congruency decoding. Effect sizes for congruency decoding were dependent on behavioral task (downward slope of the green line), whereas this was not the case, or less so, for the decoding of content and location. The data can be found in Figure 5—source data 1. CD II: content discrimination task II; CD I: content discrimination task I; HRDM: horizontal RDM task; VO: volume oddball detection task; LD: location discrimination task; VRDM: vertical RDM task; n.s.: p>0.05.
-
Figure 5—source data 1
Decoding results within ROI for all tasks.
- https://cdn.elifesciences.org/articles/64431/elife-64431-fig5-data1-v2.zip
Figure 5—figure supplement 1
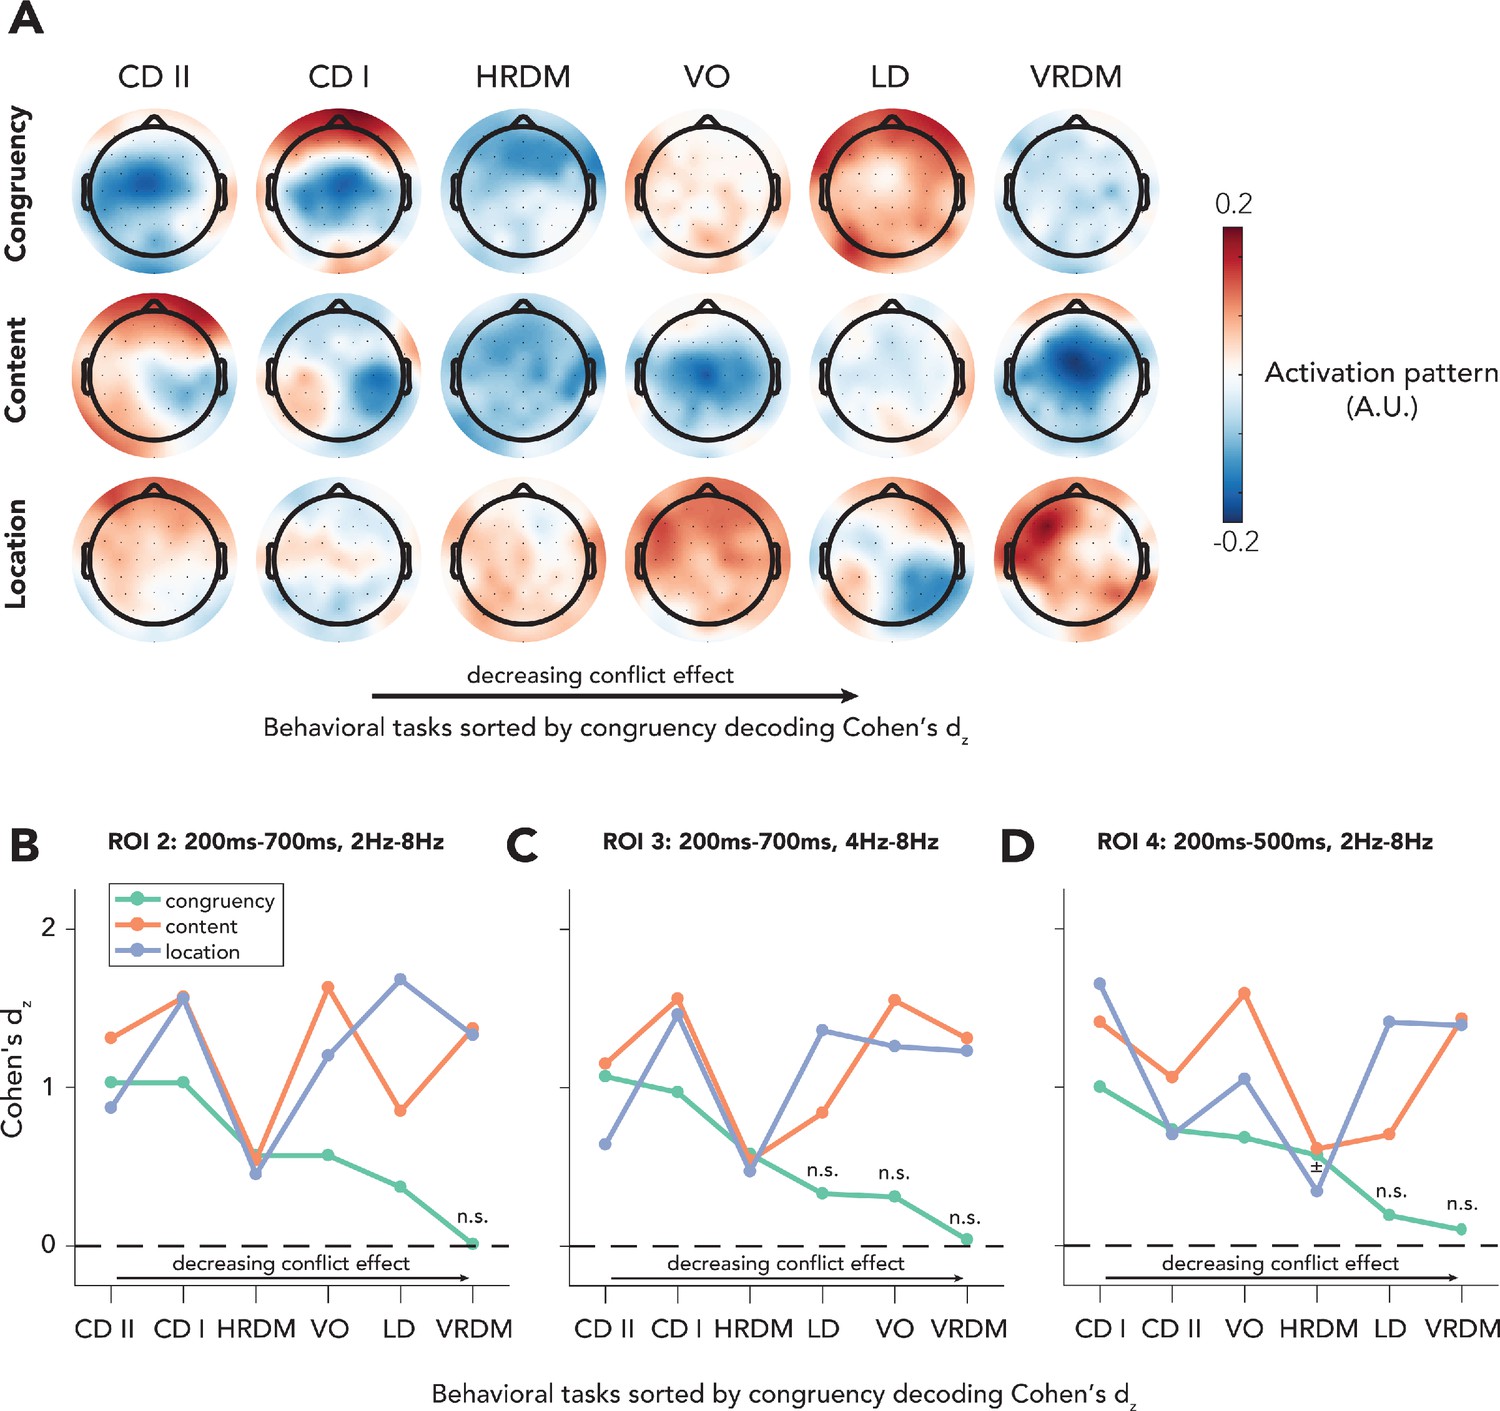
Topographic maps of reconstructed activation patterns and effects sizes for alternative ROIs.
(A) Decoding weights were extracted from the ROI that was used in the final analysis (100–700 ms, 2–8 Hz). Then these weights were transformed into activation patterns by multiplying them with the covariance in the electroencephalography data. The topographical maps of the two behavioral tasks in which congruency decoding was most accurate (content discrimination tasks I and II) reveal a clear midfrontal distribution, which is commonly found in the literature (Cohen and Cavanagh, 2011; Cohen and van Gaal, 2014; Jiang et al., 2015a; Nigbur et al., 2012). (B–D) The reported results from our ROI analyses (Figure 5B) could have been accidental due to the fact that the ROI was chosen on the basis of previous results. In order to exclude this possibility, we performed the exact same analyses (repeated measures ANCOVA with factors being task and feature) on data that were extracted from three different ROIs. Crucially, we found interaction effects between behavioral task and stimulus feature for all ROIs (ROI 2: F(10,402) = 20.31, p<0.001, = 0.34; ROI 3: F(10,402) = 12.25, p<0.001, = 0.23; ROI 4: F(10,402) = 14.47, p<0.001, = 0.27). Behavioral tasks on the x-axis are sorted by magnitude of the effect size of congruency decoding, similar to Figure 5B. Note that in all figures the VRDM task is the one with the lowest effect size in congruency. Interestingly, for all ROIs the same pattern as in Figure 5B is visible, namely that congruency decoding deteriorates to a point where accuracies are no longer significant, whereas for decoding of sensory stimulus features this is not the case. CD II: content discrimination task II; CD I: content discrimination task I; HRDM: horizontal RDM task; VO: volume oddball detection task; LD: location discrimination task; VRDM: vertical RDM task. ± p<0.06, n.s.: p>0.06.
Additional files
Download links
A two-part list of links to download the article, or parts of the article, in various formats.
Downloads (link to download the article as PDF)
Open citations (links to open the citations from this article in various online reference manager services)
Cite this article (links to download the citations from this article in formats compatible with various reference manager tools)
Preserved sensory processing but hampered conflict detection when stimulus input is task-irrelevant
eLife 10:e64431.
https://doi.org/10.7554/eLife.64431


