Apical PAR complex proteins protect against programmed epithelial assaults to create a continuous and functional intestinal lumen
- Department of Biology, Stanford University, United States
Figures
Figure 1 with 2 supplements
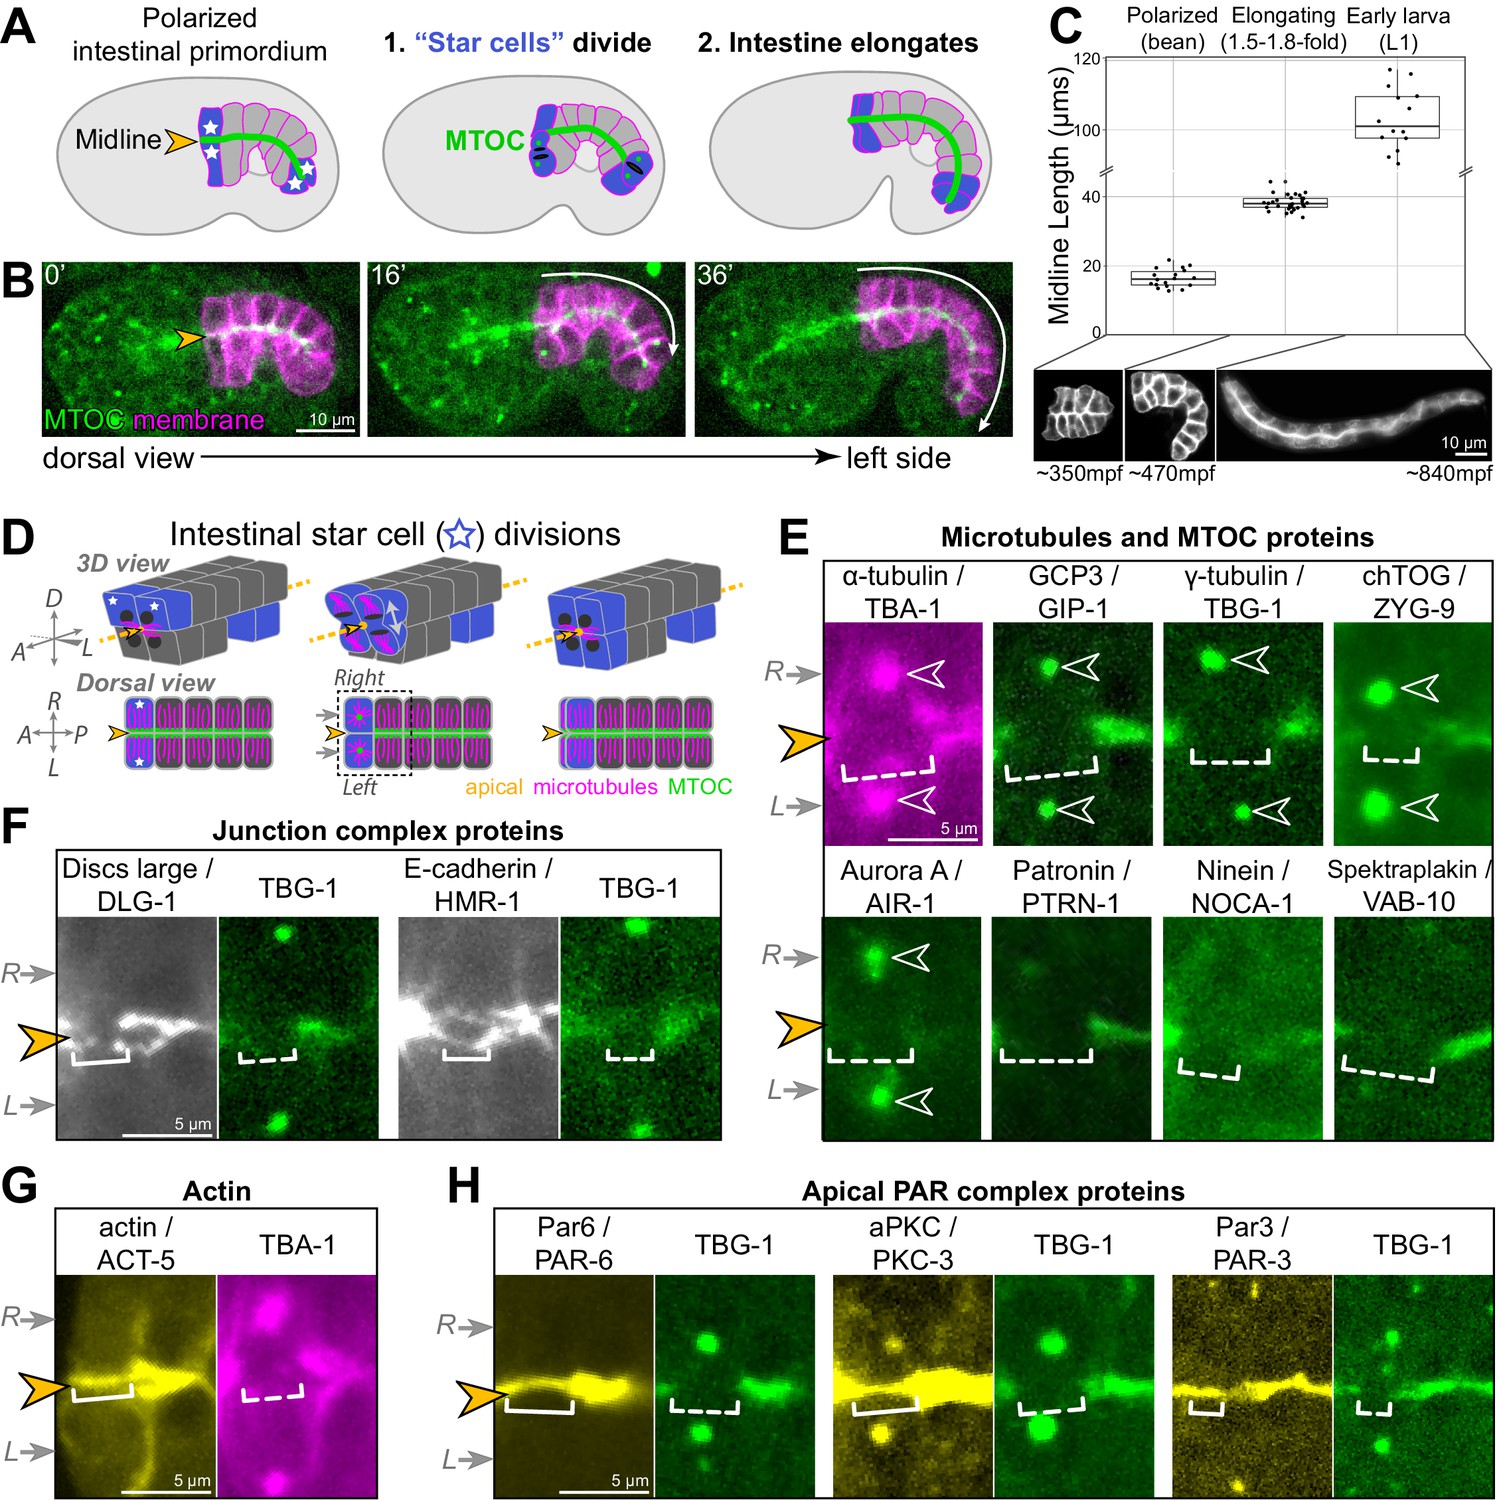
Cell division and elongation challenge the epithelial integrity of the developing C. elegans intestine.
(A, B) A cartoon schematic (A) and corresponding live time course (B) of an embryo expressing an apical microtubule-organizing center (MTOC) marker TBG-1::mCherry (green, orange arrowhead) and a membrane marker intestinal GFP::CAAX (magenta); the anterior and posterior ‘star cells’ divide (blue) and the apical surface elongates (white arrow) as the polarized intestinal primordium develops into an intestine. (C) Top: graph showing intestinal apical length in newly polarized primordia (bean stage, average length = 16.5 ± 2.6 μm, n = 18), ~1.5–2 hr after the start of intestinal elongation (1.5-fold to 1.8-fold, average length = 38.2 ± 2.2 μm, n = 30), and upon hatching in the L1 larval stage (average length = 105.0 ± 11.1 μm, n = 15). Below: corresponding intestinal GFP::CAAX images and approximate age, in minutes post-fertilization (mpf). (D) Cartoon schematic of the anterior star cell divisions illustrating their dorsoventral division in 3D (top) and from a dorsal view (bottom). Dotted line indicates viewing angle of images in (E–H). (E–H) Live imaging of indicated proteins relative to TBG-1/γ-tubulin::mCherry (green) or mCherry::TBA-1/α-tubulin (magenta) and the midline (orange arrowhead) when the right and left cells divided synchronously (gray arrows). Note that in some cases a midline gap (dashed bracket) formed, and in other cases no gap formed (solid bracket). Numbers of embryos with midline gaps in mitotic star cells, assessed by eye: mCherry::TBA-1 (5/5), ZF::GFP::GIP-1 (5/5), TBG-1::mCherry (10/10), mCherry::AIR-1 (10/10), ZYG-9::ZF::GFP (3/3), PTRN-1::GFP (5/5), NOCA-1::ZF::GFP (7/7), VAB-10B::GFP (3/3), HMR-1::GFP (0/8), DLG-1::mNG (1/8), YFP::ACT-5 (0/6), PAR-6::GFP (0/10), GFP::PKC-3 (0/5), and PAR-3::GFP (0/5). All images are maximum intensity Z-projections (0.5–1.5 μm) that capture centrosomes (open white arrowheads) and/or the intestinal midline. Scale bar = 10 μm in (B, C). Scale bar = 5 μm in (E–H).
Figure 1—figure supplement 1
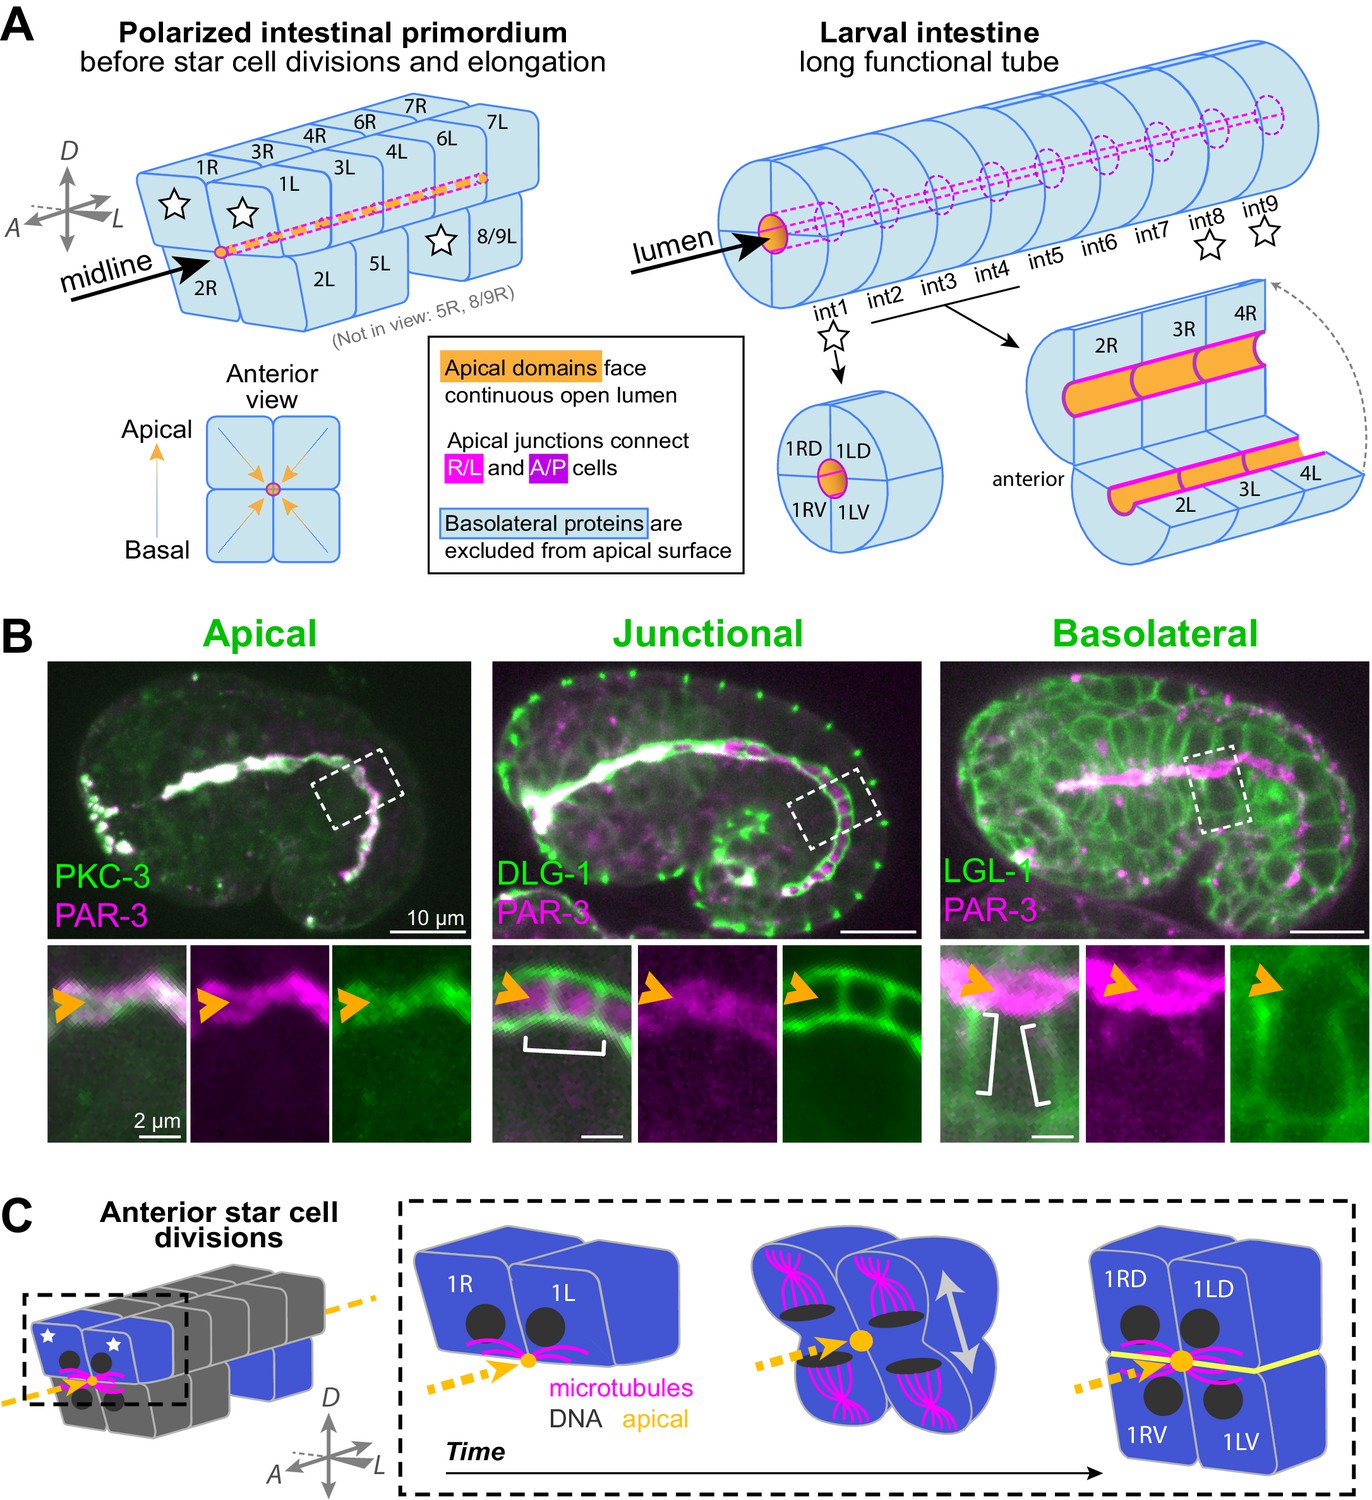
C.elegans intestinal development.
(A) Left: a 3D representation of the intestinal primordium prior to star cell divisions and elongation, with an end-on anterior view showing the apical domains (gold) of intestinal cells facing the central midline, separated from the basolateral domains (blue) by junctions (magenta). One of the 4 star cells (8/9R) and one of the 12 non-star cells (5R) are not in view. Numbers indicate which int ring each cell or its descendants will form (e.g., 3R and 4R will become part of int3 and int4, respectively). Different shades of magenta are used to highlight different cell-cell interactions. Bright magenta indicates junctions between left and right neighbors, which will together build an int ring; dark magenta indicates junctions between anterior and posterior neighbors, which will join adjacent int rings. Right: a 3D representation of the L1 larval intestine. All int rings contain two cells except for the four-celled int1. Apical domains of all cells face the central lumen, and junctions connect left/right pairs of cells within int rings (bright magenta) and also anterior and posterior cells of adjacent int rings (darker magenta), forming a ladder-like pattern. (B) Lateral confocal images of live comma-1.5-fold-stage embryos. Left panels: apical markers tagRFP::PKC-3 (green) and PAR-3::ZF::GFP (magenta). Middle panels: junctional marker DLG-1::mNG (green) with PAR-3::tagRFP (magenta), and the basolateral marker LGL-1::GFP (green) with PAR-3::tagRFP (magenta). Enlarged images of boxed regions shown below. Scale bar = 10 μm for top images, 2 μm for enlarged images. n > 10 embryos per genotype. (C) Enlarged cartoon schematic showing the orientation of anterior star cell divisions. Note that the cleavage furrow divides the apical surface of the star cells longitudinally creating new cell-cell interfaces (yellow lines), related to Figure 1D.
Figure 1—figure supplement 2
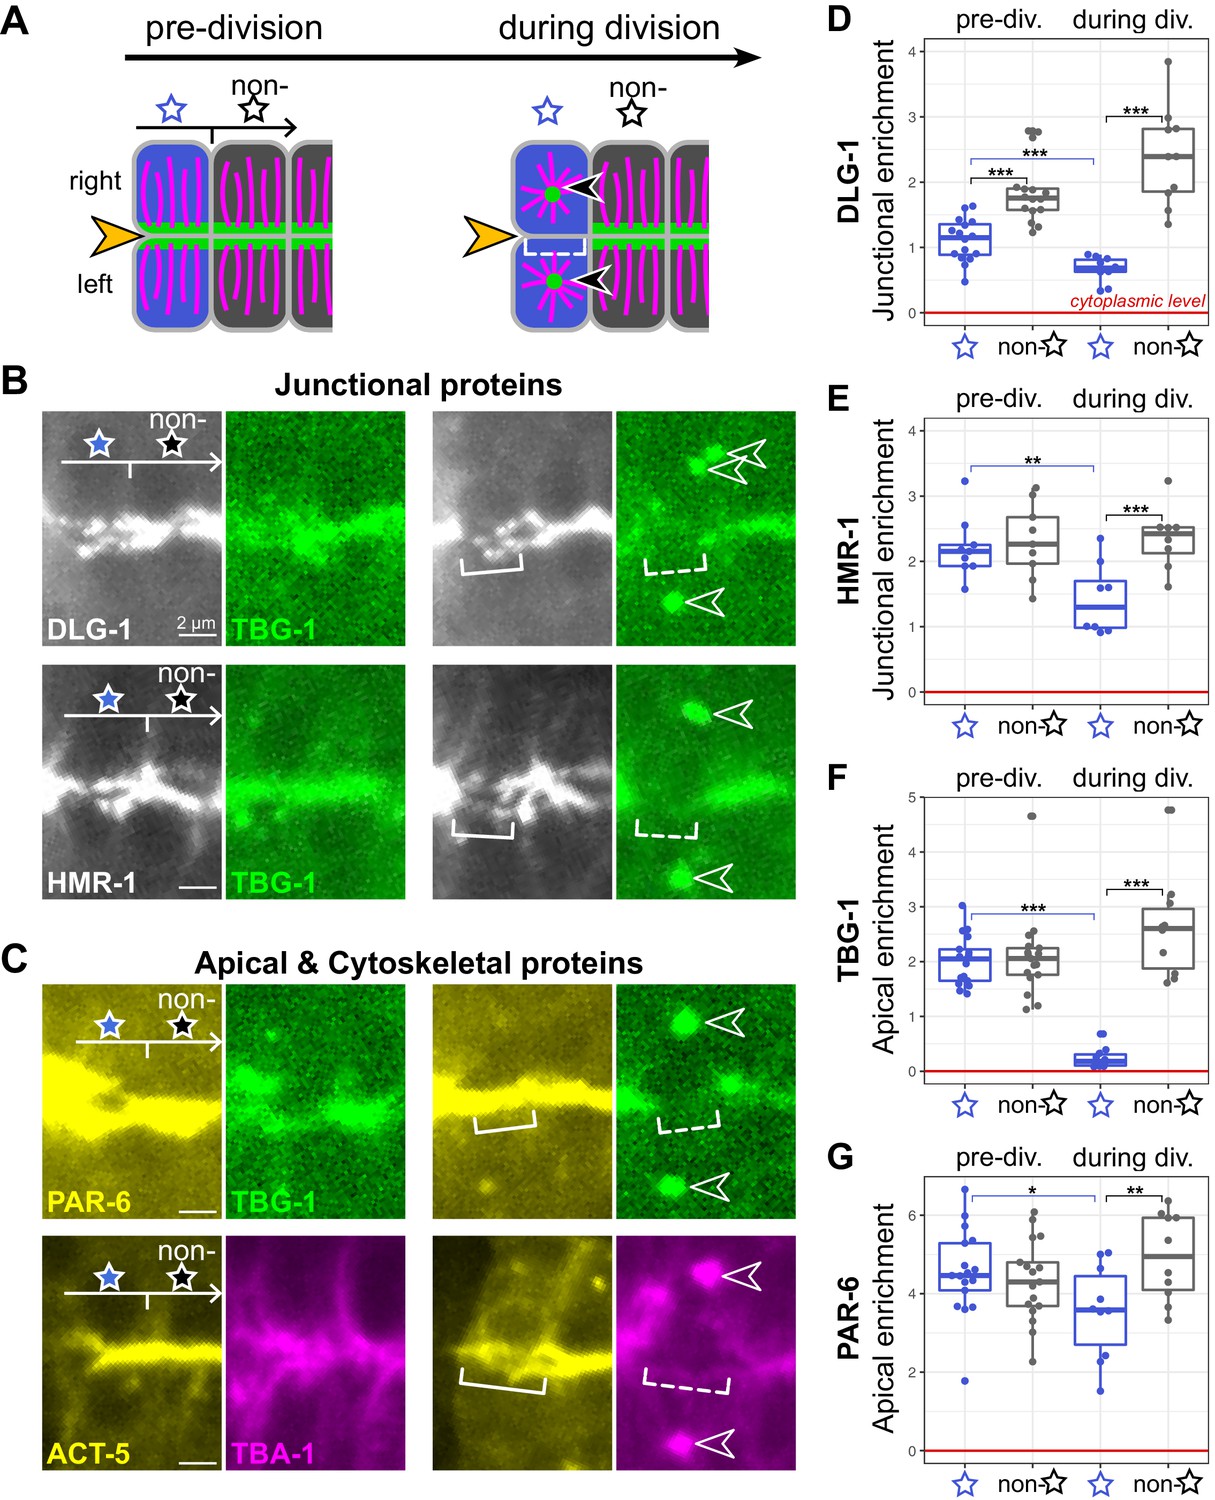
Protein localization before and during star cell divisions.
(A) Cartoon schematic of dorsal view of intestinal star cells (blue) and neighboring non-star cells (dark gray) prior to star cell divisions (left panel) and during star cell divisions (right panel). Microtubules (magenta), microtubule-organizing center (MTOC) (green), apical midline (orange arrowhead), and active centrosomes (black arrowheads). (B, C) Dorsolateral confocal images of live bean-stage embryos after pharynx polarization before star cell divisions (left two panels) and during star cell divisions (right two panels). TBG-1::mCherry was co-expressed with PAR-6::GFP, HMR-1::GFP, and DLG-1::mNG, and mCherry::TBA-1 with YFP::ACT-5, to mark the apical MTOC gap during star cell divisions. The approximate position of star cells (blue star) and non-star cells (black star) is indicated. Brackets indicate where a midline gap forms (dashed) or does not form (solid) in dividing star cells, and open arrowheads mark active centrosomes. (D–G) Graphs showing junctional enrichment of DLG-1::mNG (D) and HMR-1::GFP (E) and apical enrichment of TBG-1::mCherry (F) and PAR-6::GFP (G) in star cells (blue) and non-star cells (gray) before and during star cell divisions. Red line indicates level of average cytoplasmic background enrichment. Respective number of embryos scored pre-division and during division: PAR-6: n = 17, n = 10; TBG-1: n = 17, n = 10; HMR-1: n = 9, n = 8; DLG-1: n = 16, n = 10. Statistical analysis: Student’s t-test with Bonferroni correction. Scale bar = 2 μm. *p<0.05, **p<0.01, ***p<0.001.
Figure 2 with 2 supplements

PAR-6 and PKC-3 are required for the return of microtubule-organizing center (MTOC) function to the apical surface following mitosis.
(A–C) Dorsolateral images of live comma- to 1.5-fold-stage embryos of indicated genotypes expressing transgenic MTOC markers TBG-1::mCherry (magenta) and endogenous PTRN-1::GFP (green). Maximum intensity Z-projections (1–3 μm) capture the intestinal midline. Enlarged images of boxed regions shown below. Star cell divisions had completed, but gaps (white bracket) were observed in PAR-6gut(-) and PKC-3gut(-) embryos. (B, C) Strong GFP fluorescence outside the intestine is undegraded PAR-6::ZF::GFP and ZF::GFP::PKC-3 in non-intestinal tissues. (D) Graph showing the percent of embryos with midline gaps in TBG-1 and PTRN-1 at the anterior and/or posterior regions of the intestine, approximately where star cell divisions occurred. Control: n = 22, PAR-6gut(-): n = 18, PKC-3gut(-): n = 18. Statistical analysis: ANOVA with Tukey’s post hoc tests. Differences from control indicated with asterisks. (E) Graph showing the percent of control (n = 0/5) and PAR-6gut(-) (n = 7/8) embryos in which a midline gap in TBG-1::mCherry and PTRN-1::GFP formed in synchronously dividing cells and persisted through the end of the 32 min time-lapse movie, with the gap itself persisting for at least 24 min. Statistical analysis: Fisher’s exact test. In control embryos, the gap lasted 8 min or less, except for one which lasted 12 min. (F, G) Representative examples from (E) of live time-lapse imaging of TBG-1 and PTRN-1 during star cell divisions in indicated genotypes. Brackets mark the apical MTOC gap; arrowheads indicate active centrosomal MTOCs marked with TBG-1 localization. All experiments used ifb-2p::zif-1 to drive E8 onset of degradation. Scale bars = 10 μm in (A), 5 μm in (A) inset and (F). ***p<0.001.
Figure 2—figure supplement 1
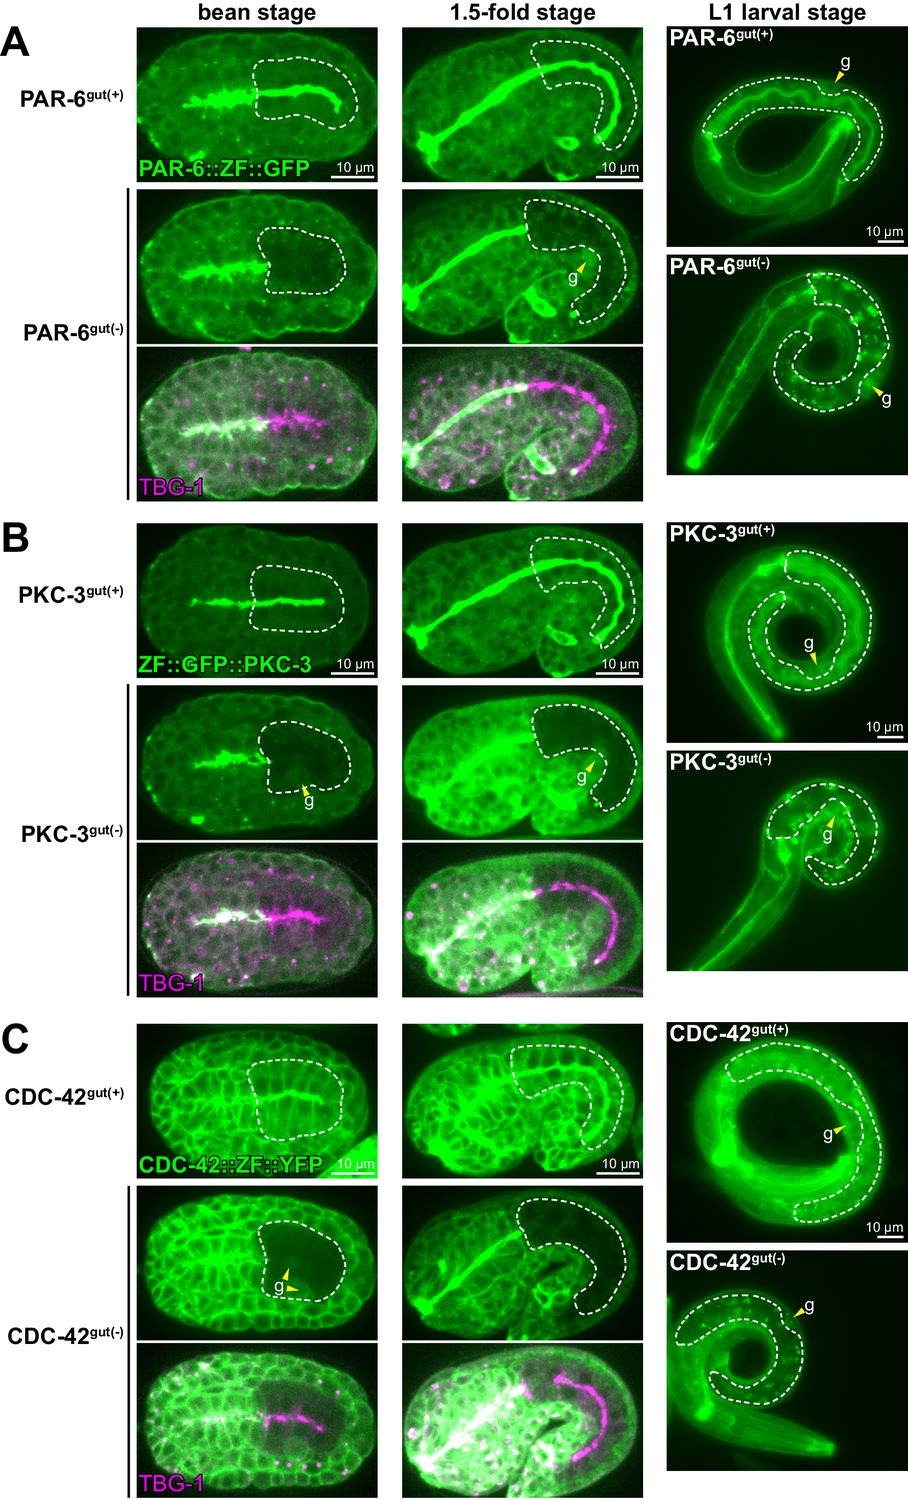
ZIF-1/ZF-mediated protein degradation.
(A-C) Dorsolateral images of live bean- and 1.5-fold-stage embryos and L1 larvae expressing endogenous PAR-6::ZF::GFP (A), ZF::GFP::PKC-3 (B), or CDC-42::ZF::YFP (C). ‘gut(+)' indicates the absence of ZIF-1 and thus that the ZF-tagged protein was not degraded, and ‘gut(-)' indicates the presence of intestine-specific expression of and degradation by ZIF-1. TBG-1::mCherry marks the intestinal midline in gut(-) embryos. Dashed white lines outline intestines. Yellow arrowheads and ‘g’ indicate germ cells in embryos and the gonad in larvae. Robust depletion by bean stage: PAR-6gut(-): n = 14/15, PKC-3gut(-): n = 25/25, CDC-42gut(-): n = 15/15. In larval intestines, bright green puncta are birefringent ‘gut granules’ and not fluorescent signal from the CRISPR alleles. All experiments used ifb-2p::zif-1 to drive E8 onset of degradation. Scale bars = 10 μm.
Figure 2—figure supplement 2
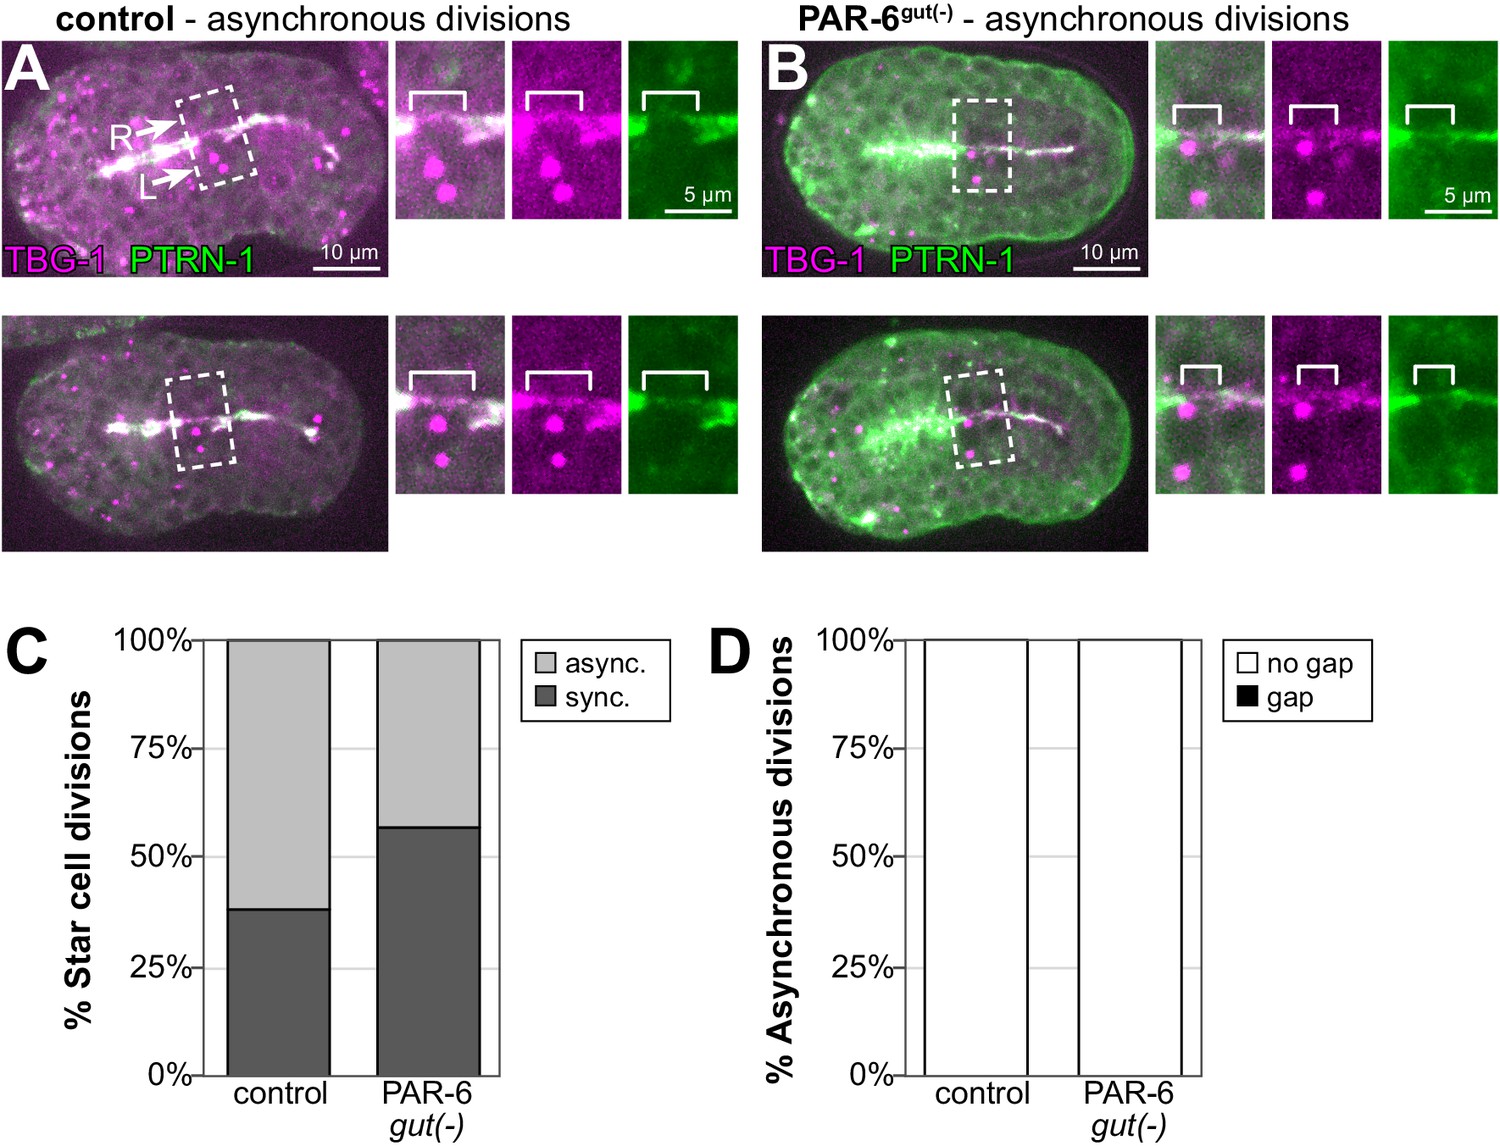
Asynchronous star cell divisions in control and PAR-6 embryos do not cause gaps in the apical microtubule-organizing center (MTOC).
Two representative control (A) and PAR-6gut(-) (B) dorsal view images of live bean stage PTRN-1::GFP and TBG-1::mCherry expressing embryos in which the star cell divisions were asynchronous. The left star cell (white arrow, ‘L’) was dividing and the right star cell (white arrow, ‘R’) was not. TBG-1 marks the apical MTOC during interphase or active centrosomes during mitosis. Maximum intensity Z-projections capture the active centrosomes, but not always the entire midline. 2× magnified images of boxed region highlighting midline gaps are shown at right (merged channels, TBG-1::mCherry only, and PTRN-1::GFP only). White brackets indicate midline region of the non-dividing right cell across the midline. (C) Graph showing the percent of star cell divisions that are asynchronous versus synchronous in control (n = 13) and PAR-6gut(-) (n = 14) embryos. Two-tailed Fisher’s exact test, p=0.4495. (D) Graph showing the percent of asynchronous star cell divisions in which a gap formed during mitosis in control (n = 0/8) and PAR-6gut(-) (n = 0/6) embryos.
Figure 3

PAR-6 and PKC-3 are required to maintain a continuous apical microtubule-organizing center (MTOC) during intestinal elongation.
(A–C) Lateral live images of 1.5-fold to 1.8-fold-stage embryos of indicated genotypes expressing MTOC markers TBG-1::mCherry and PTRN-1::GFP. Maximum intensity Z-projections (2.5–3.5 μm) capture the intestinal midline. 2× magnified images of boxed region highlighting the apical MTOC in non-star cells are shown at right. Orange arrows indicate midline gaps. (A’–C’) Line scan along the apical midline of corresponding embryos above, plotting midline length-normalized PTRN-1 or TBG-1 signal intensity from anterior to posterior. (D, E) Dorsal-dorsolateral view of posterior half of live embryos developing over 1 hr. Apical MTOC gaps are indicated (orange arrow). t = 0′, last frame of anterior star cell mitosis. (F) Graph showing percent of embryos with midline gaps in MTOC proteins as defined by the normalized signal intensity of both TBG-1 and PTRN-1 (see Materials and methods). Control: n = 22, PAR-6gut(-): n = 18, PKC-3gut(-): n = 18. Statistical analysis: ANOVA with Tukey’s post hoc tests. Differences from control indicated with asterisks. No significant difference between PAR-6gut(-) and PKC-3gut(-). (G) Graph showing percent of midline intensity measurements in (F) that are ‘background level.’ Control: 0.00%, PAR-6gut(-): 4.13%, PKC-3gut(-): 3.72%. (H) Graph showing paired comparisons per embryo in the number of background-level measurements at 10 min and 60 min after anterior star cell mitosis. Control: 0/7 embryos increased their number of background-level reads; PAR-6gut(-): 6/8 embryos increased their number of background-level reads (red lines). All experiments used ifb-2p::zif-1 to drive E8 onset of degradation. Scale bars = 5 μm. *p<0.05, ***p<0.001.
Figure 4
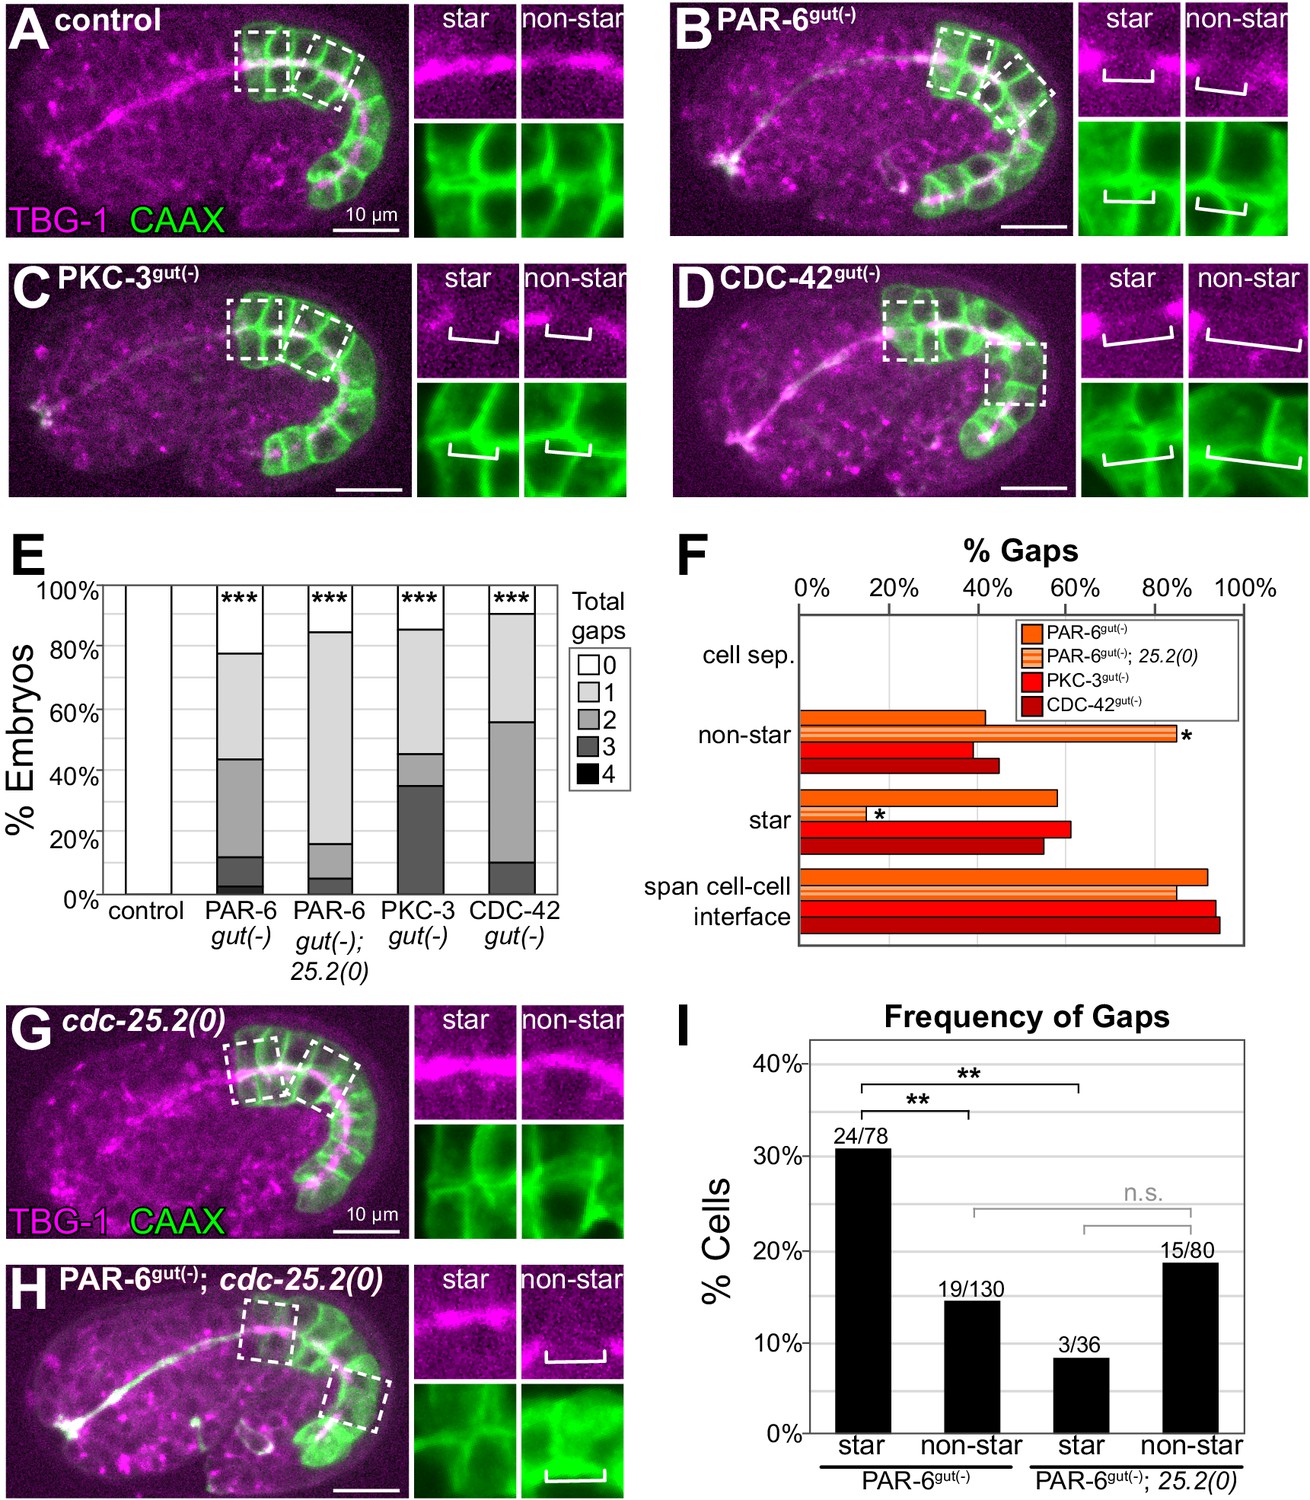
PAR-6, PKC-3, and CDC-42 are required for apical microtubule-organizing center (MTOC) continuity but not for cell adhesion.
(A–D) Lateral live images of 1.5- to 1.8-fold-stage embryos of indicated genotypes expressing intestine-specific GFP::CAAX and TBG-1::mCherry. Maximum intensity Z-projections (1–2 μm) capture the intestinal midline. 2× magnified images of boxed region highlighting the apical MTOC in star cells (left inset) and non-star cells (right inset). White brackets indicate midline gap. (E) Graph showing percent of embryos with indicated number of TBG-1 gaps assessed by eye. Number of embryos: Control: n = 41, PAR-6gut(-): n = 44, PAR-6gut(-); cdc-25.2(0) (‘25.2(0)'): n = 19, PKC-3gut(-): n = 20, and CDC-42gut(-): n = 20. Statistical analysis: ANOVA with Tukey’s post hoc tests. Differences from control indicated with asterisks. (F) Graph showing the percent of gaps of indicated genotypes that corresponded with physical separation of cells (‘cell sep.'), that occurred in non-star cells (‘non-star’) or star cell daughters (‘star’), and that spanned the cell-cell interface between anterior/posterior neighbors. Number of gaps: Control: n = 0, PAR-6gut(-): n = 59, PAR-6gut(-); cdc-25.2(0): n = 20, PKC-3gut(-): n = 33, and CDC-42gut(-): n = 31. Statistical analysis: Fisher’s exact test comparing the relative proportion of star and non-star cell gaps in PAR-6gut(-) versus PAR-6gut(-); cdc-25.2(0) genotypes (see Materials and methods). (G, H) Live lateral images of 1.5-fold-stage embryos of indicated genotypes, markers and insets as in (A–D). The cdc-25.2(0) mutation blocks star cell divisions. cdc-25.2(0): n = 12 embryos with no apical TBG-1 gaps. PAR-6gut(-); cdc-25.2(0): n = 19 embryos. (I) Graph showing percent of star or non-star cell interfaces that have a TBG-1::mCherry gap for each genotype (see Materials and methods). PAR-6gut(-): n = 26 embryos, PAR-6gut(-); cdc-25.2(0): n = 19 embryos. Statistical analysis: Fisher’s exact test comparing the frequency of gaps in PAR-6gut(-) and PAR-6gut(-); cdc-25.2(0) genotypes. See Materials and methods for details of analysis. All experiments used ifb-2p::zif-1 to drive E8 onset of degradation. Scale bars = 10 μm. *p<0.05, **p<0.01, ***p<0.001, n.s. = not significant.
Figure 5
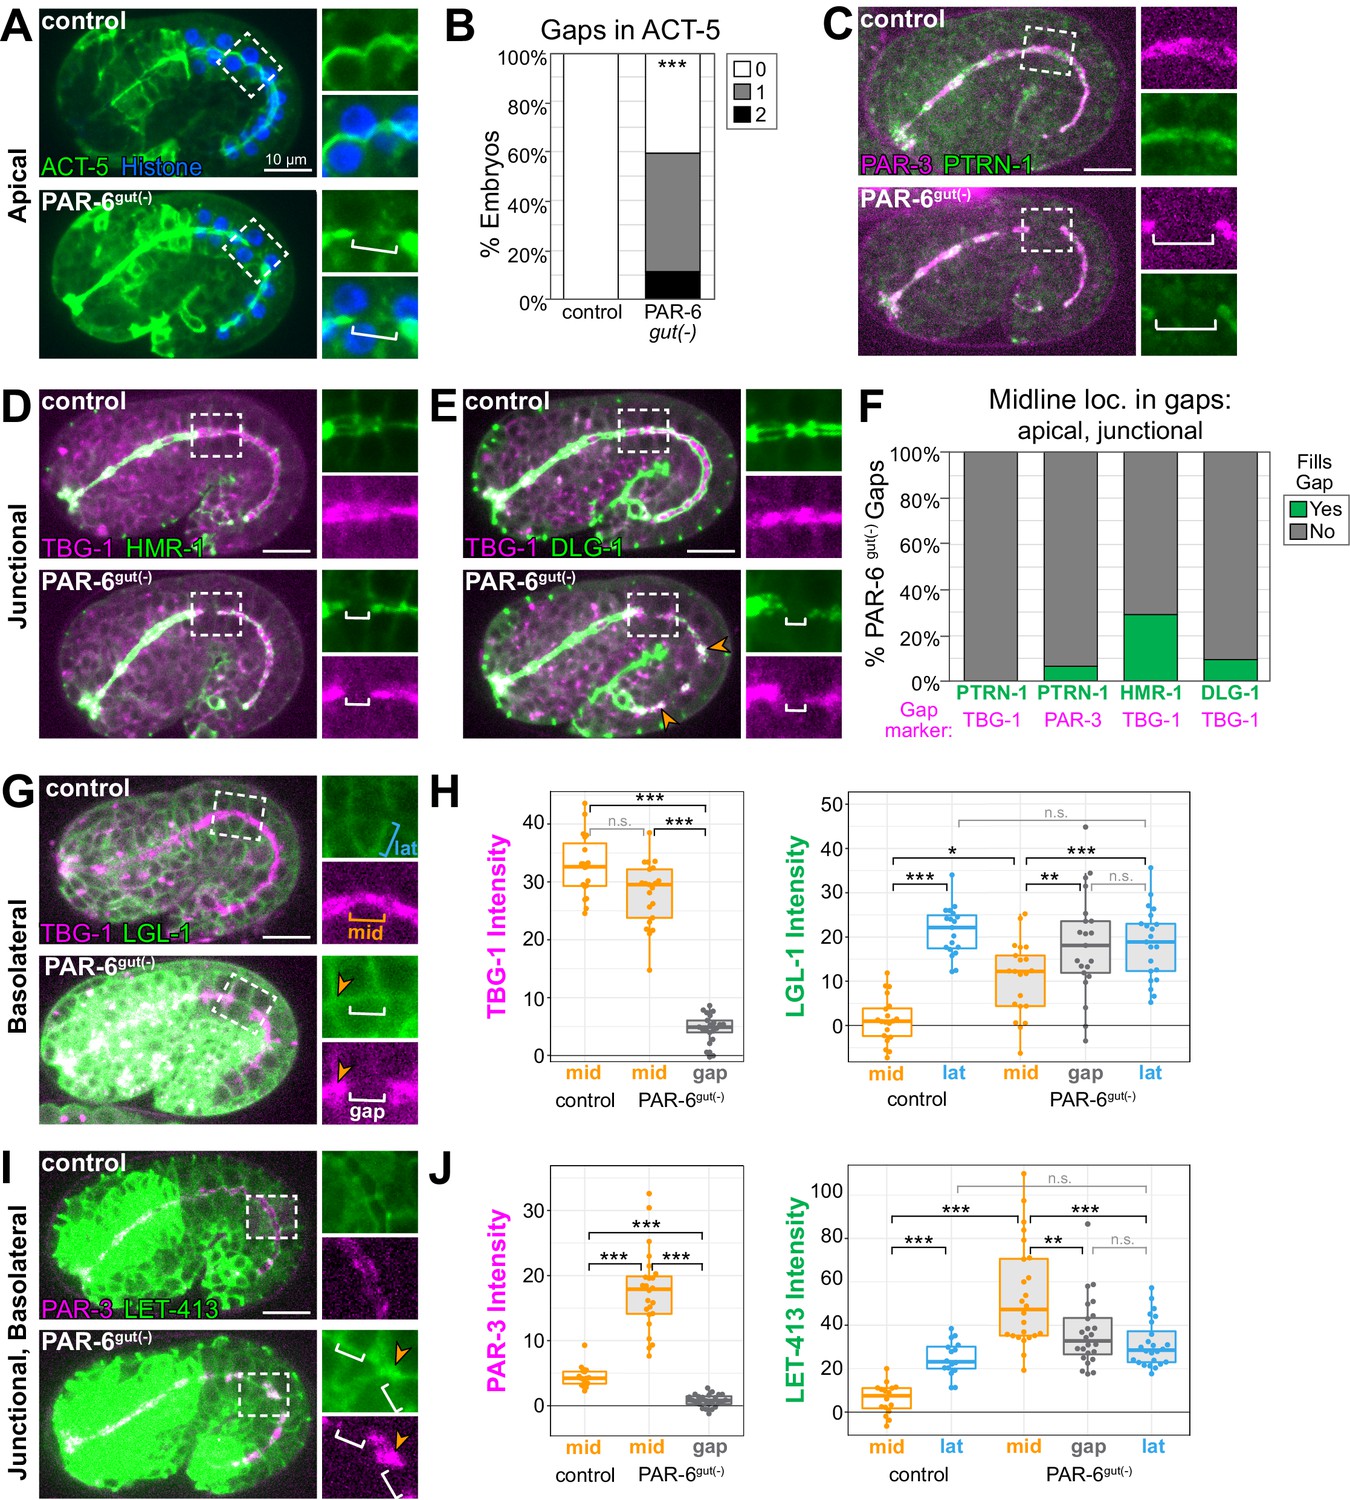
Midline gaps in apical and junction proteins overlap and fail to exclude basolateral proteins in PAR-6gut(-) embryos.
(A, C–E, G, I) Lateral live images of 1.5- to 1.8-fold-stage embryos of indicated genotypes expressing indicated markers. Maximum intensity Z-projections (0.5–3.5 μm) capture the intestinal midline, except LGL-1 which is a single Z-slice, and LET-413, which is a minimum intensity Z-projection (1.5–2 μm). 2× magnified images of boxed region highlighting midline gaps are shown at right. White brackets indicate midline gap. Orange arrowheads indicate colocalization of indicated markers. Note that DLG-1::GFP contrast and brightness in (E) was increased in inset PAR-6gut(-) image to visualize gap. (B) Graph showing percent of embryos with indicated number of YFP::ACT-5 gaps. Control: n = 19 embryos, PAR-6gut(-): n = 27. Statistical analysis: Student’s t-test. Difference from control indicated with asterisks. (F) Graph showing the percent of midline gaps (magenta) in PAR-6gut(-) embryos to which the indicated protein (green) localized. PTRN-1::GFP/TBG-1::mCherry: n = 0/23 gaps, 18 embryos; PTRN-1::GFP/PAR-3::tagRFP: n = 5/86 gaps, 35 embryos; HMR-1::GFP/TBG-1::mCherry: n = 9/31 gaps, 37 embryos; DLG-1::mNG/TBG-1::mCherry: n = 3/31 gaps, 23 embryos. Microtubule-organizing center (MTOC) gaps were not observed in control par-6(+) embryos (n ≥ 15 embryos per genotype). (H, J) Graphs showing signal intensity at lateral surfaces (blue), the apical midline (orange), and at midline gaps (white) in control and PAR-6gut(-) intestines for indicated markers. LGL-1::GFP/TBG-1::mCherry in PAR-6gut(-): n = 16 anterior gaps, 14 embryos; LGL-1/TBG-1 in controls: n = 0 anterior gaps, 19 embryos; LET-413::GFP/PAR-3::tagRFP in PAR-6gut(-): n = 21 anterior gaps, 15 embryos; LET-413/PAR-3 in controls: n = 0 anterior gaps, 19 embryos. Midline gap localization of LET-413 and LGL-1 was scored only for anterior cells (int1-4). Statistical analysis: Student’s t-test with Bonferroni correction. All experiments used ifb-2p::zif-1 to drive E8 onset of degradation except (A) and (B), which used elt-2p::zif-1 to drive degradation at E4. Scale bars = 10 μm. *p<0.05, **p<0.01, ***p<0.001.
Figure 6 with 1 supplement

PAR-6, PKC-3, and CDC-42 are essential in the embryonic intestine for larval viability and intestinal function.
(A) Graph showing the average percent of larvae from three trials that arrested in the L1 stage 72 hr after embryos were laid (see Figure 6—source data 1). Genotypes as indicated. Asterisks mark the PAR-6::ZF::GFP11 allele (see Materials and methods). (B) Graph showing the average percent of L1 larvae from three trials that had the indicated lumen defects in the feeding assay (see Figure 6—source data 2). (C) Cartoon schematic of the larval digestive tract and the path of blue-dyed food in the feeding assay in (D-I’). (D–I’) Color images of L1 larvae of indicated genotypes after 3 hr incubation in blue-dyed food. Arrowheads indicate the positions of first intestinal ring int1 (black), the last ring int9 (white), and the anterior-most luminal obstruction (red). Percentages indicate frequency of continuous lumen (D, G, I), int1 obstruction (E, H, I’), and later more posterior obstruction (F, G’). Color-filled square corresponds with feeding assay defect shown. All experiments used ifb-2p::zif-1 to drive E8 onset of degradation except for PAR-6late gut(-), which used asp-1p::zif-1 to drive 2-fold-stage onset of degradation, and PAR-6E4 gut(-), which used elt-2p::zif-1 to drive E4 onset of degradation.
-
Figure 6—source data 1
Source data for L1 arrest assay in Figures 6 and 7.
Number of larvae arrested at the L1 larval stage after 3 days, with three trials per indicated genotype.
- https://cdn.elifesciences.org/articles/64437/elife-64437-fig6-data1-v2.xlsx
-
Figure 6—source data 2
Source data for Smurf feeding assay in Figures 6 and 7.
Number of larvae with continuously filled lumen or with indicated luminal defect at the L1 larval stage after 3 hr incubation in blue-dyed food, with three trials per indicated genotype.
- https://cdn.elifesciences.org/articles/64437/elife-64437-fig6-data2-v2.xlsx
Figure 6—figure supplement 1
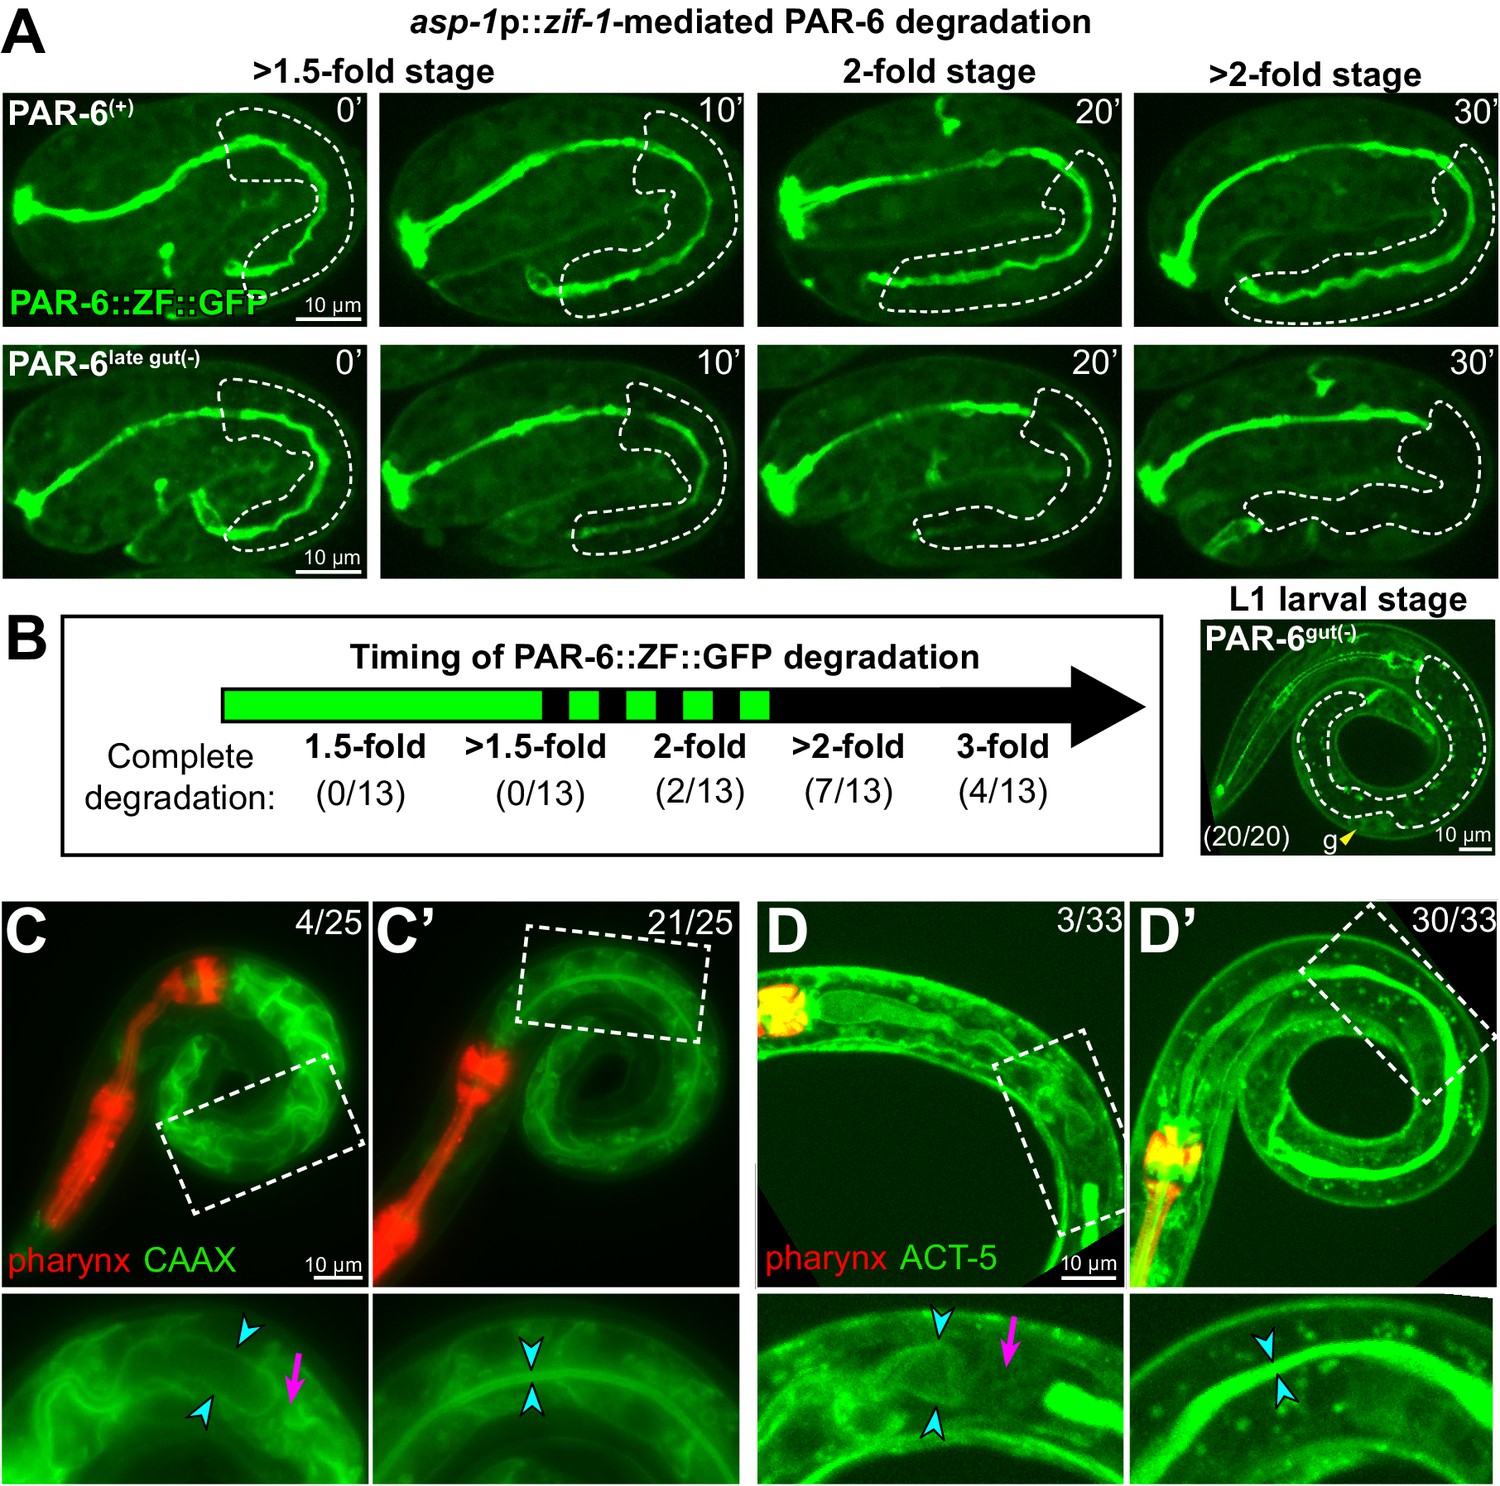
Late degradation of PAR-6 in the embryonic intestine.
(A) Lateral live imaging showing undegraded PAR-6::ZF::GFP (top row, ‘PAR-6+') or onset of PAR-6::ZF::GFP degradation by asp-1p::zif-1 transgene (bottom row, ‘PAR-6late gut(-)') over 30 min. (B) Left: summary of timing of asp-1p::zif-1-mediated degradation and the number of embryo time courses in which complete degradation was observed at the indicated stage. Right: example of L1 larva with complete intestinal PAR-6 degradation. (C-D') Live images of L1 PAR-6late gut(-) larvae with GFP::CAAX-labeled intestinal membranes with (C) and without (C') a luminal constriction, and of L1 PAR-6late gut(-) larvae with YFP::ACT-5-labeled intestinal midlines and mCherry-labeled pharynges with (D) and without (D') a gap in YFP::ACT-5. Maximum intensity Z-projections (0.5–2 μm) capture the intestinal midline, with 2× magnified images of boxed region below. Intestinal lumen (paired cyan arrowheads) and constricted lumens (magenta arrows) are indicated. No GFP::CAAX luminal constrictions (n = 0/23) or gaps in midline YFP::ACT-5 (n = 0/22) were observed in control larvae carrying the asp-1p::zif-1 array and either homozygous (GFP::CAAX control) or heterozygous (YFP::ACT-5 control) for wild-type untagged PAR-6. Scale bars = 10 μm.
Figure 7 with 1 supplement
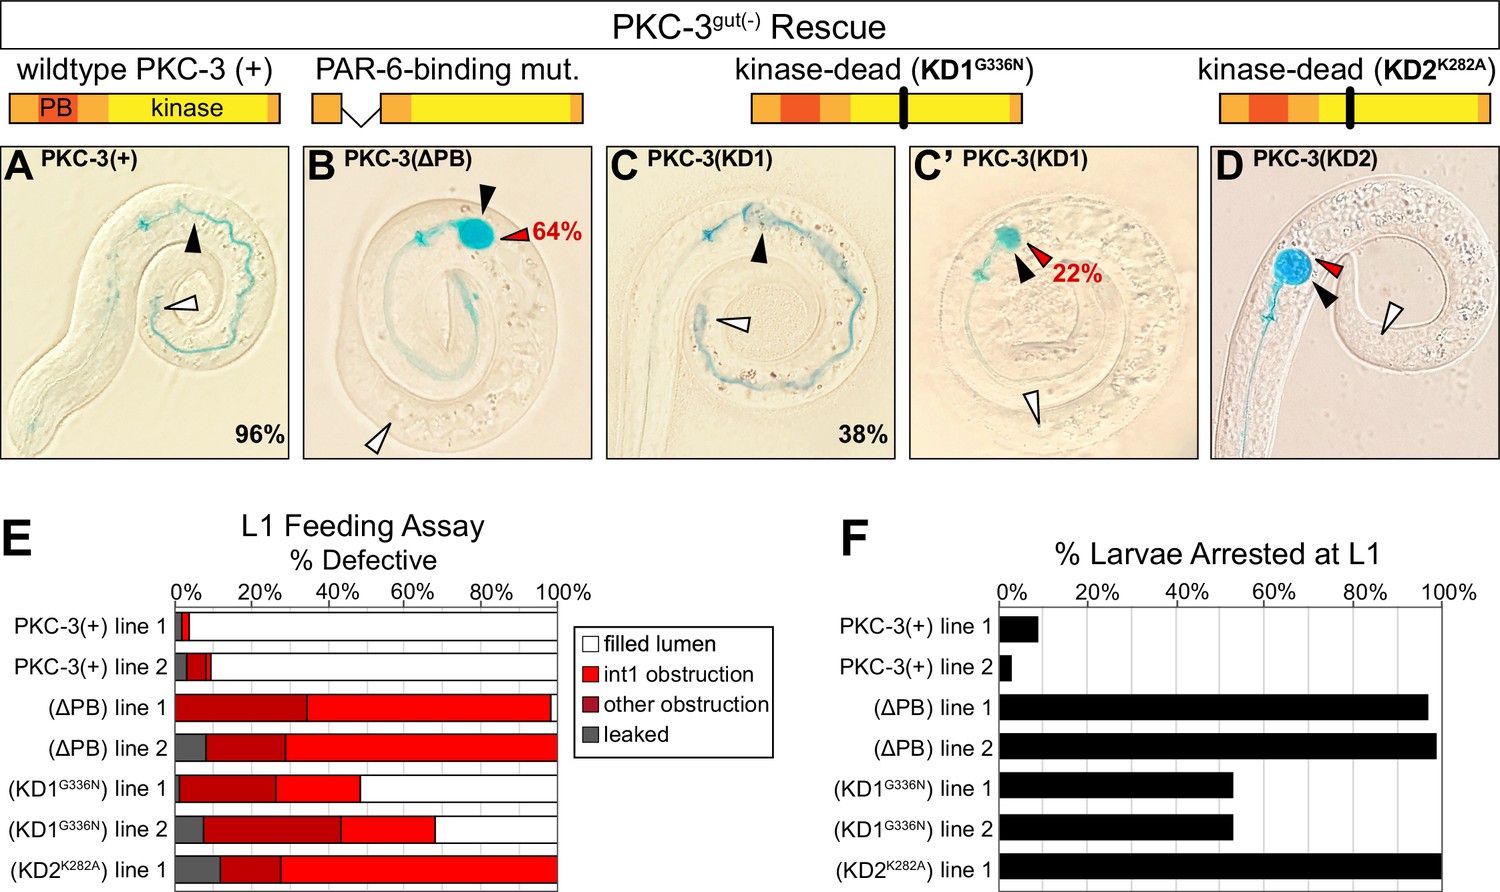
PKC-3 kinase and PAR-6-binding activities are essential in the embryonic intestine for larval viability and intestinal function.
(A–D) Color images of L1 PKC-3gut(-) larvae carrying a wild-type or mutant PKC-3 transgene expressed in the intestine, with cartoon schematics of PKC-3 mutations shown above the corresponding PKC-3gut(-) larvae, after 3 hr incubation in blue-dyed food. Arrowheads indicate the positions of first intestinal ring int1 (black), the last ring int9 (white), and the first luminal obstruction (red). Percentages indicate frequency of continuous lumen (A, C) and int1 obstruction (B, C’, D). (E) Graph showing the average percent of L1 larvae that had defective lumens from three trials of the feeding assay (see Figure 6—source data 2). Each transgenic line was independently isolated. (F) Graph showing the average percent of larvae from three trials that arrested in the L1 stage 72 hr after embryos were laid (see Figure 6—source data 1). All experiments used ifb-2p::zif-1 to drive E8 onset of PKC-3 degradation and elt-2p to drive E4 onset of transgenic intestinal PKC-3 expression.
Figure 7—figure supplement 1
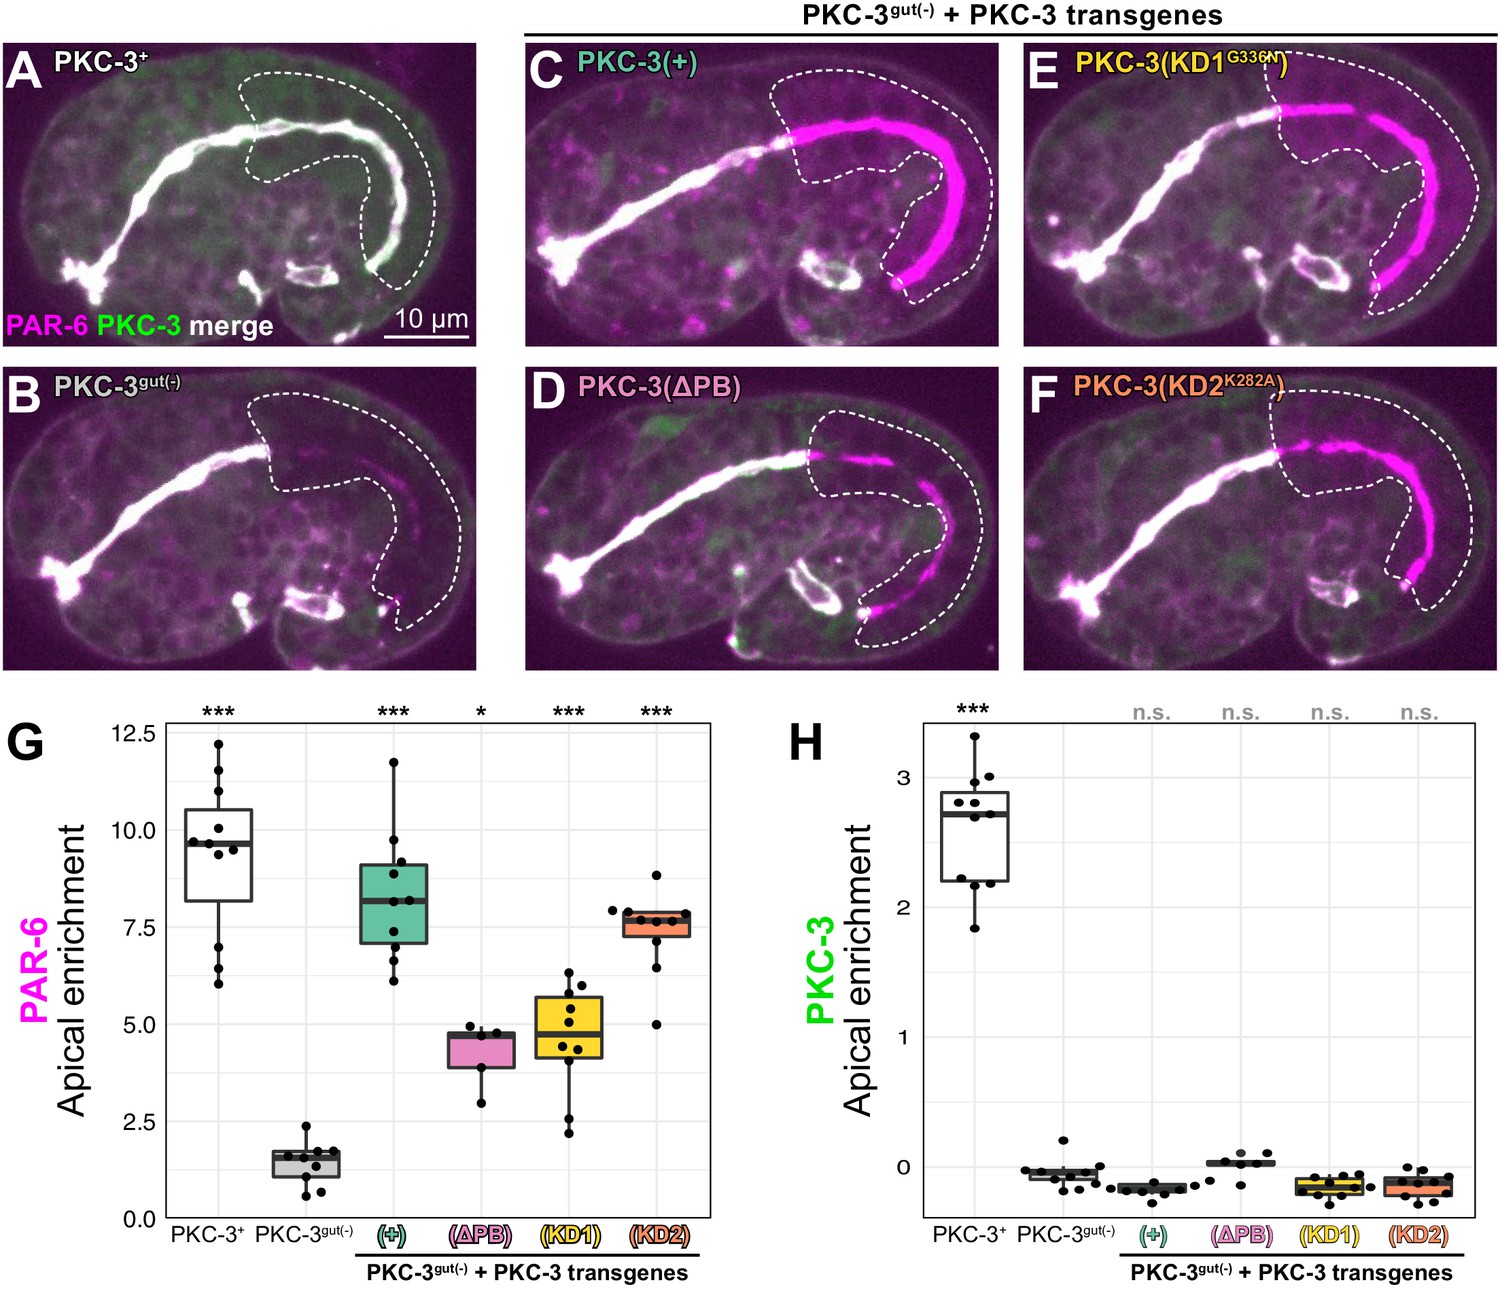
PAR-6 localization in different PKC-3 backgrounds.
(A–F) Lateral images of live 1.5-fold-stage embryos showing PAR-6::tagRFP localization with no ZF::GFP::PKC-3 degradation (A, n = 11); in PKC-3gut(-) (B, n = 9); and in PKC-3gut(-) with an intestine-specific transgene expressing PKC-3(+) (C, n = 10), PKC-3(ΔPB) (D, n = 5), PKC-3(KD1G336N) (E, n = 10), and PKC-3(KD2K282A) (F, n = 10). (G, H) Graphs showing apical enrichment of PAR-6::tagRFP (G) and ZF::GFP::PKC-3 (H) for indicated genotypes. Statistical analysis: ANOVA with Tukey’s post hoc tests. Differences from PKC-3gut(-) indicated with asterisks. *p<0.05, ***p<0.001, n.s. = not significant. All experiments used ifb-2p::zif-1 to drive E8 onset of degradation. Scale bars = 10 μm.
Figure 8
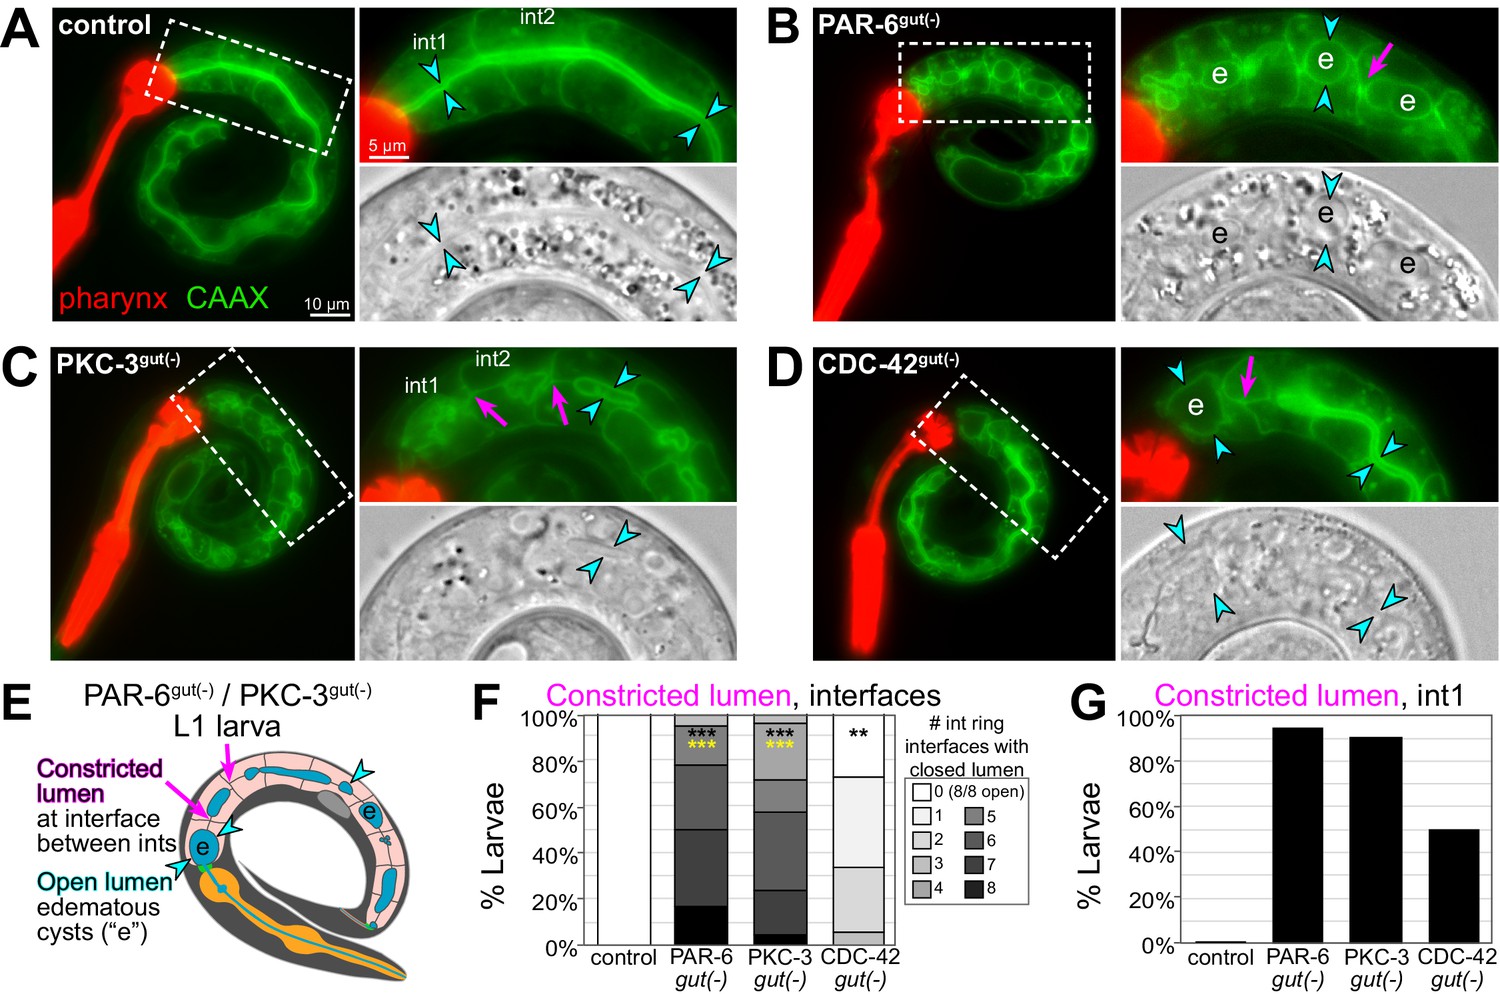
PAR-6, PKC-3, and CDC-42 are essential in the embryonic intestine for larval intestine morphology.
(A–D) Live images of L1 larvae of indicated genotypes with GFP::CAAX-labeled intestinal membranes and mCherry-labeled pharynges. Maximum intensity Z-projections (0–1 μm) capture the intestinal midline. 2× magnified images of boxed region on the right; GFP::CAAX (top) and DIC micrograph (bottom). Intestinal lumen (paired cyan arrowheads), edematous luminal swellings (‘e’), and constricted lumens (magenta arrows) are indicated. (E) Cartoon model of the defects in PAR-6gut(-) and PKC-3gut(-) intestines. (F) Graph showing percent of larvae with the indicated number of int ring interfaces with a constricted lumen (see magenta arrows in E). Control: n = 20, PAR-6gut(-): n = 18, PKC-3gut(-): n = 18, and CDC-42gut(-): n = 21. Statistical analysis: ANOVA with Tukey’s post hoc tests. Differences from control indicated with black asterisks. Differences from CDC-42gut(-) indicated with yellow asterisks. No significant difference between PAR-6gut(-) and PKC-3gut(-). (G) Graph showing percent of larvae from (F) with a constricted lumen in int1. All experiments used ifb-2p::zif-1 to drive E8 onset of degradation. Scale bars = 10 μm in (A–D), and 5 μm in insets. **p<0.01, ***p<0.001.
Figure 9
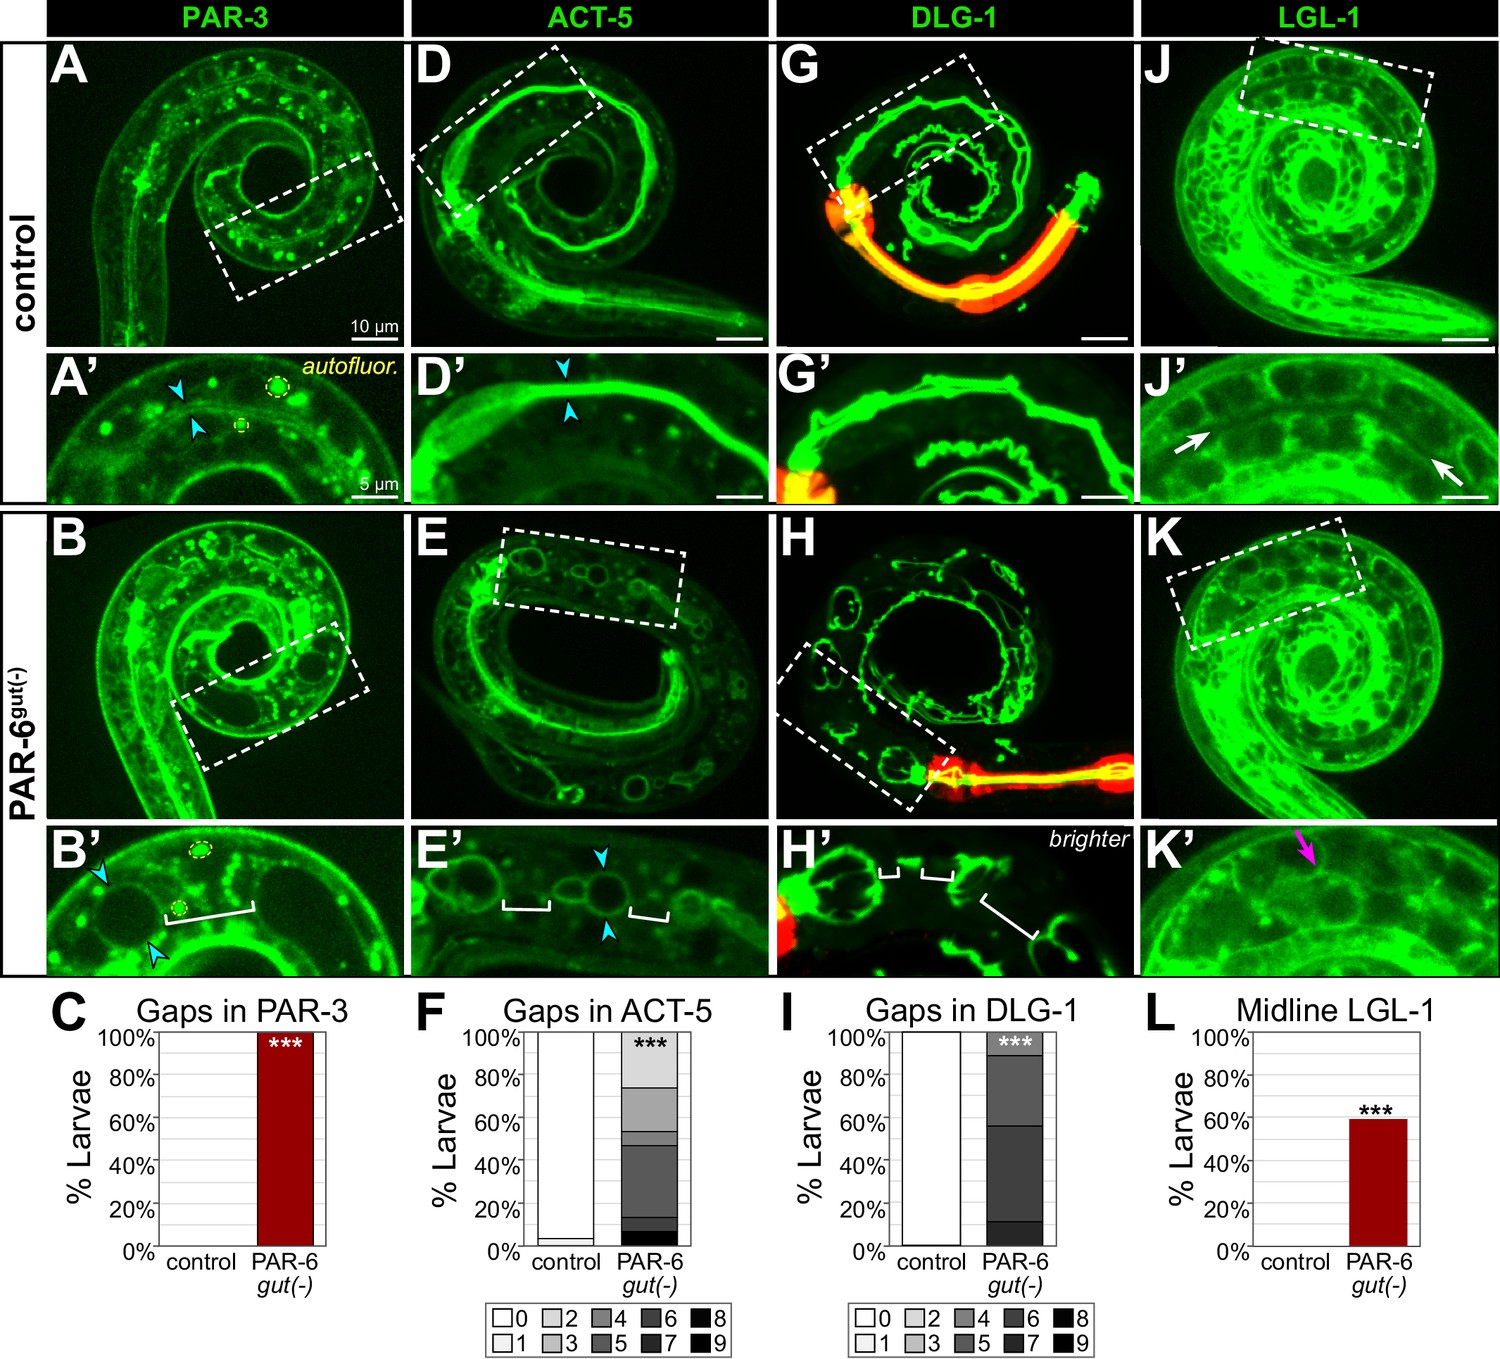
PAR-6gut(-) larval intestines have gaps in apical and junctional proteins and a discontinuous lumen.
(A-L) Live images of L1 control and PAR-6gut(-) larvae expressing the indicated marker (A, B, D, E, G, H, J, K), with 2× magnified images of boxed region below (A', B', D', E', G', H', J', K'), and graphs quantifying luminal localization defects (C, F, I, L). Maximum intensity Z-projections (0–4 µm) capture the intestinal midline for all images except for the minimum intensity projections (2 μm) of LGL-1::GFP that better visualize the absence of apical LGL-1 in control larvae. Open intestinal lumens (cyan arrowheads), gaps in protein localization (brackets), midline protein localization presence (magenta arrows), or absence (white arrows) are indicated. Yellow dashed circles outline examples of the bright autofluorescent puncta from birefringent gut granules. (C) Percent of L1 larvae with any gaps in apical PAR-3::GFP. Control: n = 0/16, PAR-6gut(-): n = 21/21. (F) Percent of L1 larvae with indicated number of gaps in apical YFP::ACT-5. Control: n = 29, PAR-6gut(-): n = 15. (I) Percent of larvae with indicated number of gaps in DLG-1::mNG. Control: n = 23, PAR-6gut(-): n = 18. (L) Percent of L1 larvae with any midline-localized LGL-1::GFP. Control: n = 0/15, PAR-6gut(-): n = 16/27. All experiments used ifb-2p::zif-1 to drive E8 onset of degradation except (D–F), which used elt-2p::zif-1 to drive degradation at E4. Scale bars = 10 μm in main panels and 5 μm in insets. Statistical analyses: Student’s t-test (F, I) and Fisher’s exact test (C, L). ***p<0.001.
Figure 10

Model.
A cartoon model of the role of PAR-6, PKC-3, and CDC-42 in apical and junctional remodeling as C. elegans embryonic intestinal cells divide and elongate to form a functional intestinal tube.
Tables
Key resources table
| Reagent type (species) or resource | Designation | Source or reference | Identifiers | Additional information |
|---|---|---|---|---|
| Strain, strain background (Caenorhabditis elegans) | JLF631 | This paper; Sallee et al., 2018; Asan et al., 2016; Wang et al., 2015 | ltSi569[TBG-1::mCherry]; zif-1(gk117); wowIs3[ifb-2p::zif-1, myo-2p::mCherry] zuIs70[end-1p::GFP::CAAX] | |
| Strain, strain background (C. elegans) | JLF37 | This paper; Sallee et al., 2018 | zuIs278[pie-1p::mCherry::TBA-1]; gip-1(wow5[ZF::GFP::GIP-1]) zif-1(gk117) | |
| Strain, strain background (C. elegans) | JLF83 | This paper; Sallee et al., 2018 | ltSi569; ptrn-1(wow4[PTRN-1::GFP]) | |
| Strain, strain background (C. elegans) | JLF153 | This paper; Sallee et al., 2018 | ltSi569; zif-1(gk117); zyg-9(wow13[ZYG-9::ZF::GFP]) | |
| Strain, strain background (C. elegans) | JJ2376 | CGC, Asako Sugimoto | ddIs6[pie-1p::GFP::TBG-1]; tjIs222[pie-1p::mCherry::AIR-1] | |
| Strain, strain background (C. elegans) | JLF152 | This paper; Sallee et al., 2018 | ltSi569; zif-1(gk117); noca-1(wow11[NOCA-1::ZF::GFP]) | |
| Strain, strain background (C. elegans) | JLF729 | This paper; Sanchez et al., 2020 | ltSi569 vab-10(wow80[VAB-10B::ZF::GFP]); zif-1(gk117) | |
| Strain, strain background (C. elegans) | JLF878 | This paper; Heppert et al., 2018 | ltSi569; zif-1(gk117); wowIs3; dlg-1(cp301[DLG-1::mNeonGreen]) | |
| Strain, strain background (C. elegans) | JLF719 | This paper; Marston et al., 2016 | hmr-1(cp21[HMR-1::GFP]) ltSi569; zif-1(gk117); wowIs3 | |
| Strain, strain background (C. elegans) | JLF442 | This paper; Neukomm et al., 2011 | zuIs278; opIs310[ced-1p::YFP::ACT-5] | |
| Strain, strain background (C. elegans) | JLF148 | This paper; CGC | ltSi569 par-6(it319[PAR-6::GFP]); unc-119(ed3 or +) | |
| Strain, strain background (C. elegans) | JLF149 | This paper; CGC | ltSi569; pkc-3(it309[GFP::PKC-3]); unc-119(ed3) or unc-119(+) | |
| Strain, strain background (C. elegans) | JLF147 | This paper; CGC | ltSi569; par-3(it298[PAR-3::GFP]); unc-119(ed3) or unc-119(+) | |
| Strain, strain background (C. elegans) | JLF440 | This paper | ltSi569; zif-1(gk117); wowIs3; ptrn-1(wow4) | |
| Strain, strain background (C. elegans) | JLF445 | This paper | ltSi569 par-6(wow31[PAR-6::ZF::GFP])/hT2[qIs48]; zif-1(gk117)/hT2; wowIs3; ptrn-1(wow4) | |
| Strain, strain background (C. elegans) | JLF492 | This paper | ltSi569; pkc-3(wow85[ZF::GFP::PKC-3])/mIn1[mIs14]; zif-1(gk117); wowIs3; ptrn-1(wow4) | |
| Strain, strain background (C. elegans) | JLF632 | This paper | ltSi569 par-6(wow31)/hT2[qIs48]; zif-1(gk117)/hT2; wowIs3 zuIs70 | |
| Strain, strain background (C. elegans) | JLF876 | This paper | ltSi569; pkc-3(wow85)/mIn1[mIs14]; zif-1(gk117); wowIs3 zuIs70 | |
| Strain, strain background (C. elegans) | JLF877 | This paper; Zilberman et al., 2017 | ltSi569; cdc-42(xn65[ZF::YFP::CDC-42])/mIn1[mIs14]; zif-1(gk117); wowIs3 zuIs70 | |
| Strain, strain background (C. elegans) | JLF1058 | This paper; Lee et al., 2016 | ltSi569; cdc-25.2(ok597)/oxTi980; zif-1(gk117); wowIs3 zuIs70 | |
| Strain, strain background (C. elegans) | JLF1020 | This paper | ltSi569 par-6(wow31)/hT2[qIs48]; cdc-25.2(ok597)/oxTi980; zif-1(gk117)/hT2; wowIs3 zuIs70 | |
| Strain, strain background (C. elegans) | JLF724 | This paper; CGC | ltSi569 par-6(wow31)/tmC27[unc-75(tmIs1239[myo-2p::Venus])]; wowIs28[elt-2p::zif-1, end-1p::histone::mCherry, myo-2p::mCherry; zif-1(gk117)]; opIs310 | |
| Strain, strain background (C. elegans) | JLF784 | This paper | par-3(wow121[PAR-3::tagRFP]) zif-1(gk117); wowIs3; wow4 | |
| Strain, strain background (C. elegans) | JLF785 | This paper | par-6(wow119[PAR-6::ZF::GFP11])/hT2[qIs48]; zif-1(gk117)/hT2; wowIs3; wow4 | |
| Strain, strain background (C. elegans) | JLF720 | This paper | hmr-1(cp21) ltSi569 par-6(wow31)/hT2[qIs48]; zif-1(gk117)/hT2; wowIs3 | |
| Strain, strain background (C. elegans) | JLF721 | This paper | ltSi569 par-6(wow31)/hT2[qIs48]; zif-1(gk117)/hT2; wowIs3; dlg-1(cp301) | |
| Strain, strain background (C. elegans) | JLF880 | This paper; Beatty et al., 2010 | ltSi569; itIs256[LGL-1::GFP]; zif-1(gk117); wowIs3 | |
| Strain, strain background (C. elegans) | JLF881 | This paper | ltSi569 par-6(wow31)/hT2[qIs48]; itIs256; zif-1(gk117)/hT2; wowIs3 | |
| Strain, strain background (C. elegans) | JLF879 | This paper; Legouis et al., 2000 | LET-413::GFP par-3(wow121[PAR-3::tagRFP]) zif-1(gk117); wowIs3 | |
| Strain, strain background (C. elegans) | JLF817 | This paper | par-6(wow119)/hT2[qIs48]; LET-413::GFP par-3(wow121) zif-1(gk117)/hT2; wowIs3 | |
| Strain, strain background (C. elegans) | JLF204 | This paper | ltSi569; zif-1(gk117); wowIs3 | |
| Strain, strain background (C. elegans) | JLF1056 | This paper | zif-1(gk117); wowEx175[asp-1p::zif-1; myo-2p::mCherry] | |
| Strain, strain background (C. elegans) | JLF212 | This paper | par-6(wow31); zif-1(gk117) | |
| Strain, strain background (C. elegans) | JLF758 | This paper | par-6(wow119); zif-1(gk117) | |
| Strain, strain background (C. elegans) | JLF480 | This paper | pkc-3(wow85); zif-1(gk117) | |
| Strain, strain background (C. elegans) | JLF882 | This paper | cdc-42(xn65); zif-1(gk117) | |
| Strain, strain background (C. elegans) | JLF354 | This paper | ltSi569 par-6(wow31)/hT2[qIs48]; zif-1(gk117)/hT2; wowIs3 | |
| Strain, strain background (C. elegans) | JLF726 | This paper | par-6(wow119)/hT2[qIs48]; zif-1(gk117)/hT2; wowIs3 | |
| Strain, strain background (C. elegans) | JLF491 | This paper | pkc-3(wow85)/mIn1[mIs14]; zif-1(gk117); wowIs3 | |
| Strain, strain background (C. elegans) | JLF883 | This paper | ltSi569; cdc-42(xn65)/mIn1[mIs14]; zif-1(gk117); wowIs3 | |
| Strain, strain background (C. elegans) | JLF1072 | This paper | par-6(wow31)/hT2; zif-1(gk117)/hT2[qIs48]; wowEx175 | |
| Strain, strain background (C. elegans) | JLF1073 | This paper | ltSi569 par-6(wow31)/hT2; zif-1(gk117)/hT2[qIs48]; zuIs70; wowEx175 | |
| Strain, strain background (C. elegans) | JLF866 | This paper | pkc-3(wow85); zif-1(gk117); wowIs3; wowEx143[elt-2p::BFP::PKC-3(+); unc-122p::gfp] ‘line 1’ | |
| Strain, strain background (C. elegans) | JLF867 | This paper | pkc-3(wow85); zif-1(gk117); wowIs3; wowEx144[elt-2p::BFP::PKC-3(+); unc-122p::gfp] ‘line 2’ | |
| Strain, strain background (C. elegans) | JLF870 | This paper | pkc-3(wow85)/mIn1[mIs14]; zif-1(gk117); wowIs3; wowEx150[elt-2p::BFP::PKC-3(ΔPB); unc-122p::gfp] ‘line 1’ | |
| Strain, strain background (C. elegans) | JLF1044 | This paper | pkc-3(wow85)/mIn1[mIs14]; zif-1(gk117); wowIs3; wowEx148[elt-2p::BFP::PKC-3(ΔPB); unc-122p::gfp] ‘line 2’ | |
| Strain, strain background (C. elegans) | JLF868 | This paper | pkc-3(wow85)/mIn1[mIs14]; zif-1(gk117); wowIs3; wowEx146[elt-2p::BFP::PKC-3(G336N); unc-122p::gfp] ‘line 1’ | |
| Strain, strain background (C. elegans) | JLF869 | This paper | pkc-3(wow85)/mIn1[mIs14]; zif-1(gk117); wowIs3; wowEx147[elt-2p::BFP::PKC-3(G336N); unc-122p::gfp] ‘line 2’ | |
| Strain, strain background (C. elegans) | JLF1074 | This paper | pkc-3(wow85)/mIn1[mIs14]; zif-1(gk117); wowIs3; wowEx184[elt-2p::BFP::PKC-3(K282A); unc-122p::gfp] ‘line 1’ | |
| Strain, strain background (C. elegans) | JLF895 | This paper | ltSi569; par-3(wow120[PAR-3::GFP]) zif-1(gk117); wowIs3 | |
| Strain, strain background (C. elegans) | JLF884 | This paper | ltSi569 par-6(wow31)/hT2[qIs48]; par-3(wow120) zif-1(gk117)/hT2; wowIs3 | |
| Strain, strain background (C. elegans) | JLF885 | This paper | ltSi569; pkc-3(wow85)/mIn1[mIs14]; zif-1(gk117); wowIs3 | |
| Strain, strain background (C. elegans) | JLF877 | This paper | ltSi569; cdc-42(xn65)/mIn1[mIs14]; zif-1(gk117); wowIs3 | |
| Strain, strain background (C. elegans) | JLF1075 | This paper | zif-1(gk117); zuIs70; wowEx175 | |
| Strain, strain background (C. elegans) | JLF1088 | This paper | ltSi569 par-6(wow31)/hT2[qIs48]; zif-1(gk117)/hT2; opIs310; wowEx175 | |
| Strain, strain background (C. elegans) | JLF1076 | This paper | par-6(wow159[PAR-6::RFP]); pkc-3(wow85); zif-1(gk117) | |
| Strain, strain background (C. elegans) | JLF1077 | This paper | par-6(wow159); pkc-3(wow85)/mIn1[mIs14]; zif-1(gk117); wowIs3; wowEx143[PKC-3(+)] | |
| Strain, strain background (C. elegans) | JLF1078 | This paper | par-6(wow159); pkc-3(wow85)/mIn1[mIs14]; zif-1(gk117); wowIs3; wowEx148[ΔPB] | |
| Strain, strain background (C. elegans) | JLF1079 | This paper | par-6(wow159); pkc-3(wow85)/mIn1[mIs14]; zif-1(gk117); wowIs3; wowEx146[PKC-3(G336N)] | |
| Strain, strain background (C. elegans) | JLF1080 | This paper | par-6(wow159); pkc-3(wow85)/mIn1[mIs14]; zif-1(gk117); wowIs3; wowEx184[PKC-3(K282A)] | |
| Recombinant DNA reagent | Plasmid: pDD162 | Addgene | Cas9 + sgRNA plasmid template | |
| Recombinant DNA reagent | Plasmid: pJF250 | Sallee et al., 2018 | ZF::GFP SEC plasmid template | |
| Recombinant DNA reagent | Plasmid: pLC01 | Lauren Cote | ZF::GFP(11) SEC plasmid template | |
| Recombinant DNA reagent | Plasmid: pAL29 | Alex Lessenger, James McGhee | asp-1p::zif-1 gDNA | |
| Recombinant DNA reagent | Plasmid: pCFJ90 | Addgene | myo-2p::mCherry | |
| Recombinant DNA reagent | Plasmid: pMS252 | This paper | elt-2p::bfp::pkc-3(+) gDNA | |
| Sequence-based reagent | oligo: oMS-201-F | This paper | AGCTCGGACACAAGCTCAACagcgctTCGTCTCCGACATCATTAGAGGAG | pkc-3gDNA Fwd with BFP overlap |
| Sequence-based reagent | oligo: oMS202-R | This paper | atgttgaagagtaattggacTCAGACTGAATCTTCCCGACTCATTTG | pkc-3gDNA Rev with unc-54 overlap |
| Recombinant DNA reagent | Plasmid: pMS259 | This paper | elt-2p::bfp::pkc-3[G336N] gDNA | |
| Sequence-based reagent | oligo: oMS-235-F | This paper | ATTCGTTCCTaatGGTGATCTGATG | pkc-3(G336N) Fwd |
| Sequence-based reagent | oligo: oMS-236-R | This paper | TCGATGACAAAGAACAGG | pkc-3(G336N) Rev |
| Recombinant DNA reagent | Plasmid: pMS264 | This paper | elt-2p::bfp::pkc-3[K282A] gDNA | |
| Sequence-based reagent | oligo: oMP215 | This paper | CGCGATAgcAATTATCAAAAA | PKC-3(K282A) Fwd |
| Sequence-based reagent | oligo: oMP216 | This paper | TAAATTTGACGAGTTGAAACATG | PKC-3(K282A) Rev |
| Recombinant DNA reagent | Plasmid: pMS260 | This paper | elt-2p::bfp::pkc-3[deltaPB] gDNA | |
| Sequence-based reagent | oligo: oMP213 | This paper | AAACCAGAGCTGCCCGGG | PKC-3(delta PB) Fwd |
| Sequence-based reagent | oligo: oMP214 | This paper | AGCGCTGTTGAGCTTGTGTC | PKC-3(delta PB) Rev |
| Other | CRISPR Allele DNA reagents: see Supplementary file 1 |
Additional files
-
Supplementary file 1
CRISPR allele primers and plasmids.
- https://cdn.elifesciences.org/articles/64437/elife-64437-supp1-v2.xlsx
-
Transparent reporting form
- https://cdn.elifesciences.org/articles/64437/elife-64437-transrepform-v2.pdf
Download links
A two-part list of links to download the article, or parts of the article, in various formats.
Downloads (link to download the article as PDF)
Open citations (links to open the citations from this article in various online reference manager services)
Cite this article (links to download the citations from this article in formats compatible with various reference manager tools)
Apical PAR complex proteins protect against programmed epithelial assaults to create a continuous and functional intestinal lumen
eLife 10:e64437.
https://doi.org/10.7554/eLife.64437


