Receptor-mediated mitophagy regulates EPO production and protects against renal anemia
- State Key Laboratory of Medicinal Chemical Biology, Frontiers Science Center for Cell Responses, Tianjin Key Laboratory of Protein Science, College of Life Sciences, Nankai University, China
- State Key Laboratory of Experimental Hematology, National Clinical Research Center for Blood Diseases, Institute of Hematology & Blood Diseases Hospital, Chinese Academy of Medical Sciences & Peking Union Medical College, China
Figures
Figure 1 with 2 supplements
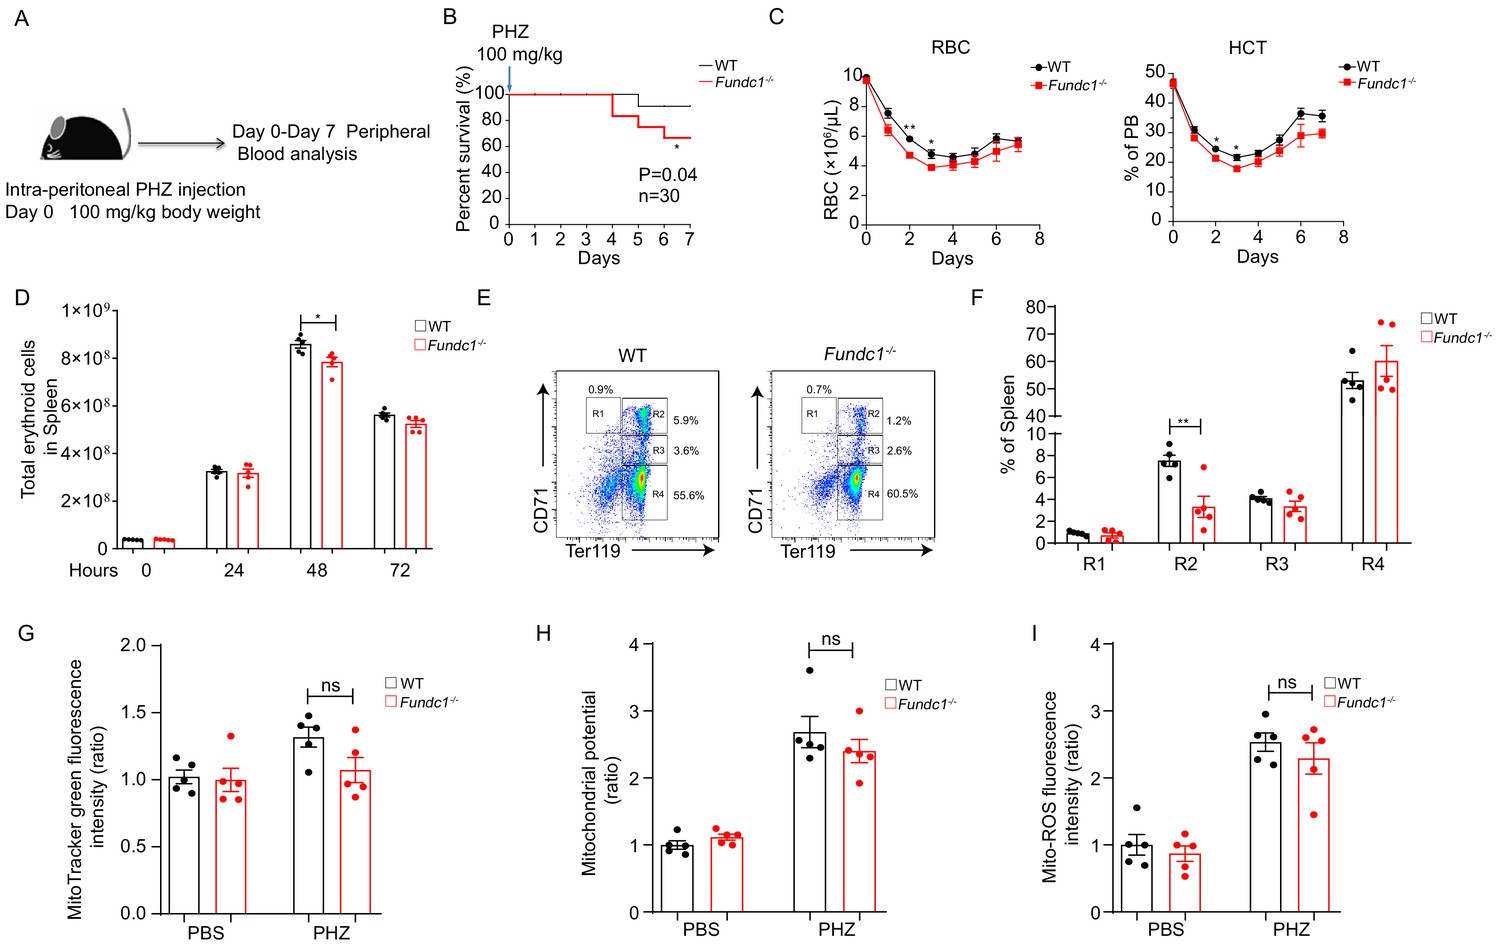
Defects of splenic erythroid progenitor production in Fundc1-/- mice during stress erythropoiesis.
(A) Schematic diagram of PHZ-induced stress erythropoiesis. Mice around 8–10 weeks old were treated with a single dose of PHZ (100 mg/kg body weight) to induce acute anemia, and multiple examinations were taken in the following week. (B) Survival curves of PHZ- treated WT control littermates and Fundc1-/- mice (n = 30 for each group). (C) Hemogram parameters of red blood cell (RBC) counts and hematocrit (HCT) in the peripheral blood of WT controls and Fundc1-/- mice from day 0 to 7 after PHZ treatment. (D) Total erythroid cell number in spleen of WT and Fundc1-/- mice at 0, 24, 48, and 72 hr after PHZ treatment, respectively. (E, F) Flow cytometry analysis of erythroid differentiation with using CD71 and Ter119 from the spleen of WT and Fundc1-/- mice after 48 hr of PHZ treatment. The representative flow cytometry diagram (E) and the corresponding quantitative analysis (F) are shown. (G–I) The bar graphs showing the normalized intensity of fluorescence by using flow cytometry of mitochondrial mass assayed by MitoTracker Green (G), membrane potential by TMRM (H) and ROS level by MitoSOX (I) within splenic R2 erythroid cells of WT or Fundc1-/- mice after 48 hr of PHZ treatment, respectively. PBS acts as the control group for PHZ treatment. For each experiment (C–I), n = 3–5 mice for each group. Individual mice are represented by symbols. Data shown are representative of at least three independent experiments. Similar results were found in each experiment. All data are mean ± SEM; *p<0.05, **p<0.01. Statistical significance was analyzed by using the two-tailed unpaired Student’s t-test.
-
Figure 1—source data 1
Erythroid progenitor production during stress erythropoiesis.
- https://cdn.elifesciences.org/articles/64480/elife-64480-fig1-data1-v2.xlsx
Figure 1—figure supplement 1
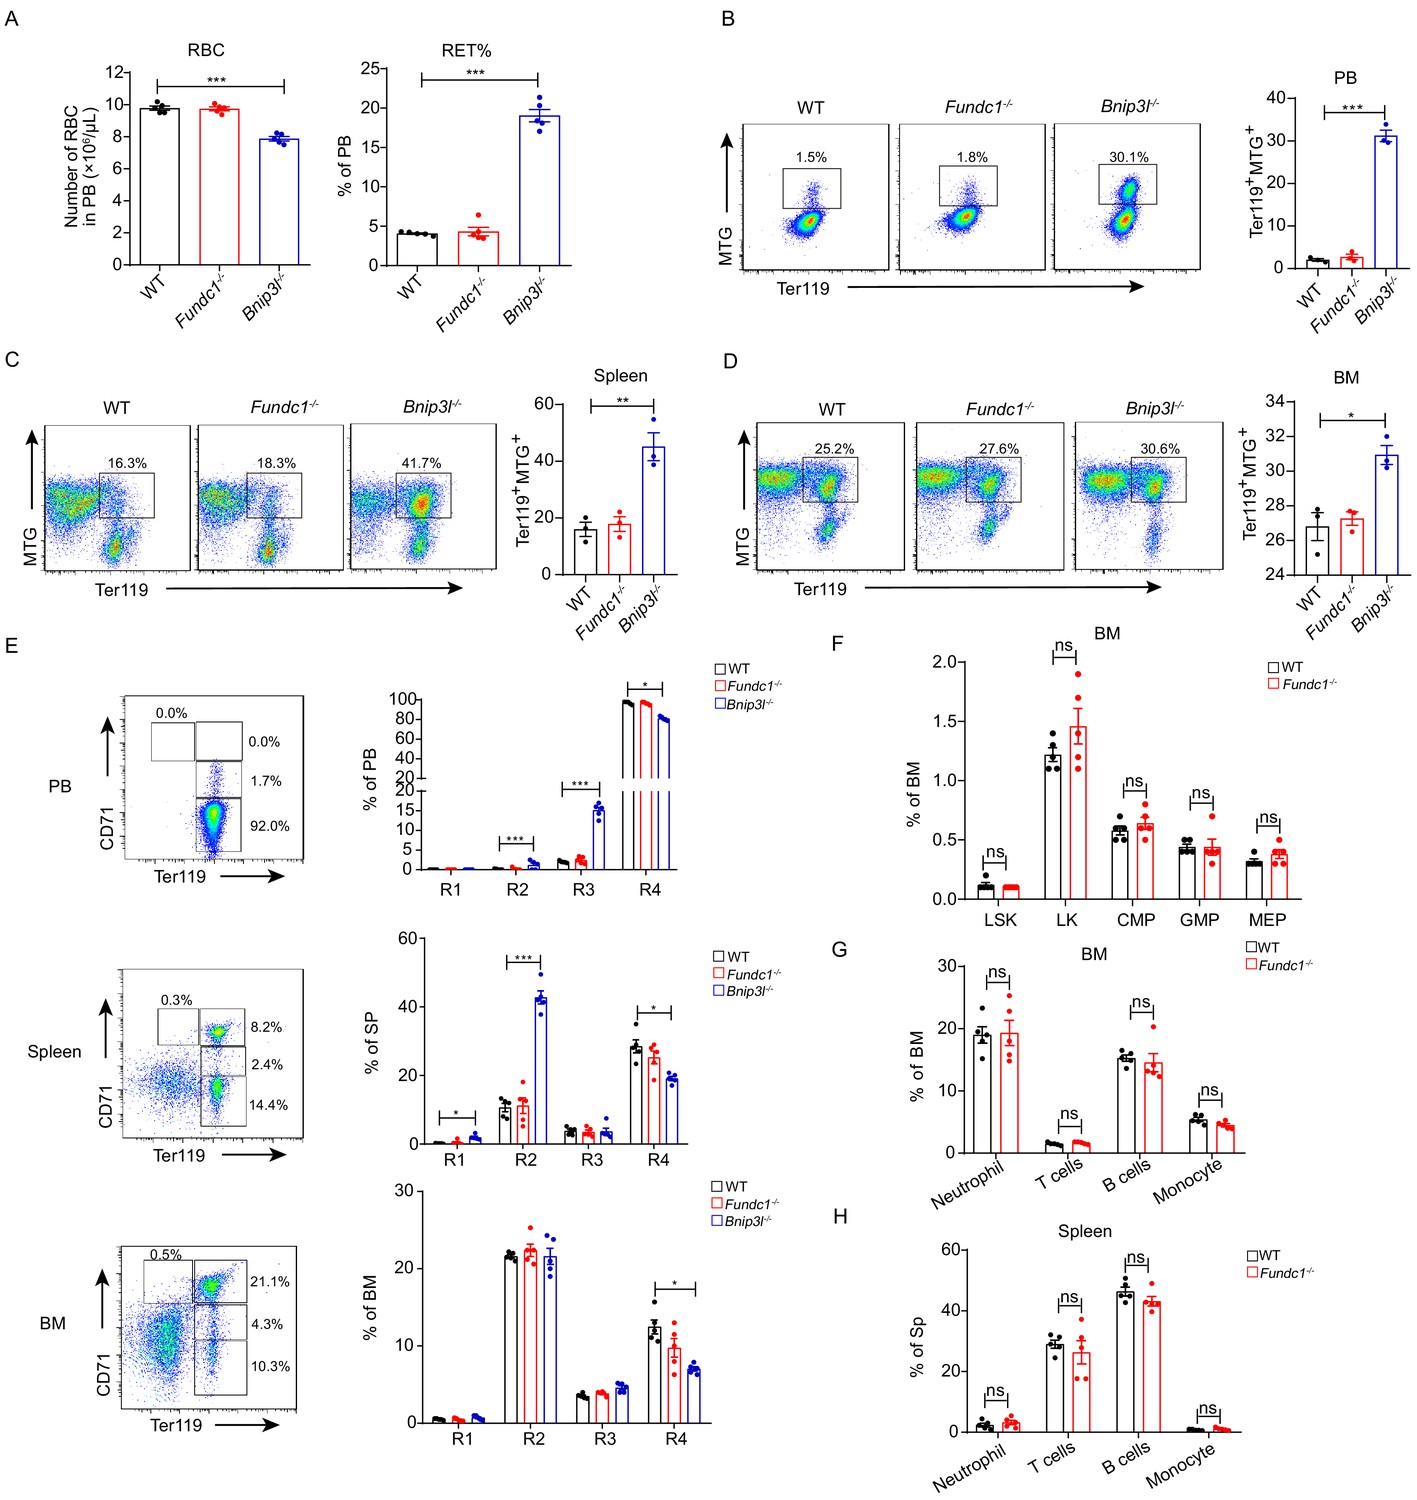
Steady-state hematopoiesis and erythropoiesis in Fundc1-/- mice.
(A) The red cell mass and the proportion of reticulocytes in peripheral blood of WT, Fundc1-/- and Bnip3l-/- mice. Bnip3l-/- mice were used as a positive control. (B–D) Mitochondrial mass was assayed by using MitoTracker Green in the Ter119+ erythroid subset from the peripheral blood (B), spleen (C), and bone marrow (D) of WT, Fundc1-/-, and Bnip3l-/- mice by using flow cytometry, respectively. (E) The erythroid differentiation was monitored using markers of CD71 and Ter119 in peripheral blood, spleen and bone marrow of WT, Fundc1-/-, and Bnip3l-/- mice by using flow cytometry. Bnip3l-/- mice were used as a positive control. (F) The frequency of hematopoietic stem and progenitor cells in bone marrow of WT and Fundc1-/- mice. Hematopoietic stem and progenitor cells were labeled as LSK (Lin-Sca1+c-Kit+) and LK (Lin-c-Kit+); CMP (Lin-c-Kit+CD34+CD16/32-) for common myeloid progenitors; GMP (Lin-c-Kit+CD34+CD16/32+) for granulocyte-macrophage progenitors; and MEP (Lin-c-Kit+CD34-CD16/32-) for the megakaryocyte-erythroid progenitors. (G, H) The frequency of other non-erythroid lineage cells in bone marrow (G) and spleen (H) of WT and Fundc1-/- mice. Neutrophil (Gr1+); T cells (CD3+); B cells (B220+); and monocytes (F4/80+). For each experiment, n = 3–5 mice for each group. Individual mice are represented by symbols. Data shown are representative of at least three independent experiments. Similar results were found in each experiment. All data are mean ± SEM; *p<0.05, **p<0.01, ***p<0.001. Statistical significance was analyzed by using the two-tailed unpaired Student’s t-test.
-
Figure 1—figure supplement 1—source data 1
List of steady-state hematopoiesis and erythropoiesis in WT, Fundc1-/- and Bnip3l-/- mice.
- https://cdn.elifesciences.org/articles/64480/elife-64480-fig1-figsupp1-data1-v2.xlsx
Figure 1—figure supplement 2
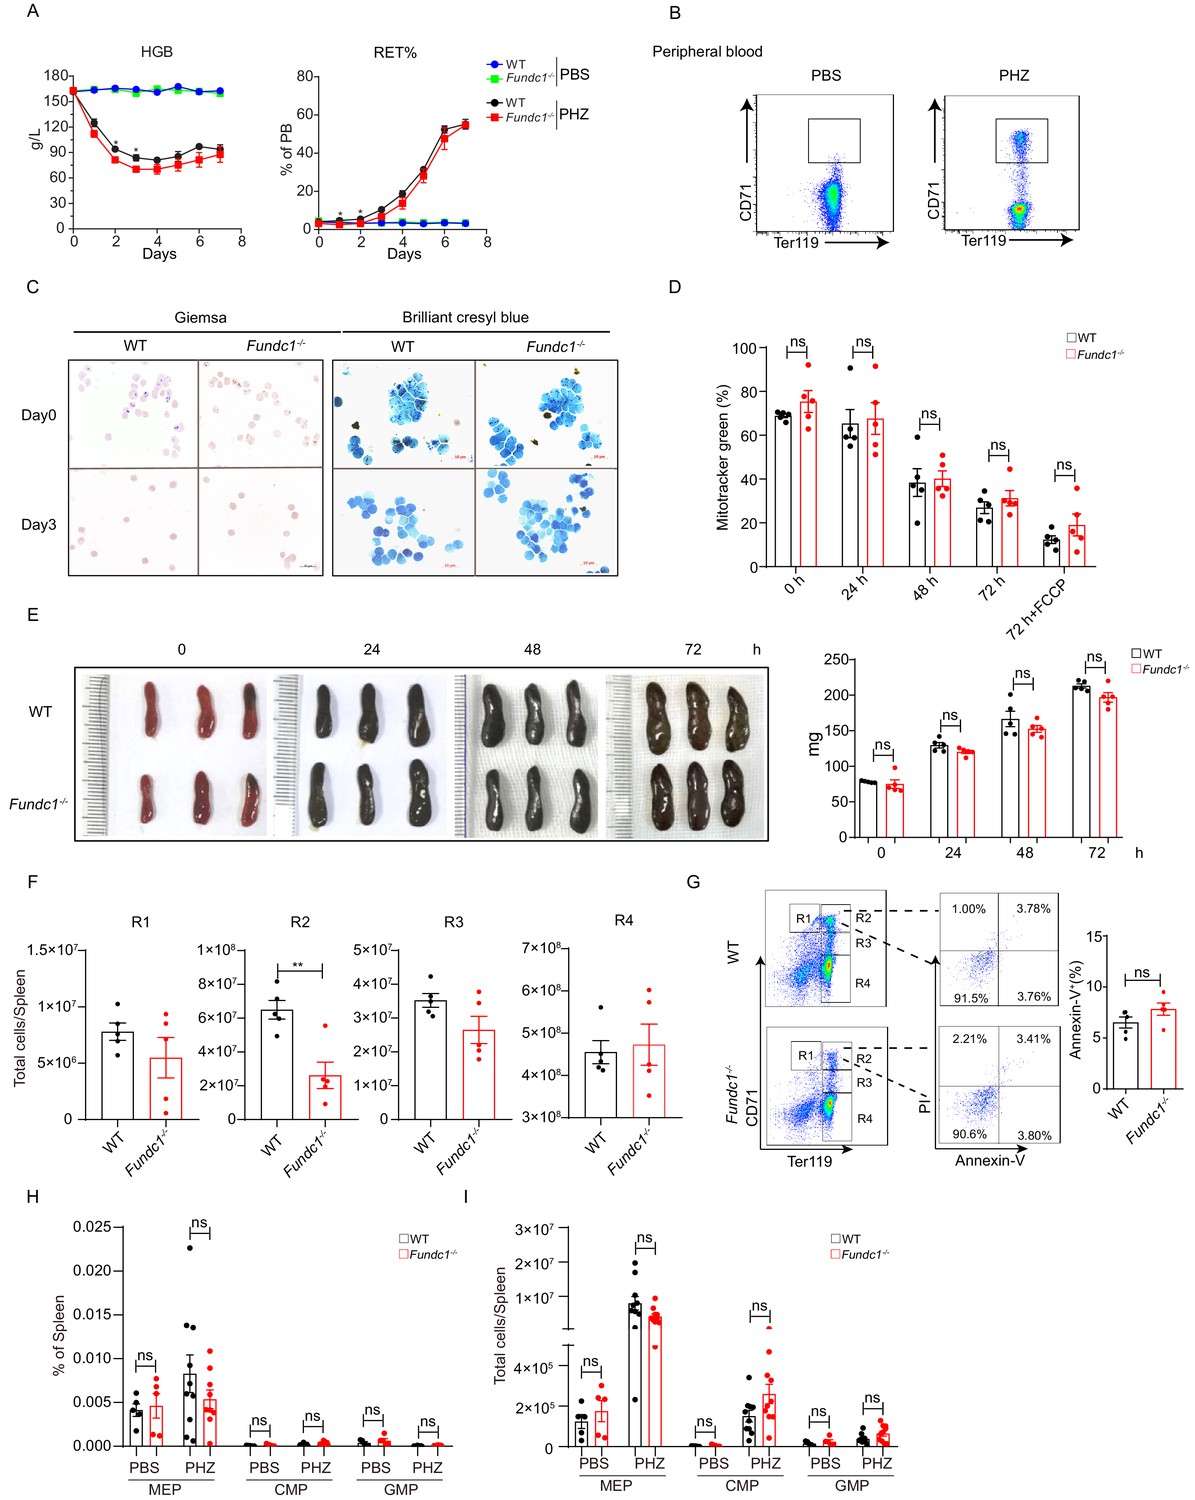
FUNDC1-mediated mitophagy is dispensable for reticulocyte maturation under stress erythropoiesis.
(A) HGB and percentage of reticulocytes in the peripheral blood of WT controls and Fundc1-/- mice from day 0 to 7 after PBS or PHZ treatment. (B) FACS plots showing the sorting strategy for the isolation of reticulocytes (CD71+Ter119+) from peripheral blood of WT and Fundc1-/- mice after 5 days of PHZ treatment. (C) Giemsa and Brilliant Cresyl blue staining of the reticulocytes before and after 3 days of in vitro culture. The reticulocytes were isolated from WT and Fundc1-/- mice after 5 days of PHZ treatment. Scale bars, 10 μm; (D) Quantification of the mitochondrial content by using MitoTracker Green (MTG) staining in reticulocytes after 3 days of in vitro culture collected from PHZ-treated WT and Fundc1-/- mice. FCCP, carbonyl cyanide p-(tri-fluromethoxy) phenyl-hydrazone, is a potent uncoupler of oxidative phosphorylation in mitochondria. (E) The morphology of spleen (left) and the weight of spleen (right) of PHZ-treated WT and Fundc1-/- mice at the indicated time points. (F) The numbers of erythroid cells in R1, R2, R3, and R4 in spleen of WT and Fundc1-/- mice after 48 hr of PHZ treatment, respectively. (G) The apoptosis rate of R2 cells examined using Annexin V and PI with flow cytometry after 48 hr of PHZ treatment. The left are the representative flow cytometry plots, and the right bar graphs are the quantification. (H) The frequency of hematopoietic progenitors of CMP, MEP and GMP in spleen of WT and Fundc1-/- mice at 48 hr treated with PBS or PHZ. (I) The cell number of hematopoietic progenitors of CMP, MEP and GMP in spleen of WT and Fundc1-/- mice at 48 hr treated with PBS or PHZ. For each experiment, n = 3–5 mice for each group. Individual mice are represented by symbols. Data shown are representative of at least three independent experiments. Similar results were found in each experiment. All data are mean ± SEM; *p<0.05, **p<0.01, ns denotes no statistical significance. Statistical significance was analyzed by using the two-tailed unpaired Student’s t-test.
-
Figure 1—figure supplement 2—source data 1
Reticulocyte maturation of WT and Fundc1-/- mice.
- https://cdn.elifesciences.org/articles/64480/elife-64480-fig1-figsupp2-data1-v2.xlsx
Figure 2 with 1 supplement
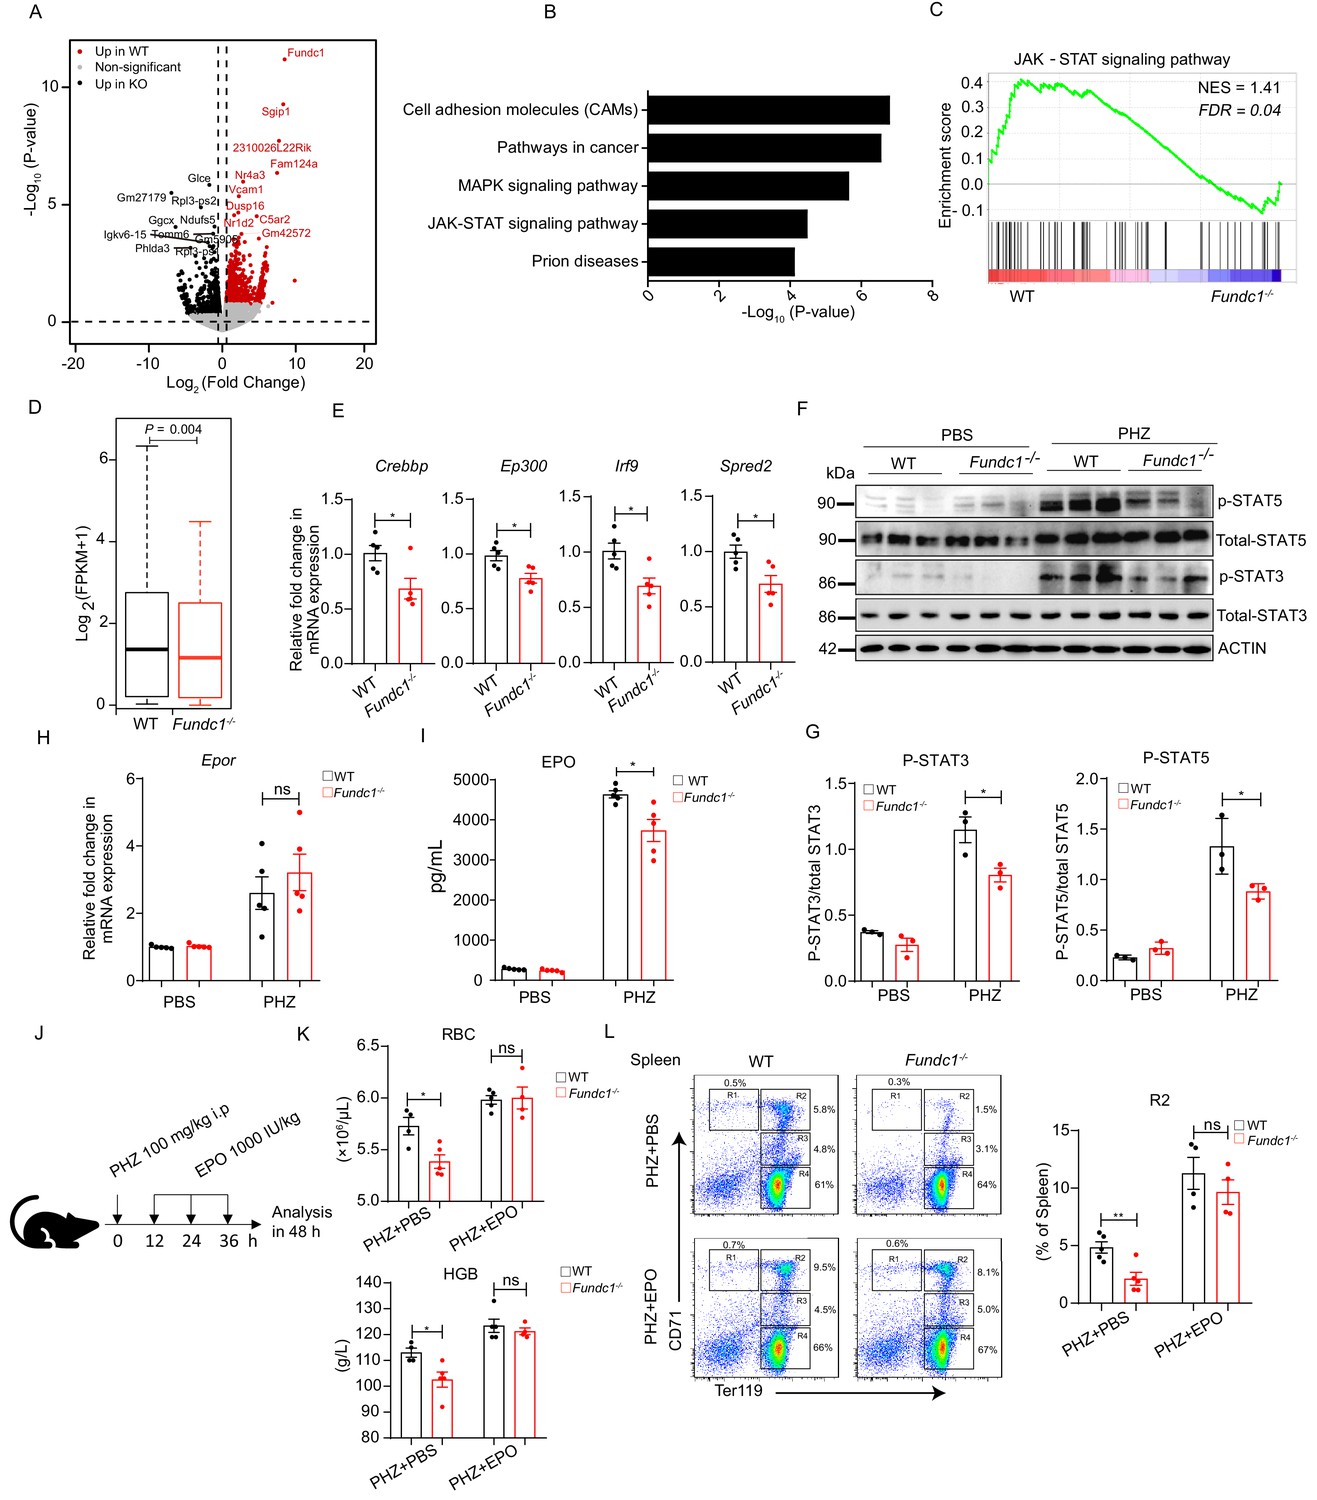
Hypoactivation of JAK-STAT signaling underlies the comprised erythroid progenitor production in Fundc1-/- mice during stress erythropoiesis.
(A) Volcano Plot illustrates the differentially expressed genes (DEGs) of FACS-purified erythroid progenitors (R2 populations) in WT (n = 3) and Fundc1-/- (n = 3) spleen at 48 hr after PHZ treatment. Top 10 genes in each group were labeled. (B) Top 5 KEGG functional enrichment pathways analysis of downregulated DEGs in Fundc1-/- R2 cells. (C) GSEA showing the enrichment of the JAK-STAT signaling pathway in splenic R2 cells from WT and Fundc1-/- mice. Normalized enrichment score (NES) and false discovery rate (FDR) are shown. (D) The box plot depicts the quantitative analysis of the genes in JAK-STAT signaling pathway in splenic R2 cells of WT and Fundc1-/- mice. The boxes represent the median and quartile of the sum of log2 transformed (FPKM +1). p-value was determined by using paired Wilcoxon signed-rank Test. (E) The expression of key components in the JAK-STAT pathway in splenic R2 cells from WT and Fundc1-/- mice. (F) Western blotting of STAT3, STAT5 and phosphorylated STAT3 and STAT5 in FACS-sorted R2 populations in spleen of WT and Fundc1-/- mice after 48 hr of PBS or PHZ treatment, respectively. ACTIN was used as a loading control. n = 3. (G) The quantification of the signal intensity of phosphorylated STAT3 and STAT5 out of the total STAT3 and STAT5 in (F). (H) The expression of Epor mRNA in the spleen of WT and Fundc1-/- mice after 48 hr of PBS or PHZ treatment. (I) The serum EPO concentration in Fundc1-/- and WT mice after 48 hr of PBS or PHZ treatment. (J) Schematic illustrating the administration of EPO to PHZ-Fundc1-/- and PHZ-WT mice. (K) RBC number (upper) and HGB level (bottom) after EPO supplement in PHZ-Fundc1-/- and PHZ-WT mice. (L) Erythroid differentiation in spleen of PHZ-Fundc1-/- and PHZ-WT after EPO administration. The left panel shows representative FACS plots and right bar graph shows the statistical quantification of the percentage of the R2 compartment. For each experiment (E–L), n = 3–5 mice for each group. Individual mice are represented by symbols. Data shown are representative of at least three independent experiments. Similar results were found in each experiment. All data are mean ± SEM; *: p<0.05; ns: no statistical significance. Statistical significance was analyzed by using the two-tailed unpaired Student’s t-test unless stated otherwise.
-
Figure 2—source data 1
The JAK-STAT signaling in WT and Fundc1-/- mice during stress erythropoiesis.
- https://cdn.elifesciences.org/articles/64480/elife-64480-fig2-data1-v2.xlsx
Figure 2—figure supplement 1
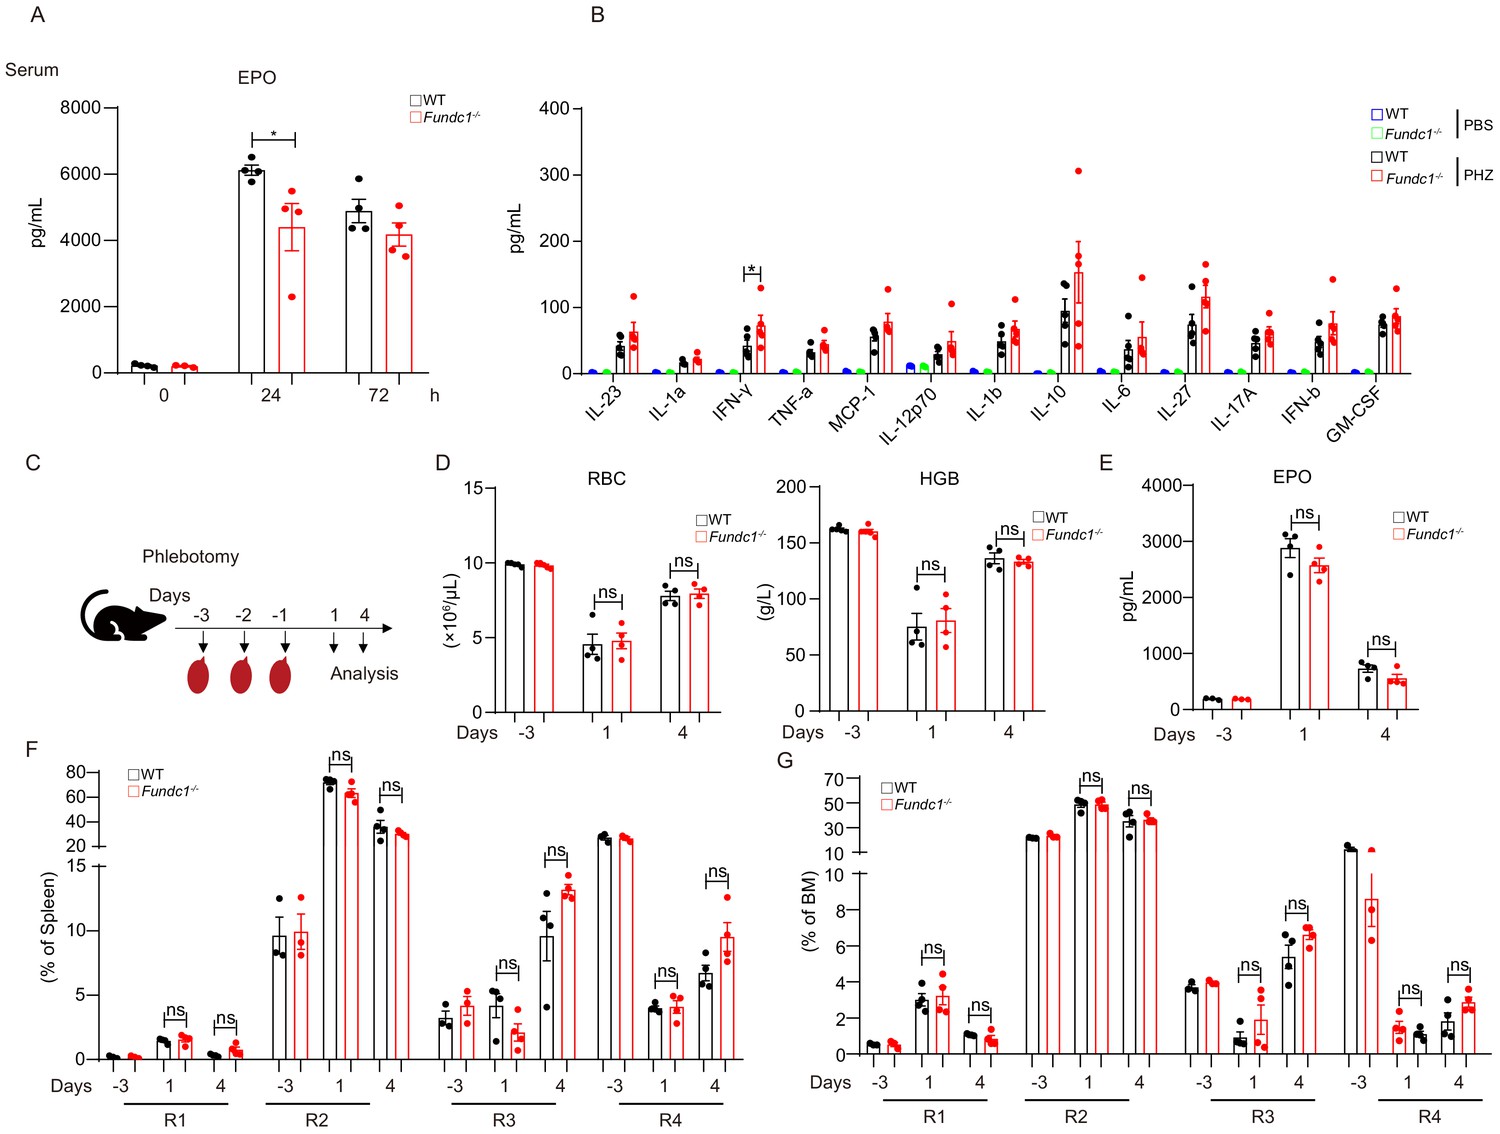
Fundc1-/- mice resembles WT mice upon phlebotomy.
(A) The serum EPO at different time points after PHZ treatment. (B) Inflammation cytokines were tested by using Mouse Inflammation Panel (13-plex) with V-bottom Plate. (C) Schematic diagram showing the strategy for phlebotomy in WT and Fundc1-/- mice. (D) Hemogram parameters of RBC counts and HGB in the peripheral blood of WT controls and Fundc1-/- mice after phlebotomy. (E) The serum EPO amount in Fundc1-/- and WT mice after phlebotomy. (F, G) The frequency of R1, R2, R3 and R4 in spleen and bone marrow from WT and Fundc1-/- mice after phlebotomy. Individual mice are represented by symbols. Data shown are representative of at least three independent experiments. Similar results were found in each experiment. All data are mean ± SEM; *p<0.05, ns denotes no statistical significance. Statistical significance was analyzed by using the two-tailed unpaired Student’s t-test.
-
Figure 2—figure supplement 1—source data 1
Erythropoiesis in WT and Fundc1-/- mice upon phlebotomy.
- https://cdn.elifesciences.org/articles/64480/elife-64480-fig2-figsupp1-data1-v2.xlsx
Figure 3 with 1 supplement

MtDNA cytosolic translocation caused by insufficient mitophagy induces elevated inflammation and severer renal injury in Fundc1-/- mice upon PHZ treatment.
(A) qRT-PCR analysis showing the kinetics of Epo mRNA expression in kidneys of WT and Fundc1-/- mice after PBS or PHZ treatment. (B) Relative mRNA levels of kidney injury marker Lcn2 and Kim1 in kidneys of WT and Fundc1-/- mice with or without PHZ treatment. (C) Western blotting showing the HIF2α expression in whole kidney lysate in WT and Fundc1-/- mice with or without PHZ treatment. ACTIN was used as a loading control. (D) Immunohistochemistry of mitochondrial protein PHB2 in kidneys of WT and Fundc1-/- mice with or without PHZ treatment, respectively. The indicated area (blue dash box) is zoomed in and intense signals of PHB2 are marked with red arrows. The right bar graph presents the quantitative assay measured by ImageJ. Scale bars, 200 mm; original magnification, 10×. (E, F) Western blotting (E) and corresponding quantification (F) showing the protein levels of mitochondrial membrane proteins (TIMM23, COXIV, and TOMM20) and autophagic proteins (P62, LC3II/I, and their ratio) in kidneys of WT and Fundc1-/- mice with or without PHZ treatment. TUBULIN was used as a loading control. (G) Relative mRNA levels of Atp5d, Nrf1, and Tfam in kidneys of WT and Fundc1-/- mice with or without PHZ treatment. (H, I) qRT-PCR shows the total and cytosolic mtDNA in kidneys of WT and Fundc1-/- mice with or without PHZ treatment. (J) The mRNA levels of Il1b, Il6, and Tnfa in kidneys treated with PBS or PHZ. For each experiment, n = 3–5 mice for each group. Individual mice are represented by symbols. Data shown are representative of at least three independent experiments. Similar results were found in each experiment. All data are mean ± SEM; *p<0.05, **p<0.01, ns: no statistical significance. Statistical significance was analyzed by using the two-tailed unpaired Student’s t-test.
-
Figure 3—source data 1
MtDNA cytosolic translocation and severer renal injury in Fundc1-/- mice upon PHZ treatment.
- https://cdn.elifesciences.org/articles/64480/elife-64480-fig3-data1-v2.xlsx
Figure 3—figure supplement 1
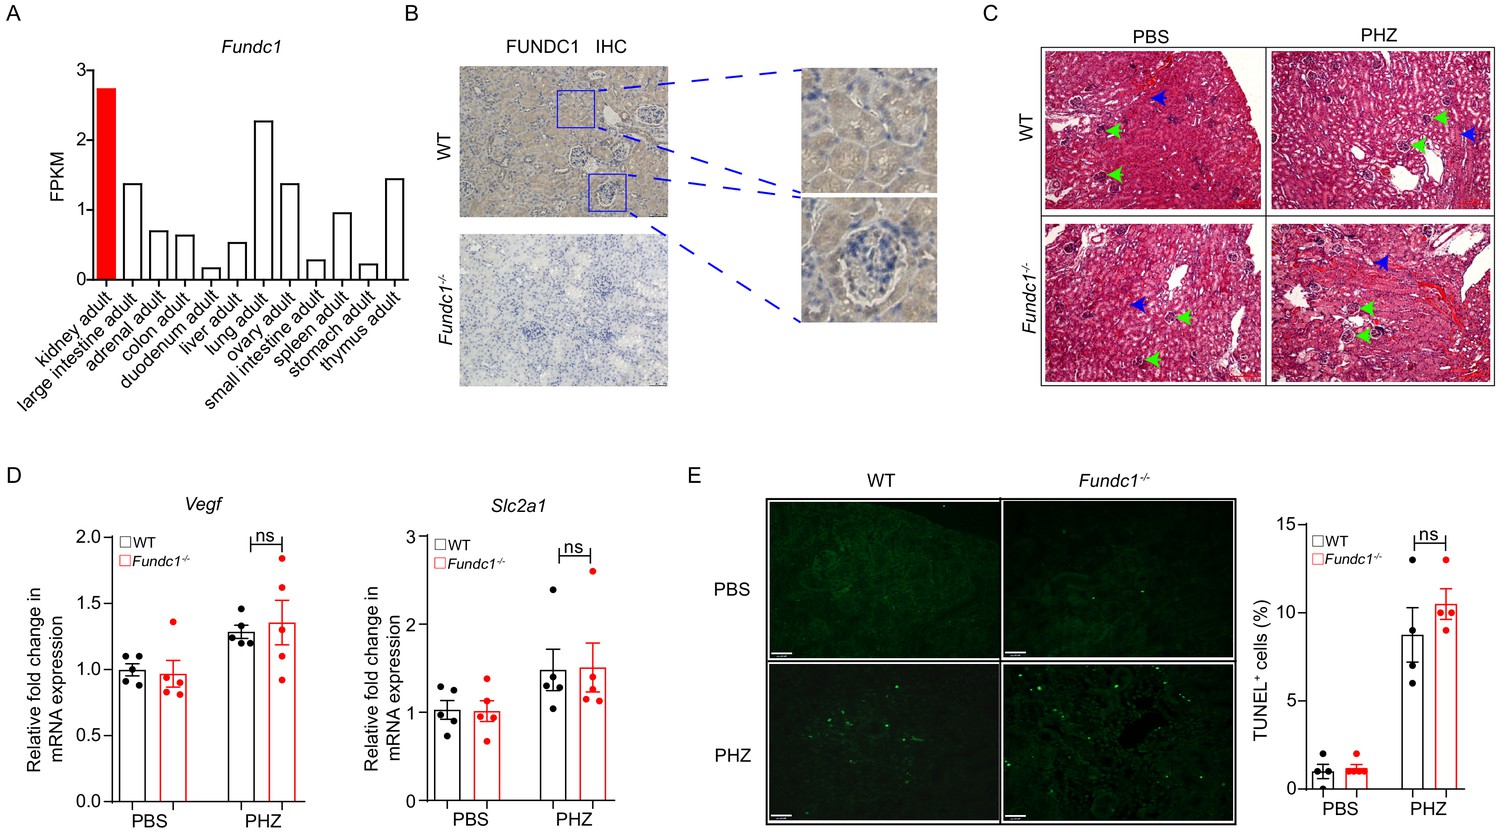
The histology of kidney of Fundc1-/- mice after PHZ treatment.
(A) The levels of Fundc1 across multiple tissues. (B) The Immunohistochemistry images of FUNDC1 in WT and Fundc1-/- mice kidney, including zoomed-in renal tubules (upper right) and glomeruli (bottom right). The blue staining indicating the nuclei stained with DAPI. (C) Hematoxylin and eosin (H&E) staining revealing no major structural alterations in kidney of PHZ-Fundc1-/- mice. No pronounced differences were found in glomeruli size, which were not congested (green arrows). No major tubular dilatation modifications were detected either (blue arrows). (D) Relative mRNA levels of HIF2α downstream targets, Vegf and Slc2a1 in sorted PDGFRβ+ REPs of WT or Fundc1-/- mice after 48 hr of PBS or PHZ treatment, respectively. (E) TUNEL immunofluorescence staining and corresponding quantification of the cellular apoptotic rates in kidney of WT and Fundc1-/- mice after PHZ treatment. Scale bars, 100 μm; original magnification, 40×. The images were quantified with ImageJ. For each experiment, n = 3–5 mice were used for each group. Individual mice are represented by symbols. Data shown are representative of at least three independent experiments. Similar results were found in each experiment. All data are mean ± SEM; ns denotes no statistical significance. Statistical significance was analyzed by using the two-tailed unpaired Student’s t-test.
-
Figure 3—figure supplement 1—source data 1
The histology of kidney of Fundc1-/- mice after PHZ treatment.
- https://cdn.elifesciences.org/articles/64480/elife-64480-fig3-figsupp1-data1-v2.xlsx
Figure 4 with 1 supplement
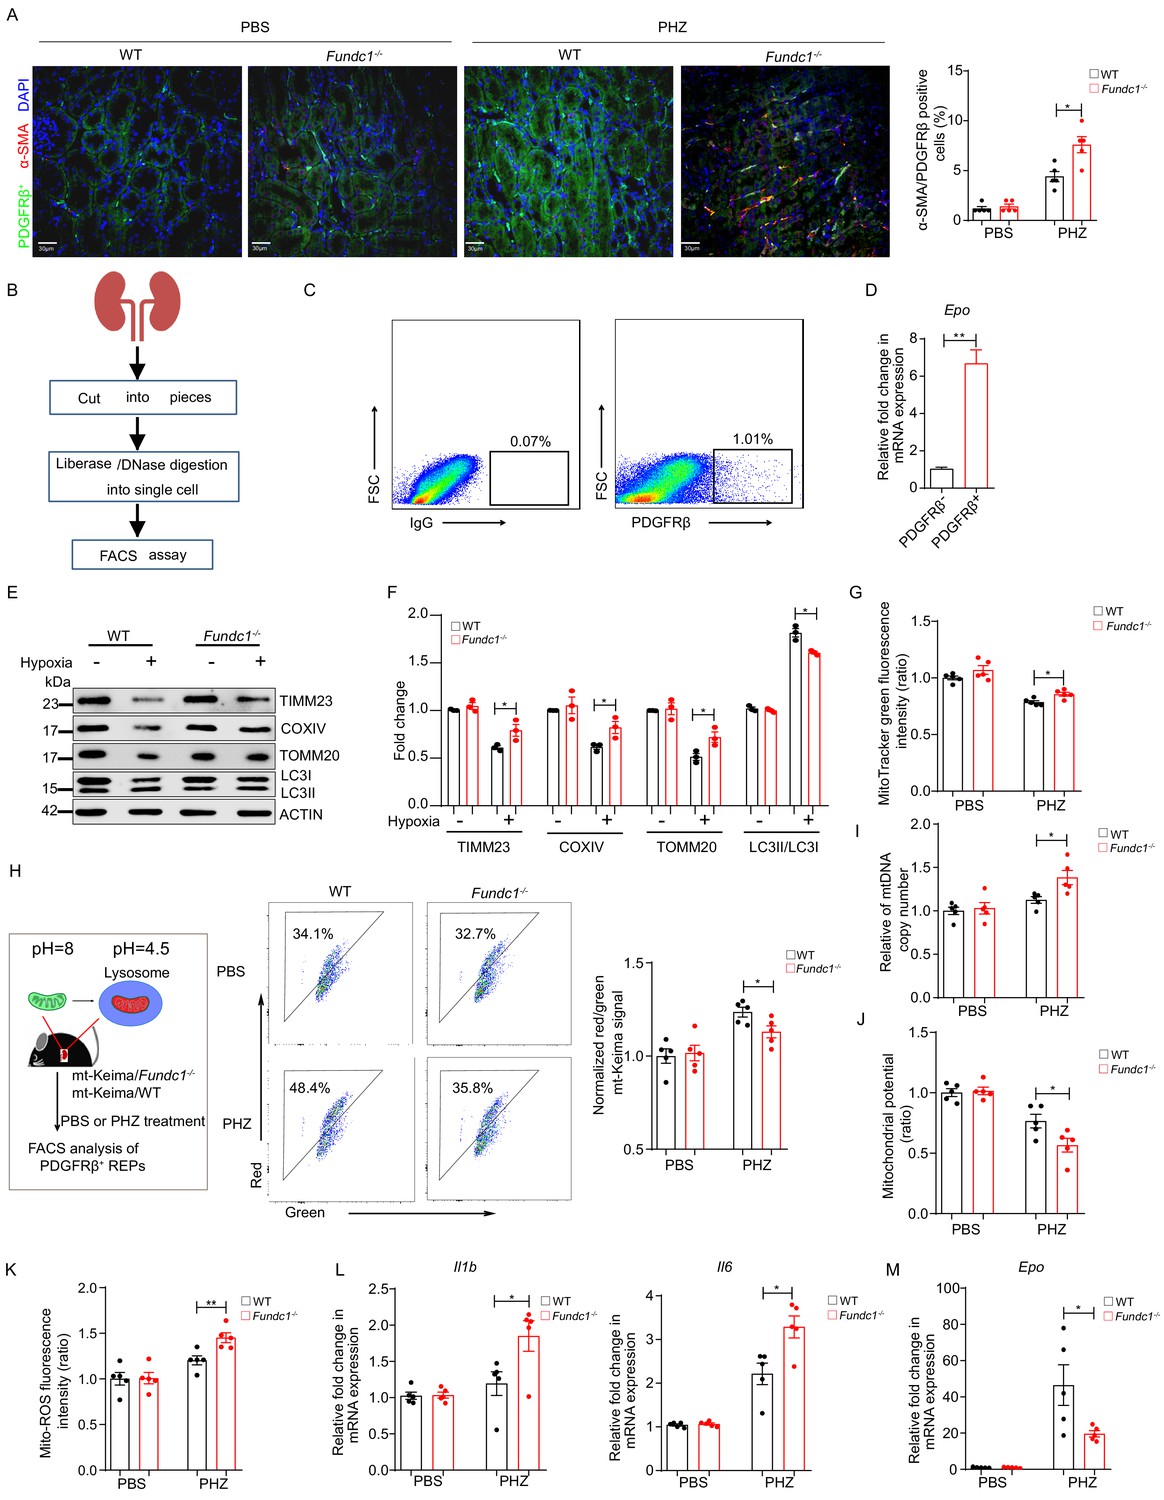
Impaired mitophagy triggers inflammation and reduced Epo expression in REPs.
(A) Representative immunofluorescence images (left) of PDGFRβ and α-SMA co-staining in renal tissue sections from WT and Fundc1-/- mice after 48 hr of PBS or PHZ treatment, respectively. The right bar graph shows the percentage of α-SMA positive fibrotic cells out of PDGFRβ labeled REPs. For quantification, approximately 10 fields for each mouse (200×) were randomly selected to evaluate the frequency of α-SMA+ cells out of PDGFRβ+ cells. Scale bars, 30 μm. (B) The schematic diagram showing the procedures of isolating REPs for flow cytometry assay. (C) The representative FACS plots showing the sorting strategy for PDGFRβ+ REPs. (D) Epo mRNA expression in PDGFRβ- and PDGFRβ+ cells by qRT-PCR. (E) Western blotting showing protein levels of mitochondrial membrane proteins (TIMM23, COXIV, and TOMM20) and autophagic proteins LC3 in FACS-sorted PDGFRβ+ REPs from WT and Fundc1-/- mice under the treatment of hypoxia (1% O2). (F) The quantification of the signal intensity of indicated mitochondrial membrane proteins (TIMM23, COXIV and TOMM20) and ratio of LC3II/I from (E). (G) Mitochondrial mass examined by using MitoTracker Green in FACS-sorted PDGFRβ+ REPs in WT and Fundc1-/- mice with or without PHZ treatment. (H) Flow cytometry analysis of mitophagy in REPs of mt-Keima/WT and mt-Keima/Fundc1-/- mice after 48 hr of PBS or PHZ treatment. (I) mtDNA copy number in FACS-purified REPs in WT and Fundc1-/- mice with or without PHZ treatment. (J, K) Mitochondrial membrane potential detected by using TMRM (J) or ROS level (K) measured by using MitoSOX in FACS-purified REPs of WT or Fundc1-/- mice after 48 hr of PBS or PHZ treatment. (L, M) Relative mRNA levels of proinflammatory cytokines Il1b, Il6 (L) and Epo (M) in sorted PDGFRβ+ REPs in WT or Fundc1-/- mice after 48 hr of PBS or PHZ treatment, respectively. For each experiment, n = 3–5 mice for each group. Individual mice are represented by symbols. Data shown are representative of at least three independent experiments. Similar results were found in each experiment. All data are mean ± SEM; *p<0.05, **p<0.01. Statistical significance was analyzed by using the two-tailed unpaired Student’s t-test.
-
Figure 4—source data 1
Inflammation and Epo expression in REPs.
- https://cdn.elifesciences.org/articles/64480/elife-64480-fig4-data1-v2.xlsx
Figure 4—figure supplement 1
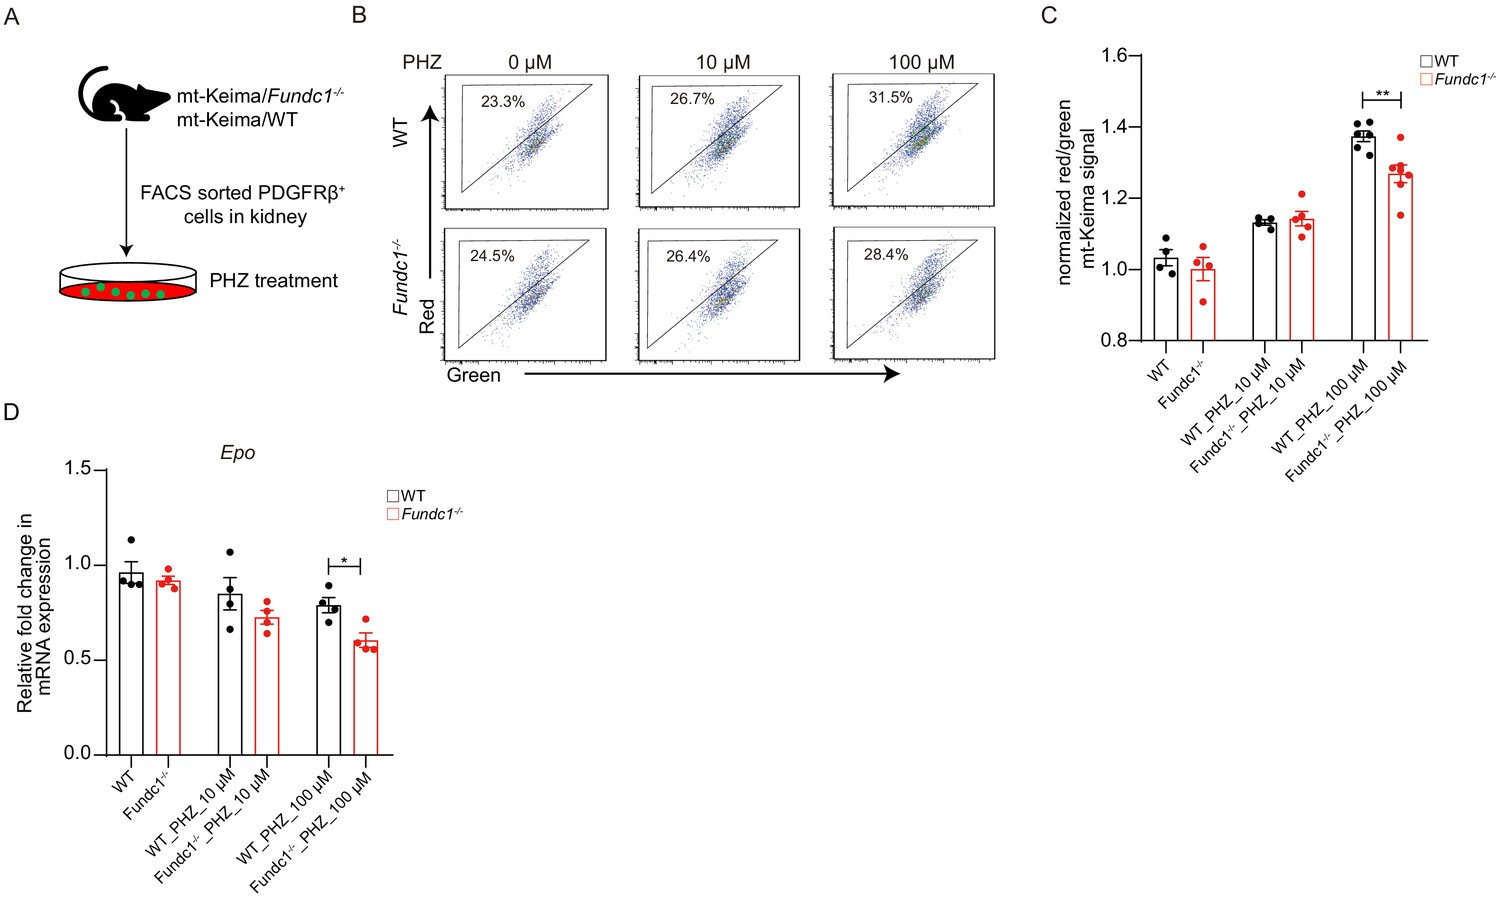
Fundc1 depletion impairs mitophagy and EPO production in REPs treated with PHZ in vitro.
(A) Schematic of the experimental design. (B, C) Flow cytometry analysis of mitophagy in PDGFRβ+ cells treated with PHZ for 12 hr in vitro. PDGFRβ+ cells were purified from the kidney of mt-Keima/WT and mt-Keima/Fundc1-/- mice. The representative FACS plots (B) and the corresponding quantification (C) are shown. (D) The Epo expression in PDGFRβ+ cells treated with PHZ for 12 hr in vitro, which were collected from mt-Keima/WT and mt-Keima/Fundc1-/- mice. For each experiment, n = 3–5 mice were used for each group. Individual mice are represented by symbols. Data shown are representative of at least three independent experiments. Similar results were found in each experiment. All data are mean ± SEM; *p<0.05, **p<0.01, ns denotes no statistical significance. Statistical significance was analyzed by using the two-tailed unpaired Student’s t-test.
-
Figure 4—figure supplement 1—source data 1
Mitophagy and EPO production in REPs treated with PHZ in vitro.
- https://cdn.elifesciences.org/articles/64480/elife-64480-fig4-figsupp1-data1-v2.xlsx
Figure 5
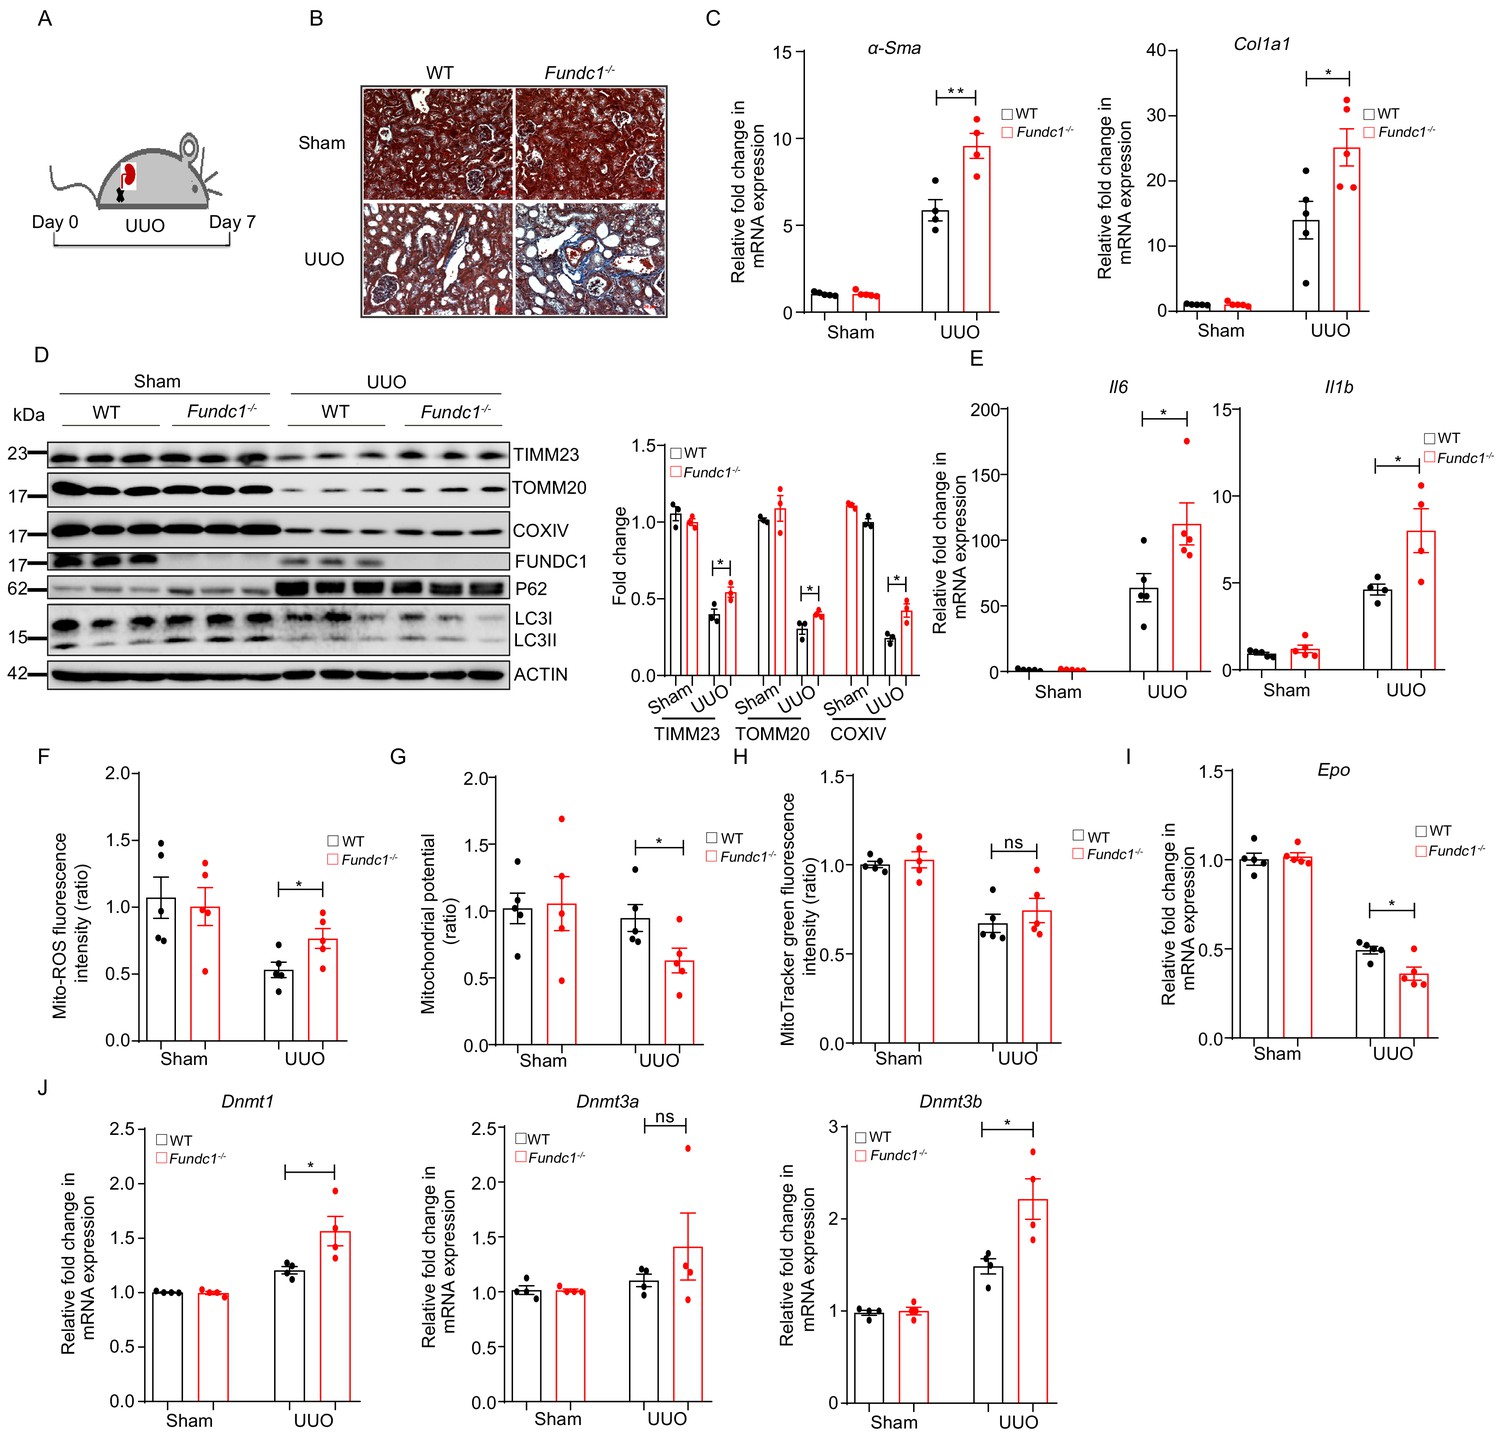
More severe renal fibrosis and increased inflammation in Fundc1-/- mice with UUO model.
(A) Schematic diagram showing the generation of UUO pathological model from WT and Fundc1-/- mice. (B) Masson’s trichrome staining showing collagenous fiber (blue staining) of the renal section from UUO-Fundc1-/- and WT mice. (C) The expression of fibrosis related genes, α-Sma and Col1a1, in kidneys of sham or UUO-induced WT and Fundc1-/- mice. (D) Western blotting of the protein levels of mitochondrial membrane proteins (TOMM20, TIMM23, COXIV, and FUNDC1) and autophagy associated proteins (LC3 and P62) in kidney of sham, UUO-induced WT and Fundc1-/- mice. (E) The mRNA expression levels of proinflammatory cytokines Il6 and Il1b in kidney of sham, UUO-induced WT and Fundc1-/- mice. (F–H) Flow cytometry analysis of mitochondrial ROS level by MitoSOX (F), membrane potential by TMRM (G) and mitochondrial mass by MitoTracker Green (H) in FACS sorted, PDGFRβ+ REPs of kidneys in Sham, UUO-induced WT and Fundc1-/- mice, respectively. (I) Relative mRNA levels of Epo in sham, UUO-induced WT and Fundc1-/- mice. (J) The mRNA expression of DNA methyltransferase Dnmt1, Dnmt3a, and Dnmt3b in sham, UUO-induced WT and Fundc1-/- mice. For each experiment, n = 3–5 mice for each group. Individual mice are represented by symbols. Data shown are representative of at least three independent experiments. Similar results were found in each experiment. All data are mean ± SEM; *p<0.05; ns: no statistical significance. Statistical significance was analyzed by using the two-tailed unpaired Student’s t-test.
-
Figure 5—source data 1
Fibrosis and inflammation in UUO model.
- https://cdn.elifesciences.org/articles/64480/elife-64480-fig5-data1-v2.xlsx
Figure 6
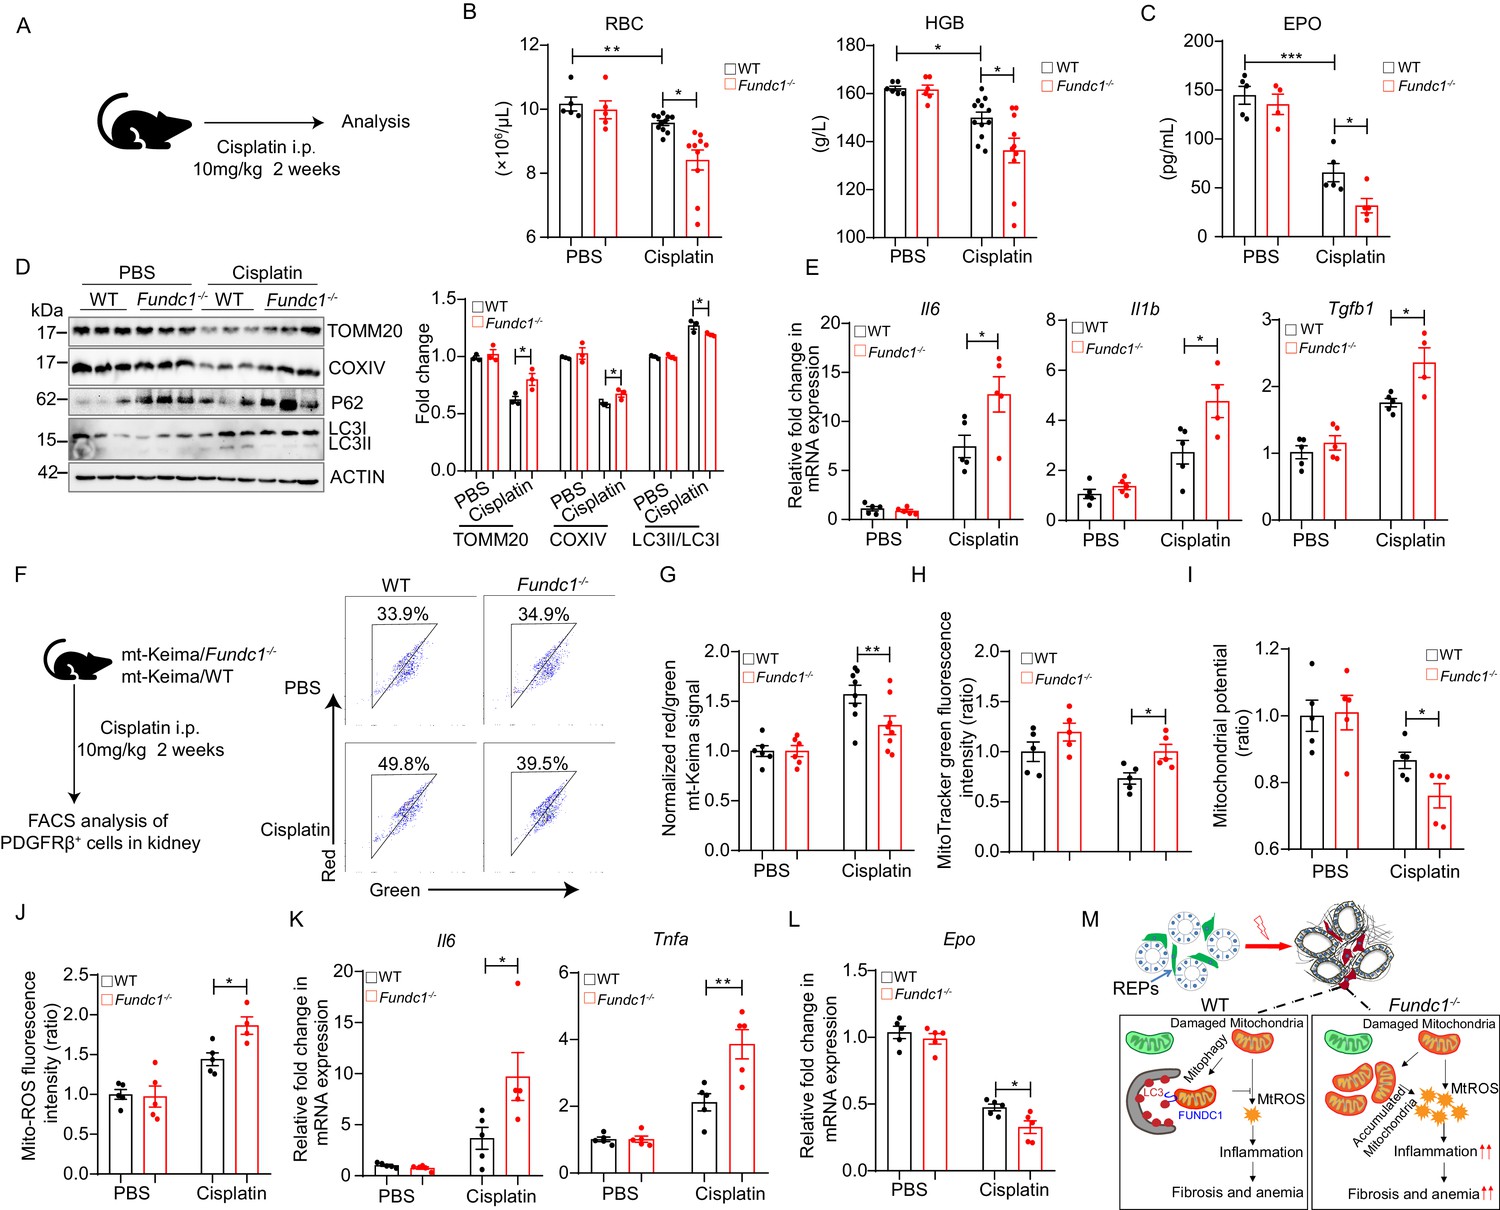
Impaired mitophagy and reduced EPO production in Fundc1-/- mice during cisplatin-induced renal anemia.
(A) Schematic diagram showing the generation of renal anemia disease model by cisplatin. (B) Hemogram parameters of red blood cell (RBC) counts and hemoglobin (HGB) in the peripheral blood of WT controls and Fundc1-/- mice after PBS or cisplatin treatment. (C) The serum EPO concentration in Fundc1-/- and WT mice after PBS or cisplatin treatment. (D) Western blotting (left) and the corresponding quantification (right) showing the protein levels of mitochondrial membrane proteins (TOMM20 and COXIV) and autophagic proteins (P62 and ratio of LC3II/I) in kidneys of WT and Fundc1-/- mice with PBS or cisplatin treatment. (E) Relative mRNA levels of Il6, Il1b, and Tgfb1 in kidneys of WT and Fundc1-/- mice with or without cisplatin treatment. (F, G) Flow cytometry analysis of mitophagy in PDGFRβ+ REPs of mt-Keima/WT and mt-Keima/Fundc1-/- mice after PBS or cisplatin treatment. The representative FACS plots (F) and the quantification (G) are shown. (H) Mitochondrial mass detected by using MitoTracker Green via FACS in PDGFRβ+ REPs of WT or Fundc1-/- mice after PBS or cisplatin treatment. (I) Mitochondrial membrane potential detected by using TMRM by FACS in PDGFRβ+ REPs of WT or Fundc1-/- mice after PBS or cisplatin treatment. (J) Mitochondrial ROS level detected by using MitoSOX via FACS in PDGFRβ+ REPs of WT or Fundc1-/- mice after PBS or cisplatin treatment. (K) Relative mRNA levels of proinflammatory cytokines Il6 (left) and Tnfa (right) in sorted PDGFRβ+ REPs in WT or Fundc1-/- mice after PBS or cisplatin treatment. (L) Relative mRNA levels of Epo in sorted PDGFRβ+ REPs in WT or Fundc1-/- mice after PBS or cisplatin treatment, respectively. (M) A hypothetic model depicting the role of FUNDC1 in REPs. FUNDC1-mediated mitophagy is required for mitochondrial steady-state homeostasis. However, under stresses, the damaged mitochondria are accumulated in Fundc1-/- REPs due to impaired mitophagy. Consequently, elevated ROS levels from these damaged mitochondria of REPs incur inflammatory responses by enhancing the expression of proinflammatory cytokines TNFa, IL6 and IL1b, which in turn promote myofibroblastic transformation of REPs, resulting in the loss of EPO generation and subsequently anemia. For each experiment, n = 3–5 mice for each group. Individual mice are represented by symbols. Data shown are representative of at least three independent experiments. Similar results were found in each experiment. All data are mean ± SEM; *p<0.05, **p<0.01, ***p<0.001. Statistical significance was analyzed by using the two-tailed unpaired Student’s t-test.
-
Figure 6—source data 1
Mitophagy and EPO production during cisplatin-induced renal anemia.
- https://cdn.elifesciences.org/articles/64480/elife-64480-fig6-data1-v2.xlsx
Author response image 1

Giemsa staining of FACS-sorted R2 populations.
The red and green arrow indicate proerythroblasts and basophilic erythroblasts, respectively. The photographs were taken at an original magnification of 400×.
Author response image 2
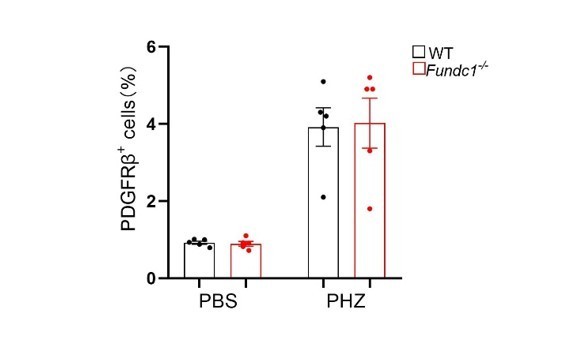
The percentage of REPs after PHZ treatment in kidney.
Additional files
-
Supplementary file 1
Hemogram of peripheral blood.
- https://cdn.elifesciences.org/articles/64480/elife-64480-supp1-v2.xlsx
-
Supplementary file 2
Primers used for qRT-PCR.
- https://cdn.elifesciences.org/articles/64480/elife-64480-supp2-v2.xlsx
-
Transparent reporting form
- https://cdn.elifesciences.org/articles/64480/elife-64480-transrepform-v2.docx
Download links
A two-part list of links to download the article, or parts of the article, in various formats.
Downloads (link to download the article as PDF)
Open citations (links to open the citations from this article in various online reference manager services)
Cite this article (links to download the citations from this article in formats compatible with various reference manager tools)
Receptor-mediated mitophagy regulates EPO production and protects against renal anemia
eLife 10:e64480.
https://doi.org/10.7554/eLife.64480


