Evidence for adaptive evolution in the receptor-binding domain of seasonal coronaviruses OC43 and 229e
- Molecular and Cellular Biology Program, University of Washington, United States
- Vaccine and Infectious Disease Division, Fred Hutchinson Cancer Research Center, United States
Figures
Figure 1 with 2 supplements
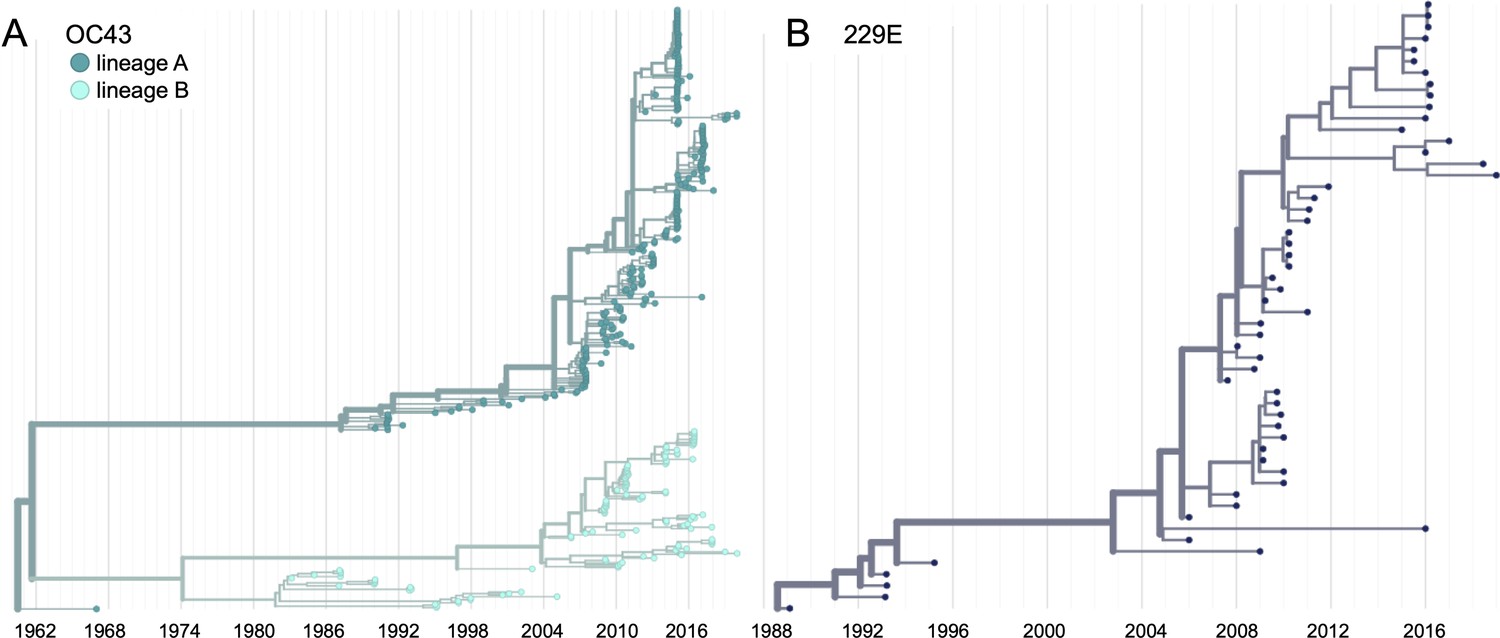
Phylogenetic trees for spike gene of seasonal human coronaviruses (HCoVs) OC43 and 229E.
Phylogenies built from (A) OC43 spike sequences from 389 isolates over 53 years, and (B) 229E spike sequences from 54 isolates over 31 years. OC43 bifurcates immediately after the root and is split into two lineages: lineage A (dark teal) and lineage B (light teal). 229E contains just one lineage (dark blue). For the analyses in this paper, the evolution of each gene (or genomic region) is considered separately, so phylogenies are built for each viral gene, and those phylogenies are used to split isolates into lineages for each gene. These are temporally resolved phylogenies with year shown on the x-axis. The clock rate estimate is 5 × 10⁻⁴ substitutions per nucleotide site per year for OC43 and 6 × 10⁻⁴ for 229E.
Figure 1—figure supplement 1
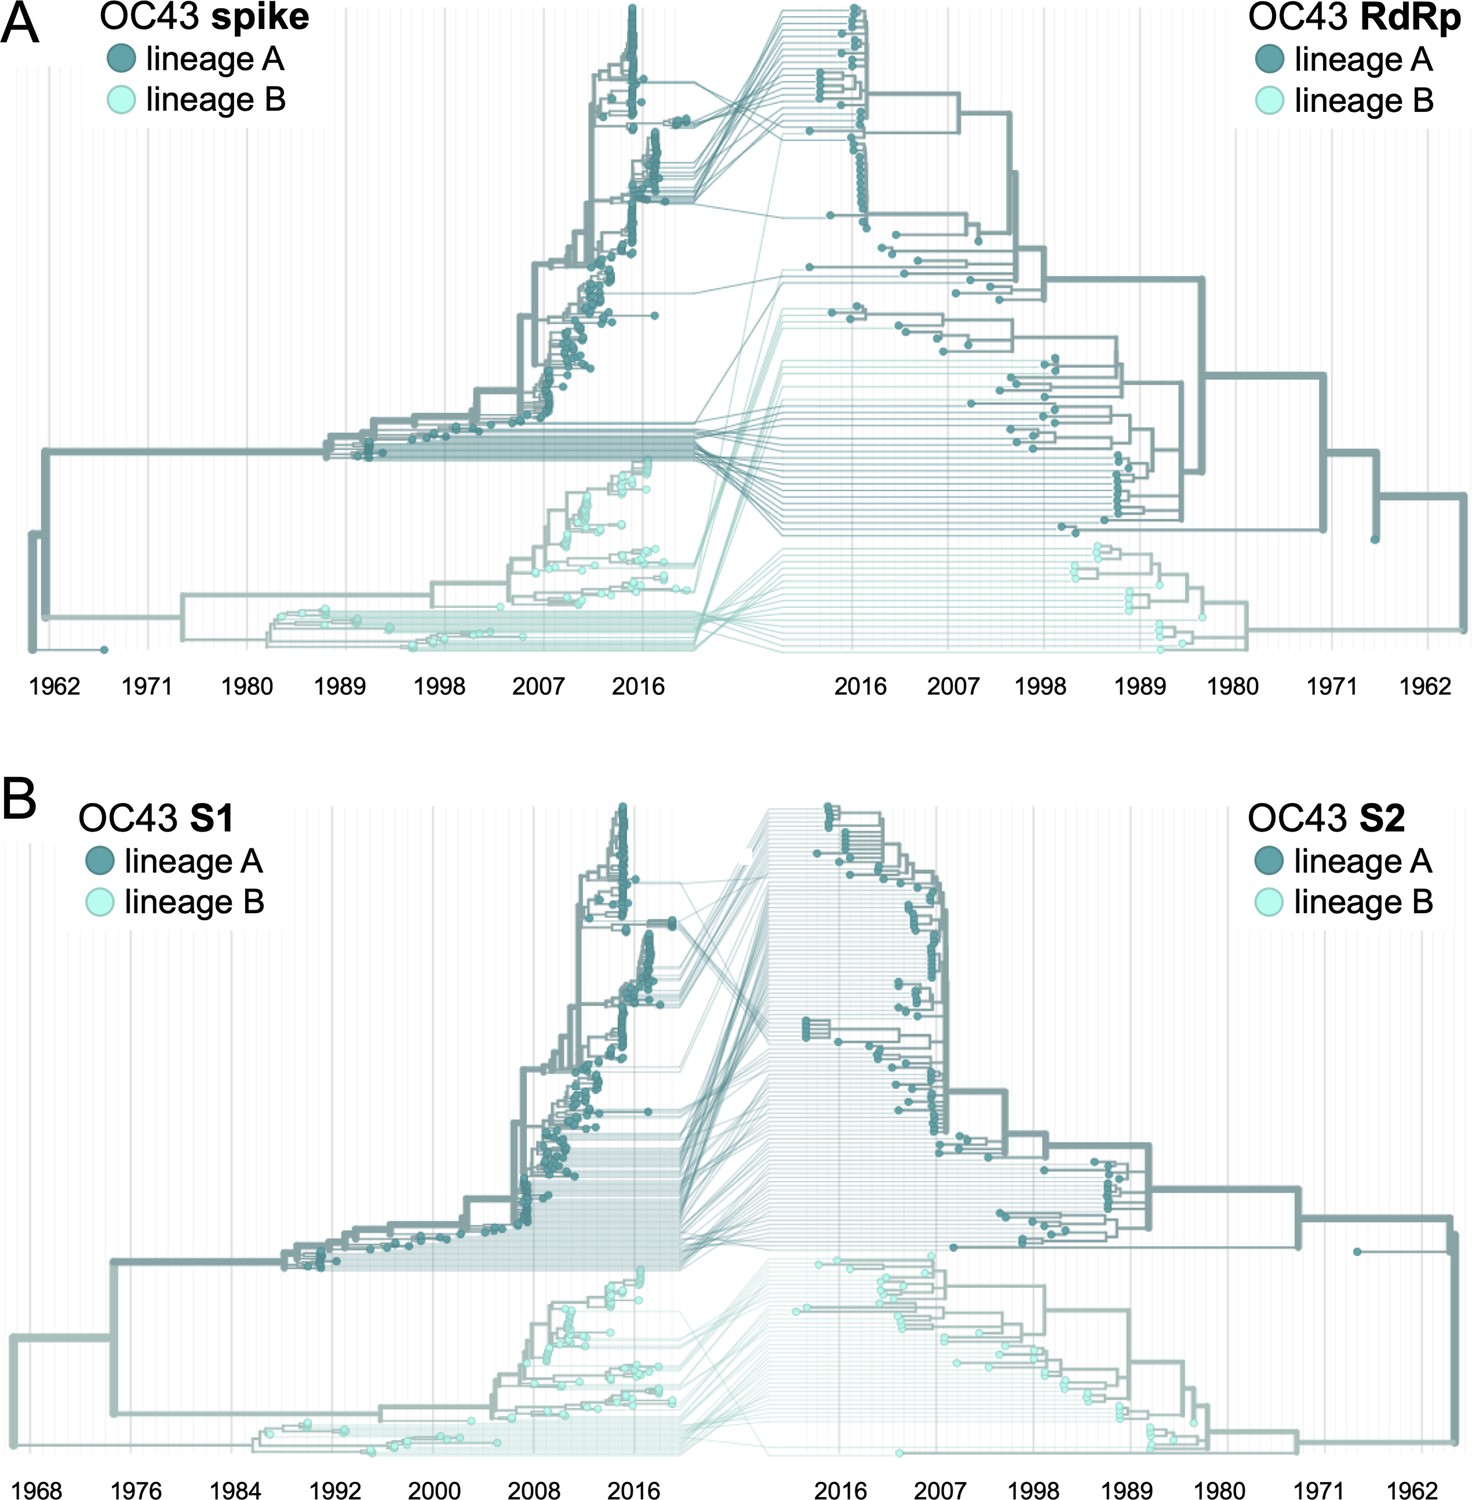
Recombination occurs between human coronavirus (HCoV) isolates.
A tanglegram draws lines between an isolate’s position on two phylogenies built on different genes (or genomic regions). Dramatic differences in an isolate’s position on one tree versus another are indicative of recombination. (A) Phylogenetic relationships between OC43 isolates based on spike sequences (left) versus relationships based on RdRp sequences (right). Light teal lines that connect isolates classified as lineage A based on their RdRp sequence to isolates classified as lineage B based on their spike sequence suggest that recombination occurred in these isolates or their ancestors. (B) Phylogenetic reconstruction of OC43 isolates based on S1 sequences (left) versus S2 sequences (right). Year is shown on the x-axis.
Figure 1—figure supplement 2
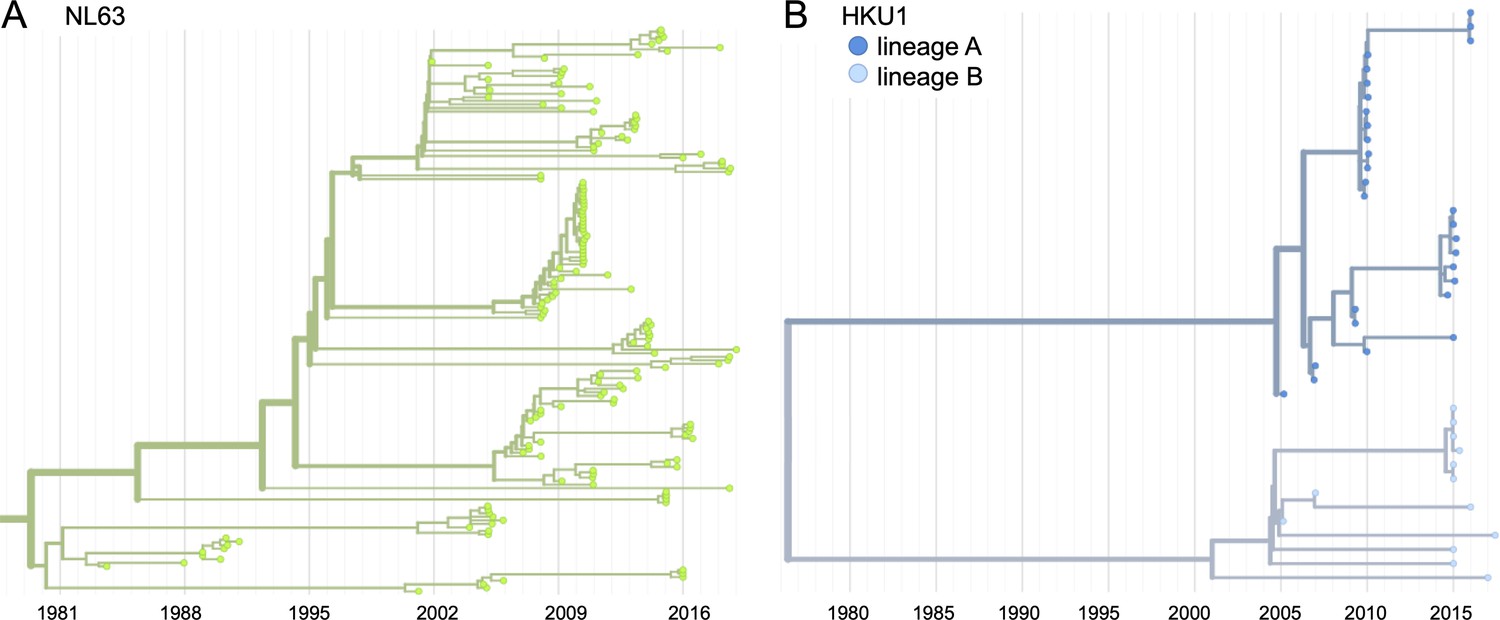
Phylogenetic trees for seasonal human coronaviruses (HCoVs) NL63 and HKU1.
Phylogenies built from (A) NL63 spike sequences from 159 isolates over 37 years, and (B) HKU1 spike sequences from 41 isolates over 13 years. HKU1 bifurcates immediately after the root and is split into lineage A (darker blue) and lineage B (lighter blue). NL63 contains just one lineage (green). Both HCoVs are rooted on an outgroup sequence. For the analyses in this paper, the evolution of each gene (or genomic region) is considered separately, so phylogenies are built for each viral gene and those phylogenies are used to split isolates into lineages for each gene. These are temporally resolved phylogenies with year shown on the x-axis. The clock rate of each HCoV is listed in the section ‘Phylogenetic inference’.
Figure 2 with 1 supplement
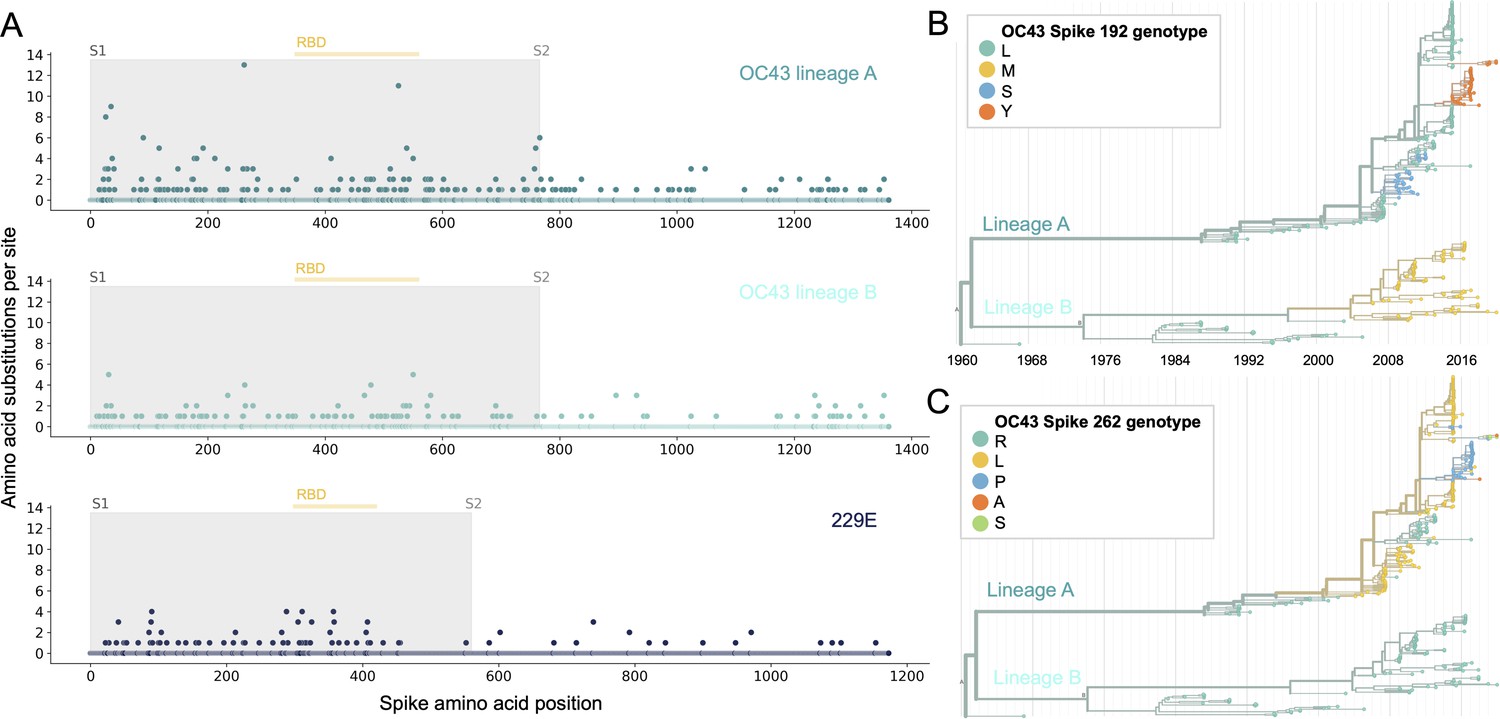
More sites mutate repeatedly within spike S1 versus S2.
(A) Number of substitutions observed at each amino acid position in the spike gene throughout the phylogeny. S1 (gray) and S2 (white) are indicated by shading and the number of substitutions per site is indicated by a dot and color-coded by human coronavirus (HCoV) lineage. The putative receptor-binding domains for 229E (Li et al., 2019) and the putative domain for OC43 (Lau et al., 2011) are indicated with light yellow bars. Asterisks indicate two example positions (192 and 262), which mutate repeatedly throughout the OC43 lineage A phylogeny. The OC43 phylogeny built from spike sequences and color-coded by genotype at positions 192 and 262 is shown in (B) and (C), respectively.
Figure 2—figure supplement 1

Mutations at each position within Spike for NL63 and HKU1.
Number of substitutions observed at each amino acid position in the spike gene throughout the phylogeny. S1 (gray) and S2 (white) are indicated by shading and the number of substitutions per site is indicated by a dot and color-coded by human coronavirus (HCoV) lineage: (A) NL63, (B) HKU1 (assuming all HKU1 isolates are a single lineage), (C) HKU1 lineage A (D) HKU1 lineage B (assuming there are two co-circulating HKU1 lineages).
Figure 3 with 2 supplements
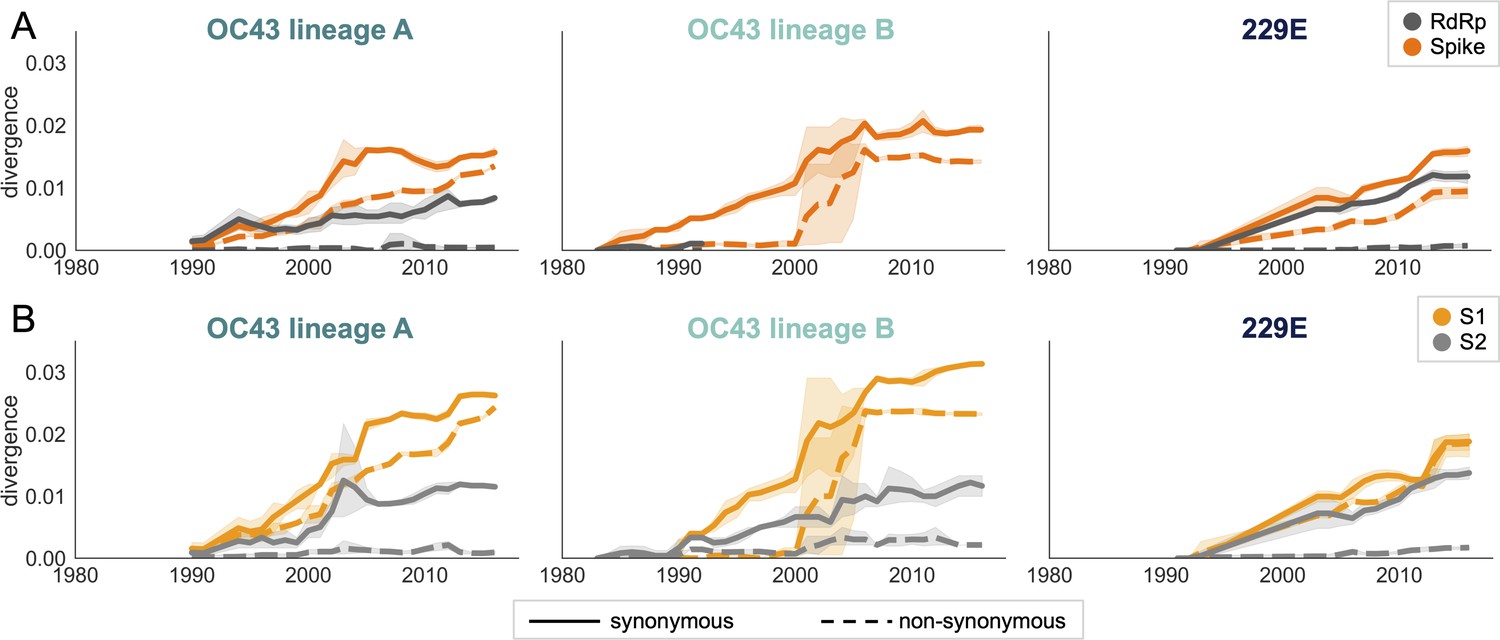
Nonsynonymous divergence is higher in OC43 and 229E Spike S1 versus S2 or RdRp.
(A) Nonsynonymous (dashed lines) and synonymous divergence (solid lines) of the spike (dark orange) and RdRp (dark gray) genes of all 229E and OC43 lineages over time. Divergence is the average Hamming distance from the ancestral sequence, computed in sliding 3-year windows that contain at least two sequenced isolates. Shaded region shows 95% confidence intervals. Note that the absence of a line means that there are fewer than two sequences available at this time point and that, therefore, the divergence is not calculated. (B) Nonsynonymous and synonymous divergence within the S1 (light orange) and S2 (light gray) domains of spike. Year is shown on the x-axis and is shared between plots.
Figure 3—figure supplement 1
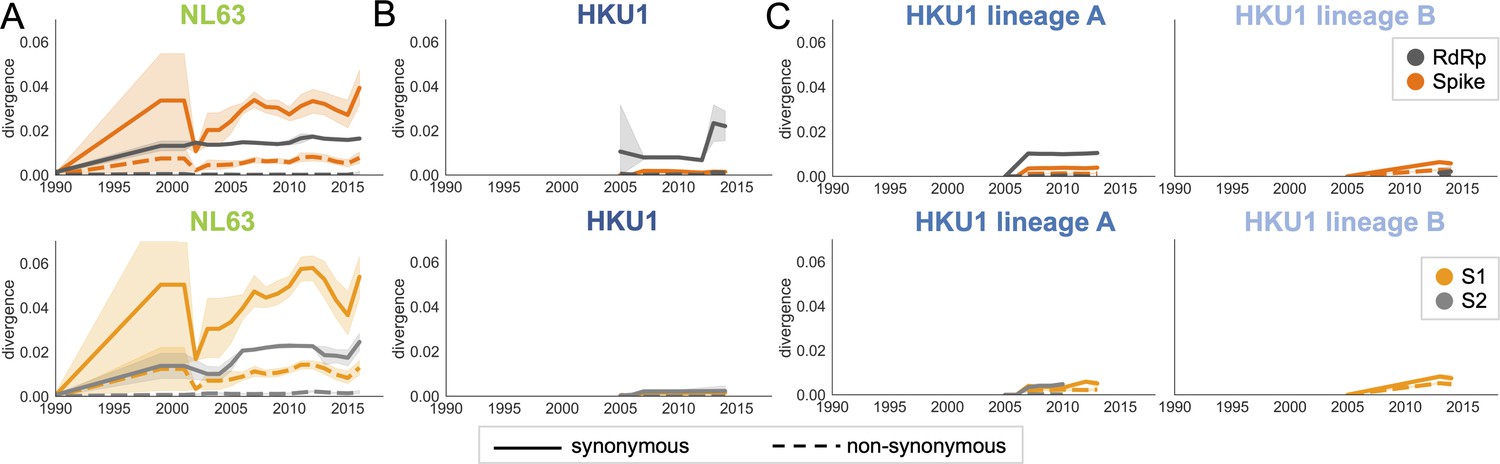
Nonsynonymous divergence in NL63 and HKU1.
Nonsynonymous (dashed lines) and synonymous divergence (solid lines) within the spike (dark orange) and RdRp (dark gray) genes and within S1 (light orange) and S2 (light gray) over time. Divergence is the average Hamming distance from the ancestral sequence, computed in sliding 3-year windows that contain at least two sequenced isolates. Shaded region shows 95% confidence intervals. (A) NL63, (B) HKU1 (assuming all HKU1 isolates belong to a single lineage), and (C) HKU1 (divided into two co-circulating lineages). Year is shown on the x-axis. Note that x- and y-axis scales are shared between the subplots but are different from Figure 3.
Figure 3—figure supplement 2
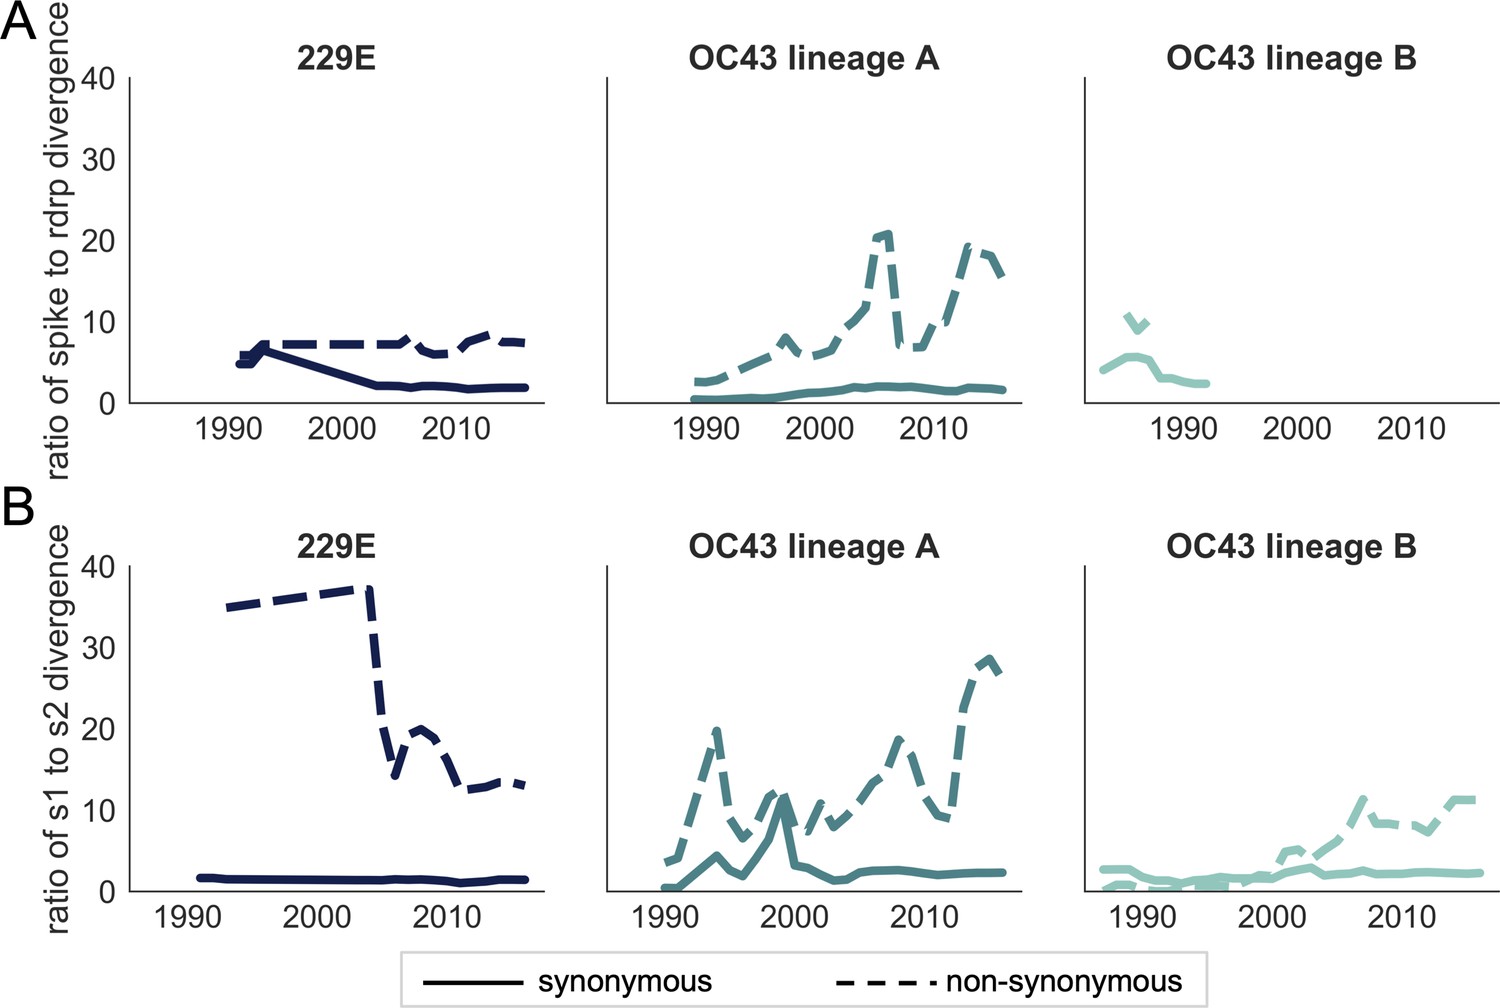
Ratio of divergence between genomic regions.
(A) The ratio of nonsynonymous divergence in spike to nonsynonymous divergence in RdRp (dashed lines) and the equivalent ratio of synonymous divergence (solid lines) is shown for 229E (dark blue), OC43 lineage A (dark teal), and OC43 lineage B (light teal). (B) The same ratios of divergence as in panel A, except comparing S1 and S2. Year is on the x-axis.
Figure 4
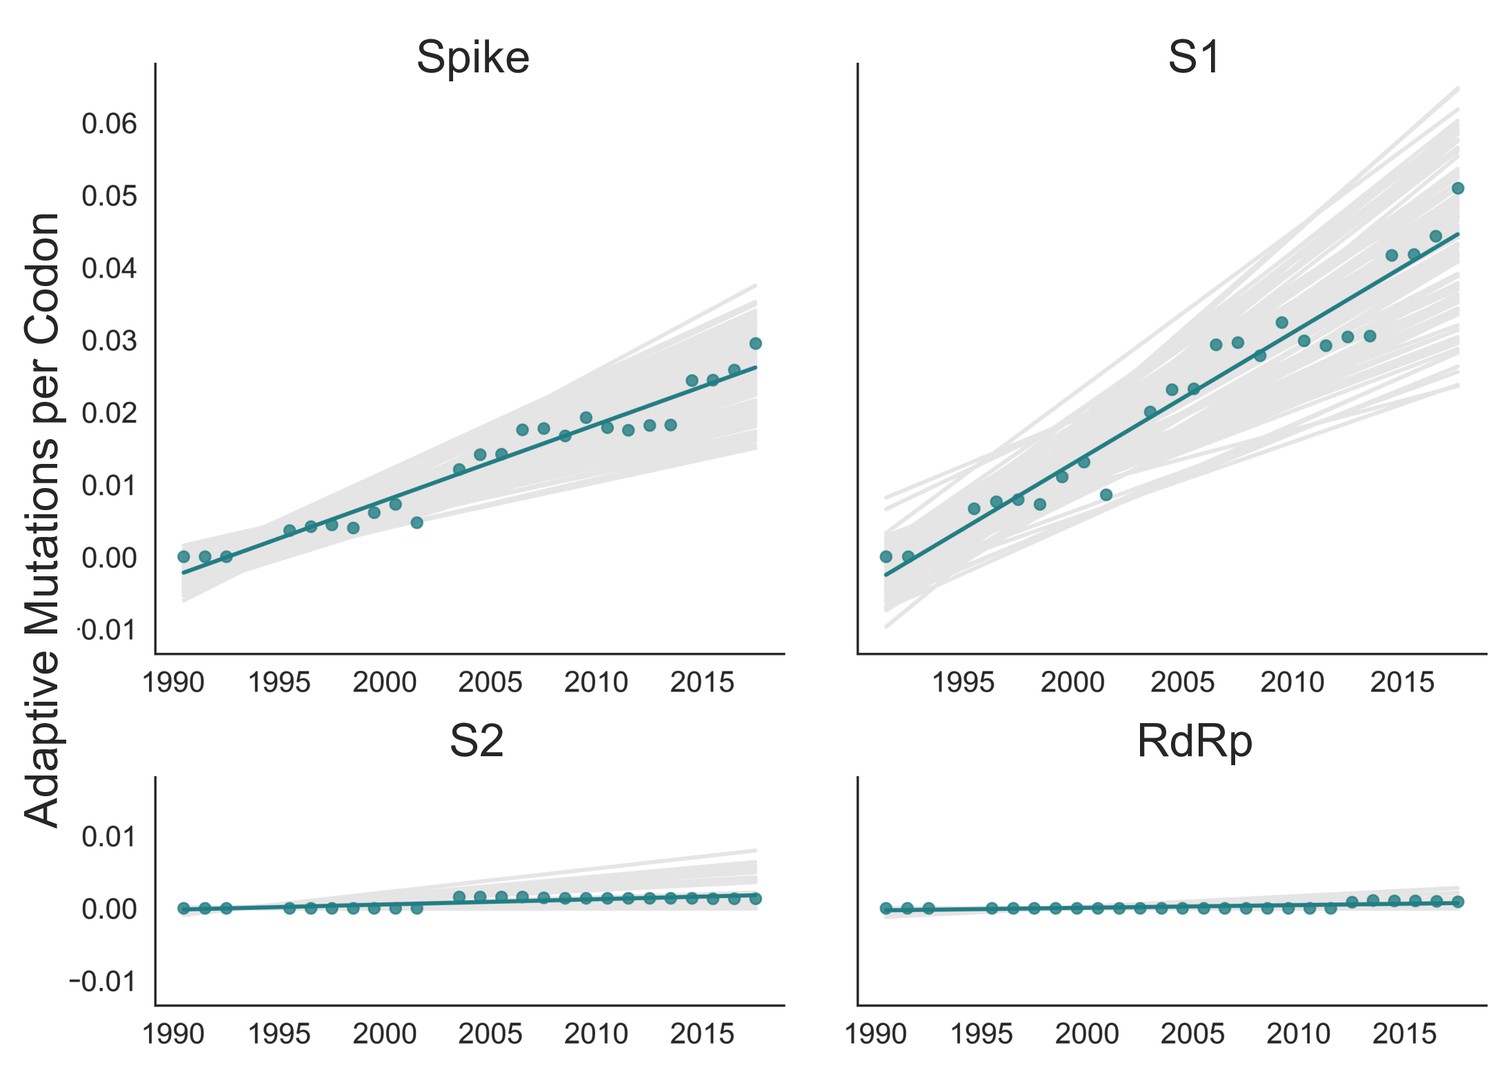
Adaptive substitutions accumulate over time in OC43 lineage A spike S1.
Adaptive substitutions per codon within OC43 lineage A spike, S1, S2 and RdRp as calculated by our implementation of the Bhatt method. Adaptive substitutions are computed in sliding 3-year windows, and only for time points that contain three or more sequenced isolates. Green dots display estimated values calculated from the empirical data and green lines show linear regression fit to these points. Gray lines show the distribution of regressions fit to the computed number of adaptive substitutions from 100 bootstrapped data sets. Year is shown on the x-axis.
Figure 5 with 1 supplement
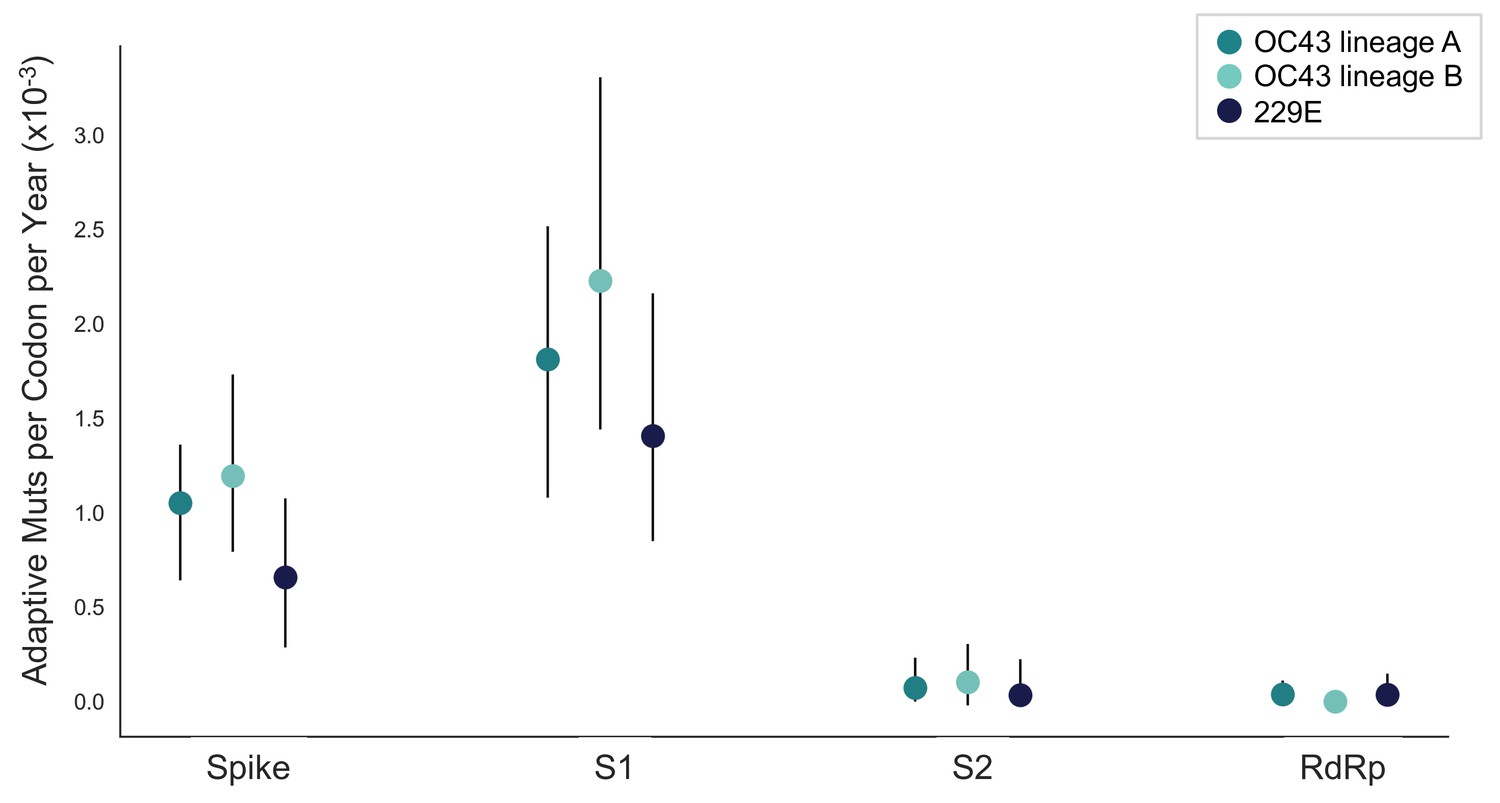
The rate of adaptive substitution is highest in spike S1.
Adaptive substitutions per codon per year as calculated by our implementation of the Bhatt method. Rates are calculated within Spike, S1, S2 and RdRp for 229E and OC43 lineages. Error bars show 95% bootstrap percentiles from 100 bootstrapped data sets.
Figure 5—figure supplement 1
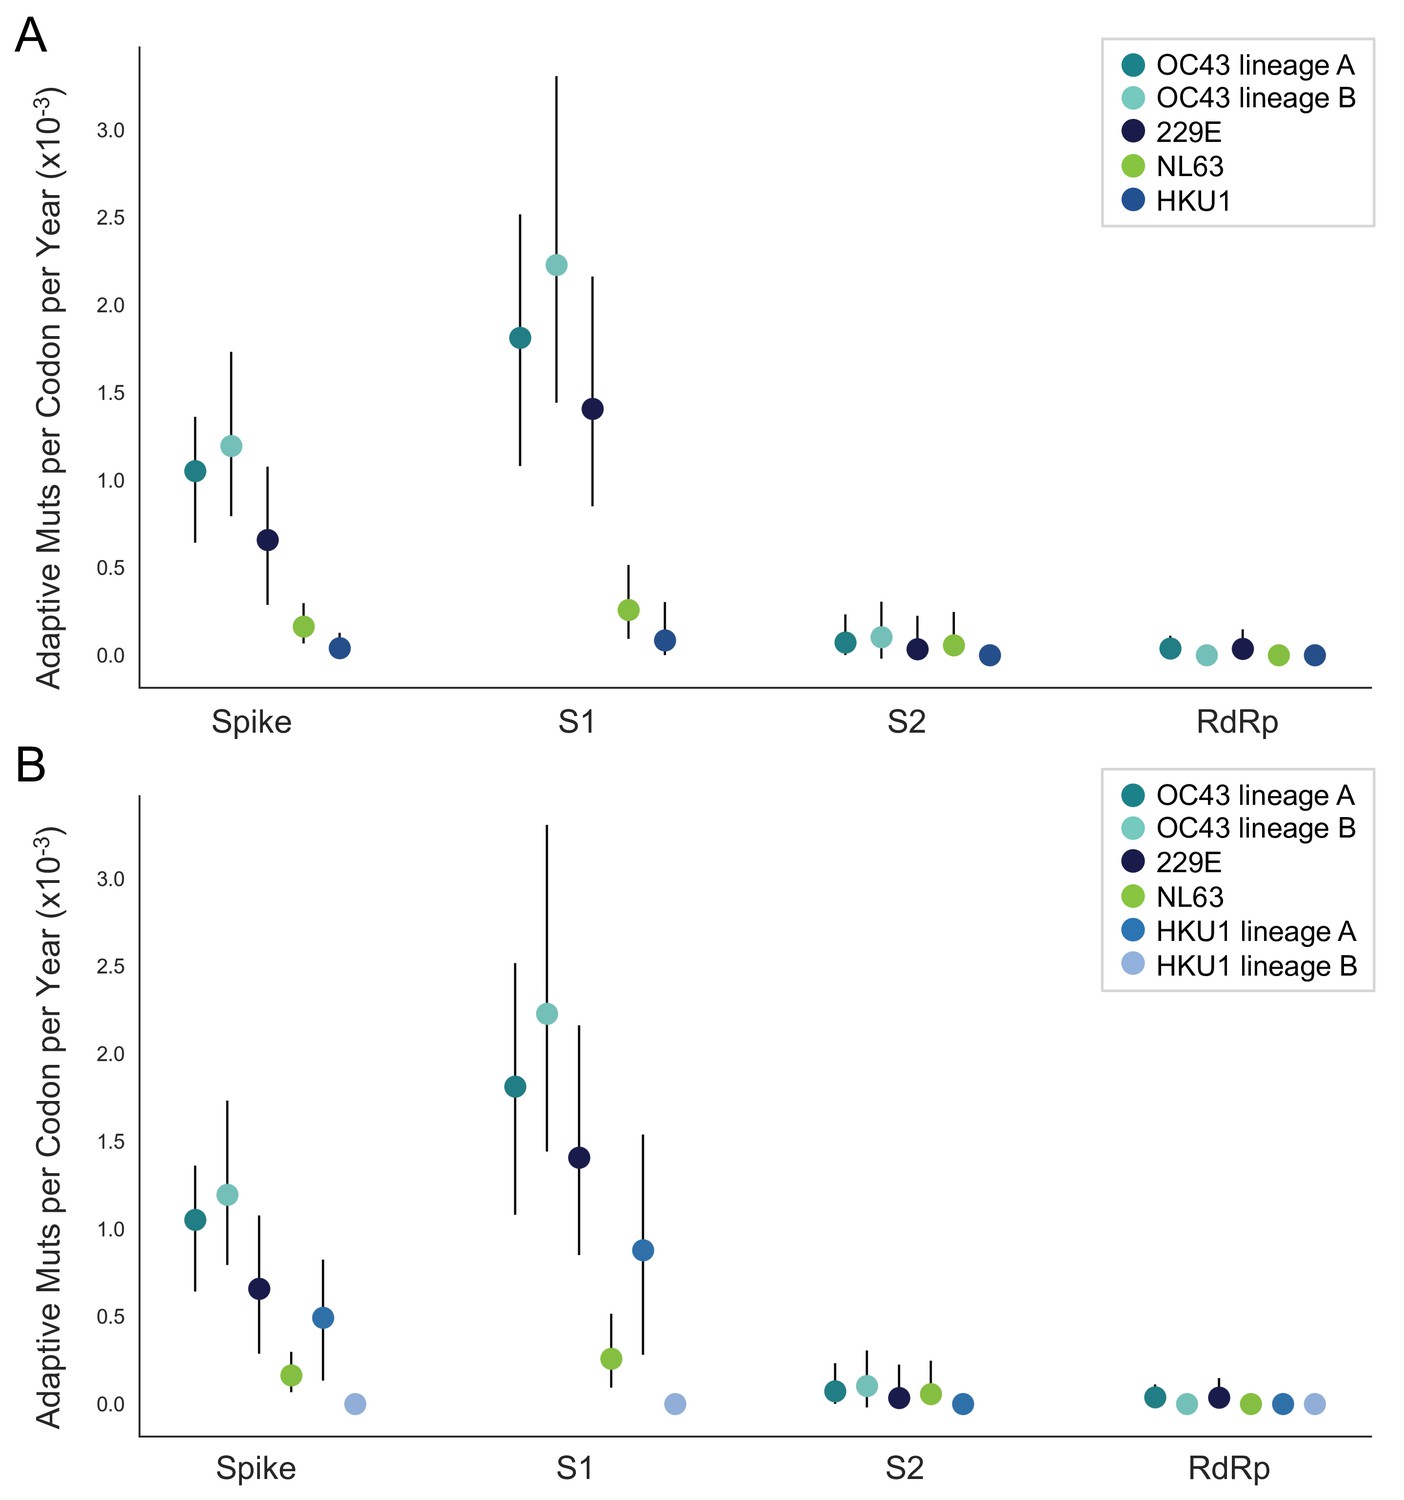
NL63 and HKU1 have low rates of adaptation in spike.
As in Figure 4, adaptive substitutions per codon per year are calculated by our implementation of the Bhatt method. (A) NL63 (green) and HKU1 (blue) are both considered to consist of a single lineage. (B) HKU1 is divided into two co-circulating lineages (blue and light blue). The calculated rates of adaptive substitution within spike, S1, S2 and RdRp are plotted alongside 229E and OC43 for comparison. Error bars show 95% bootstrap percentiles from 100 bootstrapped data sets.
Figure 6
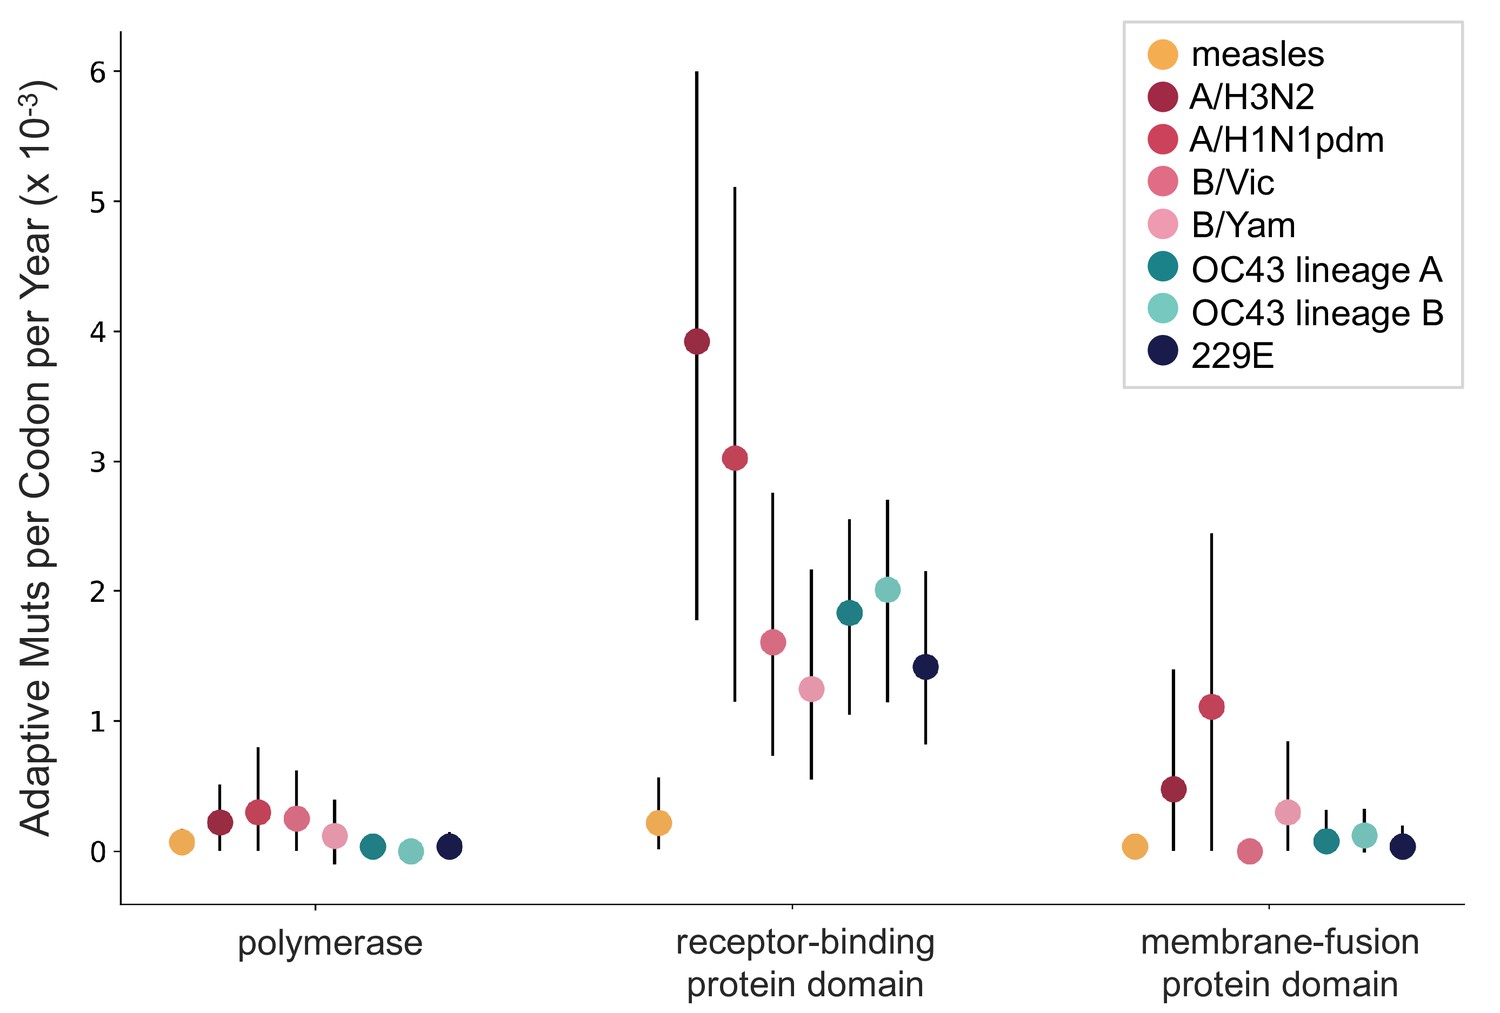
OC43 and 229E spike S1 accumulates adaptive substitutions faster than measles but slower than influenza A/H3N2.
Comparison of adaptive substitutions per codon per year between measles (yellow), four influenza strains (A/H3N2, A/H1N1pdm, B/Vic, and B/Yam- shown in shades of red), OC43 lineage A (dark teal), OC43 lineage B (light teal), and 229E (dark blue). The polymerase, receptor-binding domain, and membrane fusion domain for influenza strains are PB1, HA1, and HA2. For both human coronaviruses (HCoVs), they are RdRp, S1, and S2, respectively. For measles, the polymerase is the L gene, the receptor-binding protein is the H gene, and the fusion protein is the F gene. Error bars show 95% bootstrap percentiles from 100 bootstrapped data sets.
Figure 7 with 2 supplements
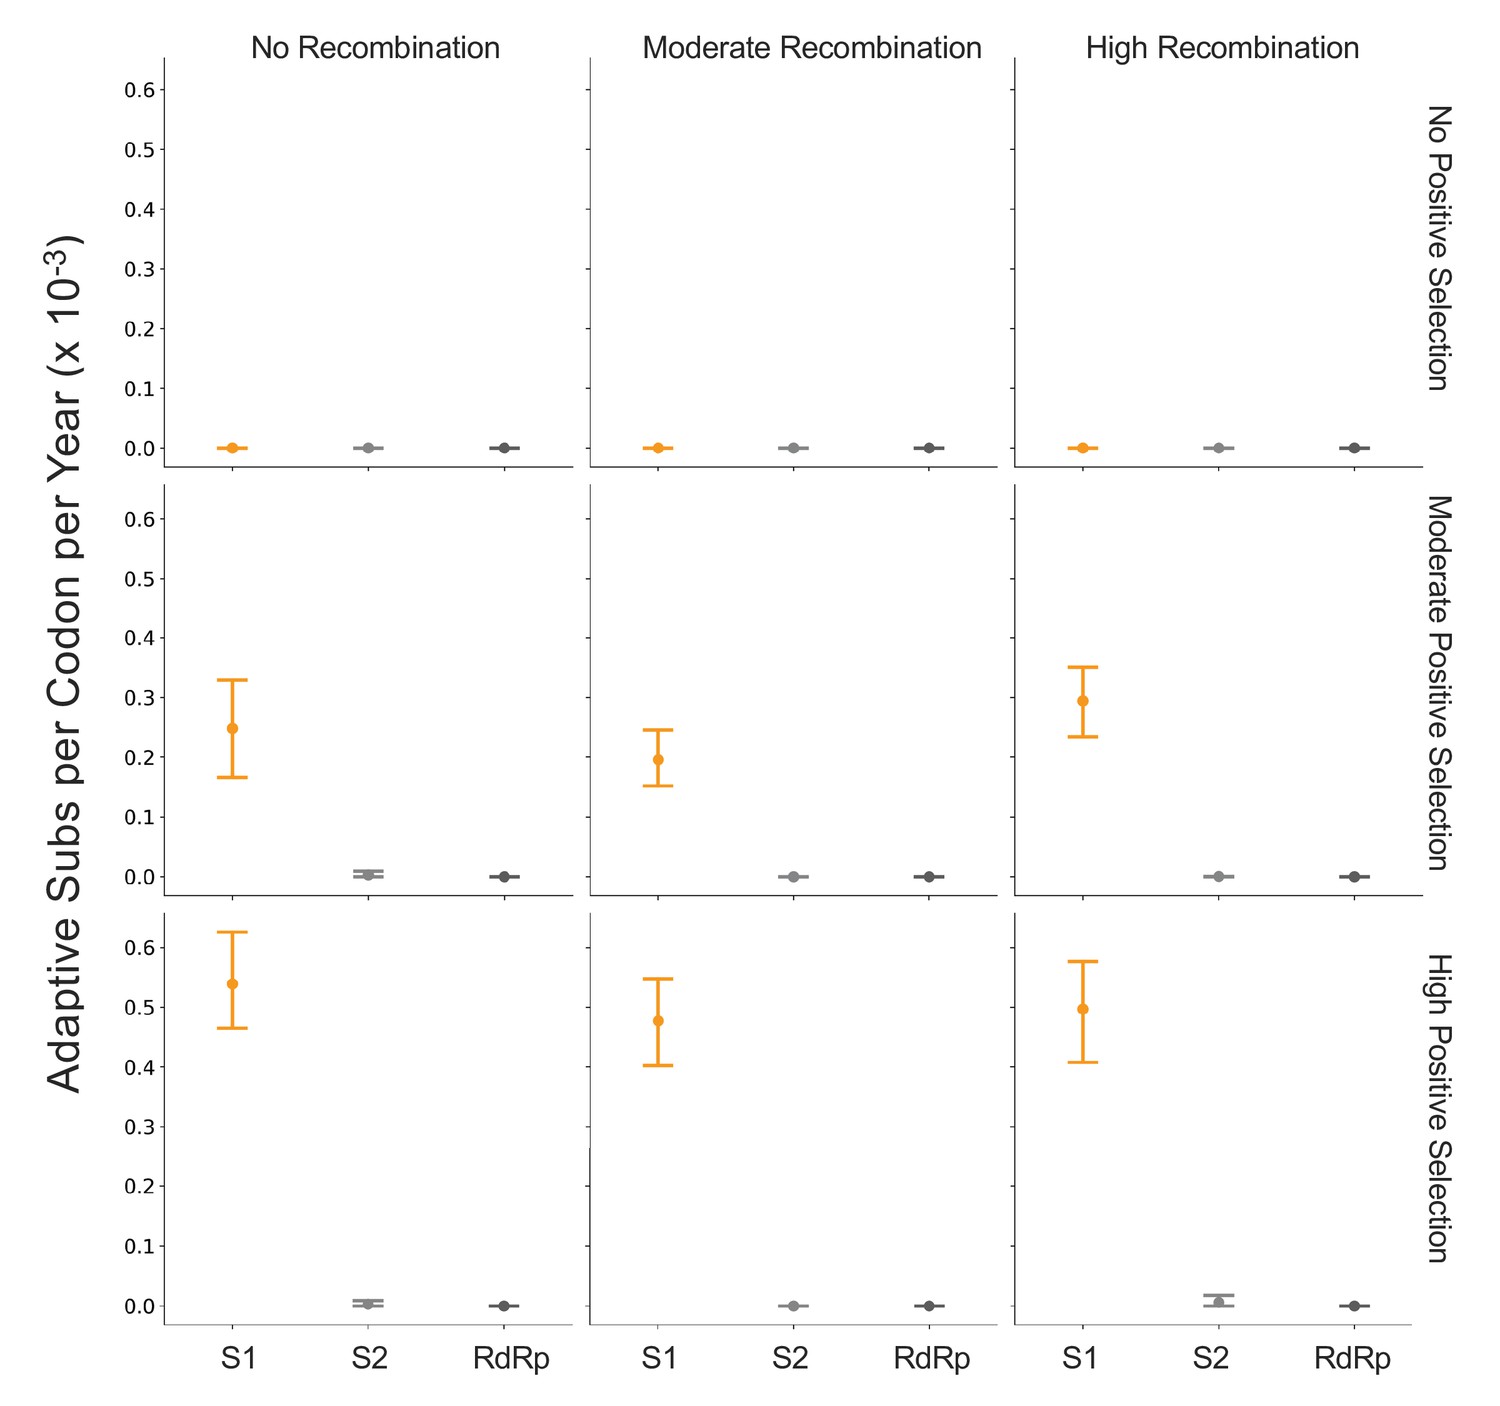
Detection of positive selection is not biased by recombination.
OC43 lineage A sequences were simulated with varying levels of recombination and positive selection. The Bhatt method was used to calculate the rate of adaptive substitutions per codon per year for S1 (light orange), S2 (light gray), and RdRp (dark gray). The mean and 95% confidence interval of 10 independent simulations are plotted.
Figure 7—figure supplement 1
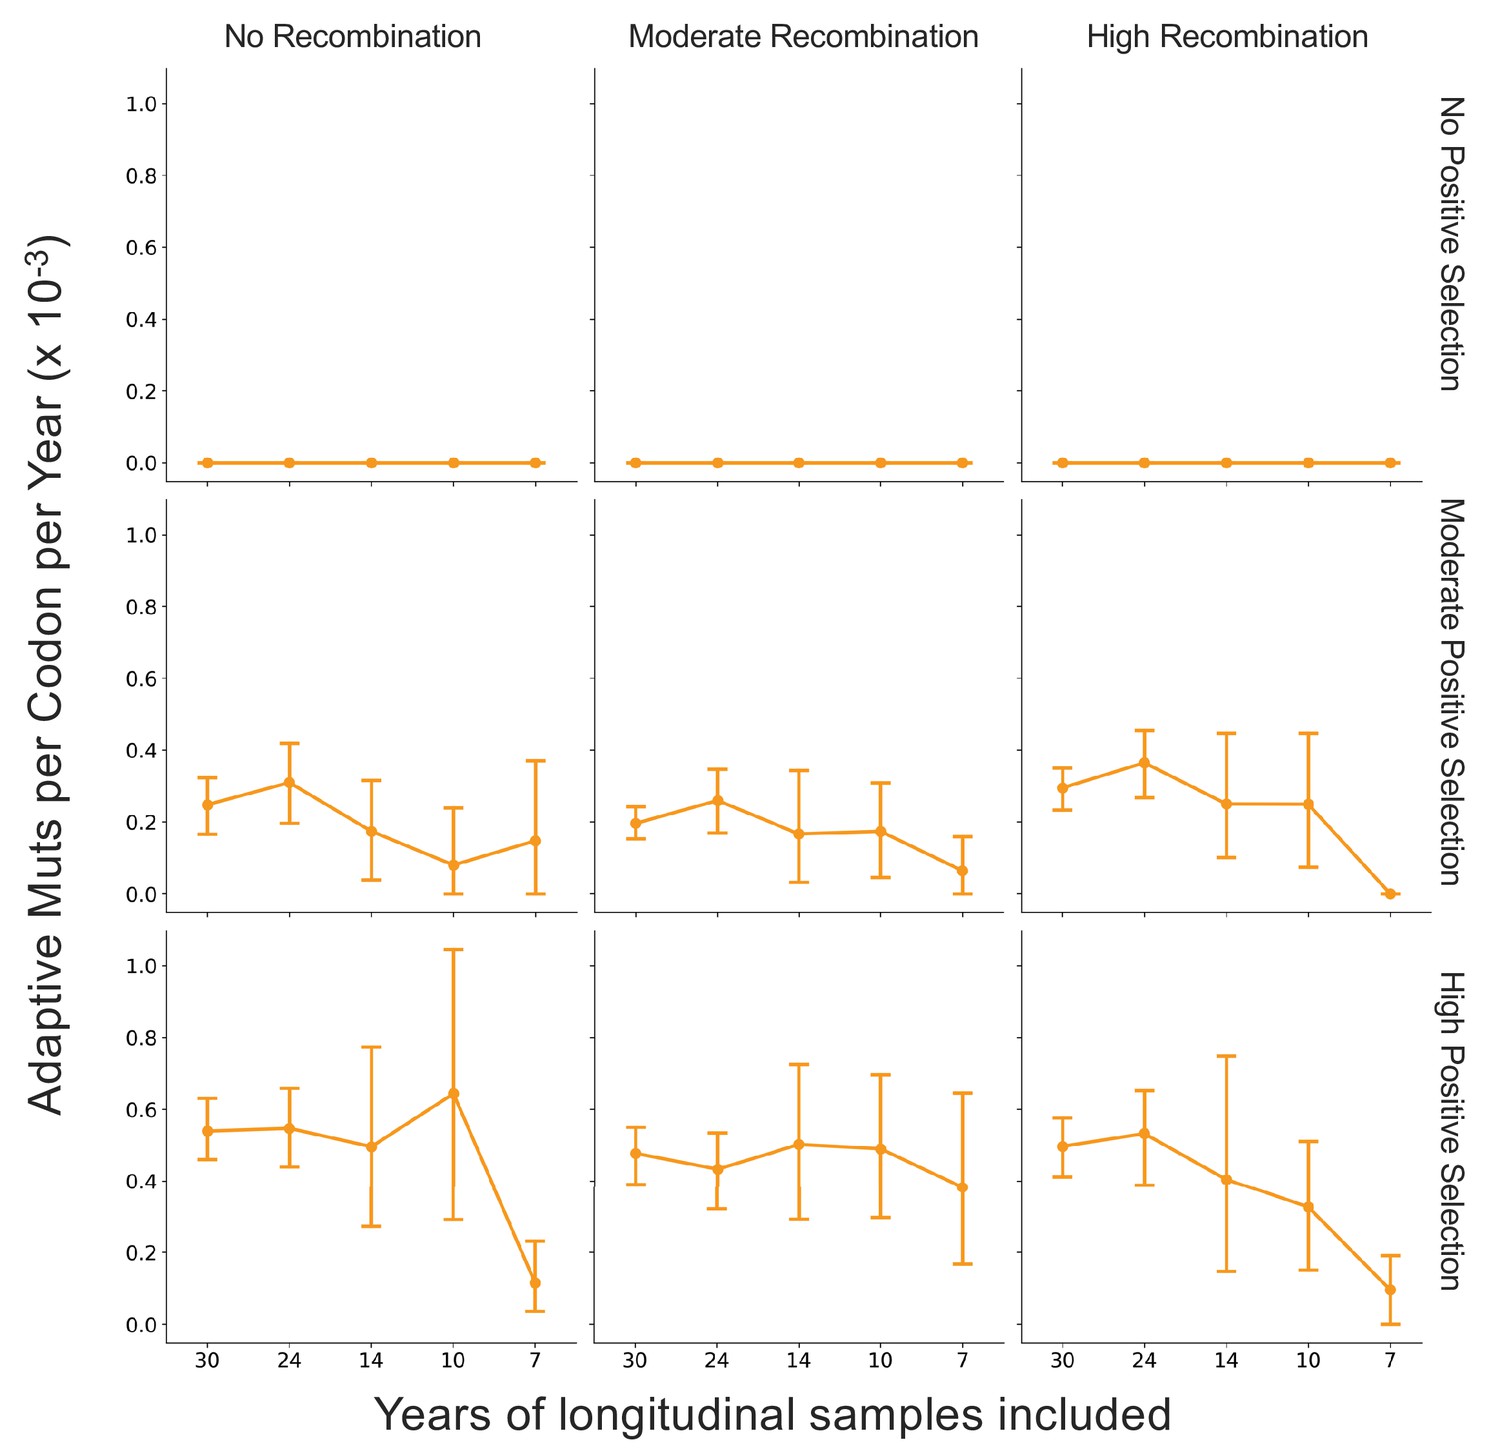
Fewer years of longitudinally sampled isolates reduces ability to detect rate of adaptation.
OC43 lineage A S1 sequences were simulated under conditions of no, moderate, and high rates of recombination in combination with no, moderate, or high strength of positive selection. The Bhatt method was used to calculate the ‘true’ rate of adaptive evolution under each of these scenarios using all available simulated sequence data (30 years), or the estimated rate if only the most recent 24, 14, 10, or 7 years of simulated sequences were used. The mean and 95% confidence intervals of 10 independent simulations are plotted.
Figure 7—figure supplement 2
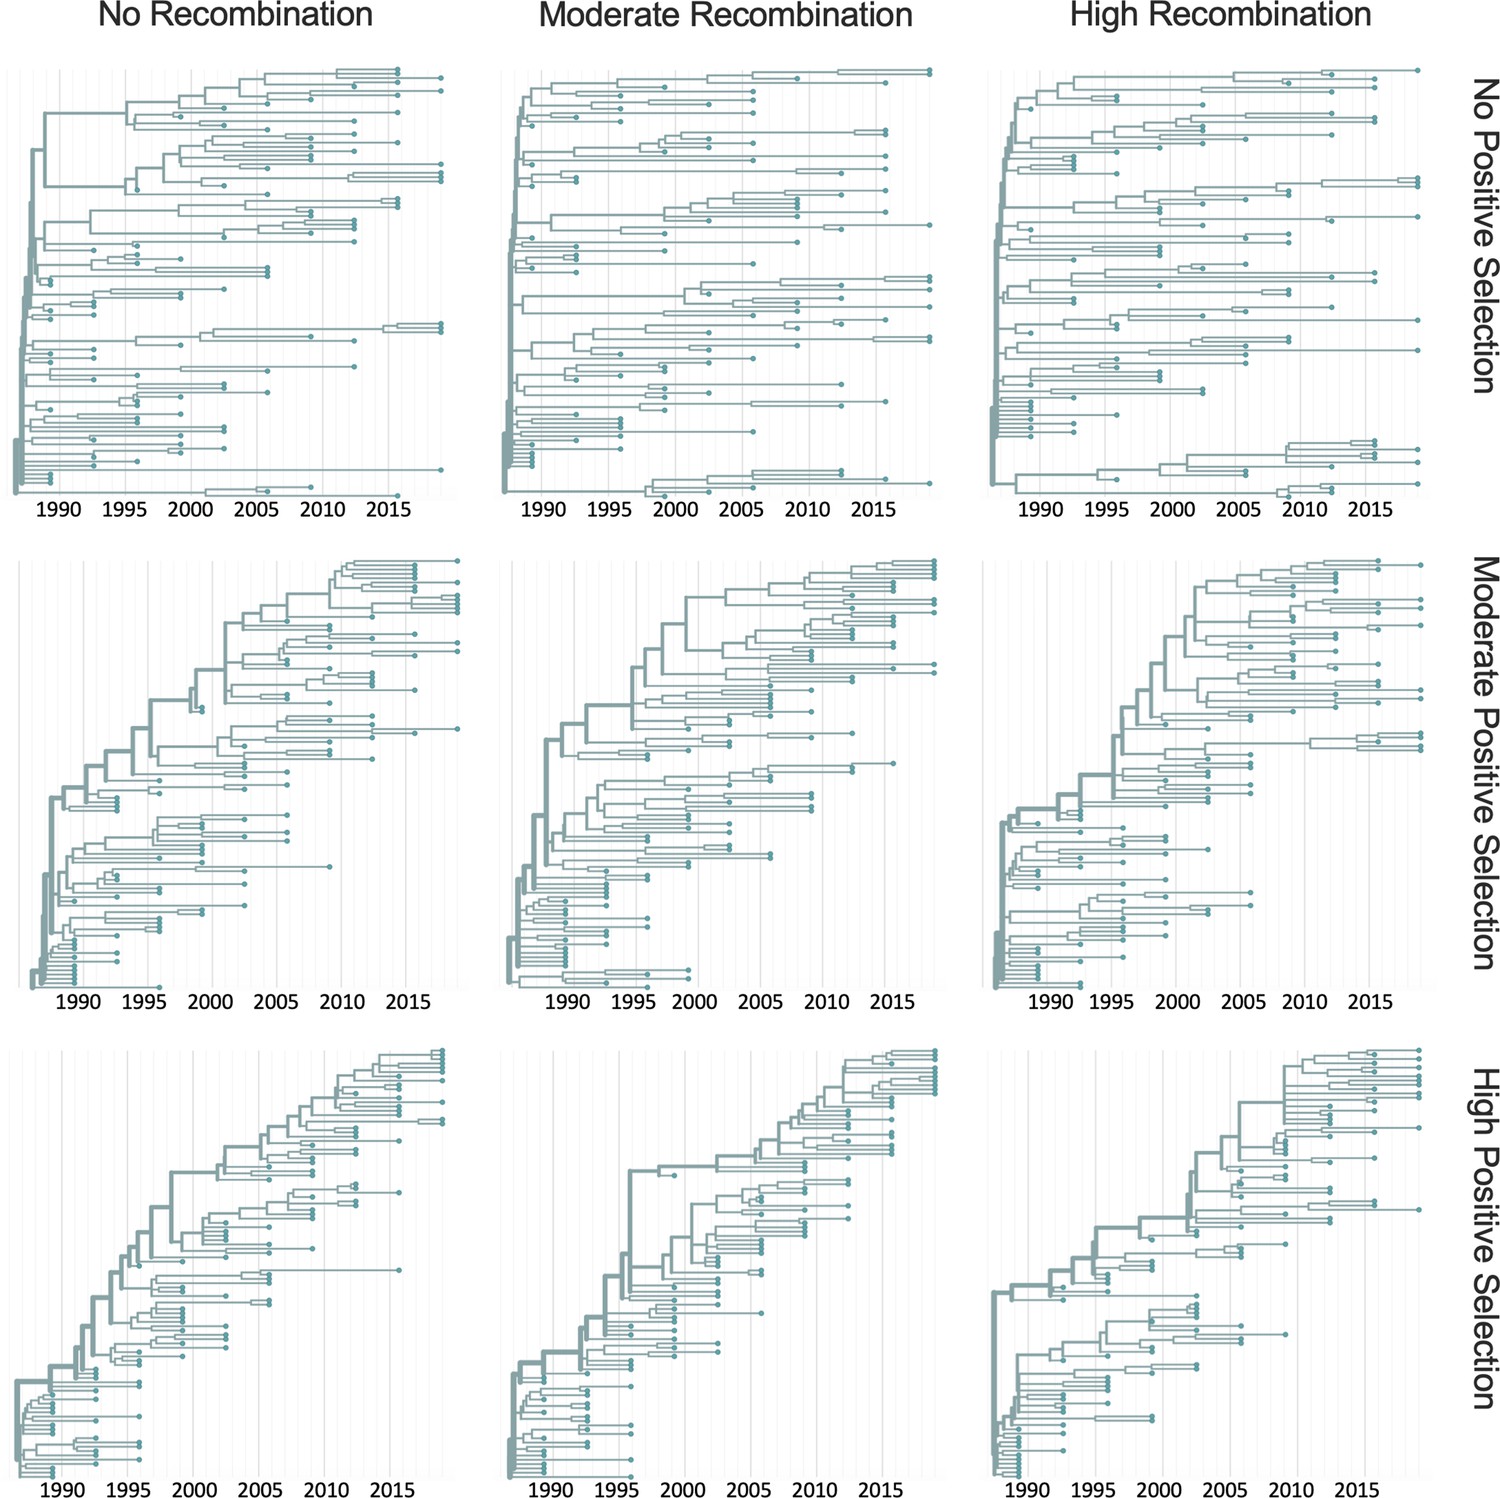
Representative phylogenies of simulated spike data.
OC43 lineage A spike sequence evolution was simulated under conditions of no, moderate, and high rates of recombination in combination with no, moderate, or high strength of positive selection. This figure shows time-resolved phylogenies built from 1 of the 10 independent simulations under each recombination/selection regime.
Tables
Table 1
dN/dS is lower in spike than RdRp.
A single dN/dS value was computed for gene (or spike domain) and each human coronavirus (HCoV) using mixed effects model of evolution (MEME).
| RdRp | Spike | S1 | S2 | |
|---|---|---|---|---|
| 229E | 0.143 | 0.441 | 0.662 | 0.166 |
| OC43 lineage A | 0.080 | 0.435 | 0.466 | 0.301 |
| OC43 lineage B | 0.061 | 0.317 | 0.418 | 0.234 |
| NL63 | 0.068 | 0.139 | 0.121 | 0.038 |
Table 2
Mean Time to Most Recent Common Ancestor (TMRCA) is lower in S1 than RdRp or S2.
Average TMRCA values (in years) for OC43 lineage A and 229E. The 95% confidence intervals are indicated in parentheses below mean TMRCA values.
| Spike | S1 | S2 | RdRp | |
|---|---|---|---|---|
| OC43 lineage A | 4.67 (4.04, 5.28) | 3.45 (2.86, 4.05) | 13.05 (11.24, 14.97) | 17.39 (15.63, 19.15) |
| 229E | 4.19 (3.13, 5.25) | 2.23 (1.76, 2.69) | 5.08 (3.93, 6.23) | 4.86 (4.04, 5.69) |
Additional files
Download links
A two-part list of links to download the article, or parts of the article, in various formats.
Downloads (link to download the article as PDF)
Open citations (links to open the citations from this article in various online reference manager services)
Cite this article (links to download the citations from this article in formats compatible with various reference manager tools)
Evidence for adaptive evolution in the receptor-binding domain of seasonal coronaviruses OC43 and 229e
eLife 10:e64509.
https://doi.org/10.7554/eLife.64509


