Occurrence of foamy macrophages during the innate response of zebrafish to trypanosome infections
- Cell Biology and Immunology Group, Department of Animal Sciences, Wageningen University & Research, Netherlands
- Experimental Zoology Group, Department of Animal Sciences, Wageningen University & Research, Netherlands
- DIMNP, CNRS, University of Montpellier, France
- Aquaculture and Fisheries Group, Department of Animal Sciences, Wageningen University & Research, Netherlands
Figures
Figure 1
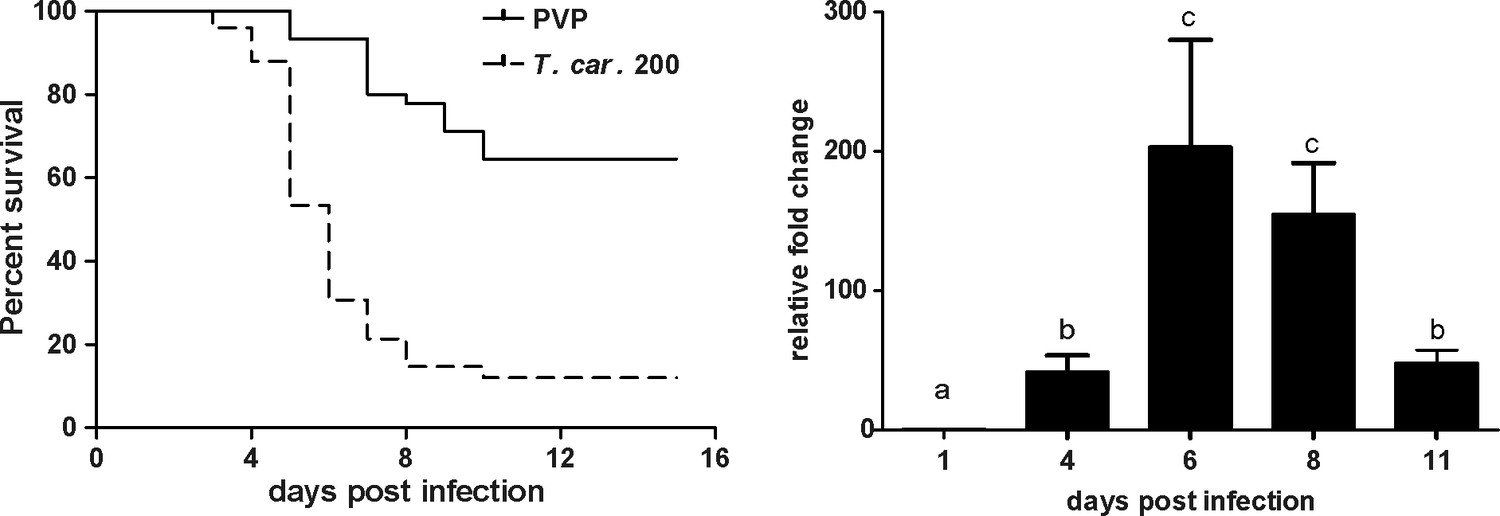
T. carassii infection of larval zebrafish.
(A) Tg(mpeg1:mCherry-F;mpx:GFP) larvae (5 dpf) were injected intravenously with n = 200 T. carassii/fish or with PVP as control and survival was monitored over a period of 15 days. (B) Tg(mpeg1:mCherry-F;mpx:GFP) zebrafish (5 dpf) were treated as in A and sampled at various time points. At each time point, three pools of 3–5 larvae were sampled for real-time quantitative PCR analysis. Relative fold change of the T. carassii-specific heat-shock protein-70 (hsp70) was normalised to the zebrafish-specific ef1α and expressed relative to the trypanosome-injected group at time point zero. Bars indicate average and standard deviation (SD) on n = 3 pools per time point. Letters indicate significant differences (p<0.05), as assessed using One-way ANOVA followed by Tukey’s multiple comparisons test.
-
Figure 1—source data 1
T. carassii infection of larval zebrafish.
- https://cdn.elifesciences.org/articles/64520/elife-64520-fig1-data1-v2.xlsx
Figure 2 with 1 supplement
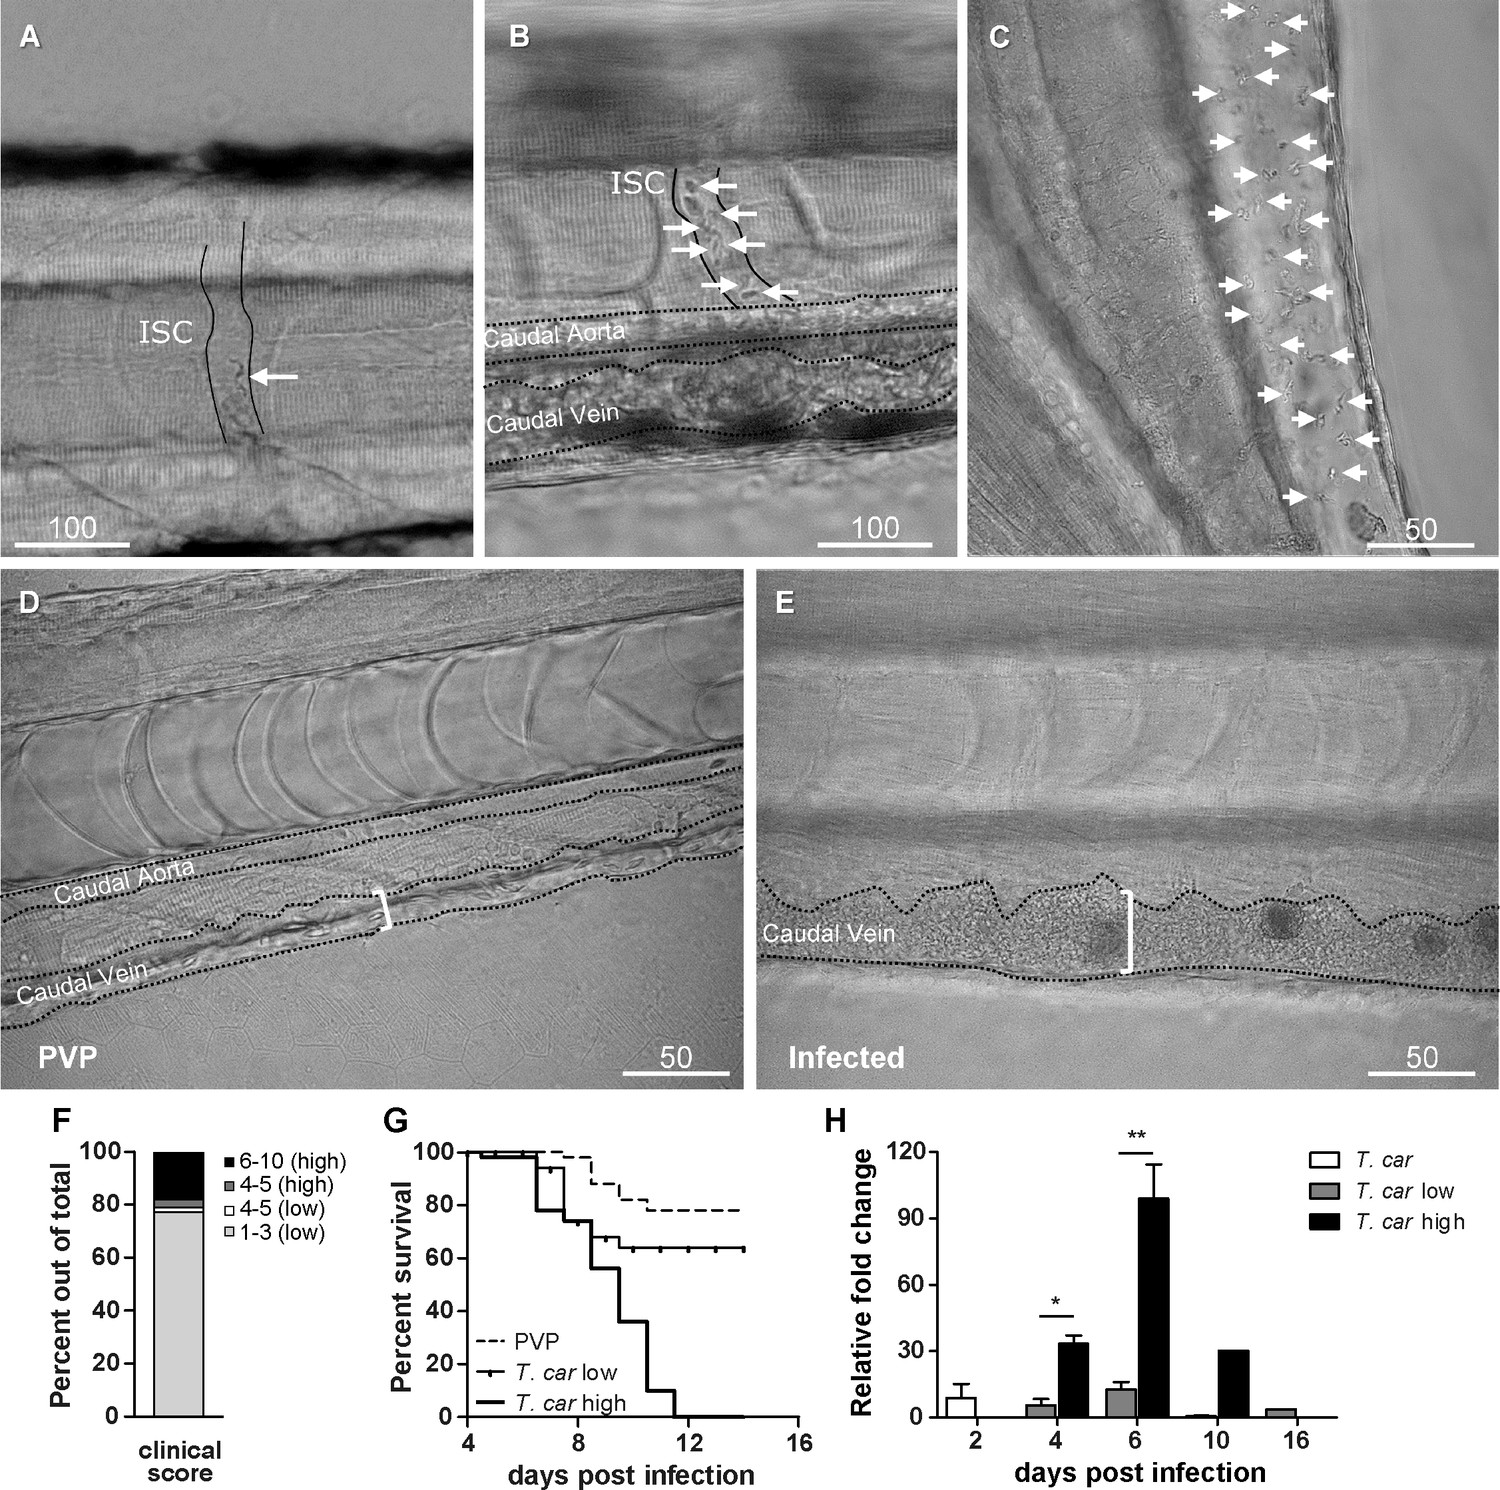
Progression of T.carassii infection in zebrafish larvae.
Tg(mpeg1:mCherry-F;mpx:GFP) 5 dpf zebrafish were injected intravenously with n = 200 T. carassii or with PVP and imaged at 2 dpi (A), 5 dpi (B-C), 7 dpi (D-E). Shown are representative images of intersegmental capillaries (ISC) containing various numbers of T. carassii (white arrows) (A-B); extravasated T. carassii (only some indicated with white arrows) in the intraperitoneal cavity (C); caudal vein diameter in PVP (D) or in T. carassii-infected larvae (E). Square brackets indicate the diameter of the caudal vein. Whenever visible, the caudal aorta is also indicated. Images are extracted from high-speed videos acquired with a Leica DMi8 inverted microscope at a ×40 magnification. (F) Tg(mpeg1:mCherry-F;mpx:GFP) were injected intravenously at 5 dpf with n = 200 T. carassii and at 4 dpi the number of low-infected (clinical scores 1–3) or high-infected (score 6–10) was determined. Larvae scored between 4 and 5 were re-evaluated at 5 dpi. The bar indicates the proportion of larvae assigned to each group out of a total of 350 infected individual. (G) Tg(mpeg1:mCherry-F;mpx:GFP) were injected intravenously at 5 dpf with n = 200 T. carassii or with PVP. At 4 dpi, larvae were separated in high- and low-infected individuals (50 larvae per group) based on our clinical scoring criteria and survival was monitored over a period of 14 days. (H) Tg(mpeg1:mCherry-F;mpx:GFP) were treated as described in (G). At each time point, three pools of 3–5 larvae were sampled for subsequent real-time quantitative gene expression analysis. Each data point represents the mean of three pools, except for the low-infected group at 16 dpi and high-infected group at 10 dpi where only two and one pool could be made, respectively. Relative fold change of the T. carassii-specific hsp70 was normalised relative to the zebrafish-specific ef1α housekeeping gene and expressed relative to the trypanosome-injected group at time point zero.
-
Figure 2—source data 1
Progression of T. carassii infection in zebrafish larvae.
- https://cdn.elifesciences.org/articles/64520/elife-64520-fig2-data1-v2.xlsx
Figure 2—figure supplement 1
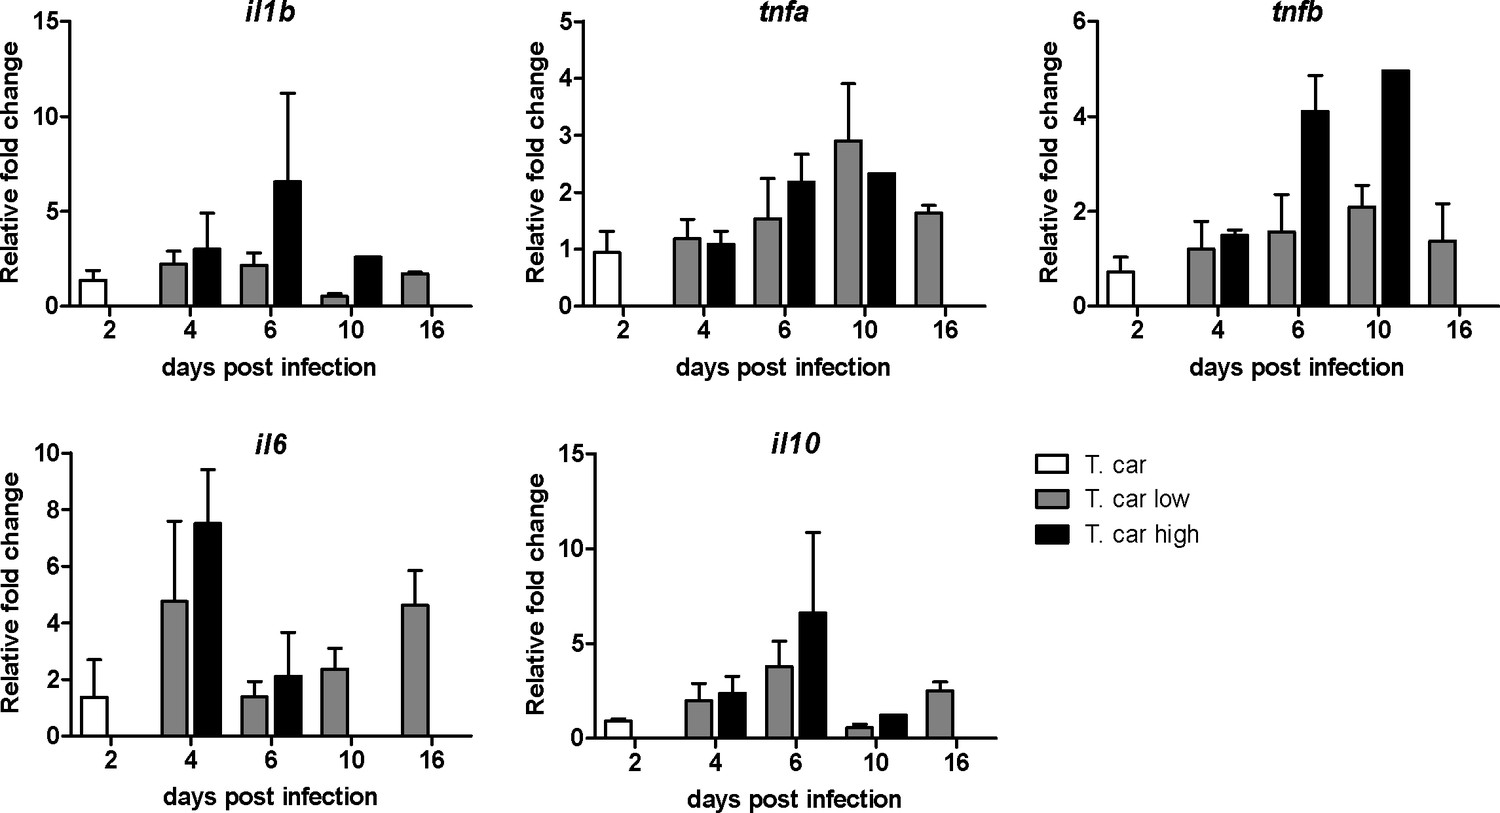
Differential gene expression in high- and low-infected individuals.
Tg(mpeg1:mCherryF;mpx:GFP) were injected intravenously at 5 dpf with n = 200 T. carassii or with PVP. At 4 dpi, larvae were separated in high- and low-infected individuals based on our clinical scoring criteria. At each time point, three pools of 3–5 larvae were sampled for subsequent real-time quantitative gene expression analysis. Each data point represents the mean of three pools, except for the high-infected group at 10 dpi where only one pool could be made due to low survival. Relative fold change was normalised relative to the zebrafish-specific ef1α housekeeping gene and expressed relative to the PVP-injected group at each time point.
-
Figure 2—figure supplement 1—source data 1
Differential gene expression in high- and low-infected individuals.
- https://cdn.elifesciences.org/articles/64520/elife-64520-fig2-figsupp1-data1-v2.xlsx
Figure 3
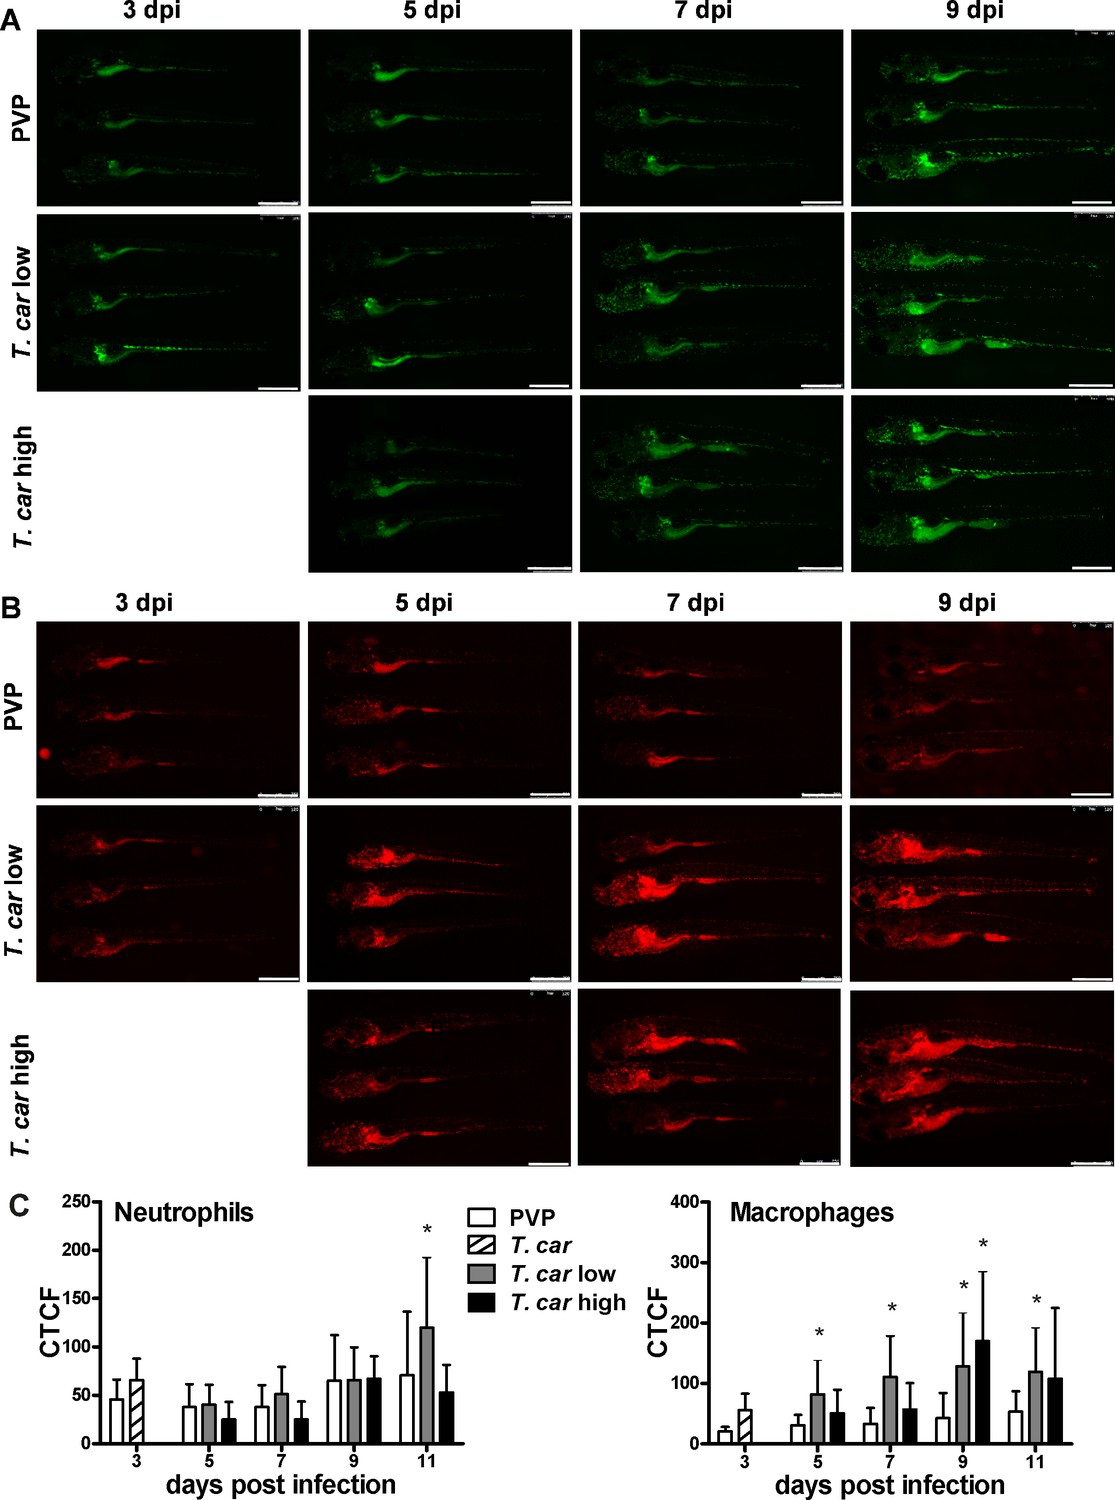
Macrophages respond more prominently than neutrophils to T. carassii infection.
Tg(mpeg1:mCherry-F;mpx:GFP) were injected intravenously at 5 dpf with n = 200 T. carassii or with PVP. At 4 dpi, larvae were separated in high- and low-infected individuals. (A–B) At the indicated time points, images were acquired with Leica M205FA Fluorescence Stereo Microscope with 1.79x zoom. Images are representatives of n = 5–47 larvae per group, depending on the number of high- or low-infected larvae categorised at each time point, derived from two independent experiments. Scale bar indicates 750 μm. (C) Corrected Total Cell Fluorescence (CTCF) quantification of infected and non-infected larvae. Owing to the high auto-fluorescence, the gut area was excluded from the total fluorescence signal as described in the Materials and methods section. Bars represent average and standard deviation of red and green fluorescence in n = 5–47 whole larvae, from two independent experiments. * indicates significant differences (p<0.05) to the respective PVP control as assessed by Two-Way ANOVA followed by Bonferroni post-hoc test.
-
Figure 3—source data 1
Macrophages respond more prominently than neutrophils to T. carassii infection.
- https://cdn.elifesciences.org/articles/64520/elife-64520-fig3-data1-v2.xlsx
Figure 4 with 1 supplement
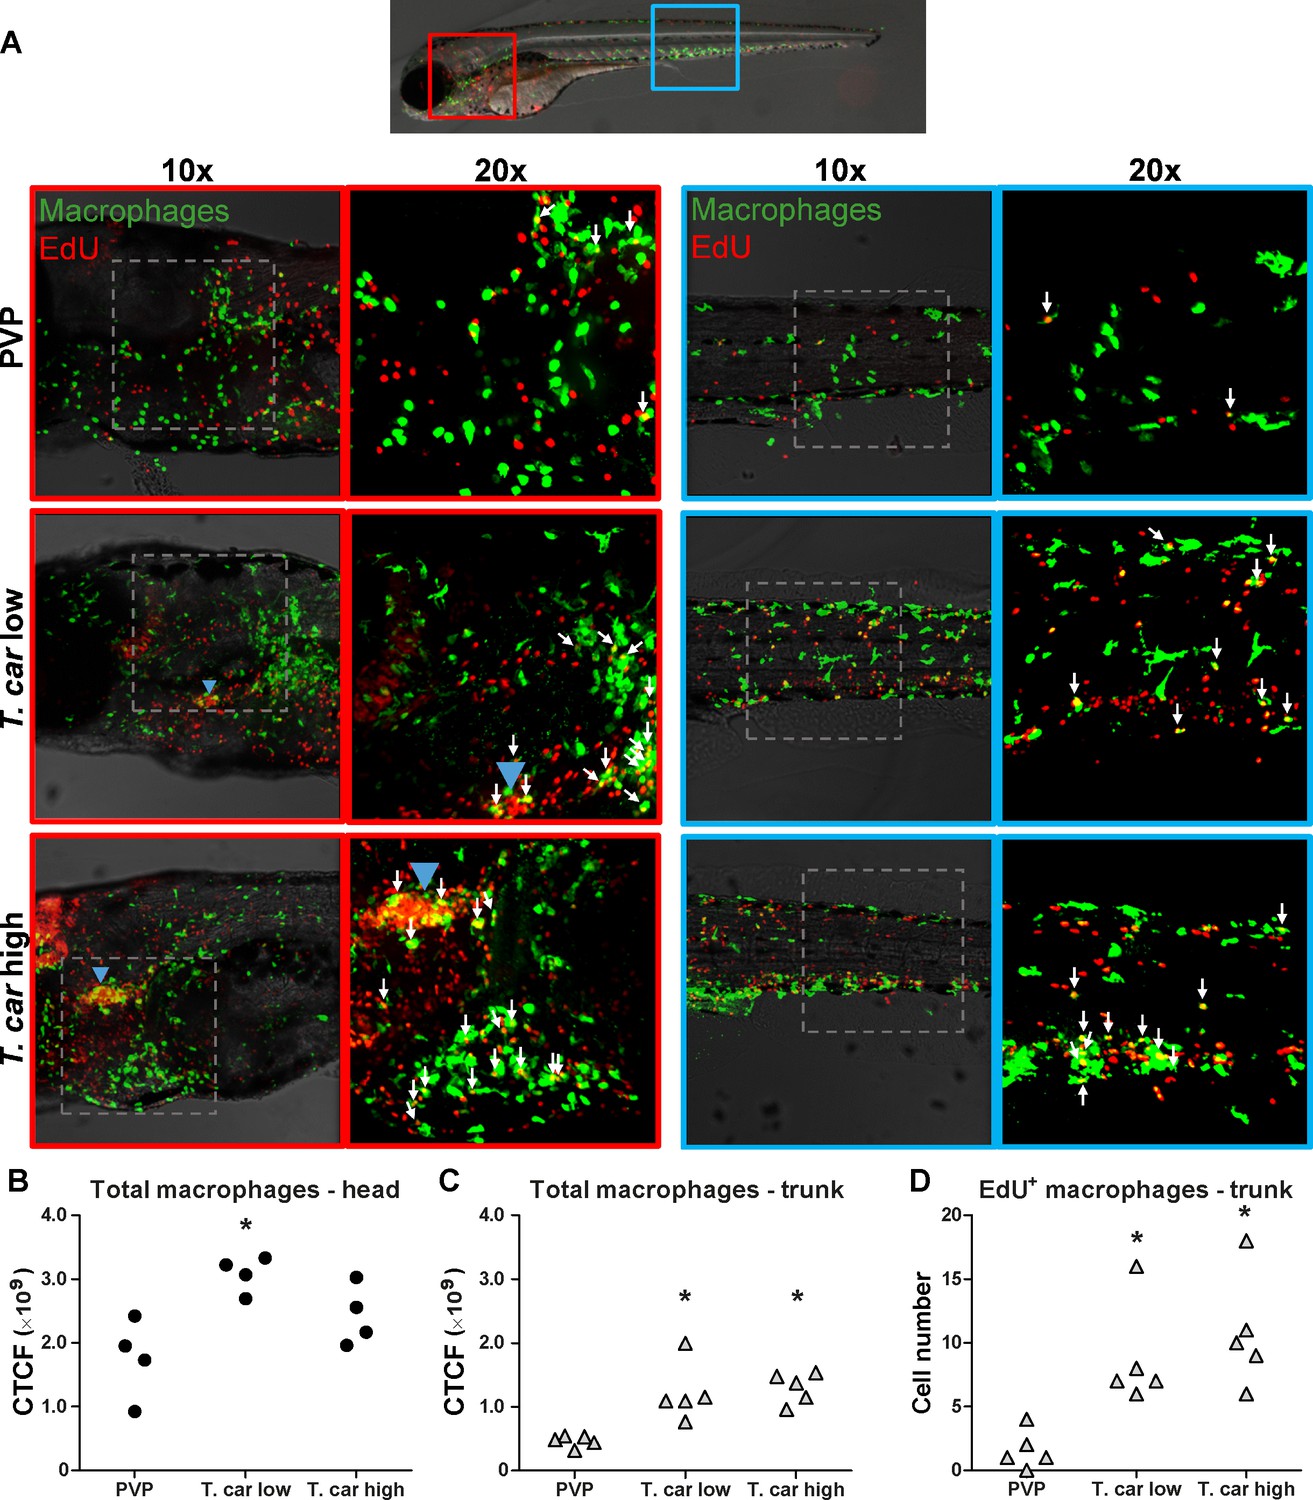
T. carassii infection triggers macrophage division.
(A) Tg(mpeg1:eGFP) zebrafish larvae were infected intravenously at 5 dpf with n = 200 T. carassii or with PVP control. At 3 dpi, larvae received 2 nl 1.13 mM iCLICKTM EdU, at 4 dpi were separated in high- and low-infected individuals and were imaged after fixation and whole mount immunohistochemistry 6–8 hr later (30–32 hr after EdU injection, ~9 dpf). Larvae were fixed and treated with iCLICK EdU ANDY FLUOR 555 (Red) development to identify EdU+ nuclei and with anti-GFP antibody to retrieve the position of macrophages, as described in the Materials and methods section. Larvae were imaged with Andor Spinning Disc Confocal Microscope using ×10 and ×20 magnifications. Maximum projections of the head (left panels, red boxes) and trunk (right panels, blue boxes) regions of one representative individual in PVP control, low- and high-infected zebrafish. Images capture macrophages (green) and EdU+ nuclei (red). In the PVP control group, EdU+ nuclei and GFP+ macrophages only rarely overlapped (white arrows, 20x), indicating limited proliferation of macrophages. In high- and low-infected individuals, the number of EdU+ macrophages increased (white arrows, 20x), indicating proliferation of macrophages in response to T. carassii infection. Blue arrowhead in the head of low and high-infected larvae, indicates the position of the thymus, an actively proliferating organ at this time point. The identification of EdU+ macrophages (white arrows) was performed upon detailed analysis of the separate stacks used to generate the overlay images, and are provided in Video 2. (B–C) Corrected total cell fluorescence (CTCF) calculated in the head (B) and trunk (C) region of larvae described in A. Symbols indicate individual larvae (n = 4–5 per group from two independent experiments). * indicates significant differences to the PVP control as assessed by One-Way ANOVA followed by Bonferroni post-hoc test. (D) Tg(mpeg1:eGFP) zebrafish larvae were treated as described in A and the number of EdU+ macrophages in the trunk region of PVP, low- and high-infected larvae was calculated. Symbols indicate individual larvae (n = 5 per group from two independent experiments). * indicates significant differences to the PVP control as assessed by One-Way ANOVA followed by Bonferroni post-hoc test.
-
Figure 4—source data 1
T. carassii infection triggers macrophage division.
- https://cdn.elifesciences.org/articles/64520/elife-64520-fig4-data1-v2.xlsx
Figure 4—figure supplement 1
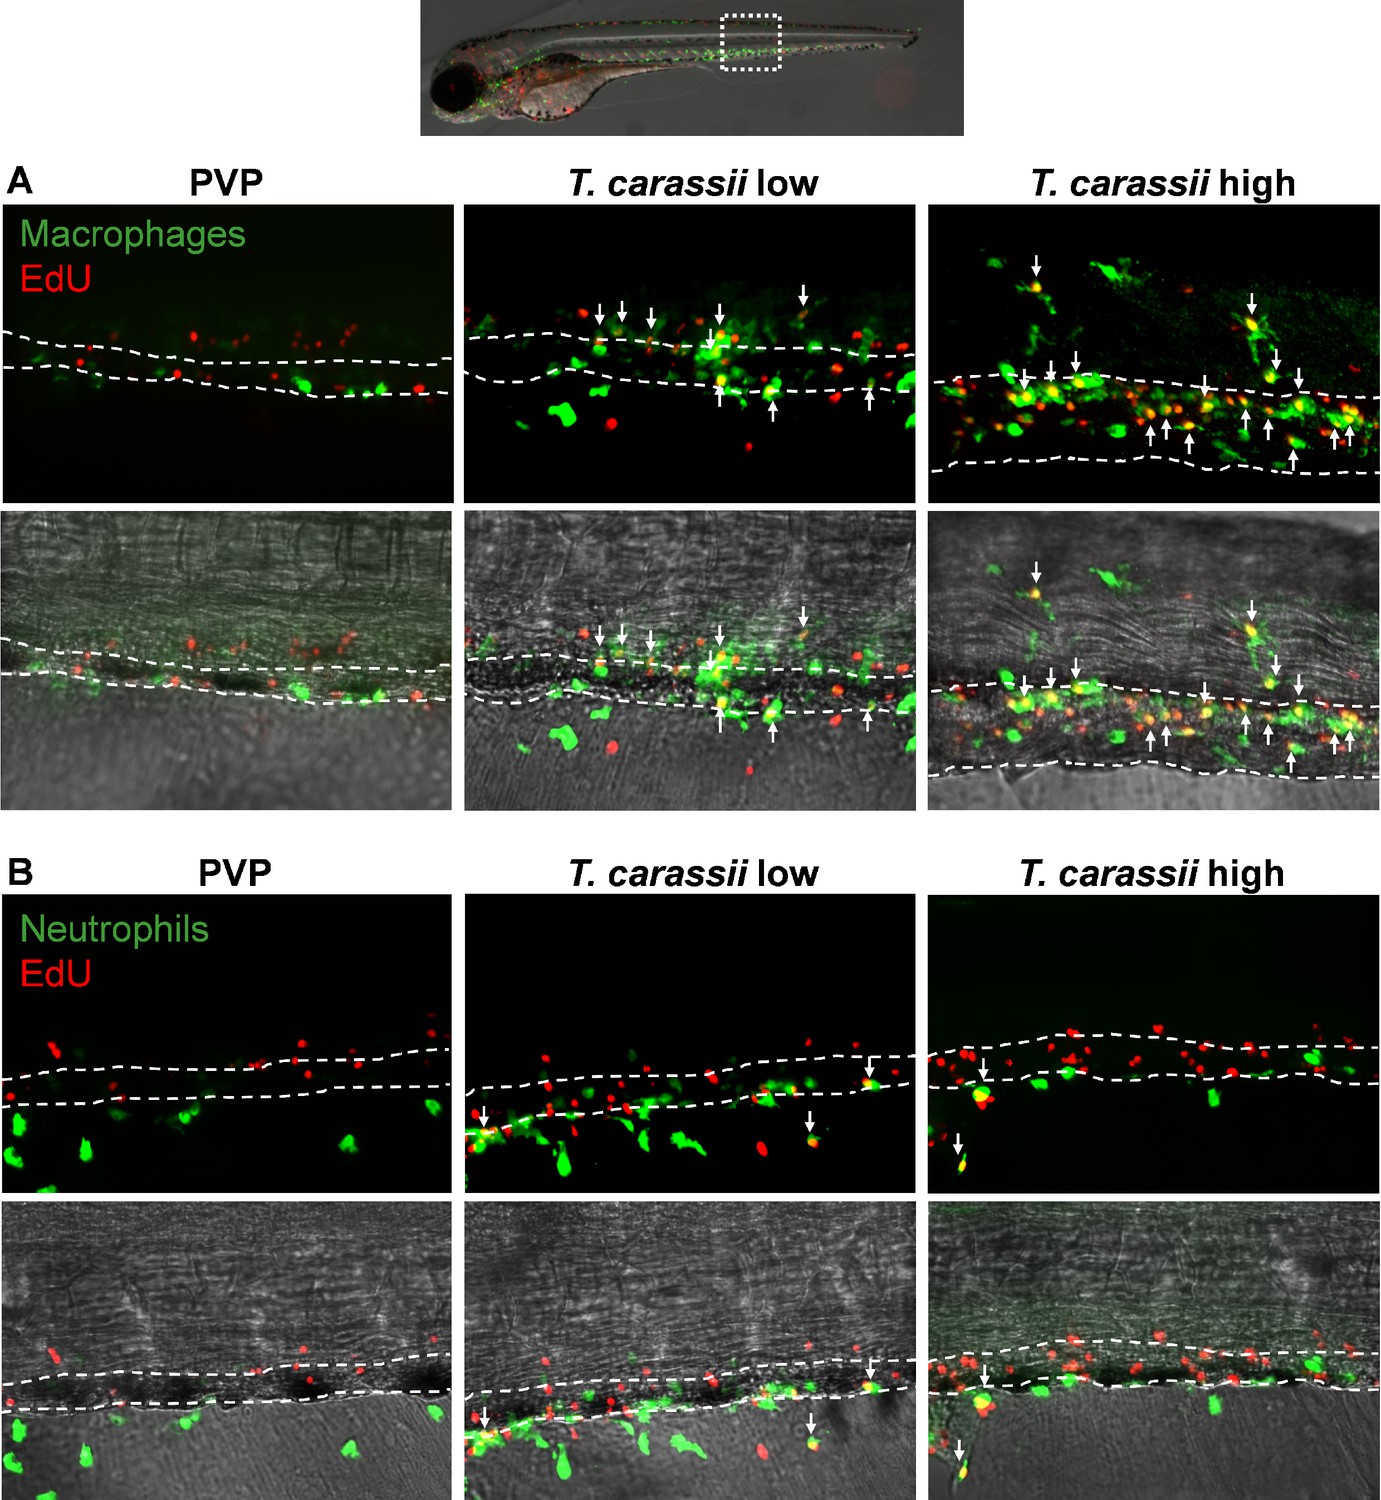
Differential distribution of EdU+macrophages and neutrophils along the caudal vein of high- and low-infected larvae.
Zebrafish were treated as described in Figure 5. (A) A high number of macrophages can be seen around and inside the caudal vein of infected individuals. Especially in high-infected individuals, the majority of cells within the vessel was EdU+, suggesting that in these larvae, dividing macrophages migrated to the vessels. (B) Neutrophils were never observed within the caudal vein and, independently of whether they divided (EdU+) or not, were mostly observed outside or lining the vessel.
Figure 5
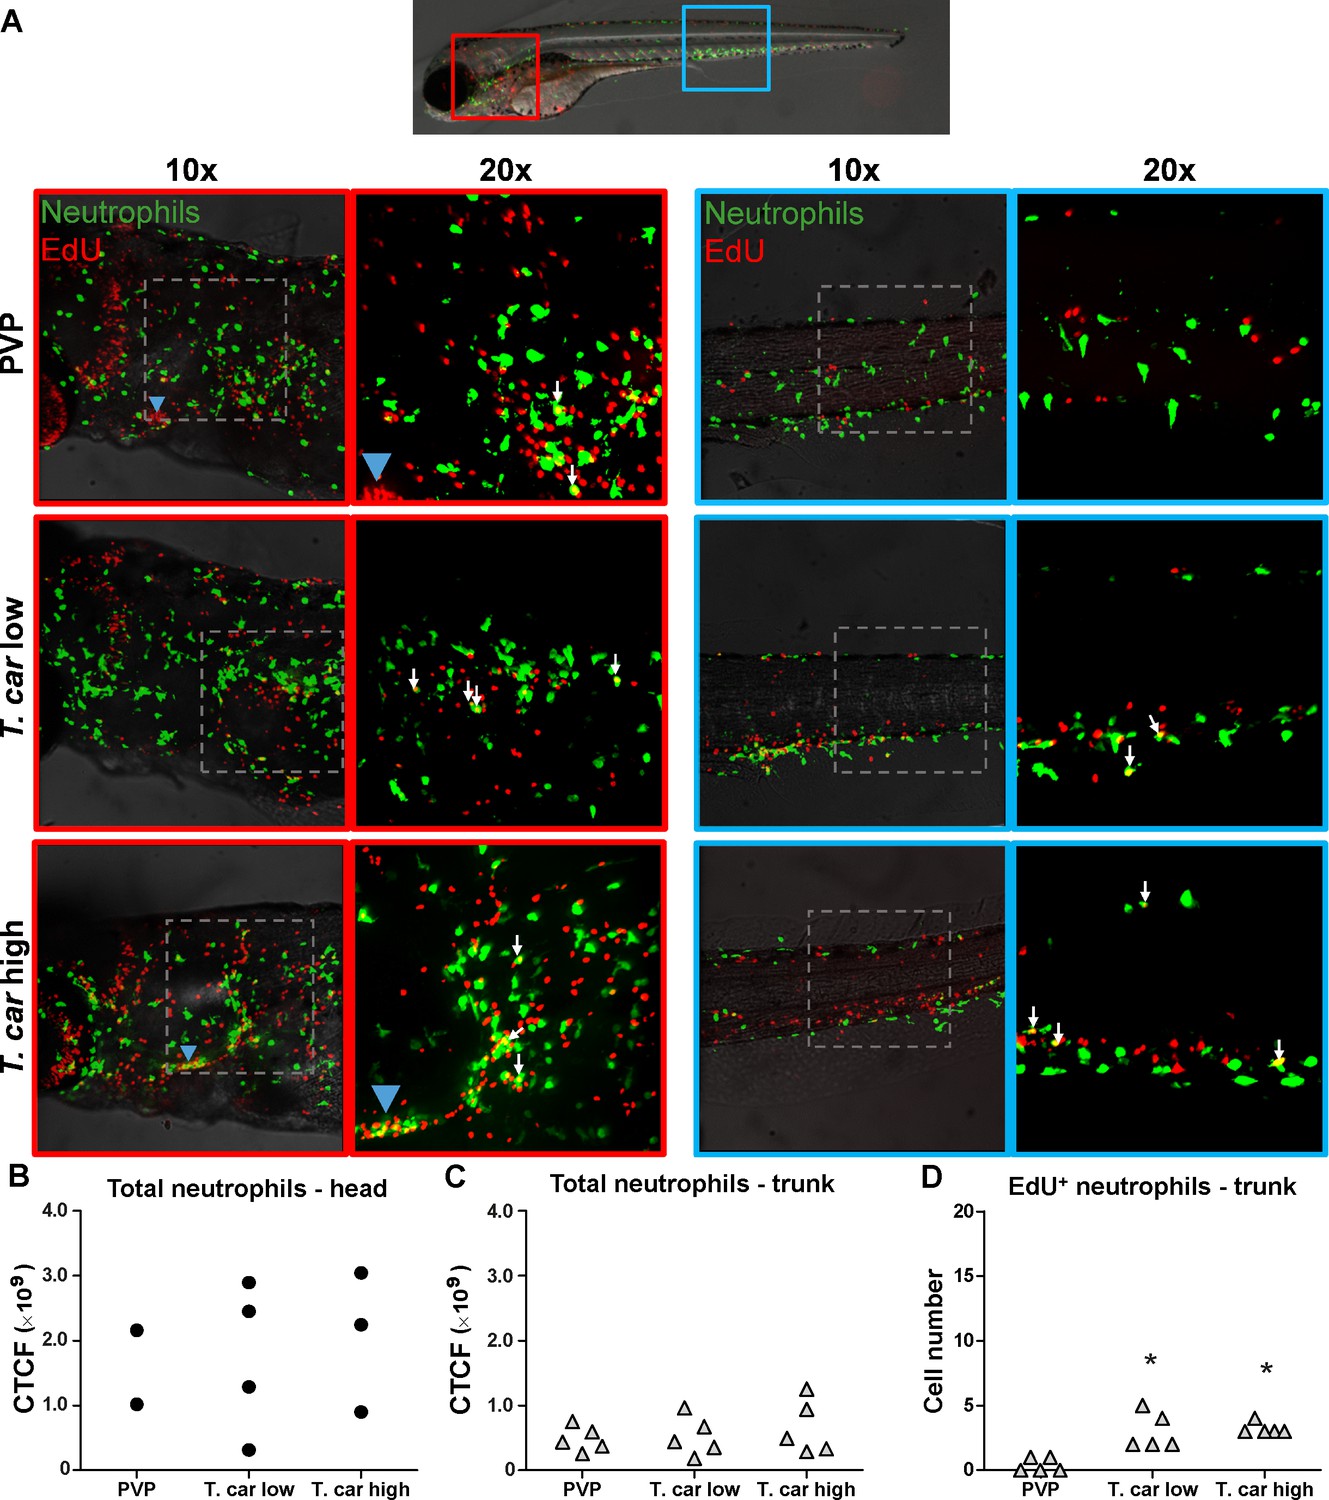
T. carassii infection triggers neutrophil division.
(A) Tg(mpx:GFP) were treated as described in Figure 4 (n = 4–5 larvae per group). Maximum projections of the head (left panels, red boxes) and trunk (right panels, blue boxes) regions of one representative individual in PVP, low- and high-infected zebrafish. Images capture neutrophils (green) and EdU+ nuclei (red). The images acquired at a ×20 magnification show that in all groups, EdU+ nuclei and GFP+ neutrophils only rarely overlapped (white arrows), and was marginally higher in infected than in non-infected PVP controls. Detailed analysis of the separate stacks selected to compose the overlay image of the head region of the high-infected larva (bottom left panel), revealed that none of the neutrophils in the area indicated by the blue arrowhead (thymus) were EdU+ (Video 3). (B–C) Corrected total cell fluorescence (CTCF) calculated in the head (B) and trunk (C) region of larvae described in A. Symbols indicate individual larvae (n = 4–5 per group from two independent experiments). ** indicates significant differences between CTCF in the head and trunk regions, as assessed by Two-Way ANOVA followed by Bonferroni post-hoc test. (D) Tg(mpx:GFP) were treated as described in A and the number of EdU+ neutrophils in the trunk region of PVP, low- and high-infected larvae was calculated. Symbols indicate individual larvae (n = 5 per group from two independent experiments). * indicates significant differences to the PVP control as assessed by One-Way ANOVA followed by Bonferroni post-hoc test.
-
Figure 5—source data 1
T. carassii infection triggers neutrophil division.
- https://cdn.elifesciences.org/articles/64520/elife-64520-fig5-data1-v2.xlsx
Figure 6
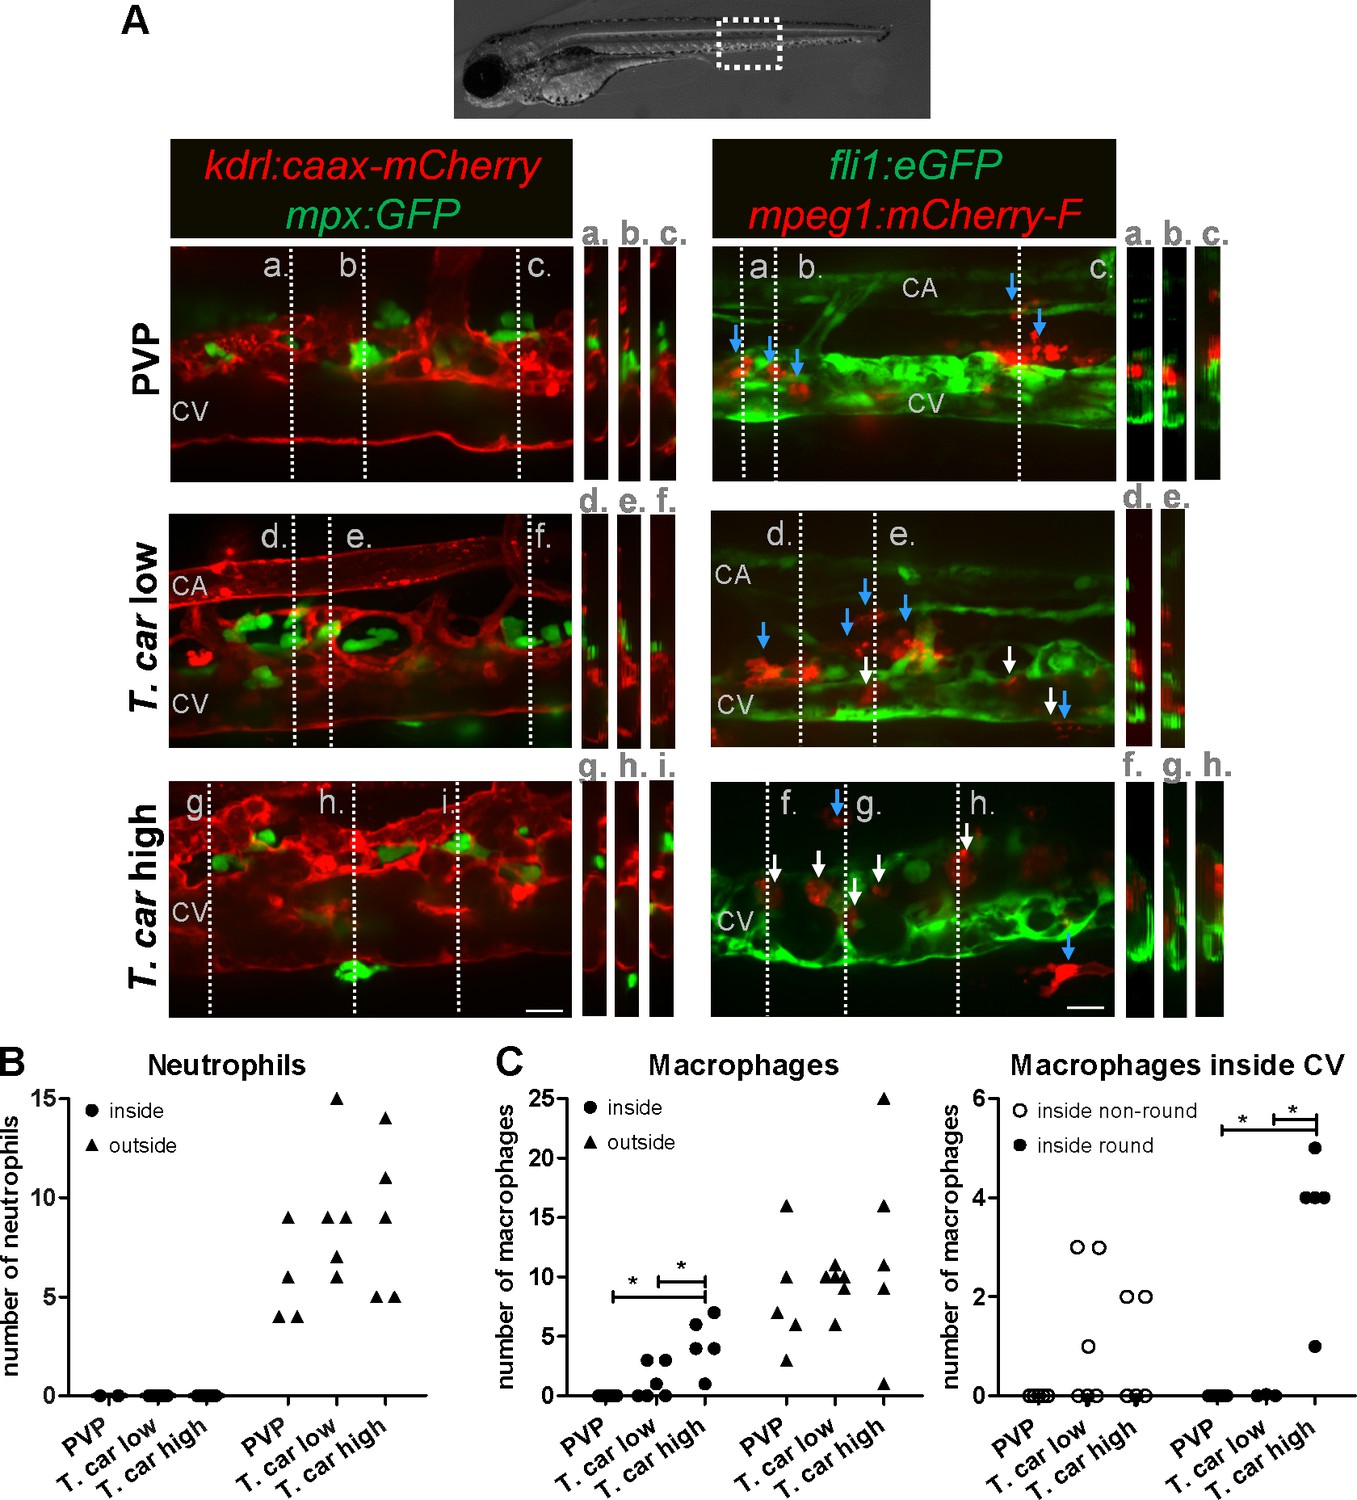
Macrophages are recruited into the cardinal caudal vein of high-infected zebrafish larvae.
Tg(kdrl:caax-mCherry;mpx:GFP) and Tg(fli1:eGFP x mpeg1:mCherry-F) zebrafish larvae were injected intravenously at 5 dpf with n = 200 T. carassii or with PVP. At 4 dpi larvae were separated in high- and low-infected groups and imaged with a Roper Spinning Disk Confocal Microscope using ×40 magnification. Scale bars indicate 25 μm. CA: caudal artery; CV: caudal vein. (A) Left panel: representative images of the longitudinal view of the caudal vessels (red), capturing the location of neutrophils (green). Orthogonal views of the locations marked with grey dashed lines (a,b,c,d,e,f,g,h,i), confirm that in all groups, neutrophils are present exclusively outside the vessels. Right panel: representative images of the longitudinal view of the vessels, capturing the position of macrophages (red) outside the vessels (blue arrowheads) or inside (white arrowheads) the caudal vein (green). Orthogonal views of the locations marked with grey dashed lines (a,b,c,d,e,f,g,h) confirm that in PVP controls, macrophages are present exclusively outside the vessels (blue arrows); in low-infected larvae, most macrophages are outside the vessels (blue arrows) having an elongated or dendritic morphology, although seldomly macrophages can also be observed within the caudal vein (white arrows); in high-infected larvae, although macrophages with dendritic morphology can be seen outside the vessels, the majority of the macrophages resides inside the caudal vein, clearly having a rounded morphology. Video 4 provides the stacks used for the orthogonal views. (B–C) quantification of the number of neutrophils (B) and macrophages (C) (left panel) inside or outside the caudal vein; of the macrophages observed inside in (C), we quantified the number of those with a round or non-round morphology C (right panel). Symbols indicate individual larvae (n = 4–6 larvae per group, from two independent experiments). * indicates significant differences as assessed by One-Way ANOVA, followed by Tukey’s post-hoc test.
-
Figure 6—source data 1
Macrophages are recruited into the cardinal caudal vein of high-infected zebrafish larvae.
- https://cdn.elifesciences.org/articles/64520/elife-64520-fig6-data1-v2.xlsx
Figure 7
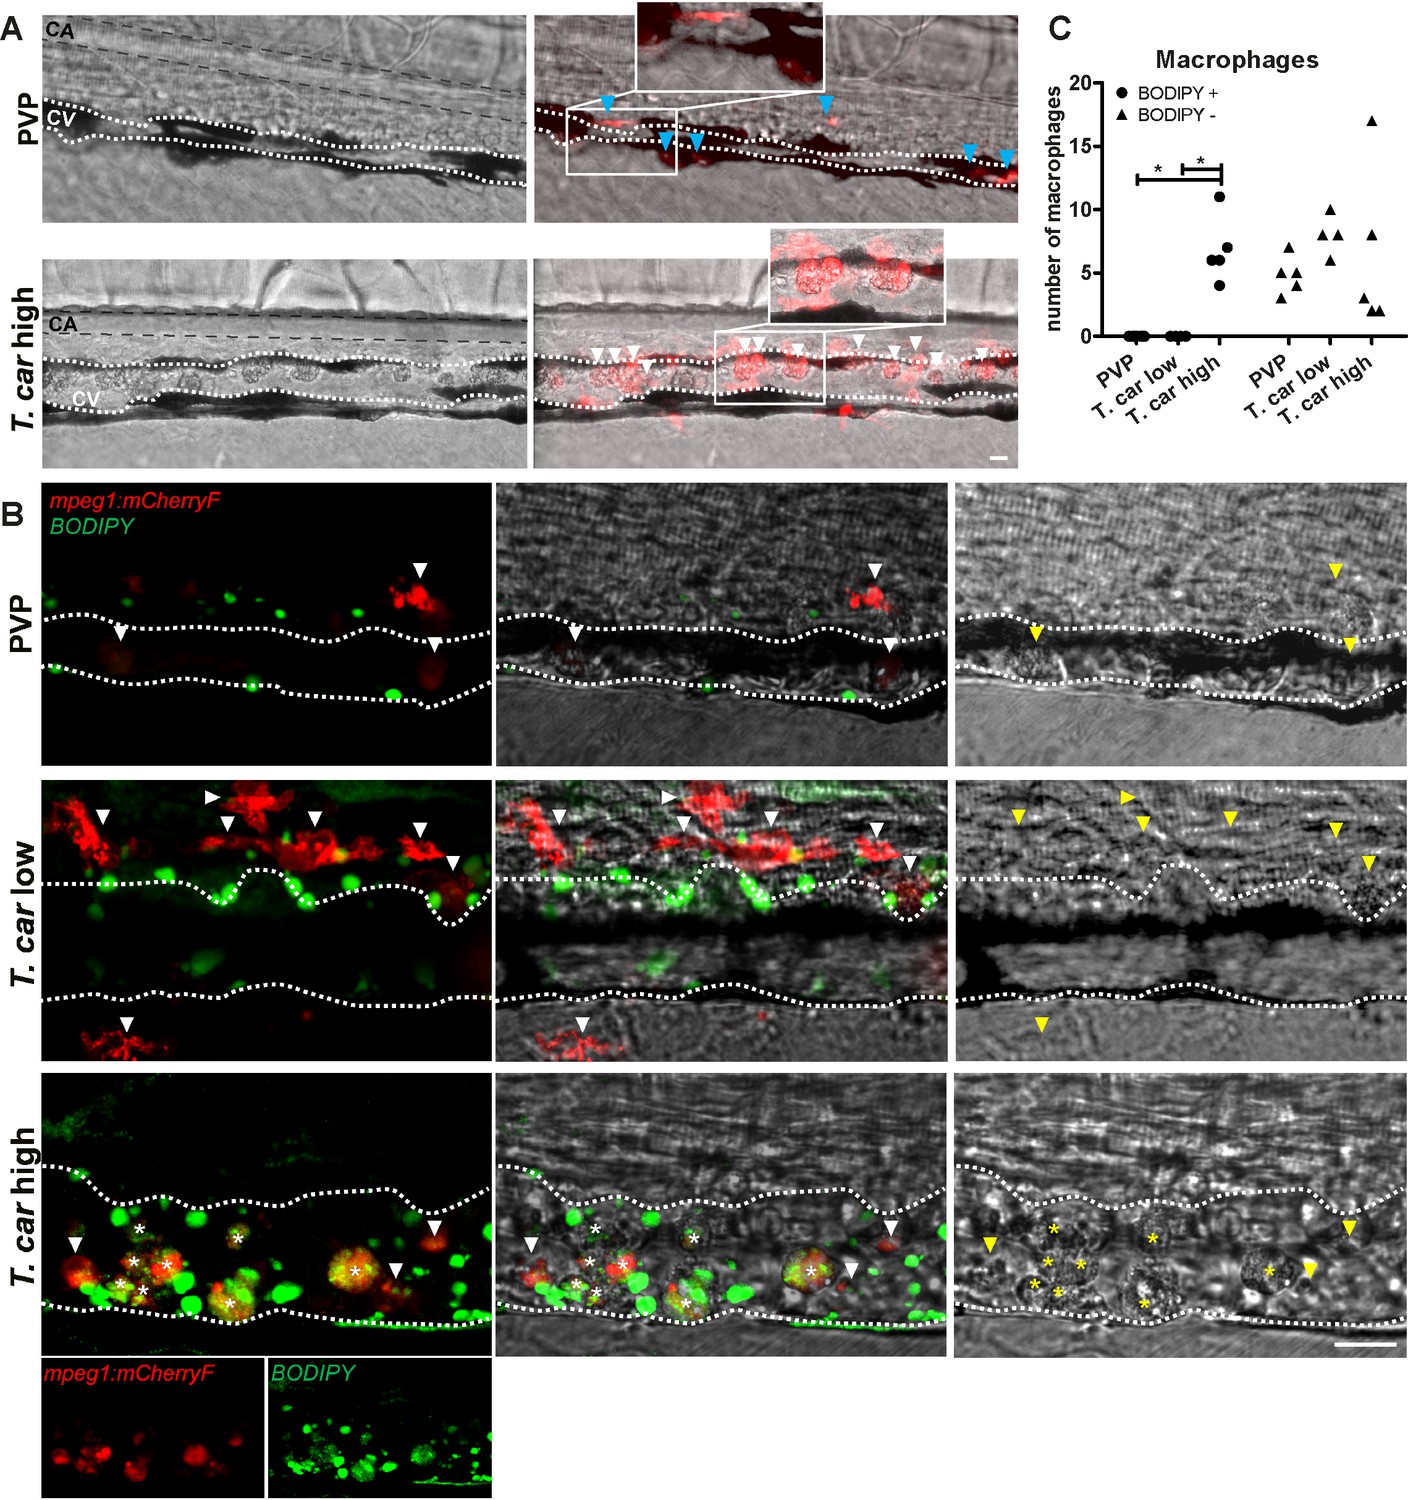
The large macrophages inside the caudal vein of high-infected zebrafish are foamy macrophages.
(A) Tg(mpeg1:mCherry-F;mpx:GFP) zebrafish larvae were infected intravenously at 5 dpf with n = 200 T. carassii or with PVP and imaged at 4 dpi using an Andor Spinning Disc Confocal Microscope at a ×20 magnification. Representative images from three independent experiments are shown, with blue arrowheads pointing at macrophages outside the caudal vein (CV) and white arrowheads indicating large round macrophages inside the caudal vein (white dashed line). Gray dashed line indicated the caudal aorta (CA). Note, how the large macrophages are readily visible in bright field images. Scale bar indicates 25 μm. (B) Tg(mpeg1:mCherry-F) were treated as in A (n = 5 larvae per group). At 3 dpi, larvae received 1 nl of 30 µM BODIPY-FLC5 and were imaged 18–20 hr later using a Roper Spinning Disc Confocal Microscope at a ×40 magnification. Representative images from three independent experiments are shown. *, indicate foamy macrophages: macrophages (red) that are also BODIPY+ (green). Note that foamy macrophages are present only in the vein of high-infected individuals. Arrowheads indicate non-foamy macrophages (BODIPY-). Scale bar indicates 25 μm. Video 6 provides the stacks used in B. (C) Tg(mpeg1:mCherry-F) were treated as in A and the number of macrophages positive for BODIPY was quantified. BODIPY+ macrophages are observed only in high-infected individuals. Symbols indicate individual larvae (n = 4–5 per group, from two independent experiments). * indicates significant differences as assessed by One-Way ANOVA, followed by Tukey’s post-hoc test.
-
Figure 7—source data 1
The large macrophages inside the caudal vein of high-infected zebrafish are foamy macrophages.
- https://cdn.elifesciences.org/articles/64520/elife-64520-fig7-data1-v2.xlsx
Figure 8
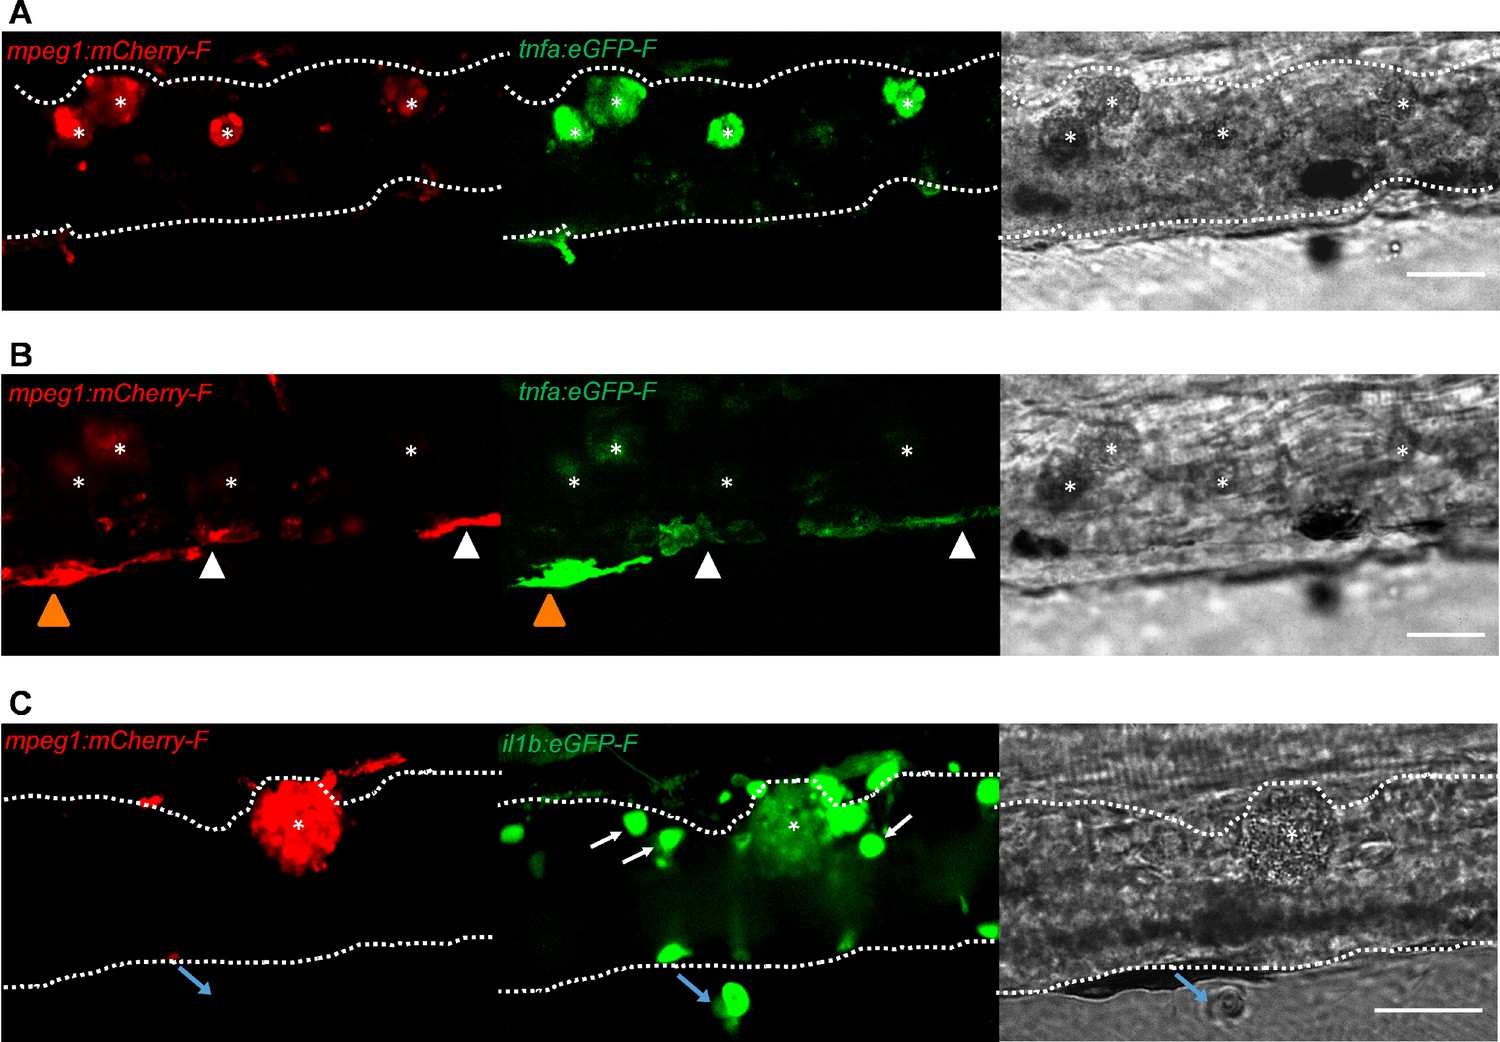
Foamy macrophages have an inflammatory profile.
Tg(tnfa:eGFP-F;mpeg1:mCherry-F) (A-B) or Tg(il1b:eGFP-F x mpeg1:mcherry-F) (C) zebrafish larvae (5dpf), were injected with n = 200 T. carassii or with PVP. At 4 dpi, high-infected individuals were imaged with an Andor (A-B) or Roper (C) Spinning Disk Confocal Microscope using ×40 magnification. Scale bar indicates 25 μm. Foamy macrophages (asterisks) were easily identified within the caudal vein (dashed lines) and were strongly positive for tnfa (A) and il1b (C) expression (GFP signal). (B) Same as A, but a few stacks up, focusing on the cells lining the endothelium. Macrophages that were partly inside and partly outside the vessel (yellow arrowhead) were also strongly positive for tnfa, whereas macrophages lining the outer endothelium had a lower tnfa expression (white arrowheads). (C) A foamy macrophage (asterisk) within the caudal vein (dashed lines) positive for il1b. Endothelial cells were also strongly positive for il1b, a selection of which is indicated by white arrows. A mCherry-negative-il1b positive cell is present outside the vessel (blue arrow). Given its position, it is likely a neutrophil.
Figure 9 with 1 supplement
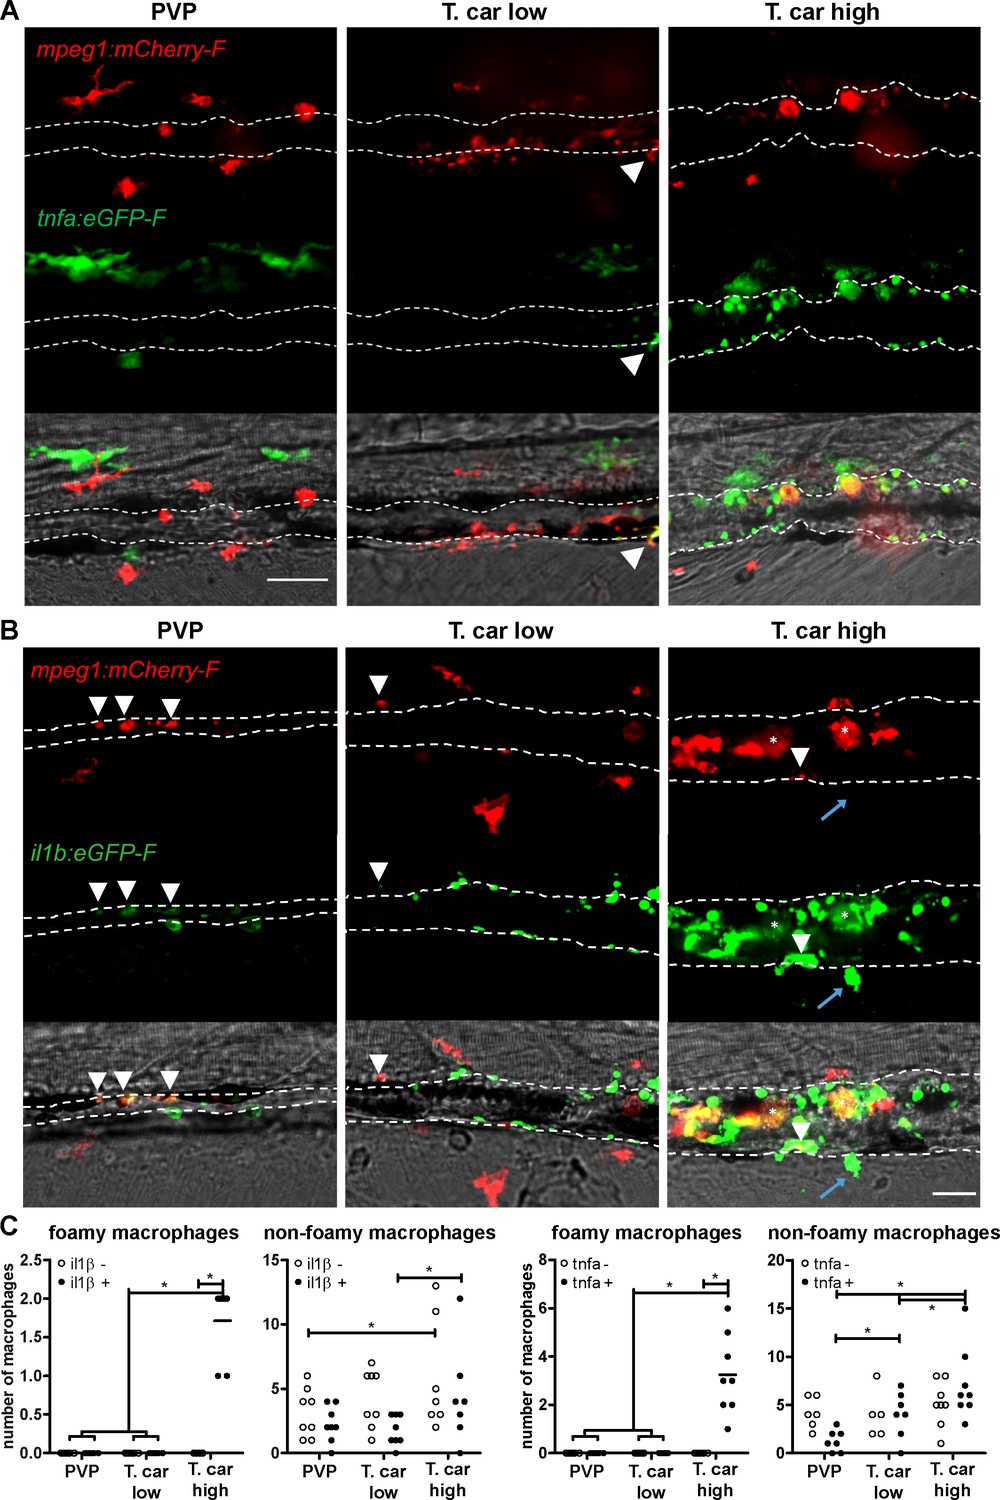
High-infected zebrafish have a strong inflammatory profile.
Zebrafish larvae (5 dpf), either (A) Tg(tnfa:eGFP-F x mpeg1:mCherry-F) (n = 8–13 larvae per group from four independent experiments), or (B) Tg(il1b:eGFP-F;mpeg1:mCherry-F) (n = 7–8 larvae per group from two independent experiments), were infected as described in Figure 7. At 4 dpi, larvae were separated in high- and low-infected individuals and imaged with a Roper Spinning Disk Confocal Microscope. Scale bar indicate 25 μm. (A) In non-infected PVP controls (left panel), several macrophages can be observed outside the vessel but none was positive for tnfa. In low-infected individuals (middle panel), macrophages were present inside and outside the vessel. Except the occasional macrophage showing tnfa-eGFP expression (white arrowhead), they generally did not exhibit strong eGFP signal. In high-infected individuals however, foamy macrophages (asterisks) as well as endothelial cells (bright green cells) or other leukocytes, were strongly positive for tnfa-eGFP expression. (B) il1b-eGFP expression was generally low in non-infected PVP controls. In low-infected larvae, il1b-positive macrophages were rarely observed (white arrowhead). In both high- and low-infected fish, some endothelium cells in the cardinal caudal vein show high il1b-eGFP expression (bright green cells in middle and right panel). In high-infected individual, however (right panel), foamy macrophages inside the vessel (asterisks) as well as other macrophages lining the vessel (white arrowhead) and leukocytes in the tissue (blue arrow), were positive for il1b-eGFP expression. (C) Quantification of the total number of foamy and non-foamy macrophages and of the number of those that are positive or not for il1b or tnfa. All foamy macrophages are positive for il1b or tnfa, and high-infected individuals have generally a higher number of il1b or tnfa positive macrophages than low-infected or PVP individuals. *, indicate significant differences as assessed by Two-Way ANOVA followed by Bonferroni post-hoc test.
-
Figure 9—source data 1
High-infected zebrafish have a strong inflammatory profile.
- https://cdn.elifesciences.org/articles/64520/elife-64520-fig9-data1-v2.xlsx
Figure 9—figure supplement 1
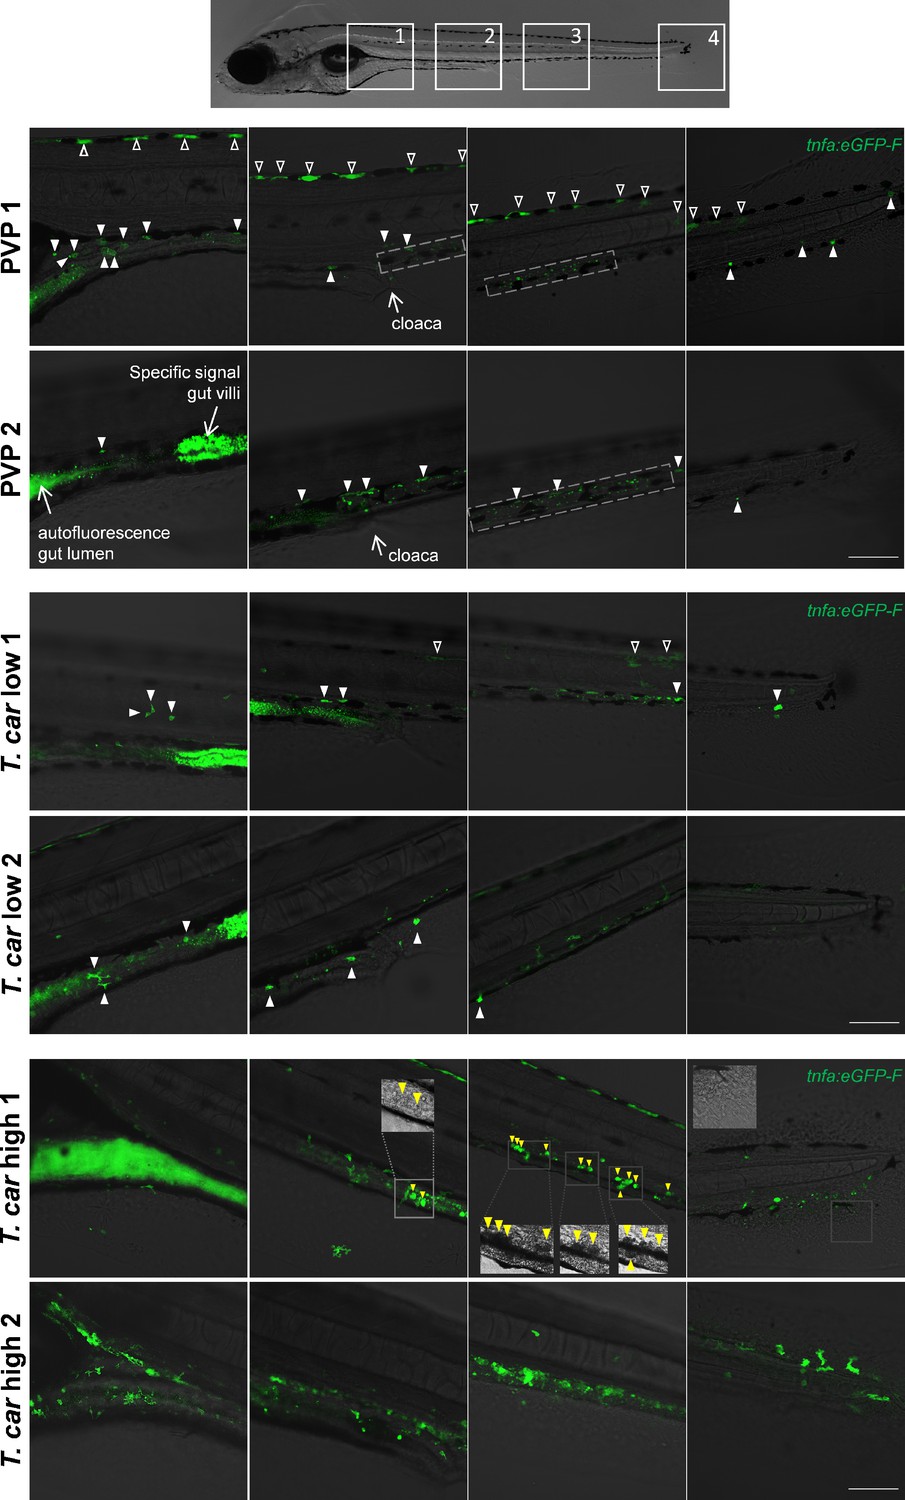
Differential tnfa expression during T. carassii infection.
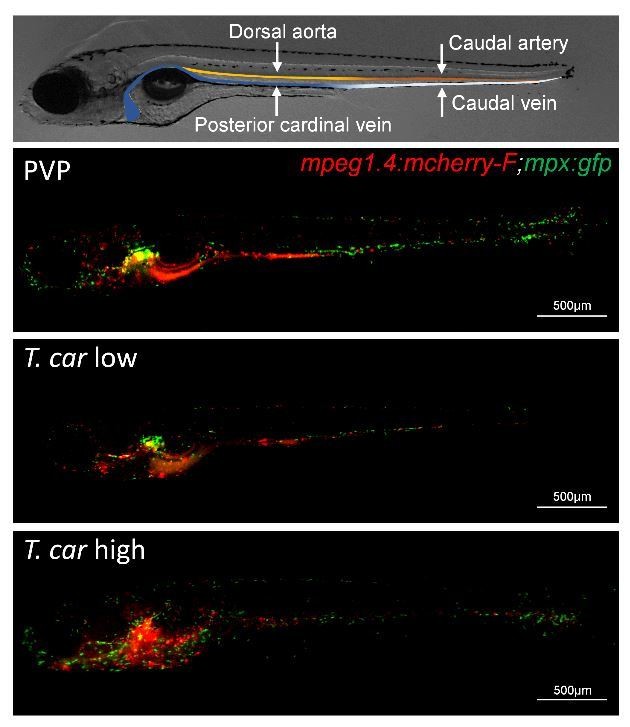
Tg(tnfa:eGFP-F) zebrafish larvae (5dpf), were injected intravenously with n = 200 T. carassii or with PVP. At 4 dpi, larvae were separated in high- and low-infected individuals and n = 3–6 fish per group were imaged with a Zeiss lsm-510 Confocal Microscope using ×10 magnification. Images were acquired using the same settings, thus allowing direct comparison of the intensity of the eGFP signal. Representative images of four different locations along the entire trunk and tail region of two individuals per group are shown. Each image has a frame size of 2048 × 2048 pixels allowing for enlargement of the images, if needed, for a more detailed view. Scale bar indicates 100 μm. Upper panels: in non-infected (PVP) individuals, low constitutive tnfa:eGFP expression can be observed in skin keratinocytes (open arrowheads) along the dorsal side of the larva as well as the flank skin depending on the orientation of the larva and focus (area 3–4 of PVP1); constitutive tnfa:eGFP expression is also detected in endothelial cells of the caudal vein (dashed square) as also reported in Figures 8–10. Stronger constitutive expression is observed in enterocytes of gut villi and this could vary between individuals and focus plane of the image. Autofluorescence of the gut lumen is a common feature and can vary per individual depending on the degree of absorption of the yolk sac or time of feeding (see also Figure 4). Finally, constitutive tnfa:eGFP expression can be detected in leukocytes (white arrowheads) distributed along the major trunk vessels, recognizable by their typical polymorphic morphology. Middle and lower panels: to allow maximum visibility of the overall tnfa:eGFP expression in high- and low-infected individuals, we limited the number of symbols added to each image; at this magnification it would render the images very crowded and we refer the reader to the legend of the upper panels (PVP). In low-infected individuals (T. car low), the number of tnfa:eGFP + leukocytes was only marginally higher than that in non-infected individuals (see also Figure 10C); leukocytes were distributed along the trunk, mostly lining the major blood vessels and in the tail tip loop, or could be seen in the peritoneal cavity around the gut area; only few leukocytes clearly displayed a stronger eGFP signal than observed in PVP individuals (only these are indicated by white arrowheads). This supports the previous observation (Figures 8–10) that low-infected individuals display a moderate inflammatory response. In high-infected individuals (T. car high), not only the number of tnfa:eGFP + cells but also the intensity of their eGFP signal was higher than that observed in PVP and low-infected individuals. Only in high-infected individuals, foamy macrophages strongly positive for tnfa:eGFP expression (yellow arrowheads) were seen along the major vein (posterior cardinal vein before the cloaca and caudal vein after the cloaca) and were also clearly recognizable in bright-field images by their dark and granular appearance (insets in area 2–3, T. car high 1). In high-infected individuals, numerous leukocytes strongly positive for tnfa:eGFP expression were observed also in the peritoneal cavity around the gut area and in the tail tip along the vessels or in the fins, altogether confirming the overall high inflammatory response in these individuals also reported in Figure 10. Note the high number of parasites extravasated in the tissue, recognizable by their typical ‘worm-like’ morphology (inset area 4) in the tail fin of high-infected individual number 1.
Figure 10
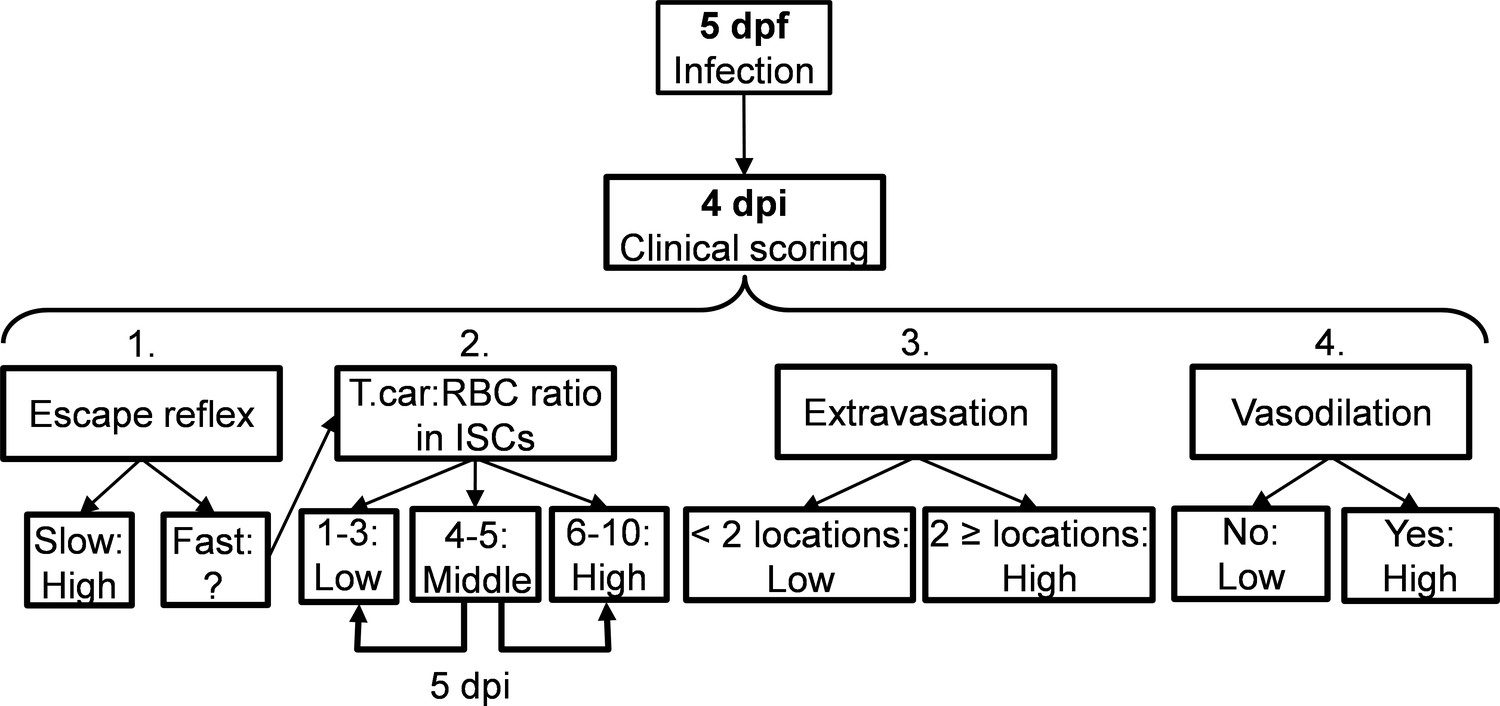
Schematic overview of the clinical scoring system used to determine individual infection levels of T.carassii-infected zebrafish larvae.
Zebrafish larvae infected with T. carassii can be analysed at 4 dpi; based on up to four different parameters including (1) visual monitoring of larval behaviour, (2) parasite numbers, (3) location, or (4) vasodilation, larvae could be segregated into high- and low-infected individuals. See details in the text in the corresponding Materials and methods section.
Author response image 1

Author response image 2
Videos
Video 1
Clinical signs of T. carassii infection in high- and low-infected zebrafish larvae.
Tg(mpeg1:mCherry-F;mpx:GFP) 5 dpf zebrafish were injected with n = 200 T. carassii or with PVP and imaged at various time points after infection. Shown are high-speed videos (500 frames/s, fps) or real-time videos (20 fps) capturing trypanosomes in vivo in blood or in tissues, as well as describing typical signs of anaemia and vasodilation.
Video 2
T. carassii infection triggers macrophage division.
Video 3
T. carassii infection triggers neutrophils division.
Video 4
Macrophages are recruited into the cardinal caudal vein of high-infected zebrafish larvae.
Zebrafish larvae were treated and imaged as described in Figure 7. Shown are the AVI files corresponding to the maximum projection images shown in Figure 7; Neutrophils were never observed within the vessel independently of the infection level (left panels). Macrophages, however, could be seen outside (blue arrows) and inside the vessel (white arrows). The number of rounded macrophages inside the vessel increased with the infection level.
Video 5
The occurrence of large granular macrophages increases with the progression of the infection in high-infected individuals.
Tg(mpeg1:mCherry-F;mpx:GFP) zebrafish larvae were injected intravenously at 5 dpf with n = 200 T. carassii or with PVP. At 4 dpi, larvae were separated into high- and low-infected individuals and imaged with a DMi8 inverted digital Leica microscope. The occurrence of large macrophages (arrows) in the cardinal caudal vessel increased with the progression of the infection and was exclusive to high infected individuals (4 and 7 dpi).
Video 6
Large granular macrophages inside the vessel of high-infected larvae are rich in lipid bodies.
Tg(mpeg1:mCherry-F) zebrafish larvae were infected intravenously at five dpf with n = 200 T. carassii or with PVP. At 3 dpi, larvae received 1 nl of 30 µM BODIPY-FLC5 and were imaged 18–20 hr later using a Roper Spinning Disc Confocal Microscope at a ×40 magnification. The AVI files corresponding to the maximum projection images shown in Figure 8, as well as a second individual, are shown. Asterisks indicate the position of foamy macrophages inside the caudal vessel (dashed line).
Video 7
Motile T. carassii cannot be engulfed by innate immune cells.
Tg(mpx:GFP) zebrafish larvae were injected intravenously at 5 dpf with n = 200 T. carassii and two infected individuals were imaged at 7 dpi with a DMi8 inverted digital Leica microscope. Note how motile parasites are relative to static neutrophils (GFP), making it impossible for neutrophils, or any other immune cell, to engulf live parasite.
Tables
Key resources table
| Reagent type (species) or resource | Designation | Source or reference | Identifiers | Additional information |
|---|---|---|---|---|
| Gene (Danio rerio) | elongation factor-1α (ef1a) | DOI:10.7554/eLife.48388 | ZDB-GENE-990415–52 | template for primers for RQ-PCR analysis |
| Gene (Danio rerio) | interleukin-1 beta (il1β) | ZFIN.org | ZDB-GENE-040702–2 | template for primers for RQ-PCR analysis |
| Gene (Danio rerio) | interleukin-10 (il10) | ZFIN.org | ZDB-GENE-051111–1 | template for primers for RQ-PCR analysis |
| Gene (Danio rerio) | tumor necrosis factor alpha, gene a (tnfa) | ZFIN.org | ZDB-GENE-050317–1 | template for primers for RQ-PCR analysis |
| Gene (Danio rerio) | tumor necrosis factor alpha, gene b (tnfb) | ZFIN.org | ZDB-GENE-050601–2 | template for primers for RQ-PCR analysis |
| Gene (Danio rerio) | interleukin-6 (il6) | ZFIN.org | ZDB-GENE-120509–1 | template for primers for RQ-PCR analysis |
| Gene (Trypanosoma carassii) | heat-shock protein-70 (hsp70) | DOI:10.7554/eLife.48388 | GeneBank-FJ970030.1 | template for primers for RQ-PCR analysis |
| Strain, strain background (Cyprinus carpio) | Wild type common carp, R3xR8 strain | DOI:10.1016/0044-8486(95)91961 T | used to passage Trypanosoma carassii in vivo | |
| Strain, strain background (Danio rerio) | Wild type zebrafish, AB strain | Zebrafish International Resource Center | RRID:SCR_005065; Cat#ZL1 | used for backcrossing of all Tg |
| Strain, strain background (Danio rerio) | casper strain | DOI:10.1016/j.stem.2007.11.002 | optically transparent | |
| Strain, strain background (Danio rerio) | AB:Tg(mpx:GFP)i114 | DOI:10.1182/blood-2006-05-024075 | wild type line marking neutrophils with green fluorescent protein (GFP) under the control of thempx (myeloperoxidase) promotor | |
| Strain, strain background (Danio rerio) | Tg(mpeg1:mCherry-F)ump2Tg | DOI:10.1242/dmm.014498 | wild type line marking macrophages with farnesylated red fluorescent protein (mCherry) under the control of the mpeg1 (Macrophage expressed gene-1) promotor | |
| Strain, strain background (Danio rerio) | Tg(mpeg1:eGFP)gl22 | DOI:10.1182/blood-2010-10-314120 | wild type line marking macrophages with green fluorescent protein (GFP) under the control of the mpeg1 (Macrophage expressed gene-1) promotor | |
| Strain, strain background (Danio rerio) | AB:Tg(kdrl:caax-mCherry) | DOI:10.1101/gad.1629408.734 | wild type line marking the vasculature with green fluorescent protein (GFP) under the control of the kdrl (Vascular endothelial growth factor receptor kdr-like) promotor. Old name: Tg(flk1:ras-cherry)s896 | |
| Strain, strain background (Danio rerio) | casper Tg(fli:egfp)y1 | DOI:10.1038/nrg888 | optically transparent line, marking the vasculature with green fluorescent protein (GFP) under the control of the endothelial cell marker fli1 (friend leukemia integration-1) promotor | |
| Strain, strain background (Danio rerio) | Tg(il1b:eGFP-F)ump3Tg | DOI:10.1242/dmm.014498 | wild type line marking tnfa-expressing cells with farnesylated green fluorescent protein (GFP-F) under the control of the zebrafish tnfa (tumor necrosis factor alpha a) promotor | |
| Strain, strain background (Danio rerio) | Tg(tnfa:eGFP-F)ump5Tg | DOI:10.7554/eLife.07288 | wild type line marking il1b-expressing cells with farnesylated green fluorescent protein (GFP-F) under the control of the zebrafish il1b (interleukin 1-beta) promotor | |
| Strain, strain background (Trypanosoma carassii) | TsCc-NEM strain | doi:10.1007/s004360050408 | ||
| Antibody | Chicken polyclonal anti-GFP | Aves Labs | Cat# GFP-1010, RRID:AB_2307313 | primary antibody, whole mount: 1:500 |
| Antibody | Goat polyclonal anti-chicken-Alexa 488 | Abcam | Cat# ab150169, RRID:AB_2636803 | Secondary antibody, whole mount: 1:500 |
| Chemical compound, drug | BODIPYTM FL pentanoic acid | Invitrogen | BODIPY-FL5: Cat# D-3834 | |
| Commercial assay or kit | iCLICKTM EdU (5- ethynyl-2’- deoxyuridine, component A) | ABP Biosciences | ANDY FLUOR 555 Imaging Kit: Cat# A004 |
Table 1
List of primers used in this study.
| Gene name | Fw primer sequence | RV primer sequence | Acc. number (zfin.org) |
|---|---|---|---|
| ef1a | CTGGAGGCCAGCTCAAACAT | ATCAAGAAGAGTAGTAGTACCG | ZDB-GENE-990415–52 |
| il1β | TTGTGGGAGACAGACAGTGC | GATTGGGGTTTGATGTGCTT | ZDB-GENE-040702–2 |
| il10 | ACTTGGAGACCATTCTGCC | CACCATATCCCGCTTGAGTT | ZDB-GENE-051111–1 |
| tnfa | AAGTGCTTATGAGCCATGC | CTGTGCCCAGTCTGTCTC | ZDB-GENE-050317–1 |
| tnfb | AAACAACAAATCACCACACC | ACACAAAGTAAAGACCATCC | ZDB-GENE-050601–2 |
| il6 | ACTCCTCTCCTCAAACCT | CATCTCTCCGTCTCTCAC | ZDB-GENE-120509–1 |
| T. car. hsp70 | CAGCCGGTGGAGCGCGT | AGTTCCTTGCCGCCGAAGA | FJ970030.1 (GeneBank) |
Additional files
Download links
A two-part list of links to download the article, or parts of the article, in various formats.
Downloads (link to download the article as PDF)
Open citations (links to open the citations from this article in various online reference manager services)
Cite this article (links to download the citations from this article in formats compatible with various reference manager tools)
Occurrence of foamy macrophages during the innate response of zebrafish to trypanosome infections
eLife 10:e64520.
https://doi.org/10.7554/eLife.64520


