HP1 proteins compact DNA into mechanically and positionally stable phase separated domains
- Department of Biochemistry and Biophysics, University of California, San Francisco, United States
- Tetrad Graduate Program, University of California, San Francisco, United States
- Department of Pharmaceutical Chemistry, University of California, San Francisco, United States
- Max Planck Institute of Molecular Cell Biology and Genetics, Germany
- German Center for Neurodegenerative Diseases (DZNE), Germany
- Department of Mechanical Engineering, Johns Hopkins University, United States
- Department of Physiology, University of California, San Francisco, United States
- Chan Zuckerberg Biohub, United States
- Cluster of Excellence Physics of Life, Technische Universität Dresden, Germany
- Marine Biological Laboratory, United States
Figures
Figure 1 with 2 supplements
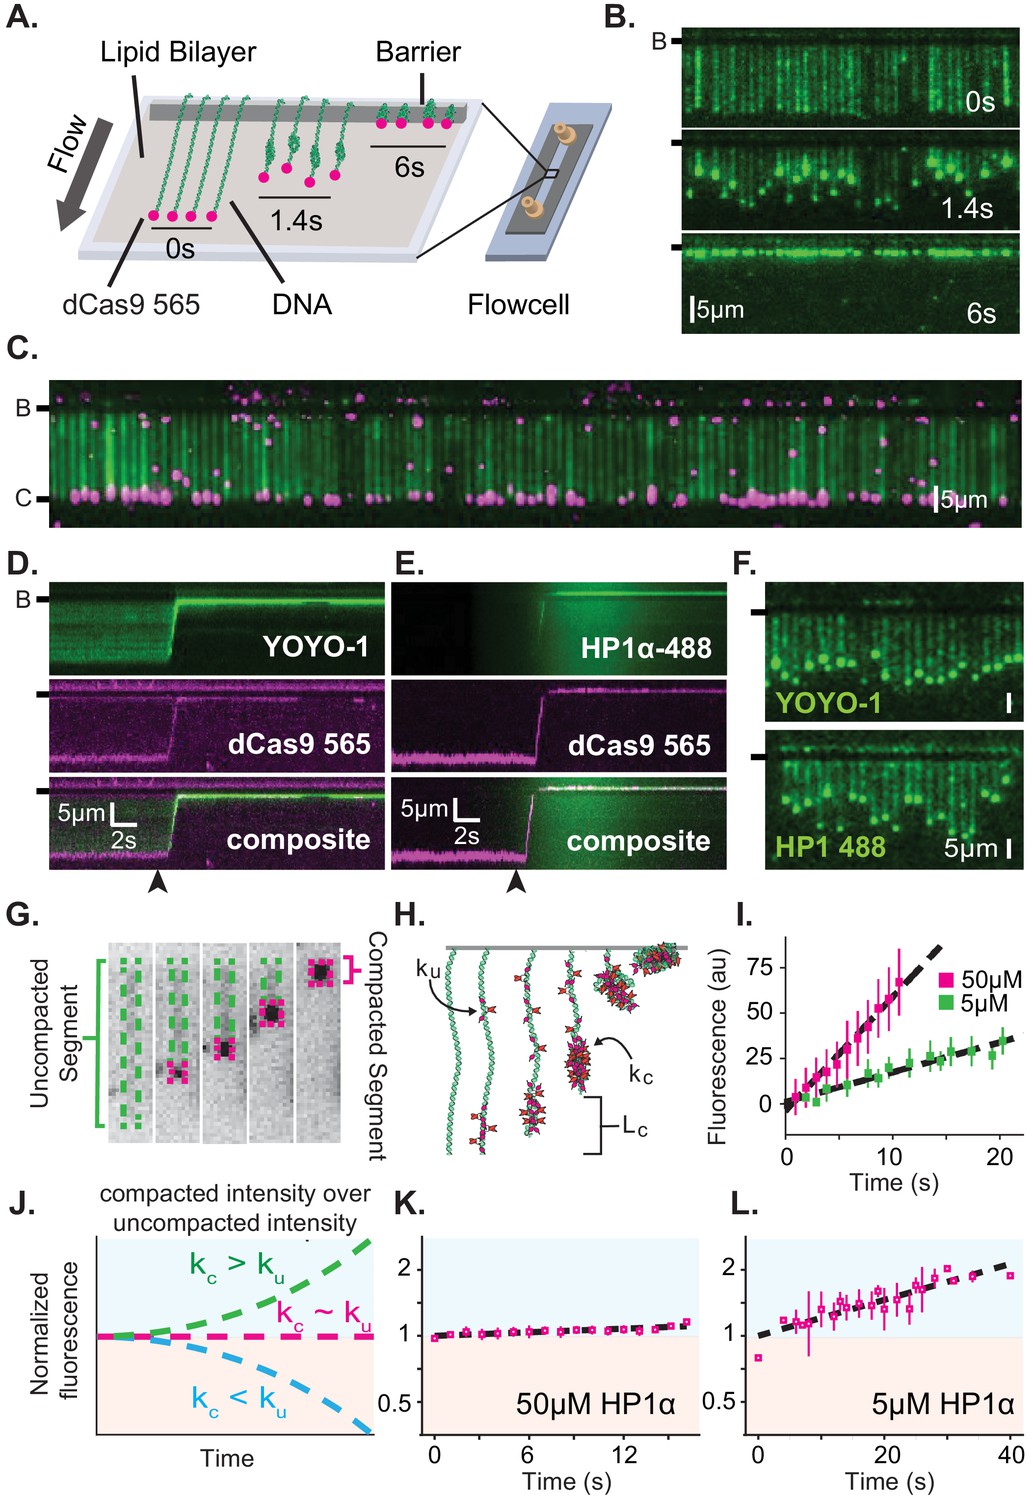
Characterization of DNA compaction by HP1α.
(A) Cartoon of the DNA curtains assay showing compaction of DNA. (B) Timestamped images of DNA labeled with YOYO-1 undergoing compaction by 50 μM HP1α (unlabeled) shown before, during, and after compaction. (B-) or (-) specifies location of the barrier. (C) DNA curtain end-labeled with fluorescent dCas9 (C-). The dCas9 is targeted to a site 750 bp from the untethered end of the DNA. (D and E) Kymograms of DNA compaction by 50 μM HP1α. (D) DNA labeled with YOYO-1 (top), dCas9-565 (middle), and composite image (bottom). (E) HP1α−488 (top), DNA labeled with dCas9-565 (middle), and composite image (bottom). Arrowheads represent estimated time of protein injection. (F) Still images during DNA compaction of either DNA labeled with YOYO-1 (top) or HP1α−488 (bottom). (G) A DNA molecule undergoing compaction by HP1α specifying the uncompacted segment (green) and compacted segment (magenta). (H) Cartoon of HP1α compacting DNA over time. Lc is the length of compacted DNA, ku is the rate of fluorescence increase for the uncompacted DNA segment, and kc is the rate fluorescence increase for the compacted DNA segment. See Materials and methods for more information. (I) Fluorescence increase of HP1α−488 on uncompacted DNA. N = 25 for both concentrations, error bars represent standard deviations. (J) Cartoon showing potential results from normalizing the fluorescence of the compacted segment by that of the uncompacted segment. (K and L) Measured normalized compacted HP1α fluorescence relative to uncompacted HP1α. N = 25 for both concentrations, error bars represent standard deviations.
Figure 1—figure supplement 1
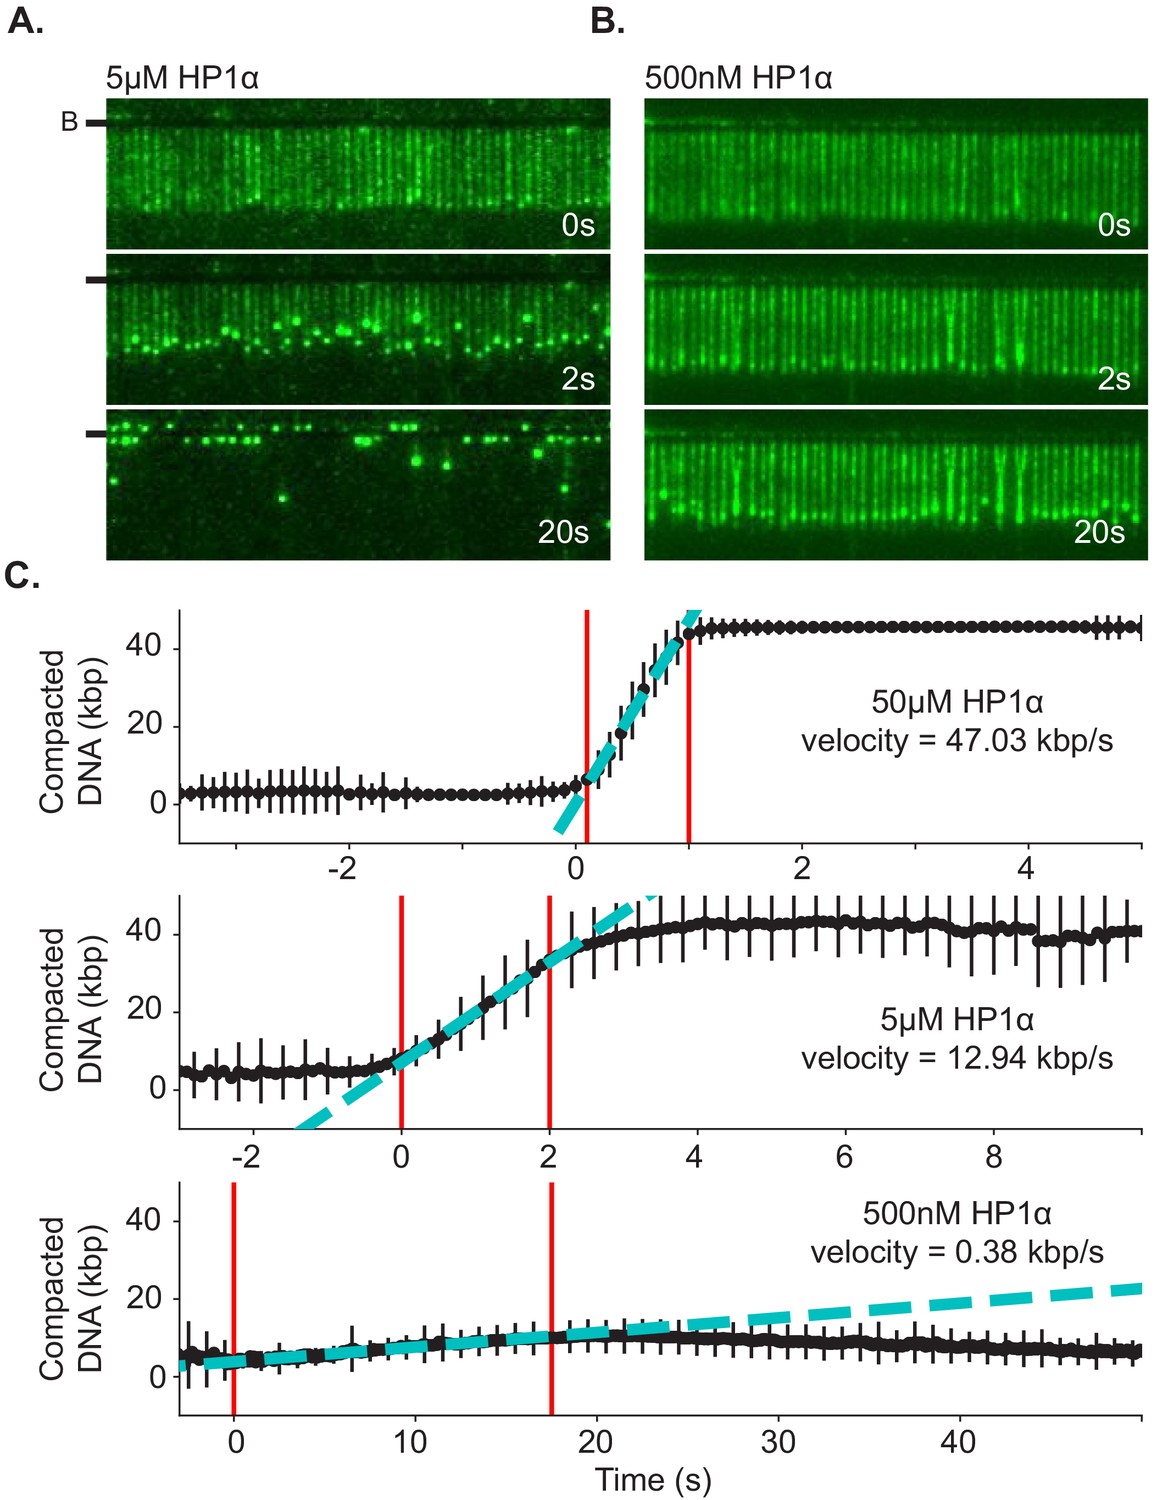
DNA compaction at different HP1α concentrations.
(A and B) Timestamped images of DNA compaction by either (A) 5 μM or (B) 500 nM HP1α. DNA is labeled with YOYO-1. (B-) or (-) specifies location of the barrier. (C) Average DNA compaction for 50 μM (N = 272), 5 μM (N = 157), and 500 nM (N = 95) HP1α. Error bars represent standard deviations. Compaction velocity estimated from linear fit to data (cyan). Fit constrained to the region within the two red lines.
Figure 1—figure supplement 2
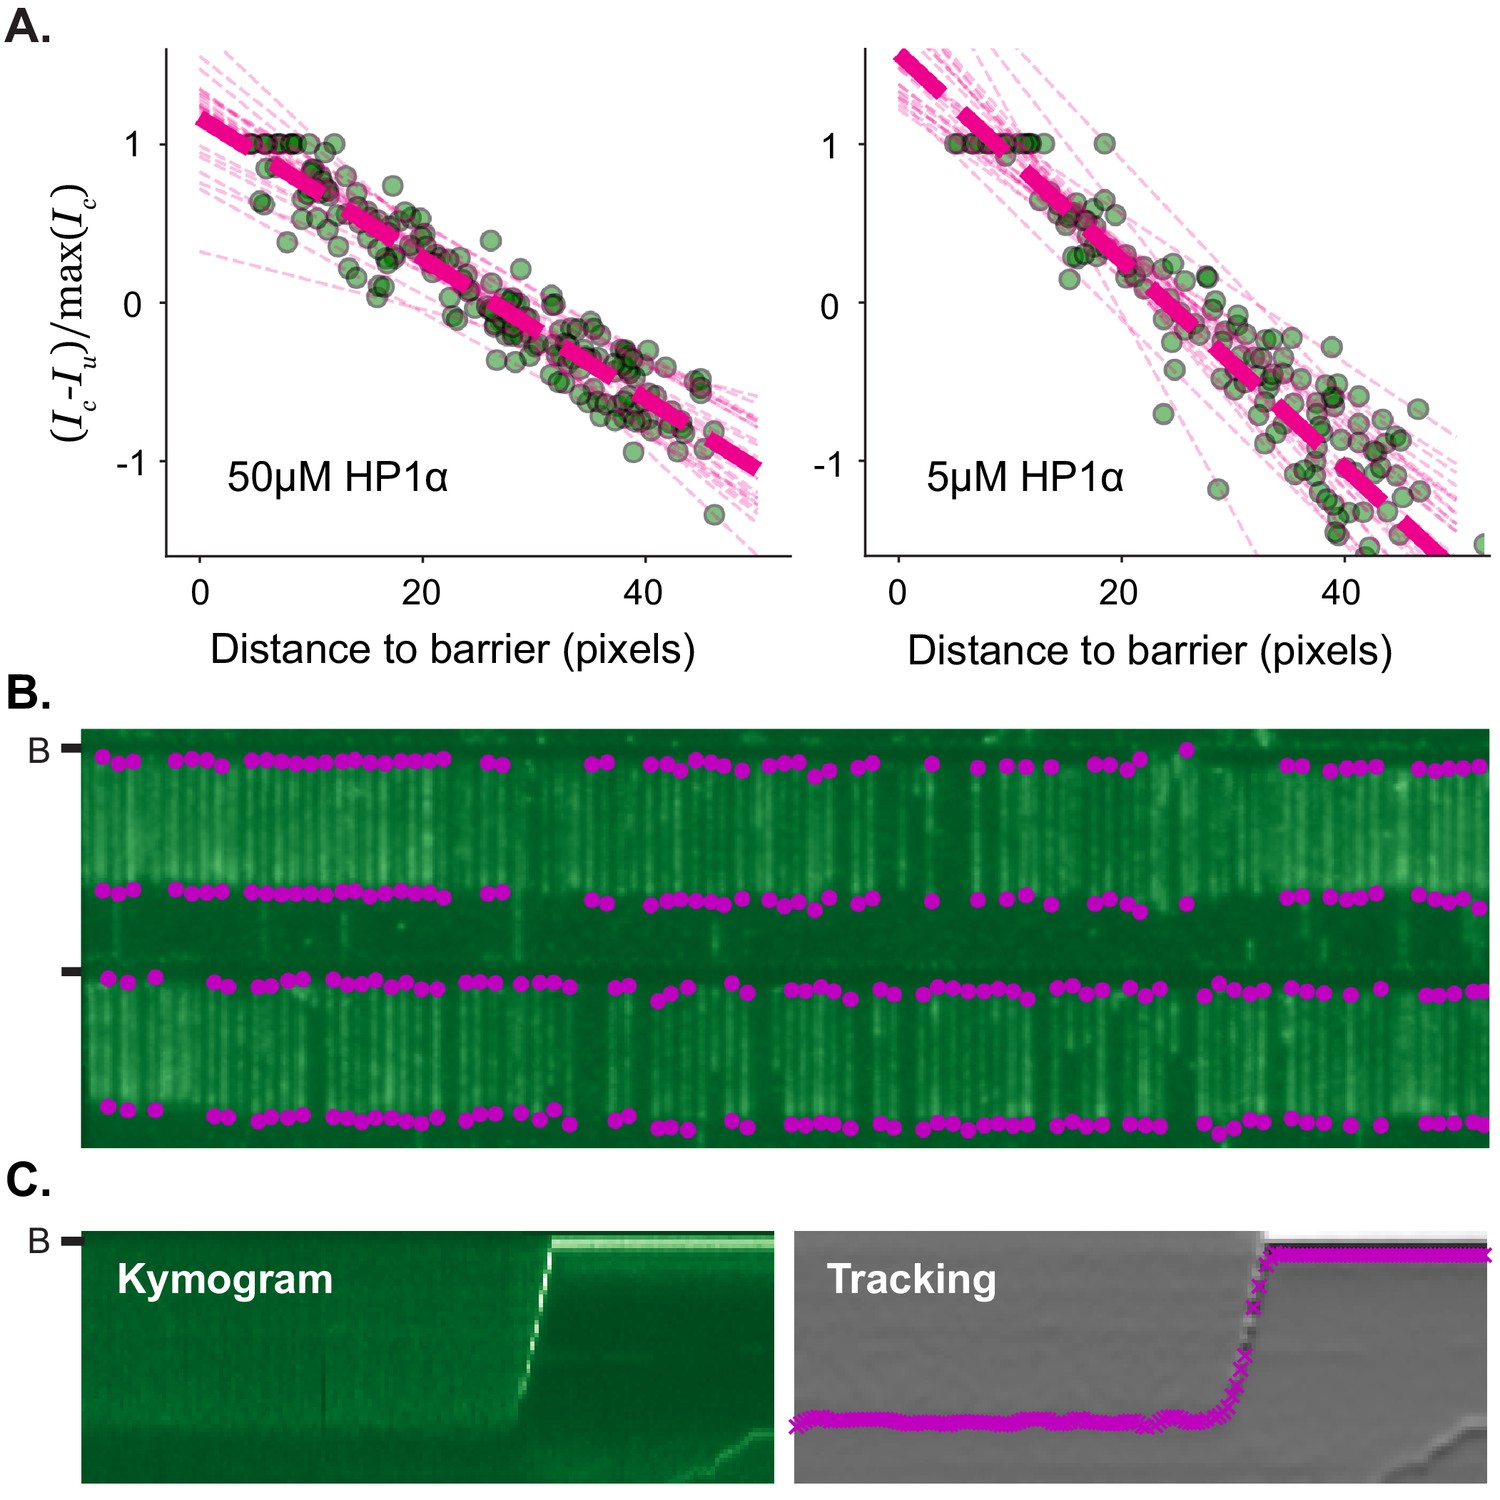
Fluorescence conservation and tracking DNA compaction by HP1α.
(A) Conservation of YOYO-1 fluorescence on DNA curtains. Normalized ratio of YOYO-1 intensity on the compacted and uncompacted segments. A total of 25 DNA molecules segmented for each concentration. (B) Automated detection of single DNA molecules within curtains. (C) Example output from tracking algorithm. (left) Kymogram showing compaction of DNA labeled with YOYO-1. (right) Overlay of tracking result on the derivative of the kymogram. (B-) or (-) specifies location of the barrier.
Figure 2 with 2 supplements
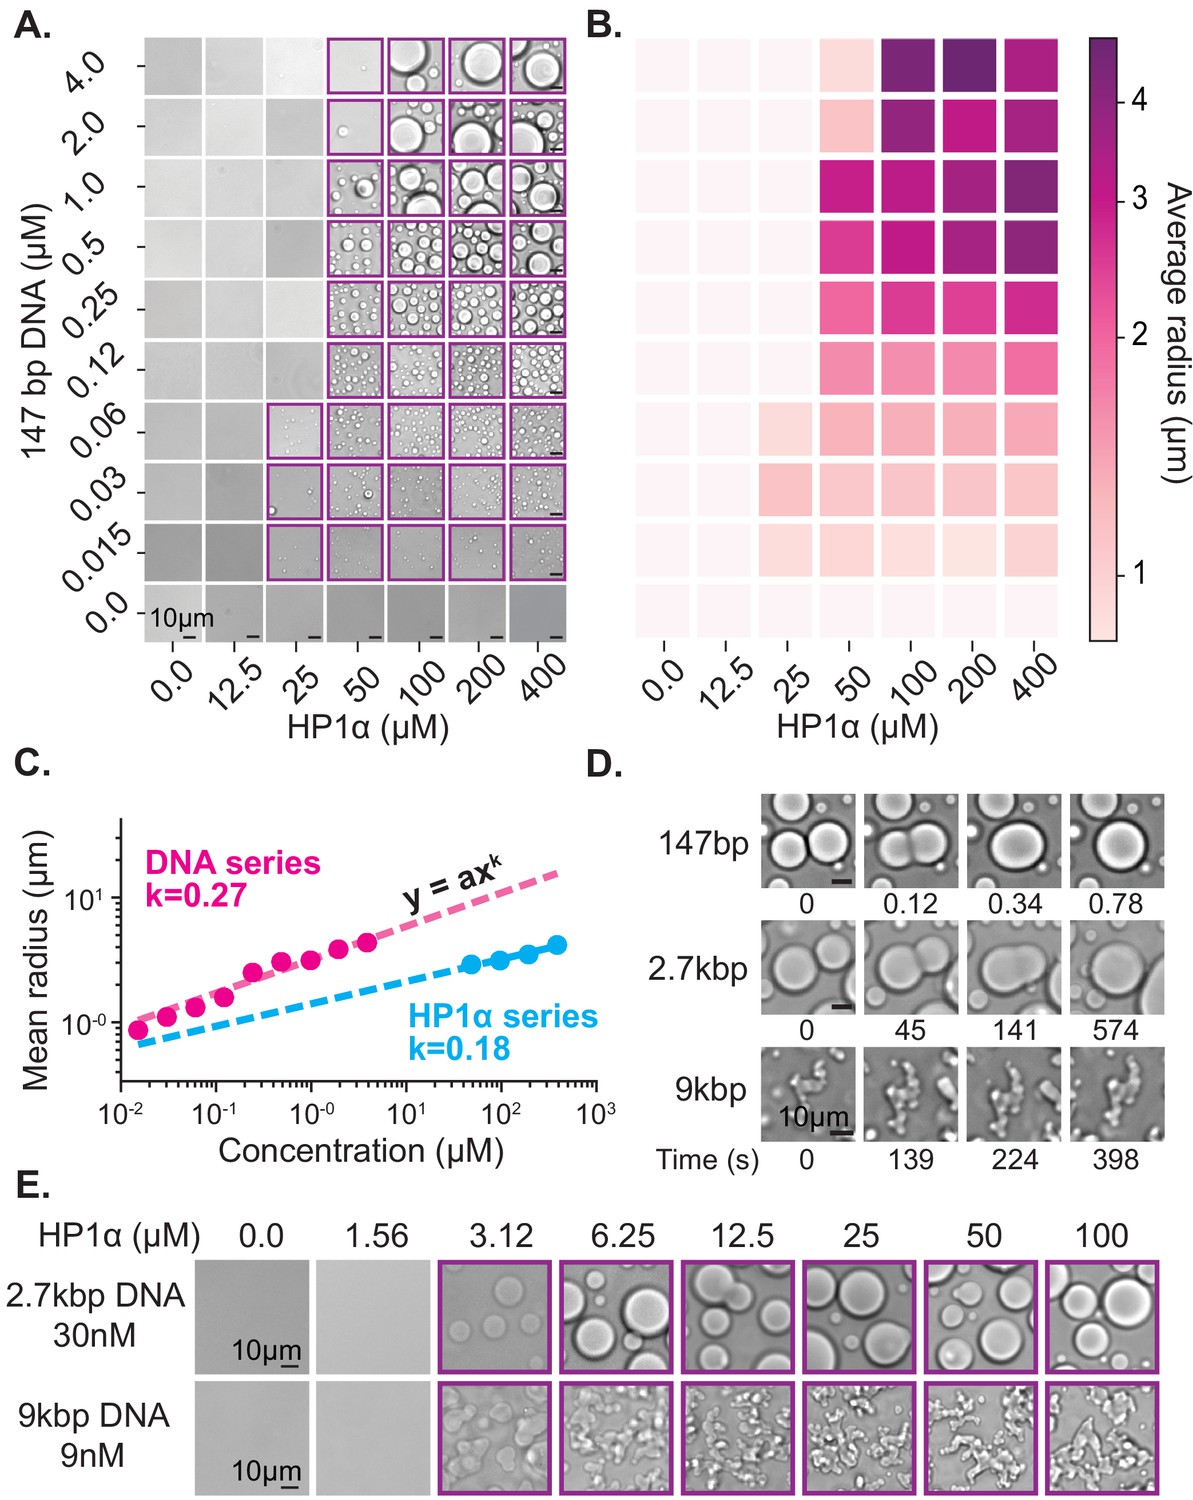
Characterization of HP1α-DNA condensate formation.
(A) Bright-field images of mixtures of HP1α and 147 bp DNA. (B) Heat map of the average radius of condensates for each condition in (A). (C) Average condensate radius for 1 μM 147 bp DNA plotted against HP1α concentration (cyan) or 100 μM HP1α plotted against 147 bp DNA concentration (magenta) and fit to a power law, error bars (obscured) represent the SEM. (D) Time stamped brightfield images of 100 μM HP1α and 147 bp, 2.7 kbp, or 9 kbp DNA depicting fusion and coalescence behavior. (E) Brightfield images of HP1α with either 30 nM 2.7 kb DNA (top) or 9 nM 9 kbp DNA (bottom). Throughout, purple boxes indicate presence of condensates.
Figure 2—figure supplement 1
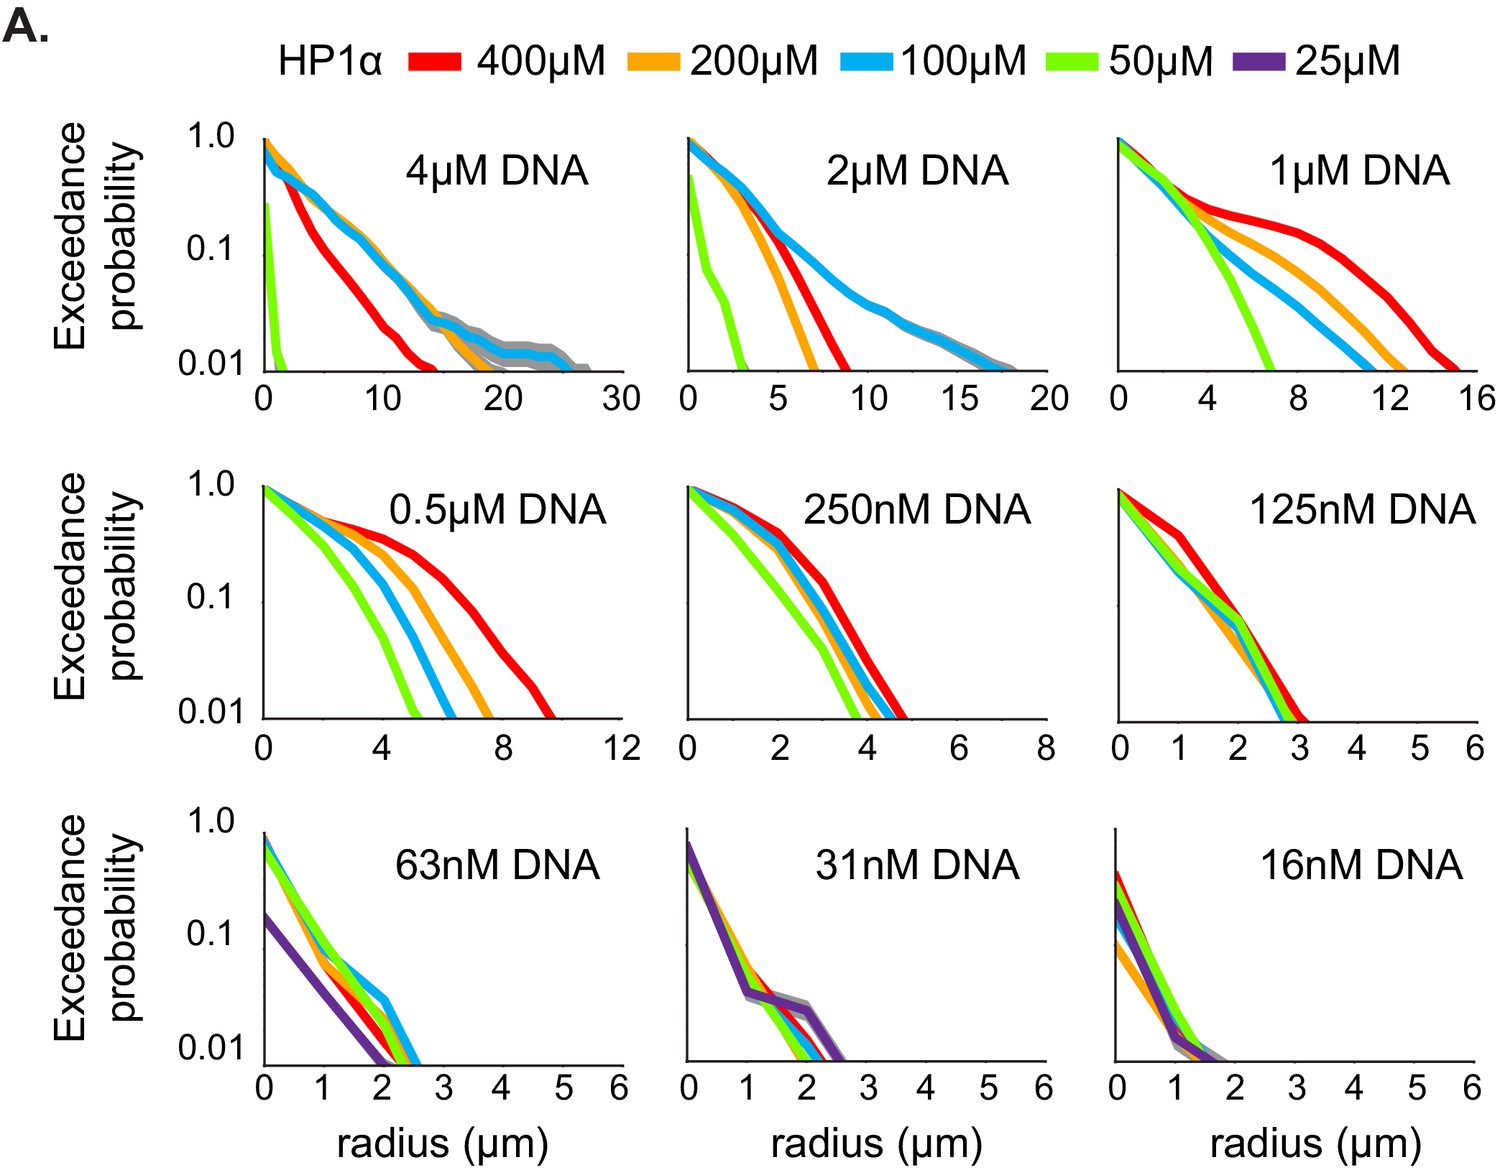
Exceedence probability of HP1α-DNA condensates.
(A) Exceedance probability. The number of condensates (y-axis) with radius exceeding indicated size (x-axis) for each concentration of HP1α and DNA in Figure 2A. Expectation values determined by integrating each curve are reported in Figure 2B–C.
Figure 2—figure supplement 2
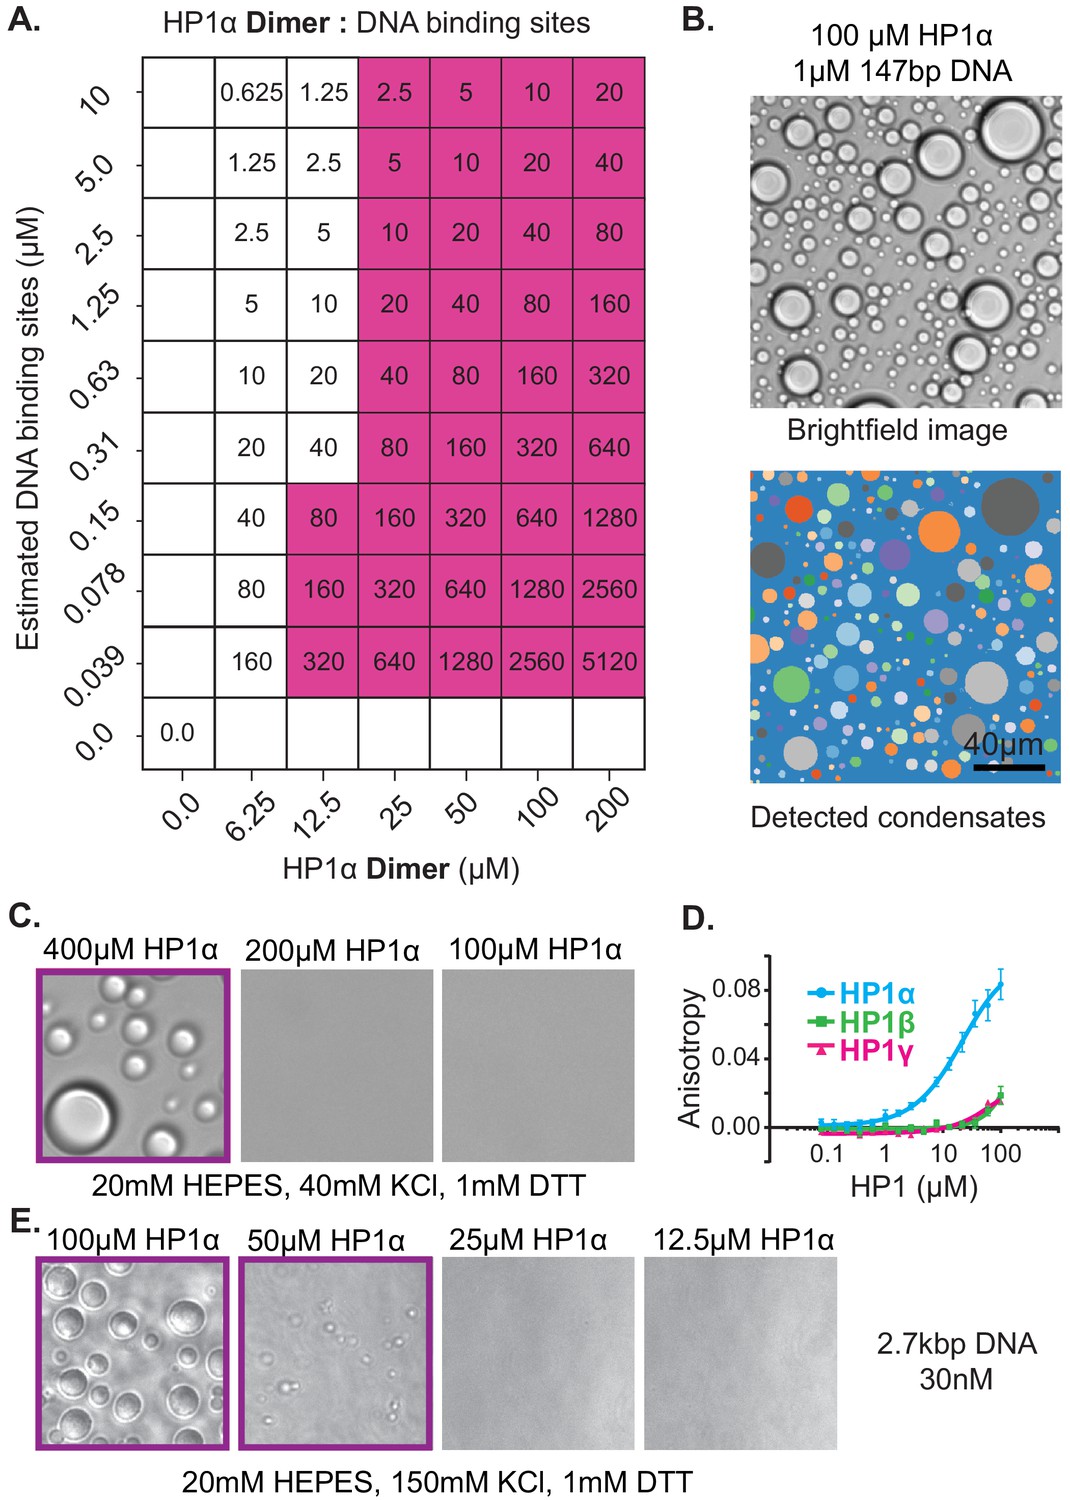
Characterization of HP1α condensates.
(A) Ratio of HP1α dimer to estimated DNA-binding sites for experimental conditions in Figure 2A (~2 HP1α binding sites per 147 bp DNA oligo). (B) (top) Brightfield image of 100 μM HP1α and 1 μM 147 bp DNA and (bottom) output of automated condensate detection.( C) Bright-field images of HP1α dialyzed into low salt buffer (20 mM HEPES pH7.5, 40 mM KCl, and 1 mM DTT). (D) Normalized fluorescence anisotropy curves for each HP1 paralog. (E) Brightfield images of four HP1α concentrations mixed with 30 nM 2.7 kbp DNA in 20 mM HEPES pH7.5, 150 mM KCl, and 1 mM DTT.
Figure 3 with 2 supplements
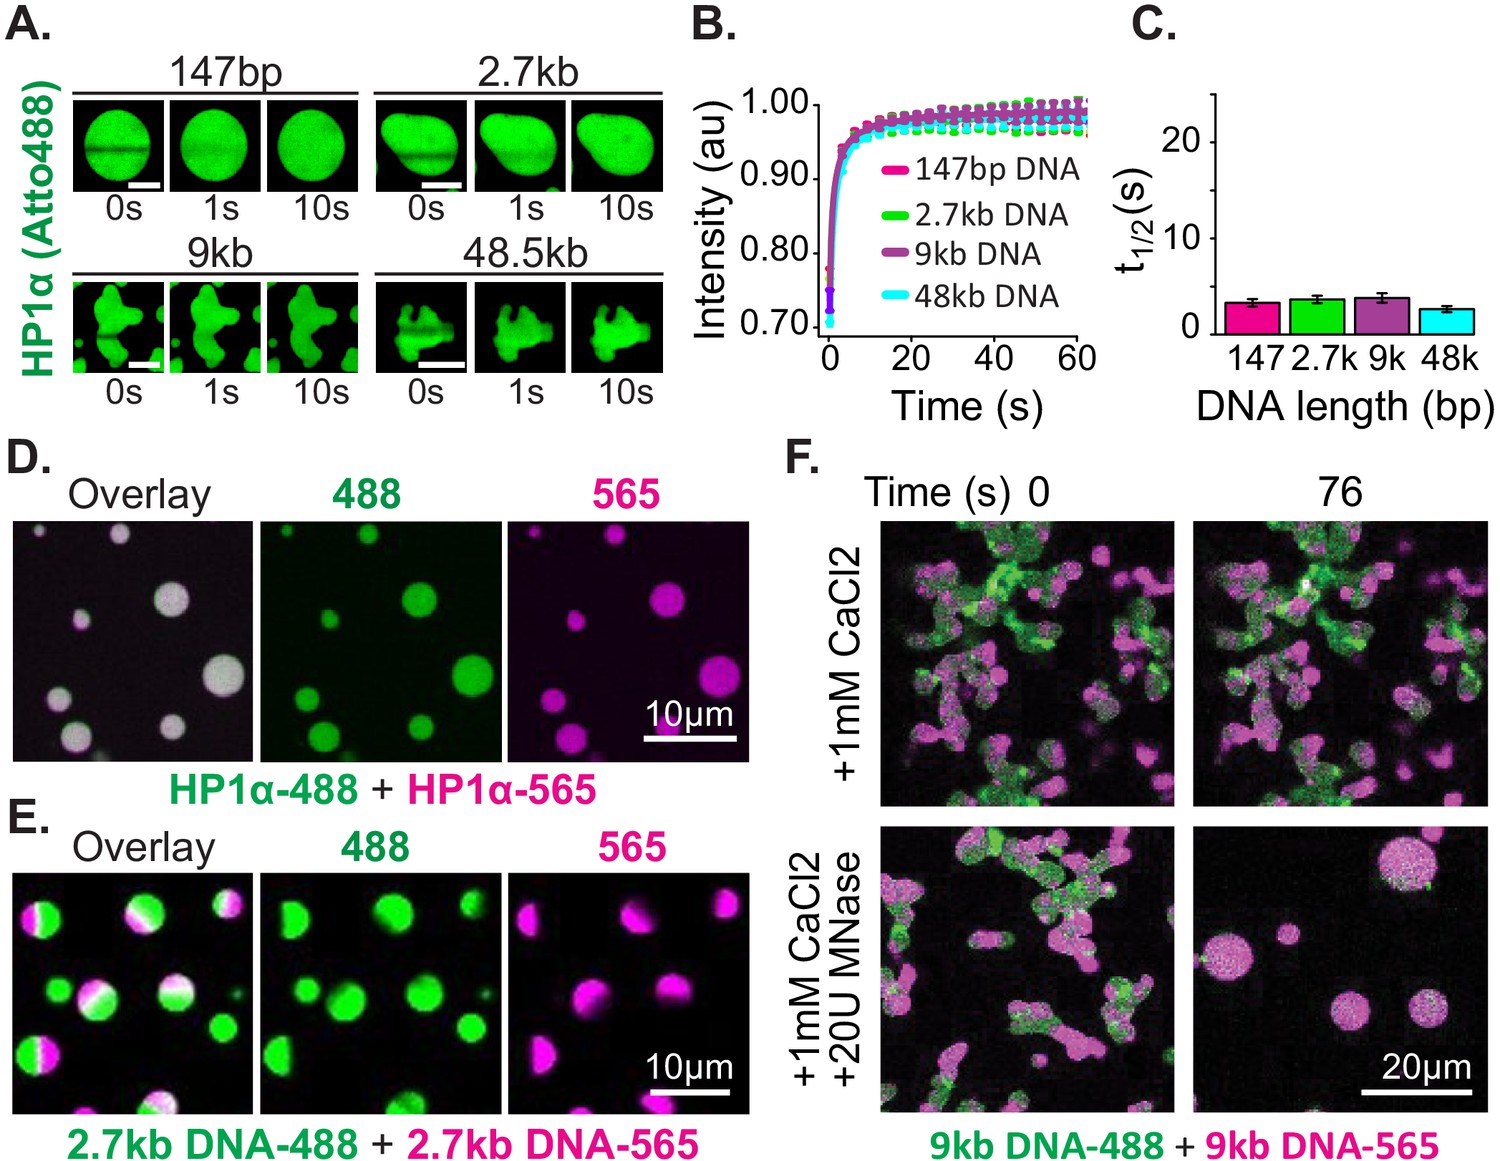
Distinct characteristics of HP1α and DNA in condensates.
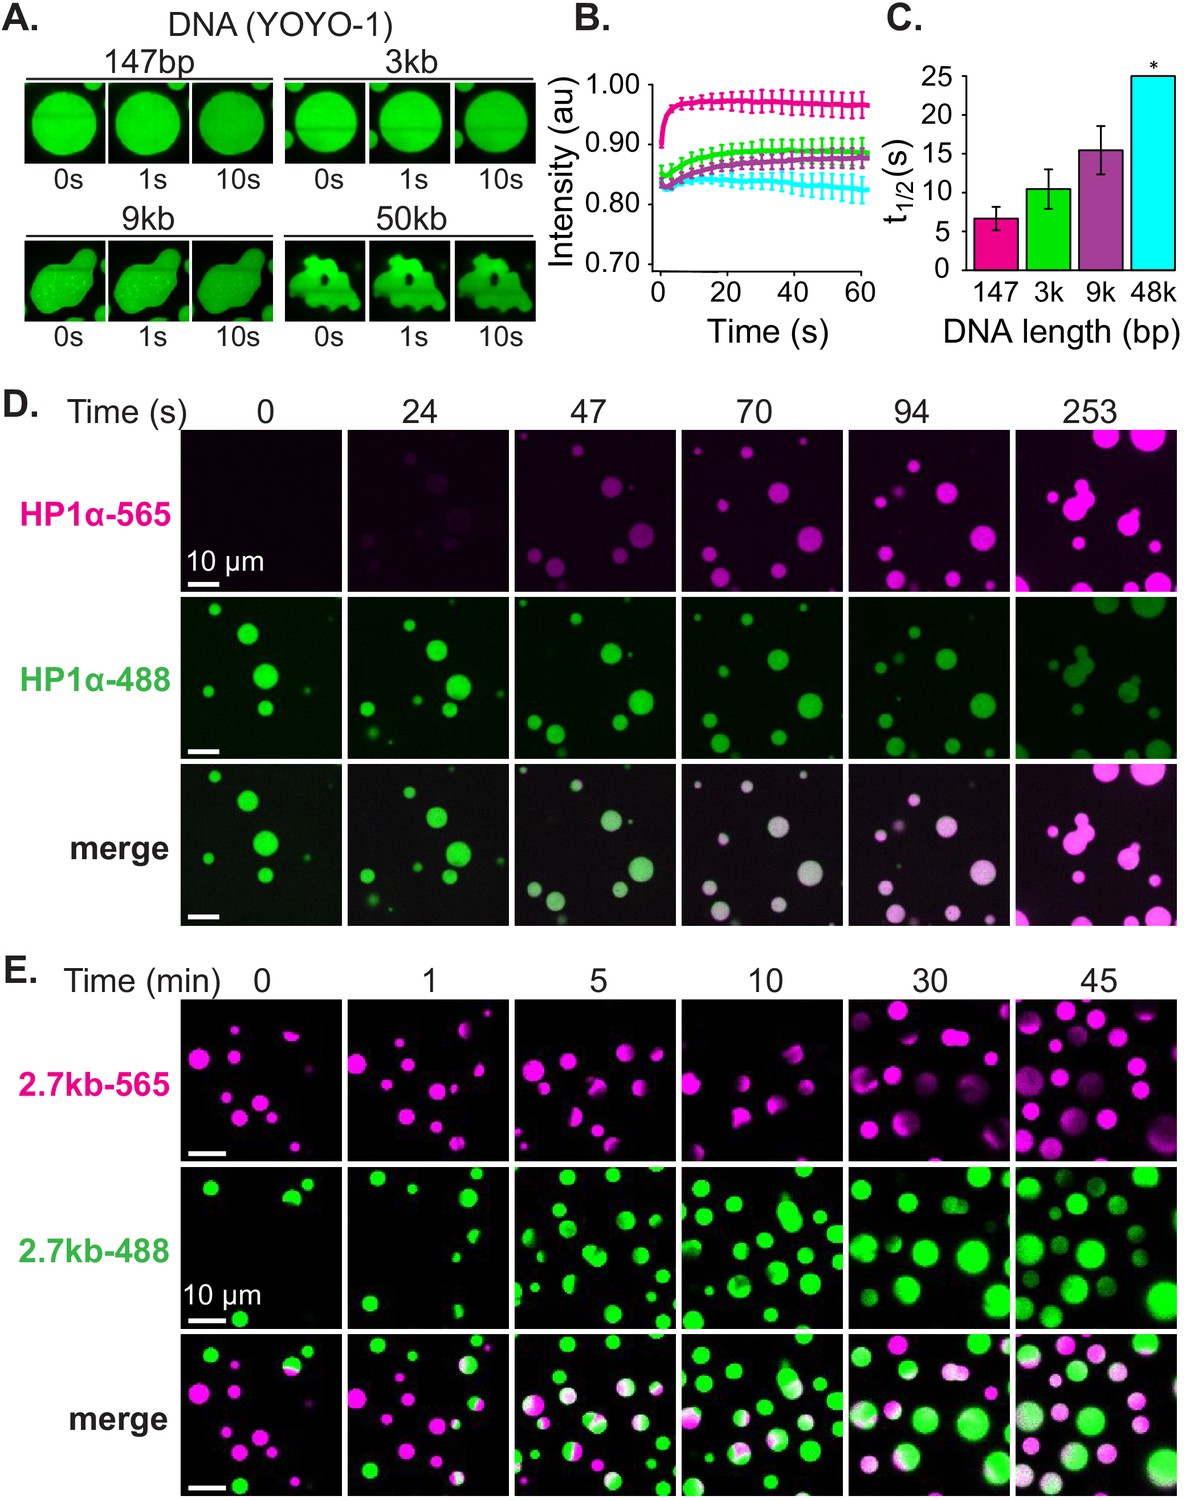
(A) FRAP of HP1α in condensates. Timestamped images from FRAP experiments for fluorescent HP1α and four lengths of linear DNA (147 bp, 2.7 kbp, 9 kbp, or 50 kbp). Scale bar indicates 5 μm. (B) Recovery of HP1α fluorescence intensity and (C) half-life of HP1α recovery plotted for each DNA length tested. N = 15 for each condition, error bars represent standard deviations. (D) Two-color HP1α mixing experiments. Condensates formed separately with 2.7 kbp unlabeled DNA and either HP1α−488 (green) or HP1α−565 (magenta) imaged 1.16 min after mixing. (E) Two-color DNA mixing experiments. Condensates formed separately with unlabeled HP1α and 2.7 kbp DNA-488 (green) or 2.7 kbp DNA-565 (magenta) imaged 4.4 min after mixing. (F) MNase treatment of condensates. Mixed condensates formed separately with unlabeled HP1α and 9 kbp DNA-488 (green) or 9 kbp DNA-565 (magenta) treated with either 1 mM CaCl2 or 1 mM CaCl2 and 20U MNase. Images shown for both conditions before and 76 s after the treatment.
Figure 3—figure supplement 1
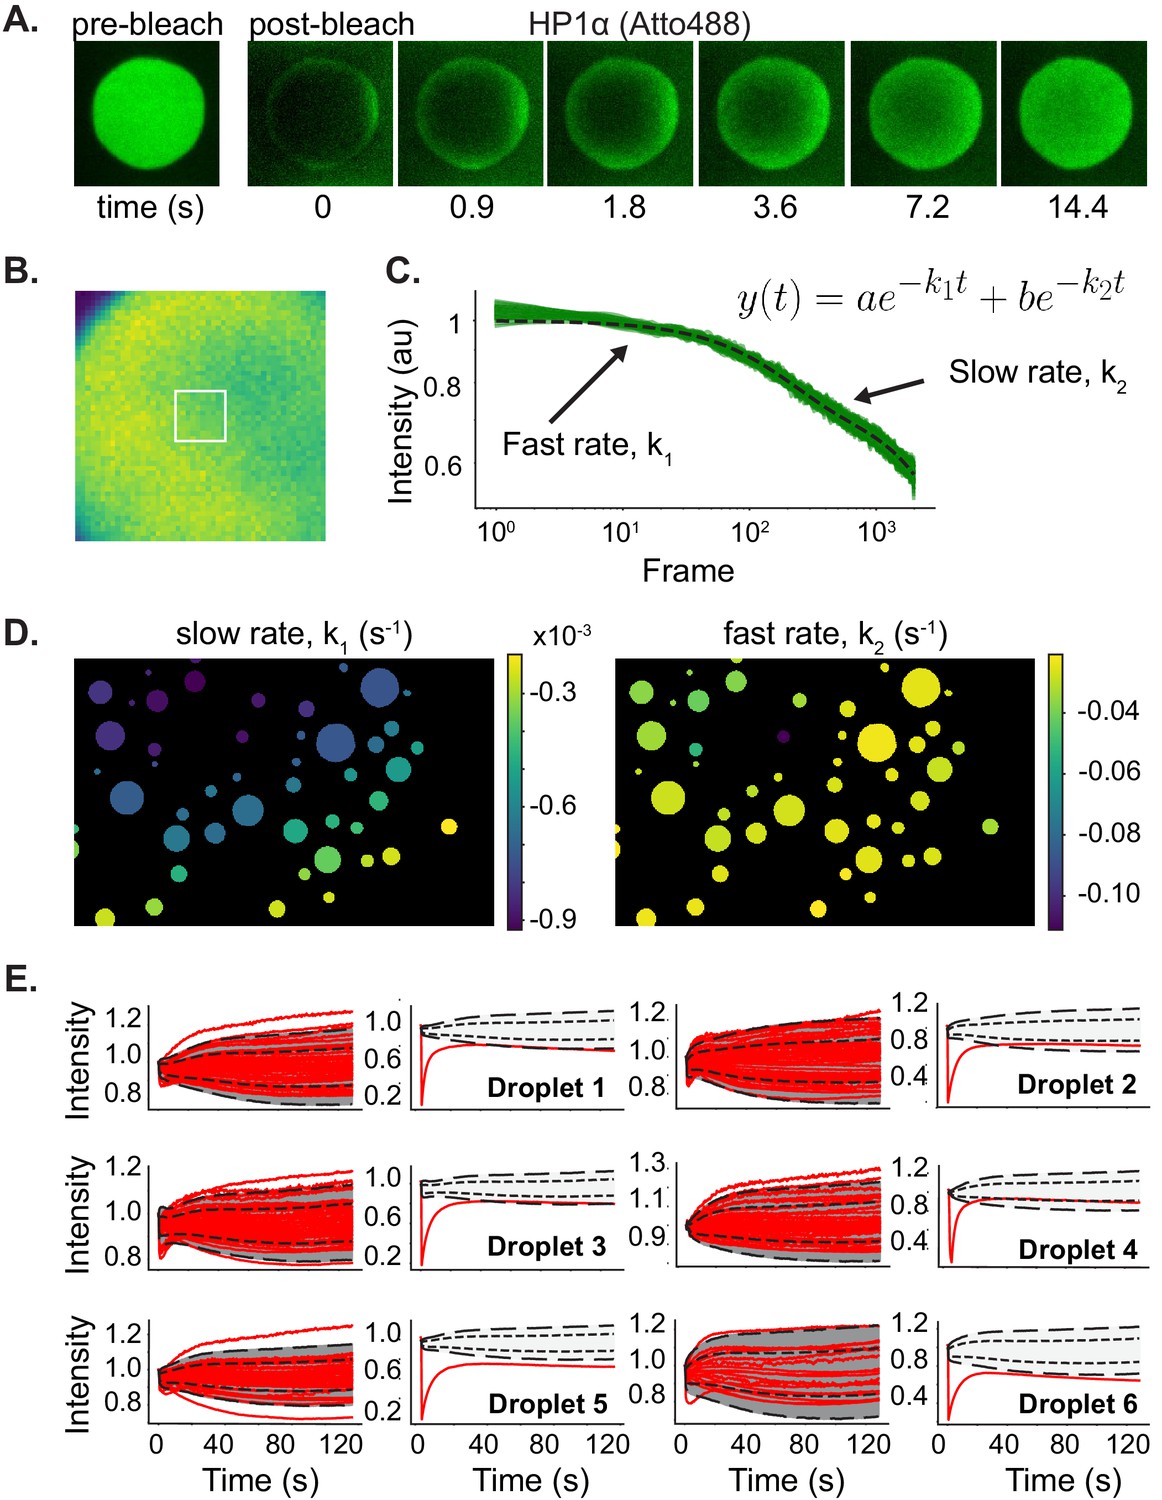
Whole droplet FRAP of HP1α−488 in HP1α-DNA condensates.
(A) Timestamped images of whole droplet HP1α−488 FRAP. (B and C) Time dependence of HP1α−488 fluorescence decay within (B) a sample condensate region (white box) under normal imaging conditions, (C) fit to a bi-exponential function. (D) Sample images colored by average decay rates. (E) Time dependence of fluorescent signal from unbleached condensates within the field of view (left) versus the photobleached condensate (right) for six FRAP experiments. Dotted lines indicate 1 and 2 standard deviations from the mean determined from the unbleached condensates.
Figure 3—figure supplement 2
FRAP of DNA and mixing of HP1α and DNA in condensates.
(A) FRAP of YOYO-1 in condensates. Timestamped images from FRAP experiments for four lengths of linear DNA (147 bp, 2.7 kbp, 9 kbp, or 50 kbp). (B) Recovery of YOYO-1 fluorescence intensity and (C) half-life of recovery plotted for each DNA length tested. (*) indicates half-life not determined. N = 15 for each condition, error bars represent standard deviations. (D) Timestamped images of two-color HP1α-DNA condensate mixing experiments. Condensates formed separately with 2.7 kbp unlabeled DNA and either HP1α−488 (green) or HP1α−565 (magenta). (E) Timestamped images of two-color HP1α-DNA condensate mixing experiments. Condensates formed separately with HP1α and 2.7 kbp DNA-488 (green) or 2.7 kbp DNA-565 (magenta).
Figure 4 with 1 supplement
HP1α-DNA condensates resist disruptive forces and retain memory of past strain.
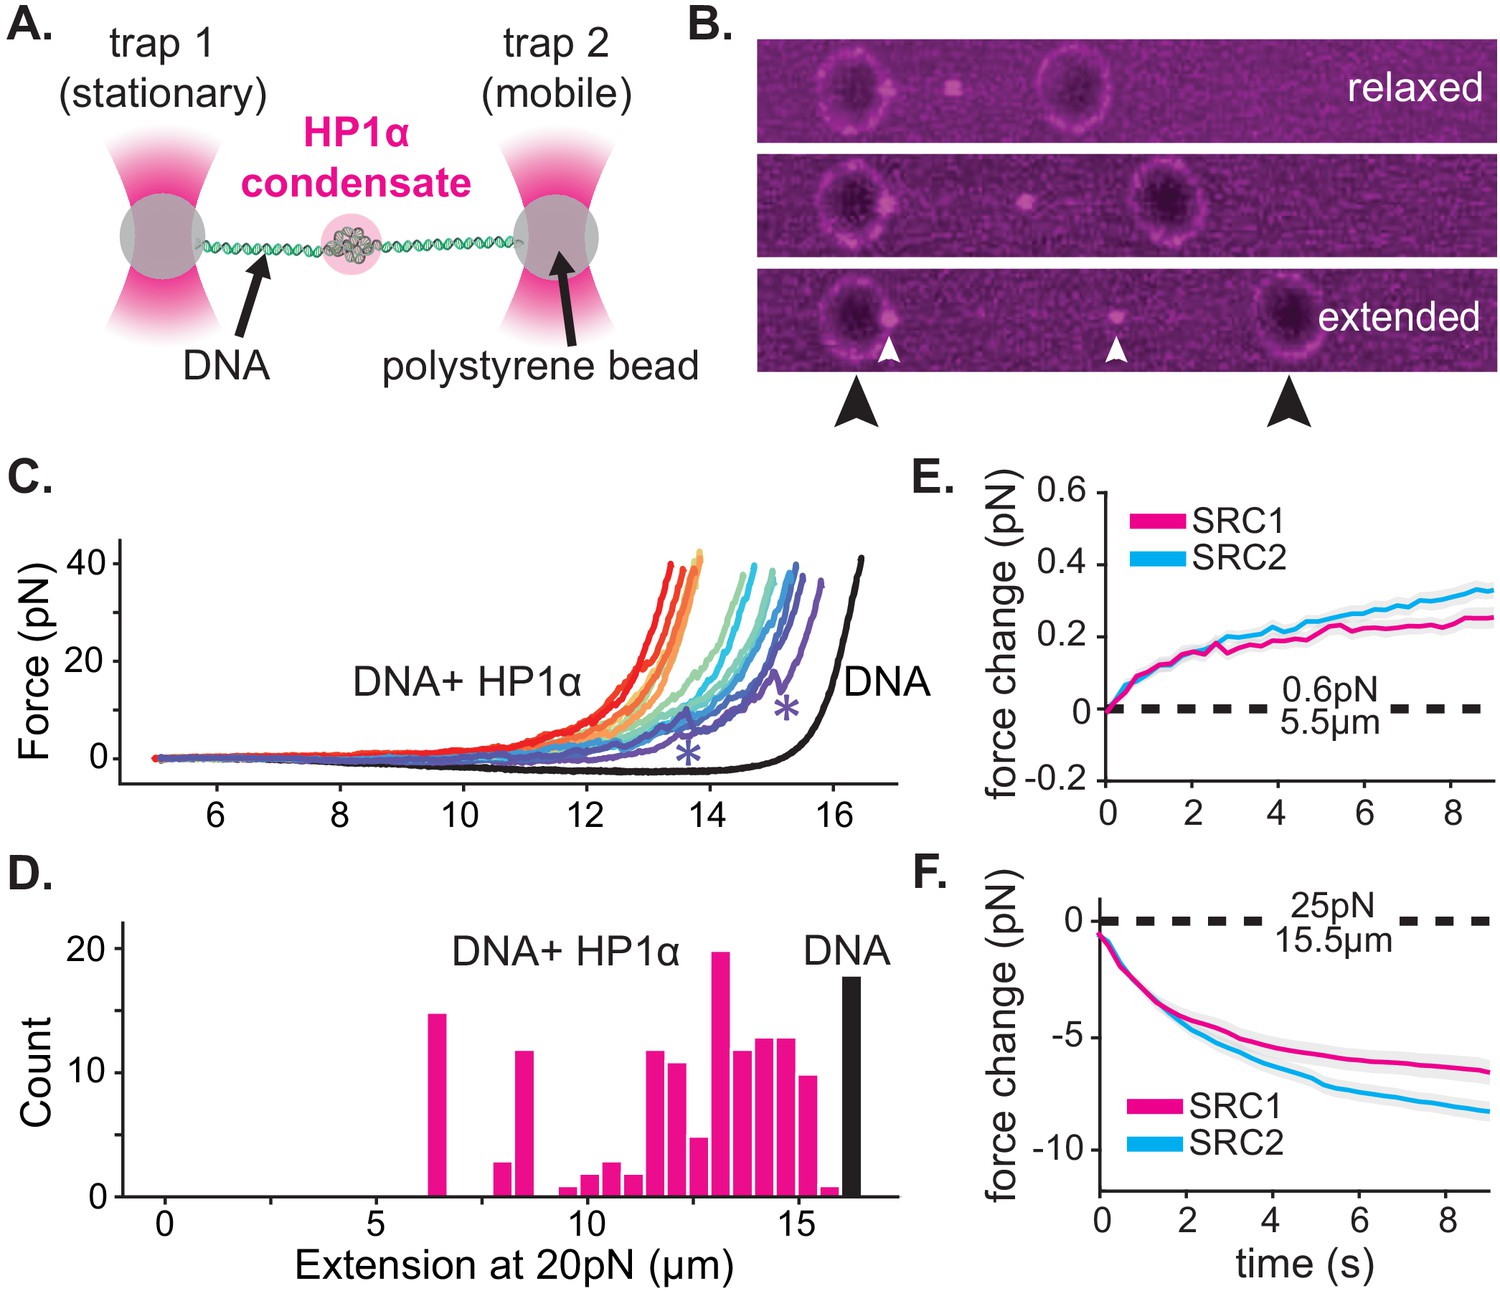
(A) Cartoon of optical trap experiments. (B) Confocal images of relaxed, intermediate, and extended states of DNA (unlabeled) in the presence of HP1α (magenta). Black arrowheads indicate trapped beads and white arrowheads indicate HP1α-DNA condensates. (C) Force extension curves for DNA in the absence (black line) or presence of HP1α (colored lines). Each trace represents a single stretch-relax cycle (SRC) of the same DNA strand. Traces are colored by pulling order from first extension (violet) to the final extension (red). * indicates rupture event. (D) Histogram of DNA extension at 20 pN in the absence (black) or presence of HP1α (magenta). N = 150, 10 DNA strands pulled fifteen individual times each. (E and F) Force change for DNA incubated with HP1α in (E) relaxed or (F) extended conformation. Shown is the average of the first (magenta) and second (cyan) SRC. Data are averaged over 17 DNA strands, gray shaded region represents SEM.
Figure 4—figure supplement 1
Representative traces and controls for optical trap experiments.
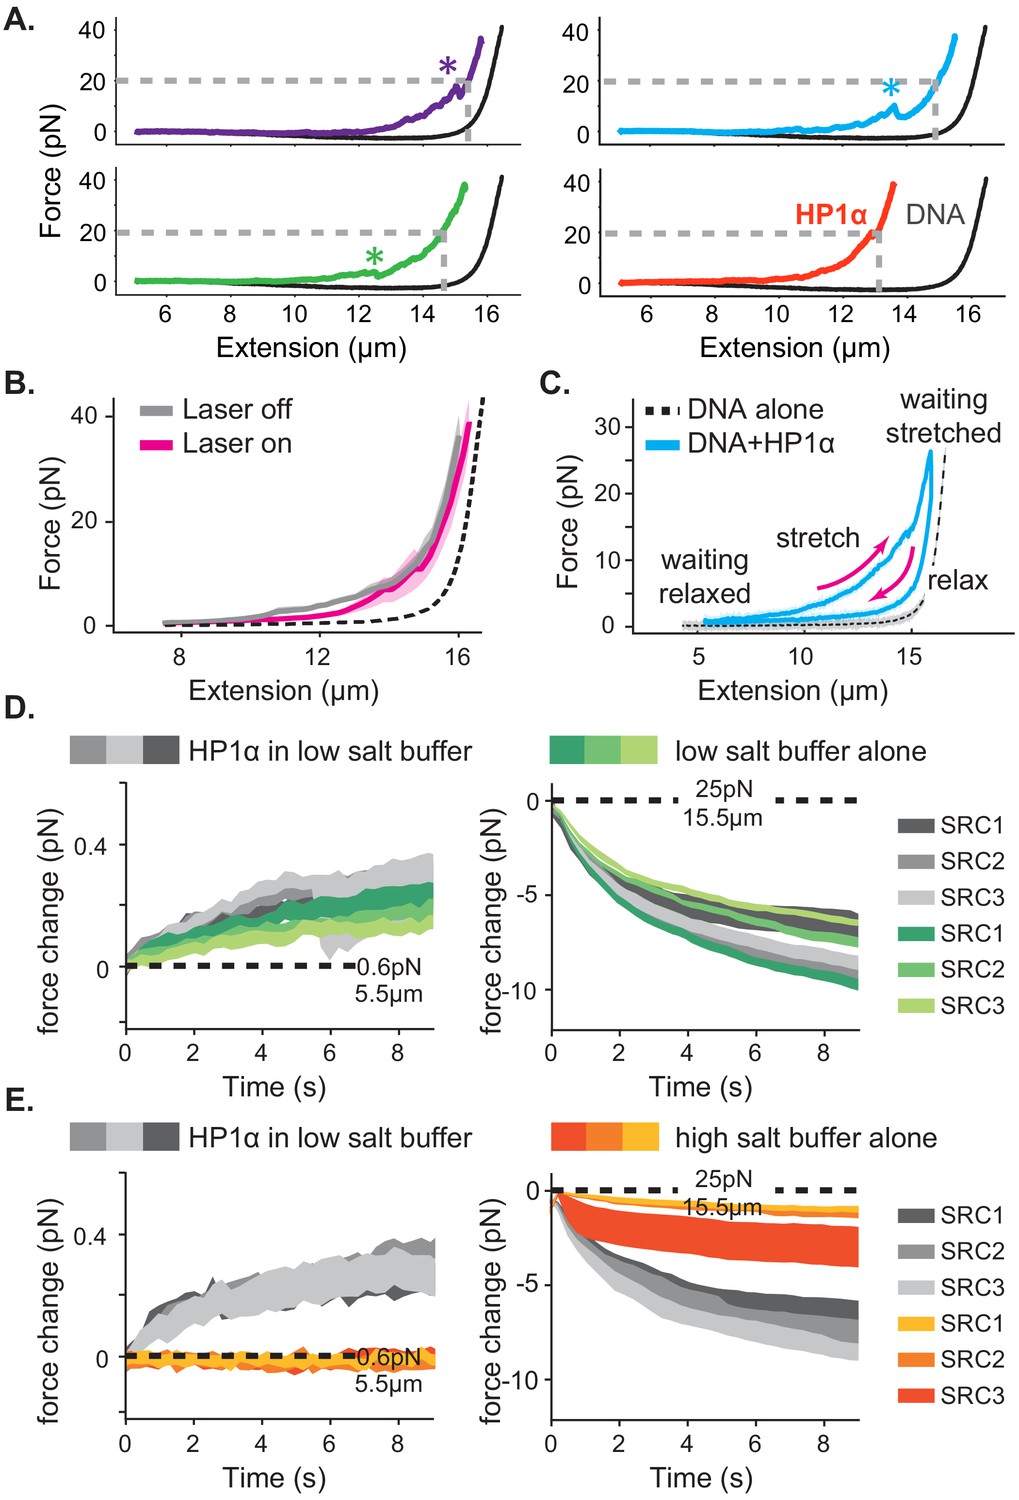
(A) Four representative traces from Figure 4C. All traces are separate pulls from the same DNA strand. * indicates rupture event. Gray dashed line indicates the DNA extension at 20pN force reported in Figure 4D. (B) Average force extension curves for the second SRC either with (magenta) or without (gray) laser illumination. The force extension curve of DNA alone is shown in black. (C) Force extension curve across a stretch-relax cycle including waiting periods in the extended or relaxed configurations. (D and E) Force change in the relaxed (left) and stretched (right) configurations in the presence (gray) and absence (green or orange) of HP1α. SRCs in the absence of protein performed in either (D) low salt (70 mM KCl, green) or (E) high-salt (500 mM KCl, orange) buffer. Data are averaged over 17 DNA strands, filled colored regions represent SEM.
Figure 5 with 1 supplement
The hinge region of HP1α is sufficient for DNA compaction and condensate formation.
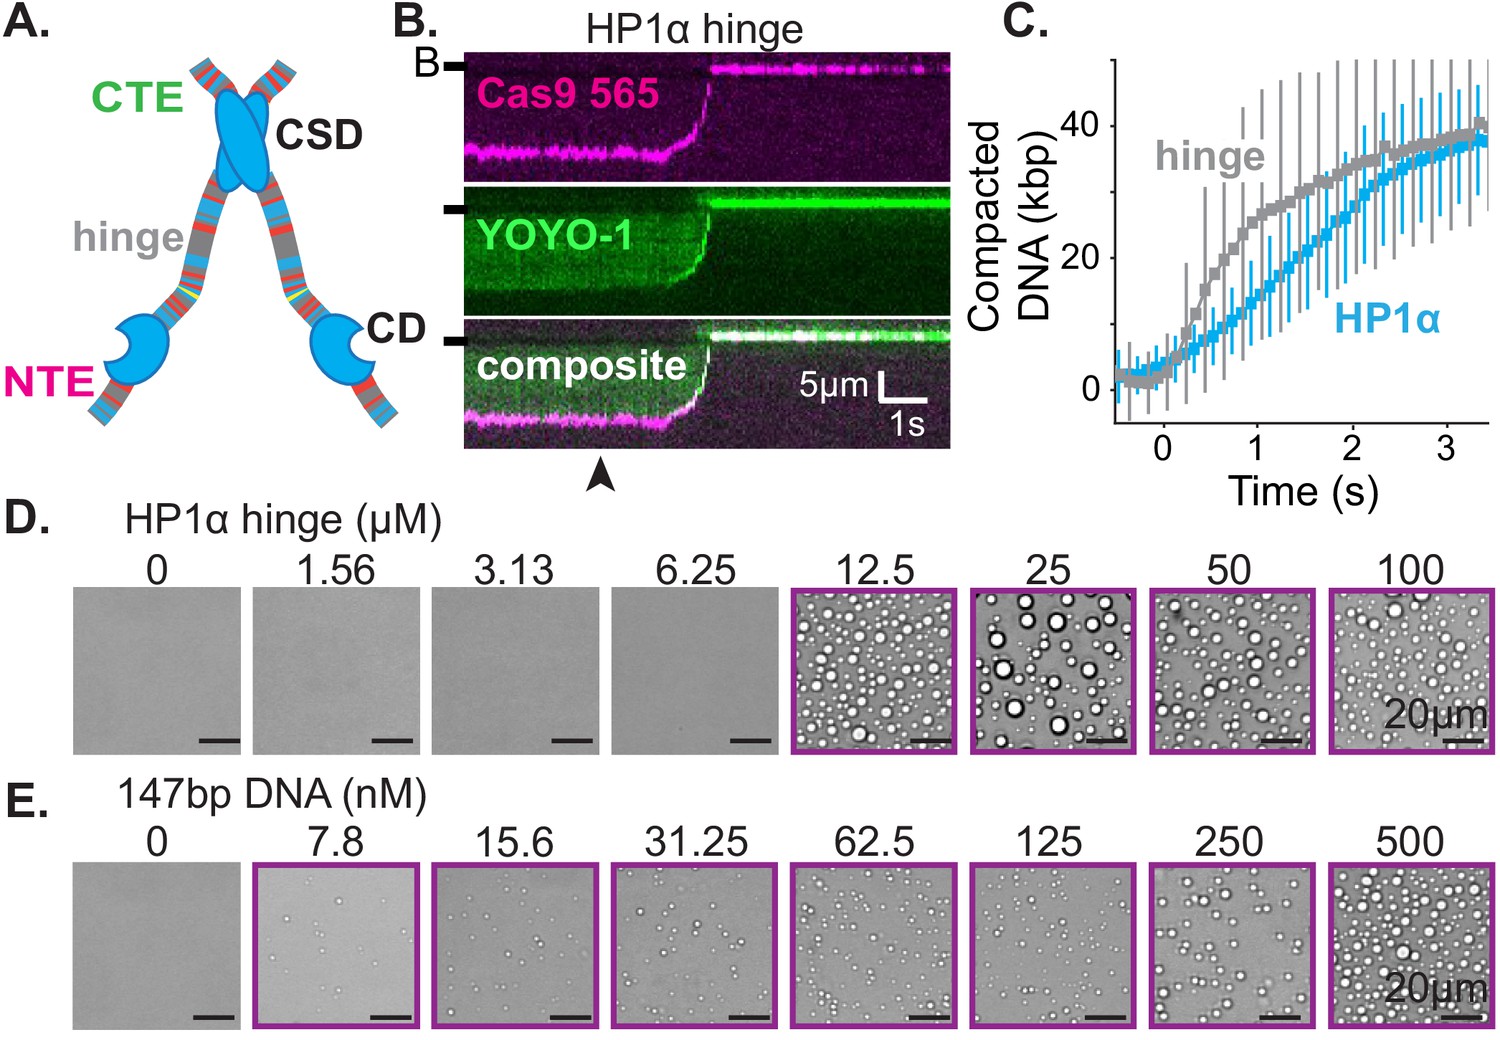
(A) Cartoon of HP1α with color-coded disordered regions: positive residues (K and R) blue, negative residues (E and D) red, proline yellow, and all other residues gray. Key HP1α domains are labeled: chromodomain (CD), chromoshadow domain (CSD), hinge, N-terminal extension (NTE), and C-terminal extension (CTE). (B) Kymogram of DNA compaction by the hinge domain. DNA is labeled with dCas9 (top) and YOYO-1 (middle), also shown as composite image (bottom). Arrowhead represent estimated time of protein injection. (B-) or (-) specifies location of the barrier. (C) Average DNA compaction by 5 μM HP1α (N = 157) and 5 μM HP1α-hinge (N = 169), error bars represent standard deviations. (D and E) Bright-field images of the HP1α-hinge and DNA. (D) Titration of the HP1α-hinge with 500 nM 147 bp DNA. (E) Titration of 147 bp DNA with 12.5 μM HP1α-hinge. Purple boxes indicate presence of condensates.
Figure 5—figure supplement 1
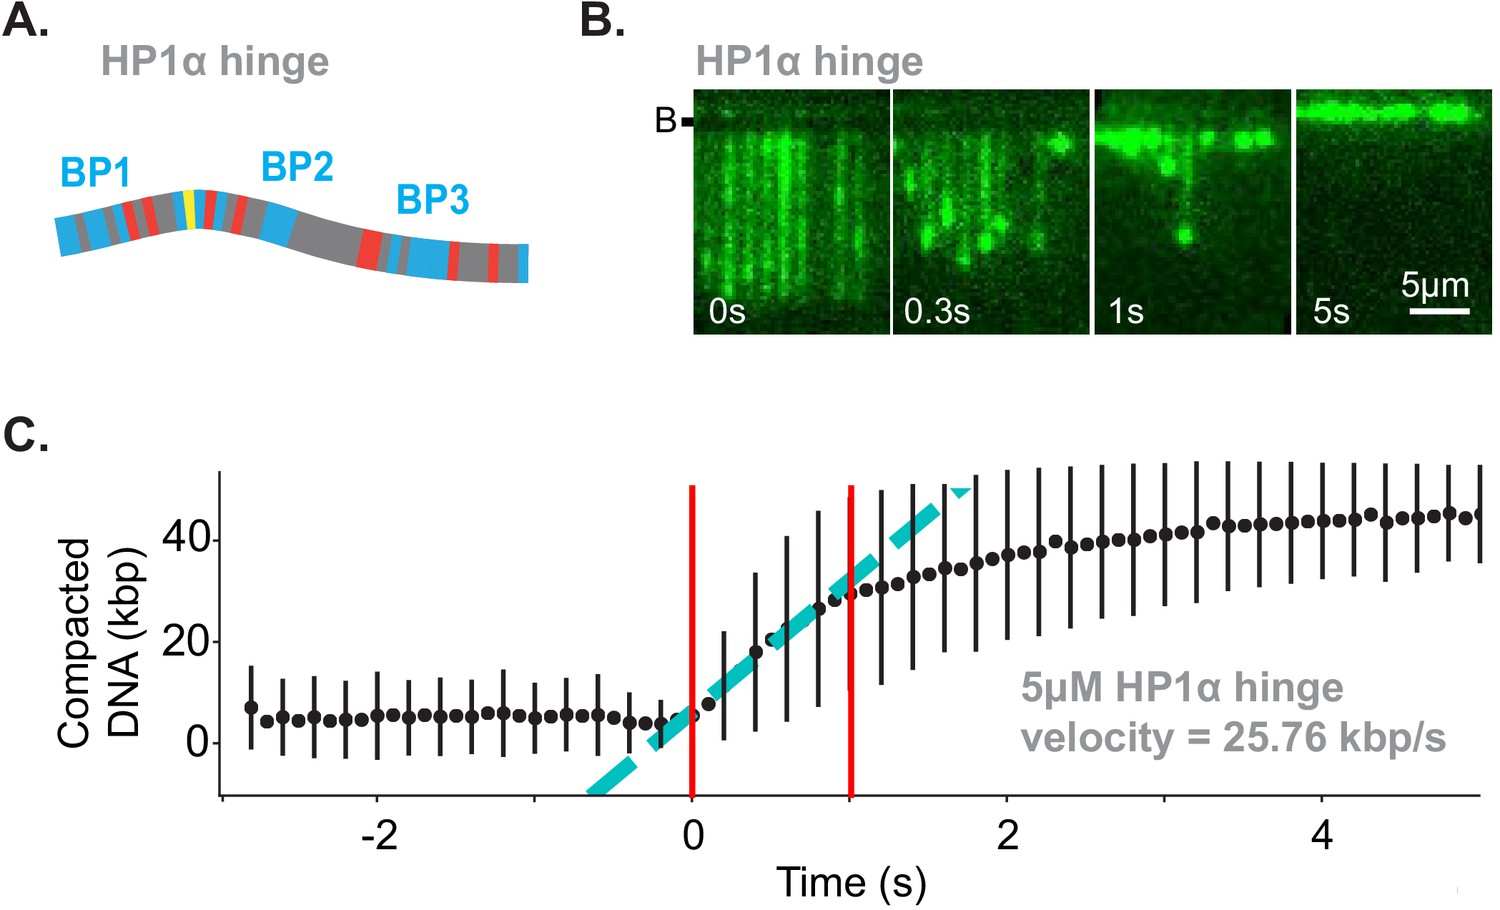
The hinge region of HP1 is sufficient for DNA compaction.
(A) Cartoon of HP1α hinge with color-coded disordered residues: positive residues (K and R) blue, negative residues (E and D) red, proline yellow, and all other residues grey. The HP1α hinge contains three basic patches (BP). (B) Timestamped images of DNA labeled with YOYO-1 undergoing compaction by 5 μM HP1α hinge (unlabeled) shown before, during, and after compaction. (B-) specifies location of the barrier. (C) Average DNA compaction by the HP1α hinge (N = 169). Error bars represent standard deviations. Compaction velocity estimated from linear fit to data (cyan). Fit constrained to the region within the two red lines.
Figure 6 with 2 supplements
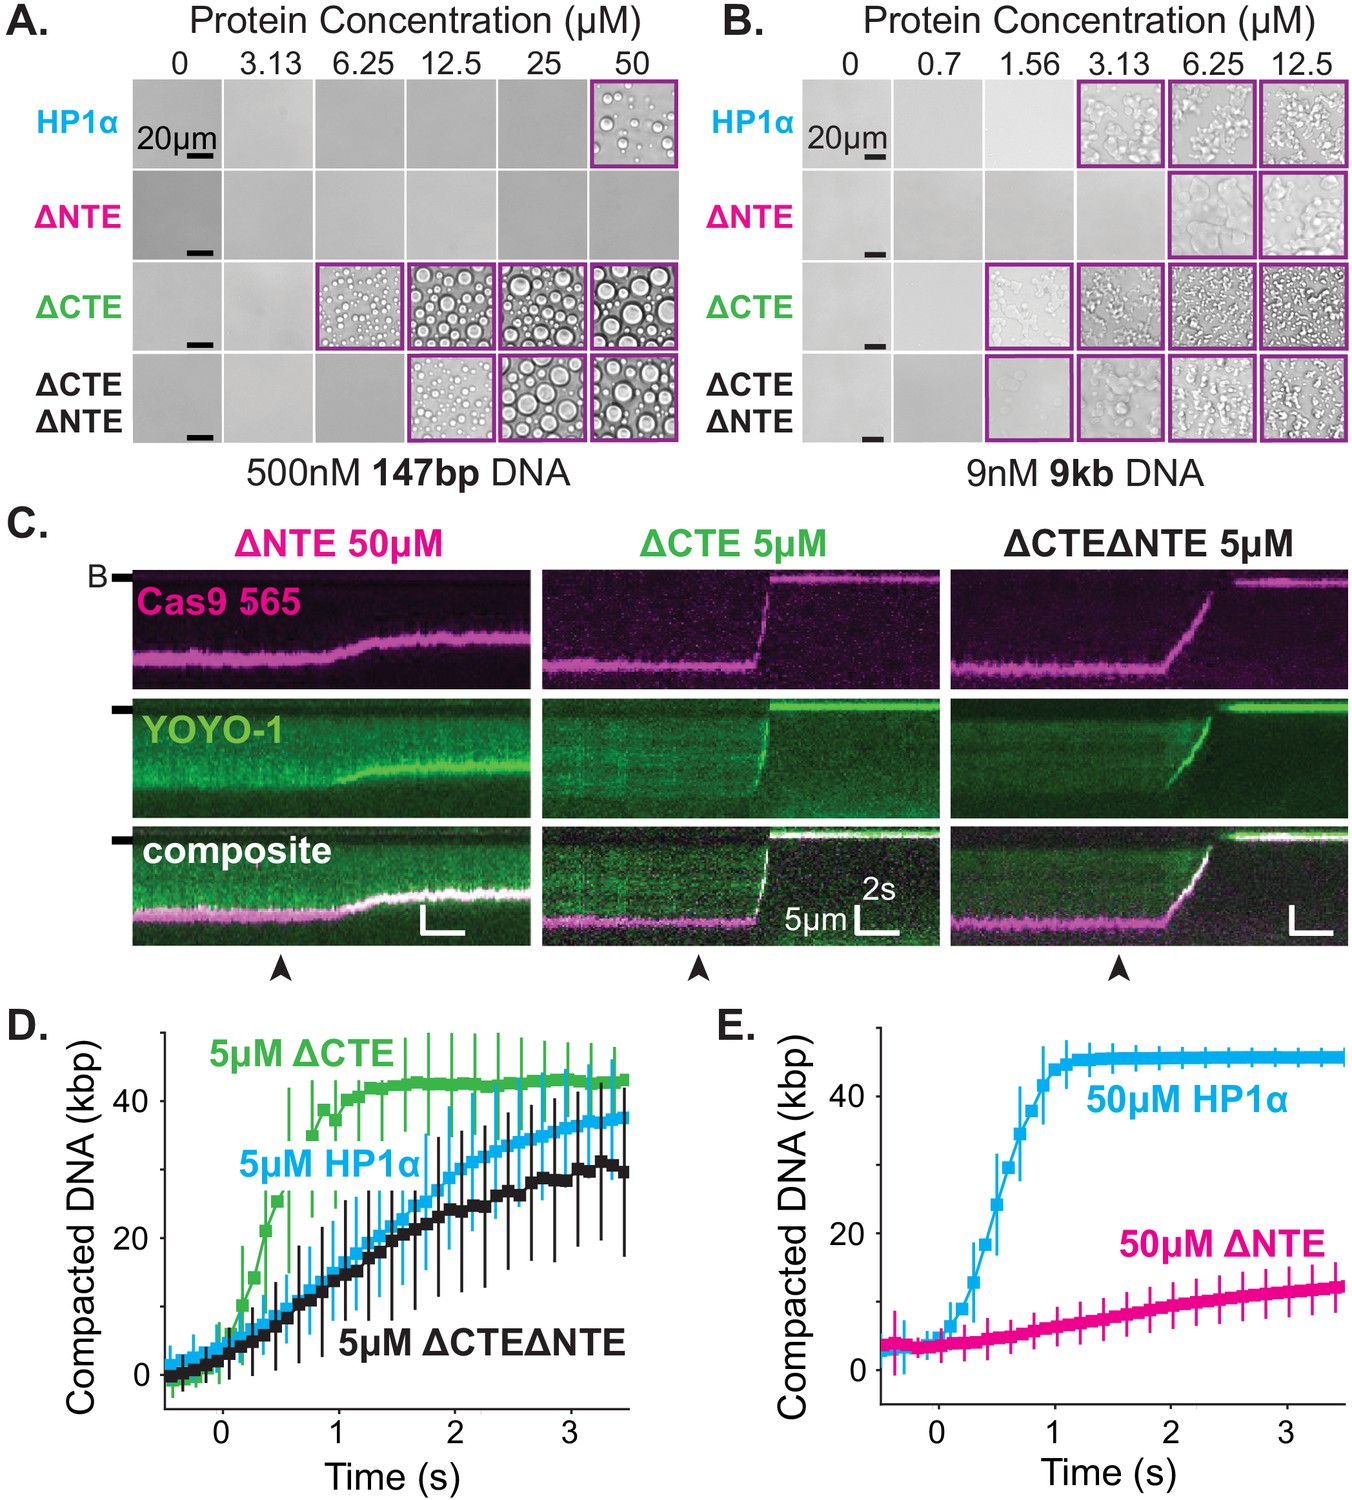
The disordered extensions of HP1α regulate DNA compaction and condensate formation.
(A and B) Bright-field images of HP1α domain mutants and DNA. (A) Titration of HP1α domain mutants with 500 nM 147 bp DNA. (B) Titration of HP1α domain mutants with 9 nM 9 kbp DNA. Purple boxes indicate presence of condensates. (C) Kymograms of DNA compaction by HP1α domain mutants. DNA is labeled with dCas9 (top) and YOYO-1 (middle), also shown as composite image (bottom). Data shown for reactions including 50 μM HP1αΔNTE, 5 μM HP1αΔCTE, and 5 μM HP1αΔNTEΔCTE, respectively. Arrowheads represent estimated time of protein injection. (B-) or (-) specifies location of the barrier. (D) Average DNA compaction by 5 μM HP1α (N = 157), 5 μM HP1αΔCTE (N = 96), and 5 μM HP1αΔCTEΔNTE (N = 89). (E) Average DNA compaction by 50 μM HP1α (N = 272) and 50 μM HP1αΔNTE (N = 163). In (D) and (E) error bars represent standard deviations.
Figure 6—figure supplement 1
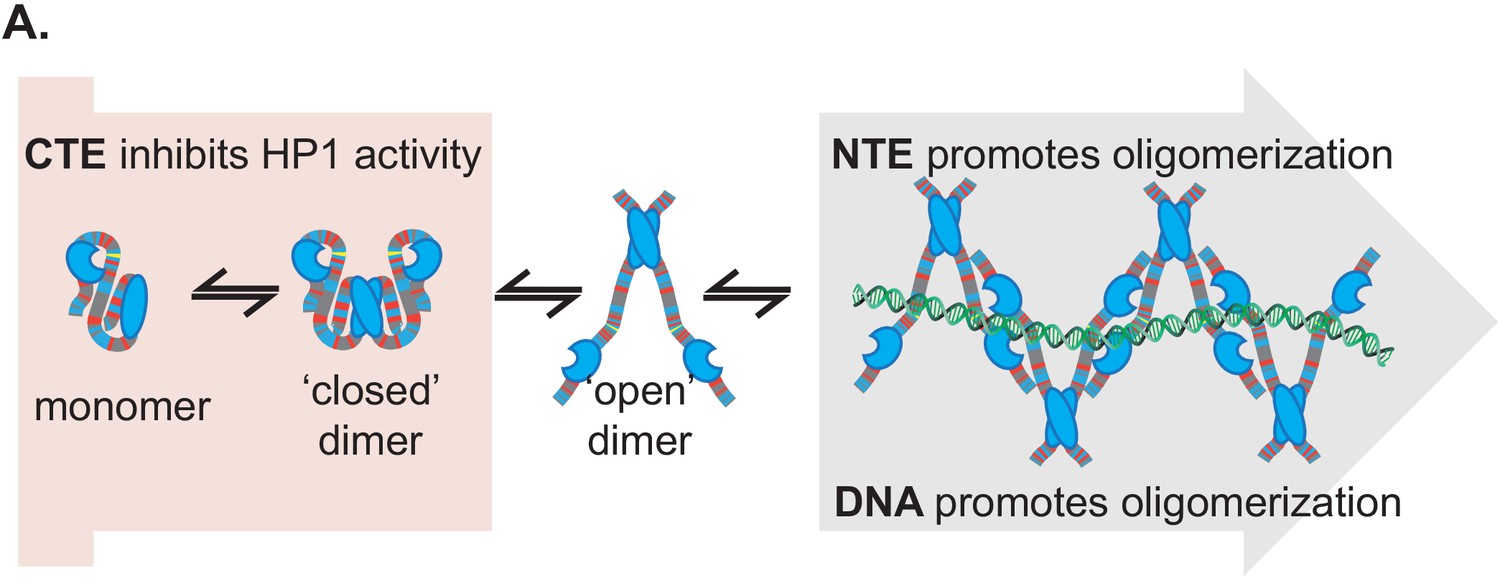
Proposed model of HP1α autoregulation and potential oligomerization.
(A) Proposed model of HP1α autoregulation and potential oligomerization.
Figure 6—figure supplement 2
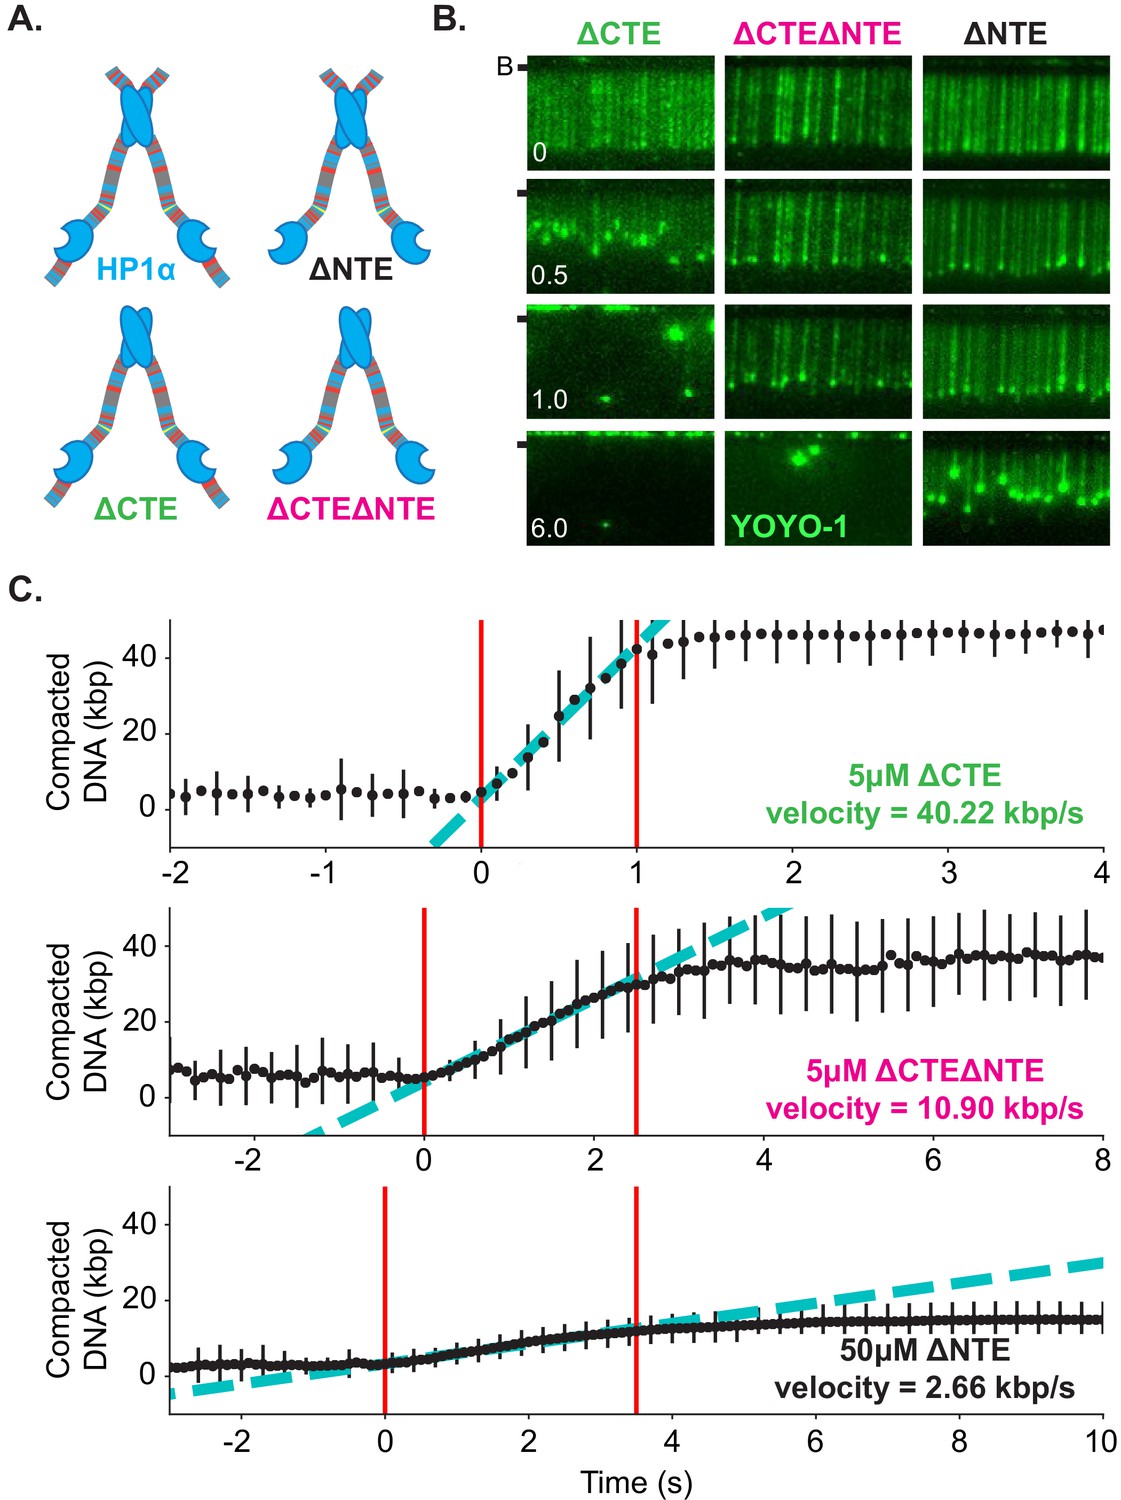
DNA compaction activity of HP1α domain mutants.
(A) Cartoon of HP1α extension mutants with color-coded disordered residues: positive residues (K and R) blue, negative residues (E and D) red, proline yellow, and all other residues grey. (B) Timestamped images of DNA labeled with YOYO-1 undergoing compaction by 5 μM HP1αΔCTE, 5 μM HP1αΔNTEΔCTE, and 50 μM HP1αΔNTE (unlabeled) shown before, during, and after compaction. (B-) or (-) specifies location of the barrier. (C) Average DNA compaction by each HP1α mutant, HP1αΔCTE (N = 96), HP1αΔCTEΔNTE (N = 89), and HP1αΔNTE (N = 163). Error bars represent standard deviations. Compaction velocity estimated from linear fit to data (cyan). Fit constrained to the region within the two red lines.
Figure 7 with 1 supplement
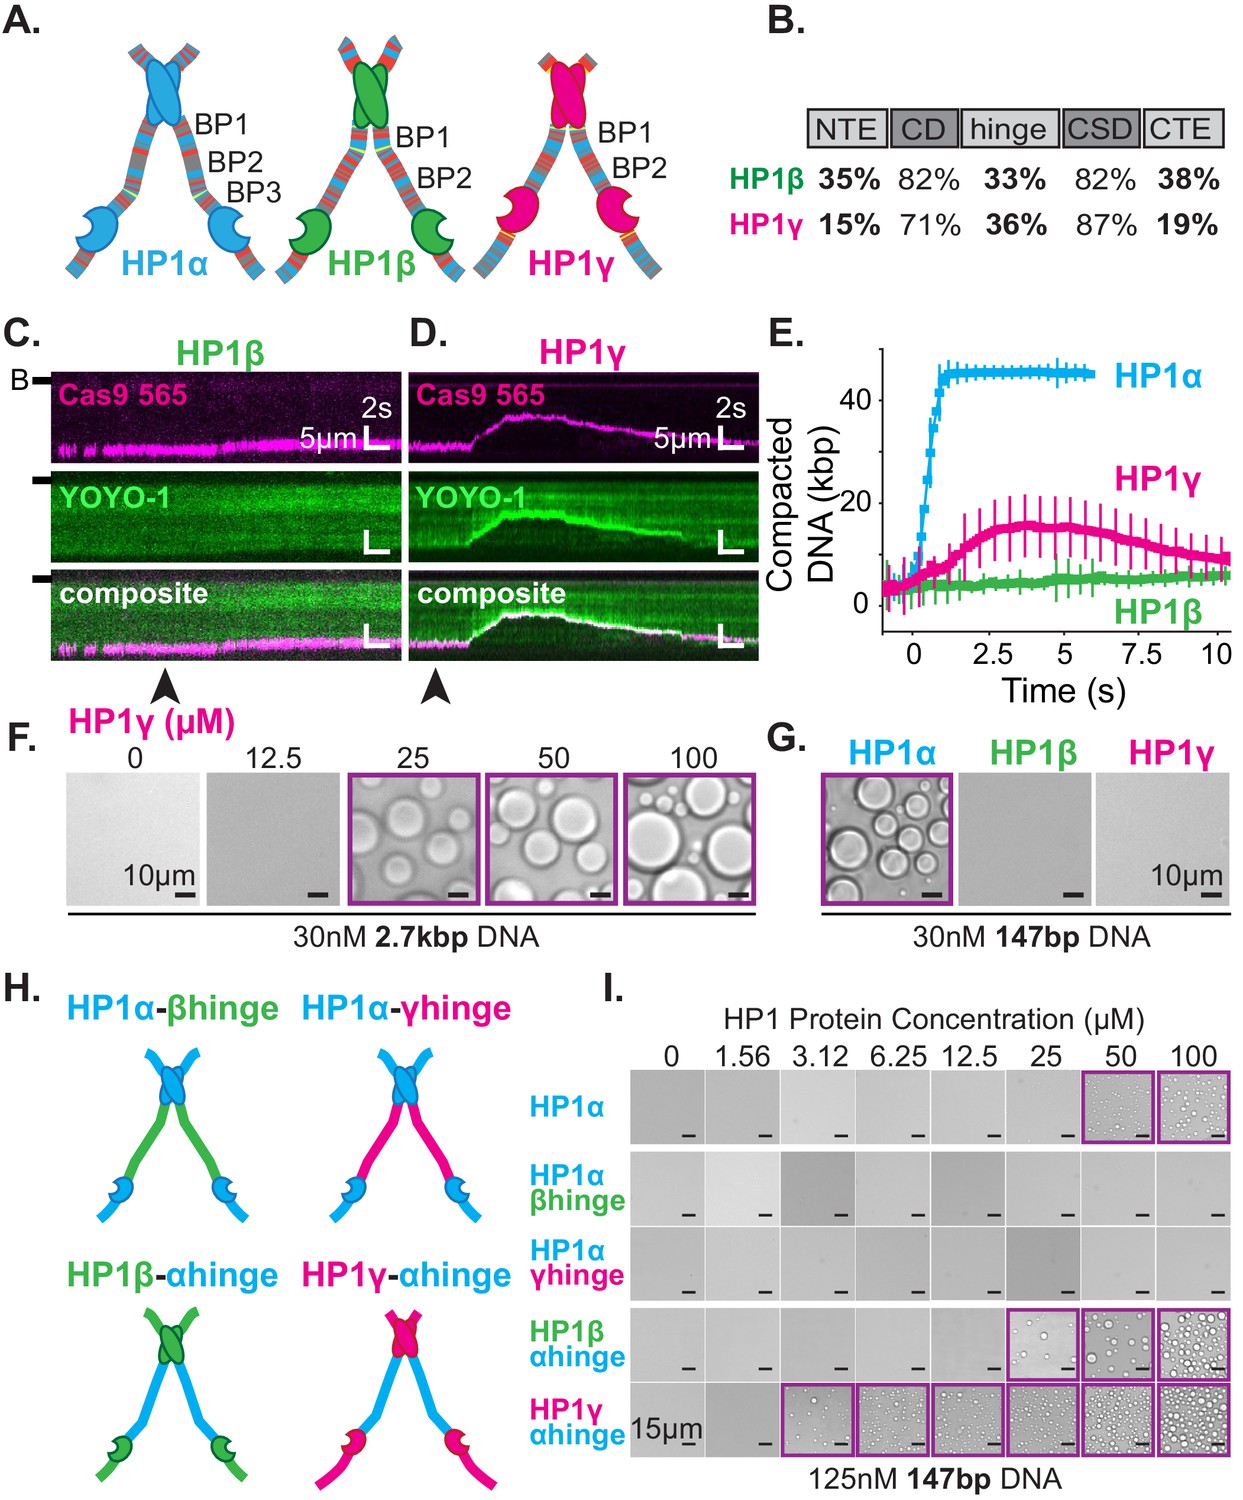
DNA compaction and condensate formation activity of HP1β and HP1γ.
(A) Cartoons of the three paralogs of human HP1 with color-coded disordered residues: positive residues (K and R) blue, negative residues (E and D) red, proline yellow, and all other residues gray. Basic patches (BP) for each paralog are labeled. (B) Comparison of amino acid homology between HP1α and HP1β or HP1γ. (C and D) Kymograms of DNA compaction by (C) HP1β and (D) HP1γ. DNA is labeled with dCas9 (top) and YOYO-1 (middle), also shown as composite image (bottom). Arrowheads represent estimated time of protein injection. (B-) or (-) specifies location of the barrier. (E) Average DNA compaction by 50 μM HP1α (N = 272), HP1β (N = 86), and HP1γ (N = 54). Error bars represent standard deviations. (F) Bright-field images of HP1γ and 2.7 kbp DNA. (G) Bright-field images of 100 μM HP1α, HP1β, or HP1γ and 147 bp DNA. (H) Cartoon of HP1 hinge domain swaps. (I) Bright-field images of HP1 domain swap mutants and 147 bp DNA. Purple boxes indicate presence of condensates.
Figure 7—figure supplement 1

DNA compaction by HP1β and HP1γ.
(A and B) Kymograms of DNA compaction by 50 μM HP1β (left) and HP1γ (right). (A) DNA labeled with YOYO-1 (top), dCas9-565 (middle), and composite image (bottom). (B) HP1α−488 (top), DNA labeled with dCas9-565 (middle), and composite image (bottom). (B-) or (-) specifies location of the barrier.( C) Average DNA compaction by HP1β (N = 86, top) and HP1γ (N = 54, bottom). Error bars represent standard deviations. Compaction velocity estimated from linear fit to data (cyan). Fit constrained to the region within the two red lines. (D) Bright-field images of HP1β (top) and HP1γ (bottom) and 9 kbp DNA.
Figure 8
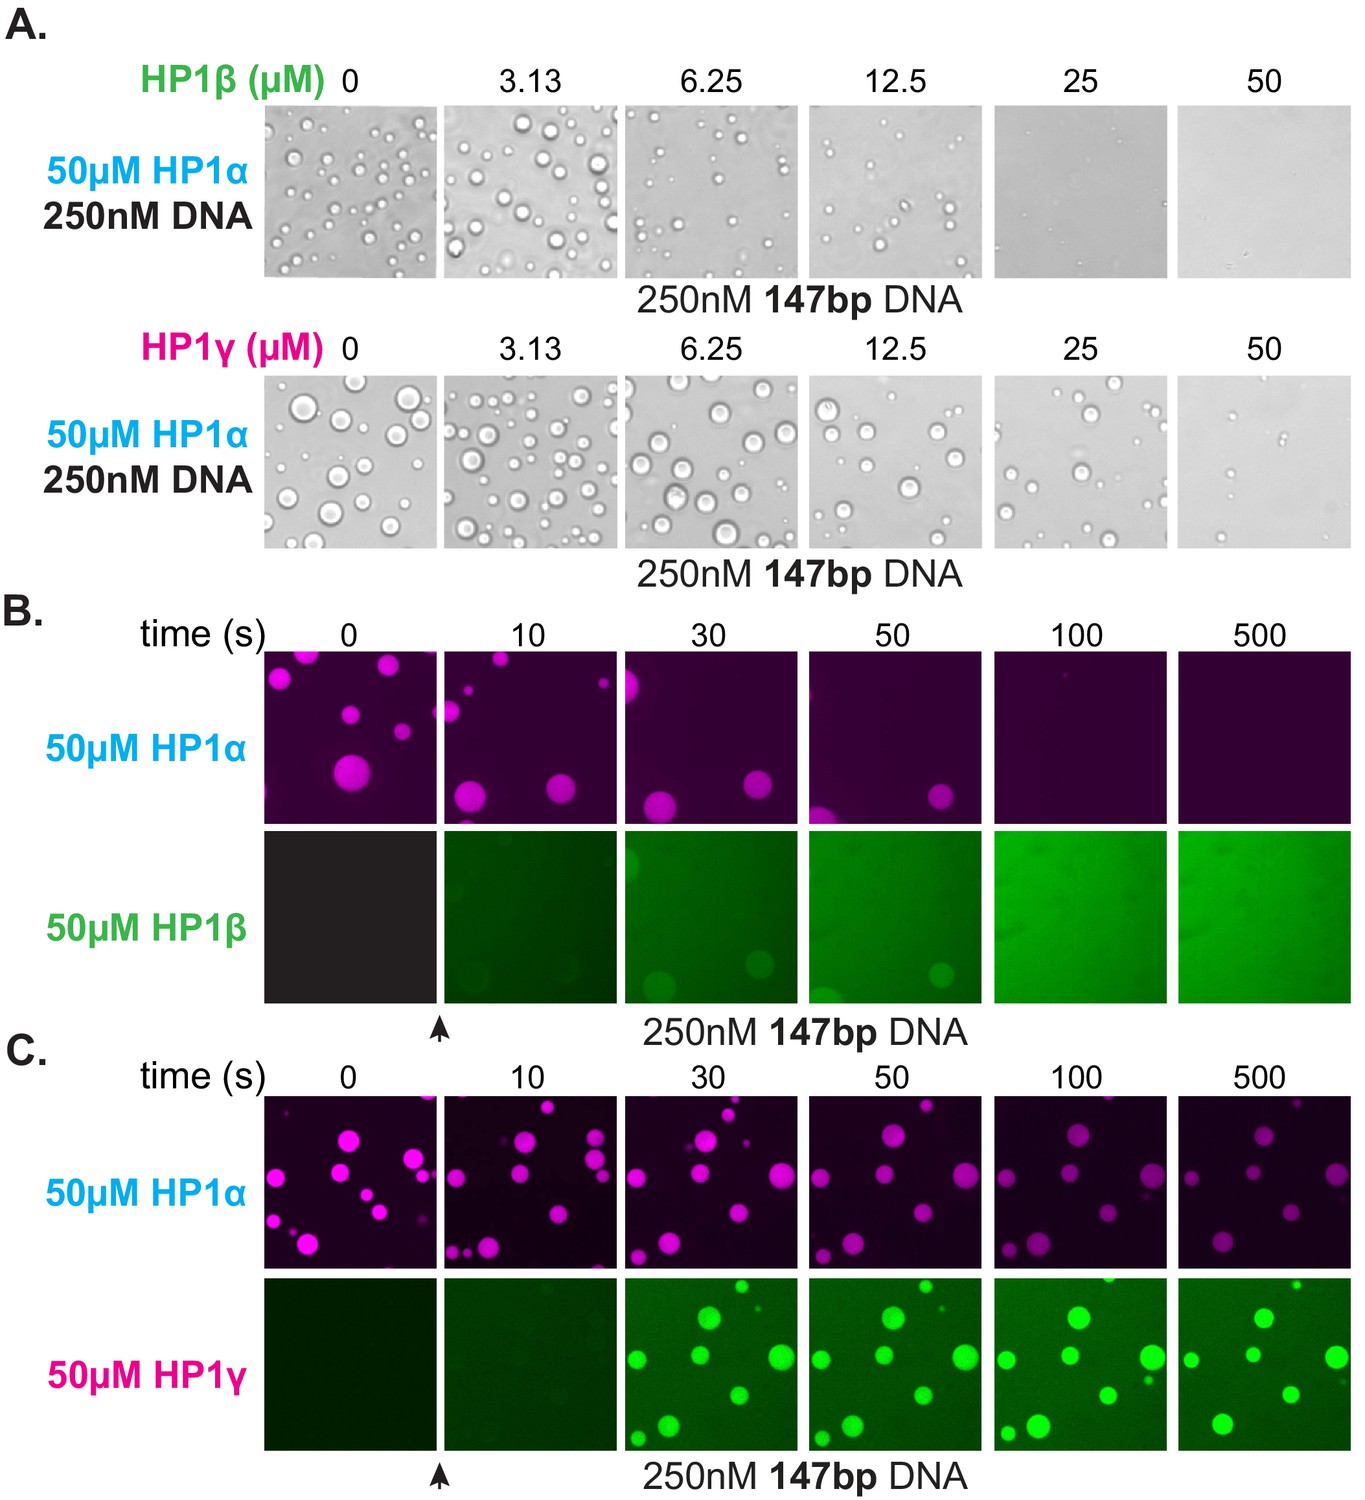
Effect of HP1β and HP1γ on HP1α-DNA condensate formation and stability.
(A) Bright-field images of DNA and pre-incubated mixtures of HP1α and HP1β (top) or HP1α and HP1γ (bottom). (B and C) Confocal images showing a time course of HP1α condensates after injection of (B) HP1β or (C) HP1γ.
Figure 9

Microscopic to macroscopic activity of HP1α.
(A) At the microscopic scale, interactions between the terminal extensions and hinge domain toggles HP1α between autoinhibited and active states. DNA biases HP1α to the active state. (B) At the intermediate scale, HP1α and DNA cluster into proto-condensates. (C) If HP1α is present above the critical concentration, proto-condensates aggregate into large macroscopic droplets characterized by liquid behavior of HP1α and static DNA held in sub-condensate domains. (D) At genomic loci, HP1α condensates are remodeled by forces, resisting and strengthening in response to instantaneous forces, but relaxing and weakening in response to sustained forces. HP1α domains are also subject to disruption and reinforcement from HP1-interacting proteins like HP1β.
Additional files
-
Supplementary file 1
Tabulated data reported in Figure 2B–C and shown in Figure 2—figure supplement 1.
- https://cdn.elifesciences.org/articles/64563/elife-64563-supp1-v1.docx
-
Supplementary file 2
Protein sequences used in this study.
Chromodomains (CD) and chromoshadow domains (CSD) are indicated in bold. A 6xHis tag followed by TEV cleavage site tag (MGHHHHHHDYDIPTTENLYFQGS) was appended to each construct for purification.
- https://cdn.elifesciences.org/articles/64563/elife-64563-supp2-v1.xlsx
-
Transparent reporting form
- https://cdn.elifesciences.org/articles/64563/elife-64563-transrepform-v1.docx
Download links
A two-part list of links to download the article, or parts of the article, in various formats.
Downloads (link to download the article as PDF)
Open citations (links to open the citations from this article in various online reference manager services)
Cite this article (links to download the citations from this article in formats compatible with various reference manager tools)
HP1 proteins compact DNA into mechanically and positionally stable phase separated domains
eLife 10:e64563.
https://doi.org/10.7554/eLife.64563


