Yeast Nuak1 phosphorylates histone H3 threonine 11 in low glucose stress by the cooperation of AMPK and CK2 signaling
- Stowers Institute for Medical Research, United States
- Department of Pathology and Laboratory Medicine, University of Kansas Medical Center, United States
Figures
Figure 1 with 1 supplement
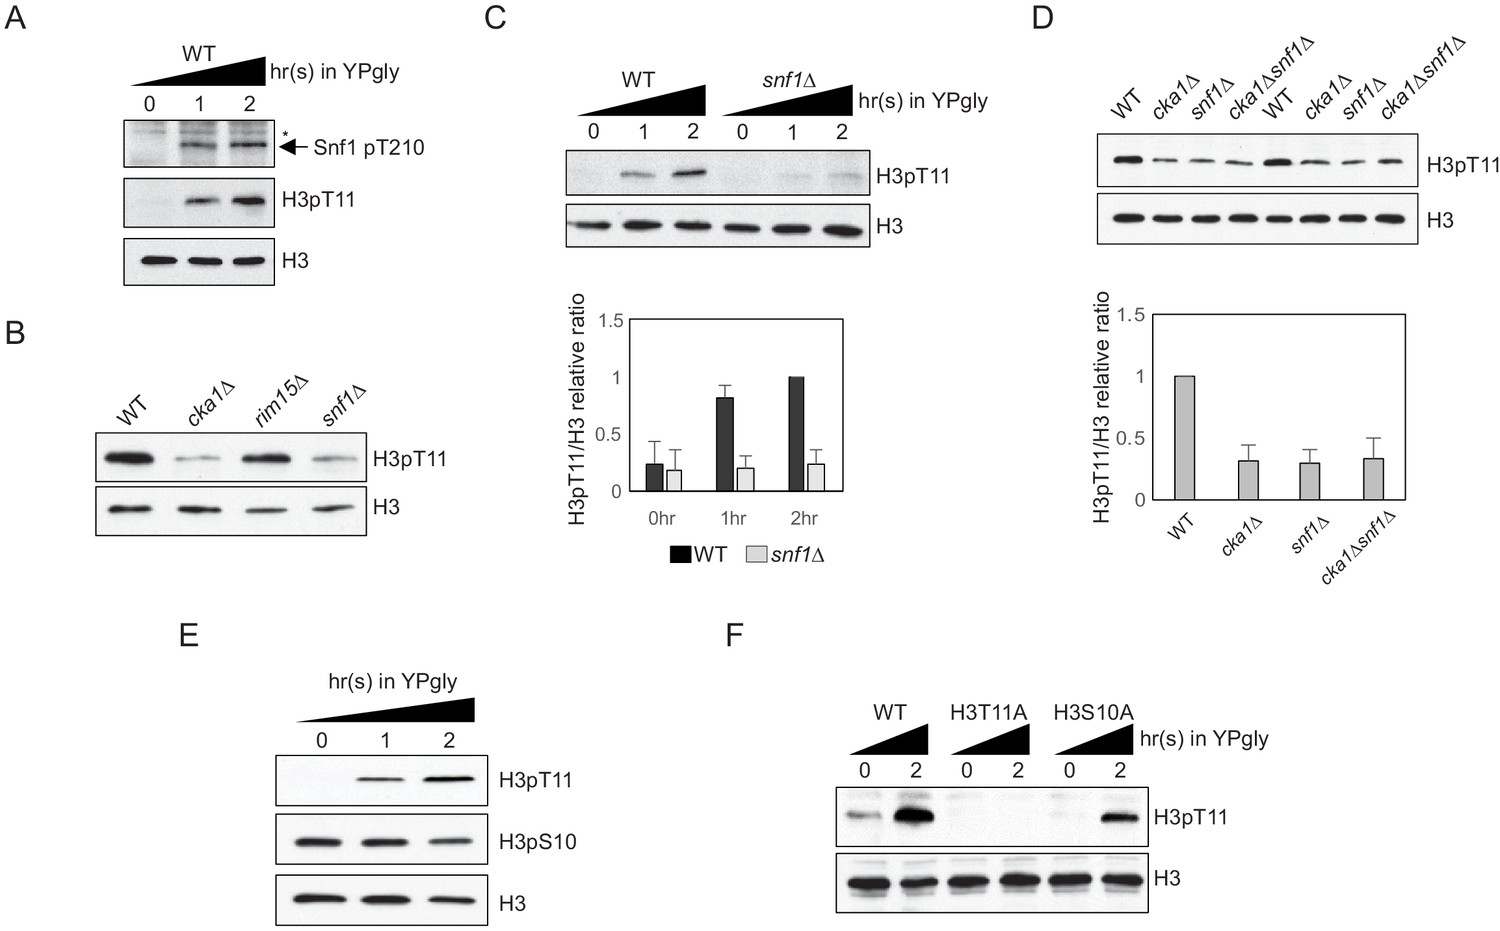
H3pT11 upon low glucose is dependent on Snf1, but not on H3pS10.
(A) Comparison of the Snf1 threonine 210 phosphorylation (Snf1 pT210) and H3pT11 levels upon media shift from YPD (2% glucose) to YPgly (YP with 3% glycerol) measured by western blots. (B) Global H3pT11 levels in WT (BY4741), cka1Δ, rim15Δ, and snf1Δ cells measured by western blot. The cells were taken from overnight saturated cultures in YPD media. (C) (Upper panel) Comparison of H3pT11 levels in WT and snf1Δ upon the media shift from YPD to YPgly at indicated time points analyzed by western blots. (Lower panel) Relative ratios of H3pT11 to H3 signals presented with error bars indicating standard deviations (STD) of three biological replicates. (D) (Upper panel) Global H3pT11 levels in WT, cka1Δ, snf1Δ, and cka1Δsnf1Δ cells taken from saturated cultures in YPD media measured by western blots. (Lower panel) Relative band intensities of H3pT11 to H3 signals. Error bars indicate STD from three biological replicates. (E) Changes in H3pT11 and H3pS10 signals in the WT strain (BY4741) upon the media shift from YPD to YPgly at indicated time points measured by western blots. (F) Comparison of H3pT11 upon media shift from YPD to YPgly in WT (y1166), H3T11A, and H3S10A strains analyzed by western blots.
Figure 1—figure supplement 1
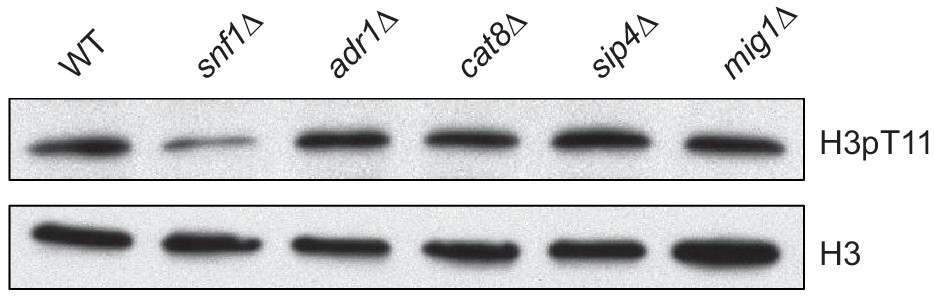
H3pT11 depends on Snf1, but not on Snf1 target transcription factors.
Global H3pT11 levels in WT (BY4741), snf1Δ, and the deletion mutants of Snf1 target transcription factors (adr1Δ, cat8Δ, sip4Δ, and mig1Δ) analyzed by western blots. The cells were taken from overnight saturated cultures in YPD media.
Figure 2

Snf1 and CK2 are not direct kinases for H3pT11.
(A) (Left) Global H3pT11 and H3pS10 levels of Snf1 complex α subunit (Snf1), γ subunit (Snf4), and β subunit (Gal83, Sip1, and Sip2) deletion mutants compared to WT (BY4741) analyzed by western blots. Cells were taken from saturated cultures in YPD media. (Right) The relative band intensities of H3pT11 to H3 with error bars indicating STD of three biological replicates. (B) In vitro kinase assay of recombinant GST-Cka1 and yeast TAP purified CK2 (yCK2) using recombinant Xenopus histone H3 as a substrate. The reaction mixtures were incubated at 30°C for 3 hr. (C) In vitro kinase assay of human recombinant CK2 complex (rCK2) and yCK2 using recombinant H3 as a substrate. The reaction mixtures were incubated at 30°C for 1 hr. (D) In vitro kinase assay of yCK2 with recombinant H3 as a substrate and 5 mM ATP or GTP as a phosphate donor. All reaction mixtures were incubated at 30°C for 2 hr. (E) In vitro kinase assay of yCK2 for H3 with increasing amount of CX-4945 treatment. yCK2 was pre-incubated with CX-4945 at 30°C for 10 min, then mixed with H3 for additional 1 hr at 30°C.
Figure 3 with 1 supplement

Tda1 is responsible for H3pT11 upon low glucose stress in vivo.
(A) Global H3pT11 levels in Snf1-interacting kinase mutant cells taken from saturated cultures in YPD media measured by western blots. (B and C) (Left panels) H3pT11 levels in WT, snf1Δ, and tda1Δ cells taken from (B) saturated cultures in YPD media or taken at (C) indicated time points upon media shift from YPD to YPgly analyzed by western blots. (Right panels) The relative band intensities of H3pT11 to H3 are presented with error bars indicating STD of three biological replicates. (D) Tda1 protein levels tagged with C-terminal 3xFLAG tag in the nuclei, cytoplasm, and whole-cell extracts (WCE) upon media shift from YPD to YPgly media at indicated time points measured by western blots against FLAG tag.
Figure 3—figure supplement 1
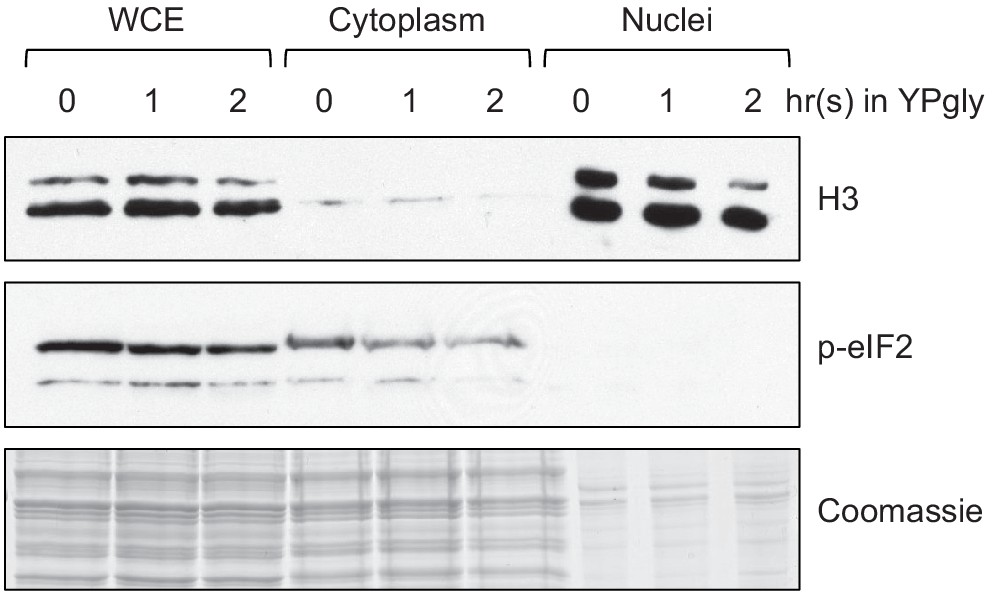
Confirmation of efficient yeast subcellular fractionation of the samples shown in Figure 3D.
One percent of whole-cell extract (WCE), 1% of cytoplasm, and 2% of nuclei samples used in Figure 3D were subjected to western blots to confirm efficient subcellular fractionation. Histone H3 and phosphorylated eIF2 (p-eIF2) antibodies were used as the nuclear and cytoplasmic markers, respectively.
Figure 4
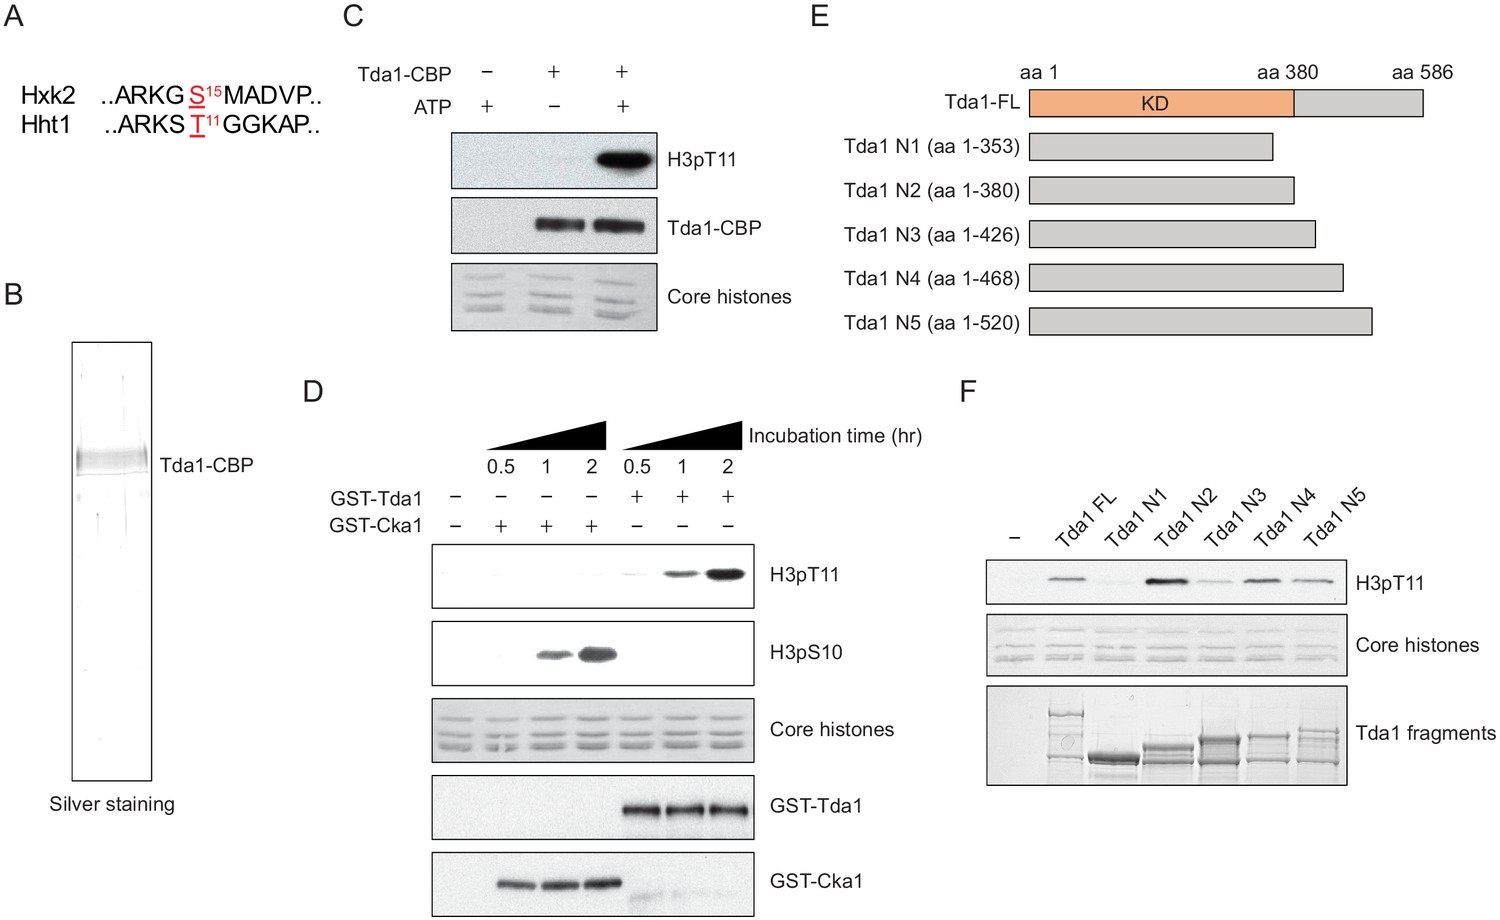
Tda1 phosphorylates H3 at T11 in vitro.
(A) Comparison between the surrounding sequences of Hxk2 serine 15 and H3 (Hht1) threonine 11. (B) Silver staining of TAP-purified Tda1 protein. (C) In vitro kinase assay of TAP purified Tda1 using core histones (H2A, H2B, H3, and H4) as substrates. The reaction mixtures were incubated at 30°C for 1 hr. (D) In vitro kinase assay of recombinant GST-Cka1 and GST-Tda1 purified from Escherichia coli using core histones (H2A, H2B, H3, and H4) as substrates. The reaction mixtures were incubated at 30°C for indicated times. (E) Schematic diagram of recombinant GST-Tda1 N-terminal fragments used in (F). (F) In vitro kinase assay of Tda1 N fragments using core histones as substrates. All reaction mixtures were incubated at 30°C for 2 hr.
Figure 5 with 1 supplement
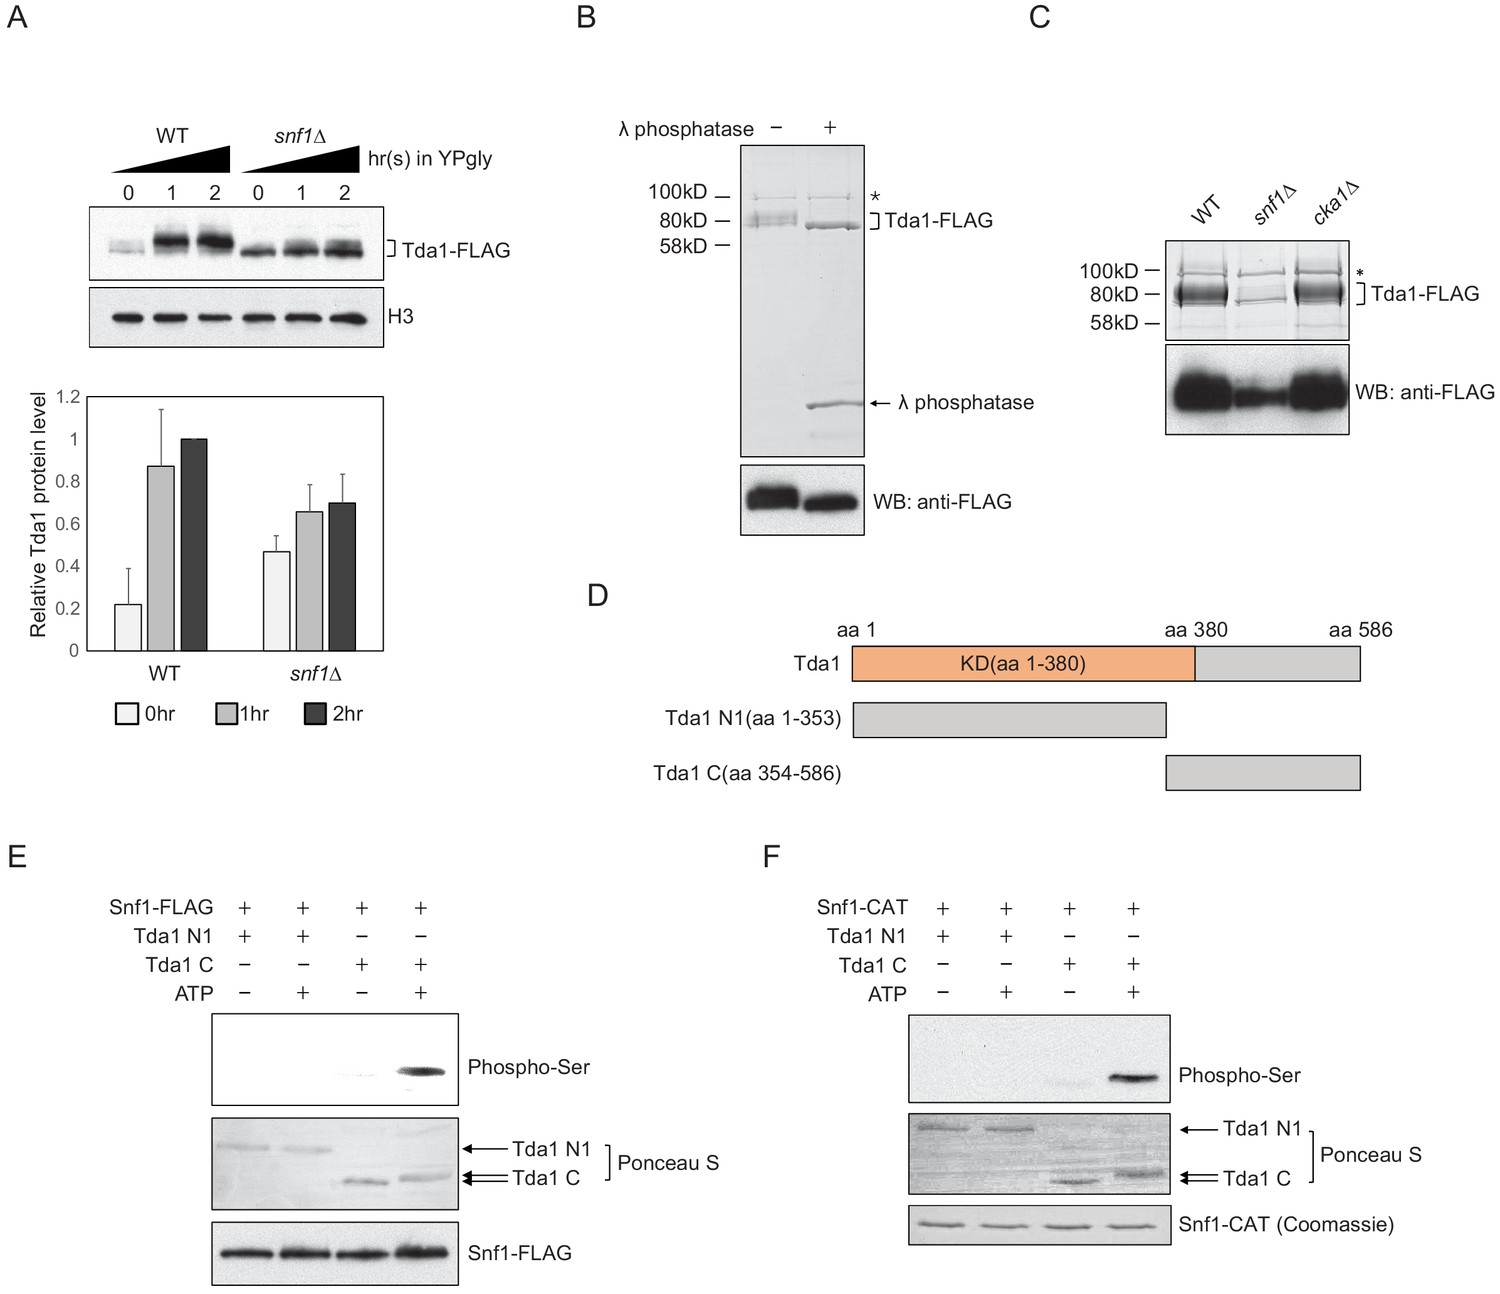
Snf1 phosphorylates Tda1 at C-terminus.
(A) (Upper panel) Tda1-3xFLAG protein level changes in WT and snf1Δ upon media shift from YPD to YPgly measured by western blot against FLAG tag. (Lower panel) Relative band intensities of Tda1 to H3 with error bars indicating STD of three biological replicates. (B) Coomassie staining (upper panel) or western blot (WB) against FLAG tag (lower panel) of yeast FLAG purified Tda1 with or without λ phosphatase treatment. (C) Coomassie staining (upper panel) or western blot against FLAG tag (lower panel) of yeast FLAG purified Tda1 in WT, snf1Δ, and cka1Δ background. (D) Schematic diagram of Tda1 N1 (Tda1 aa 1–353) and Tda1 C (Tda1 aa 354–586) used for in vitro kinase assays shown in (E) and (F). (E) In vitro kinase assay of yeast FLAG purified Snf1 from reg1Δ background using GST-Tda1 N1 or GST-Tda1 C as a substrate. The reaction mixtures were incubated for 2 hr at 30°C. (F) In vitro kinase assay of recombinant Snf1 catalytic domain (Snf1-CAT) which was activated by human CaMKK2 using GST-Tda1 N1 or GST-Tda1 C as a substrate. The reaction mixtures were incubated at 30°C for 2 hr.
Figure 5—figure supplement 1
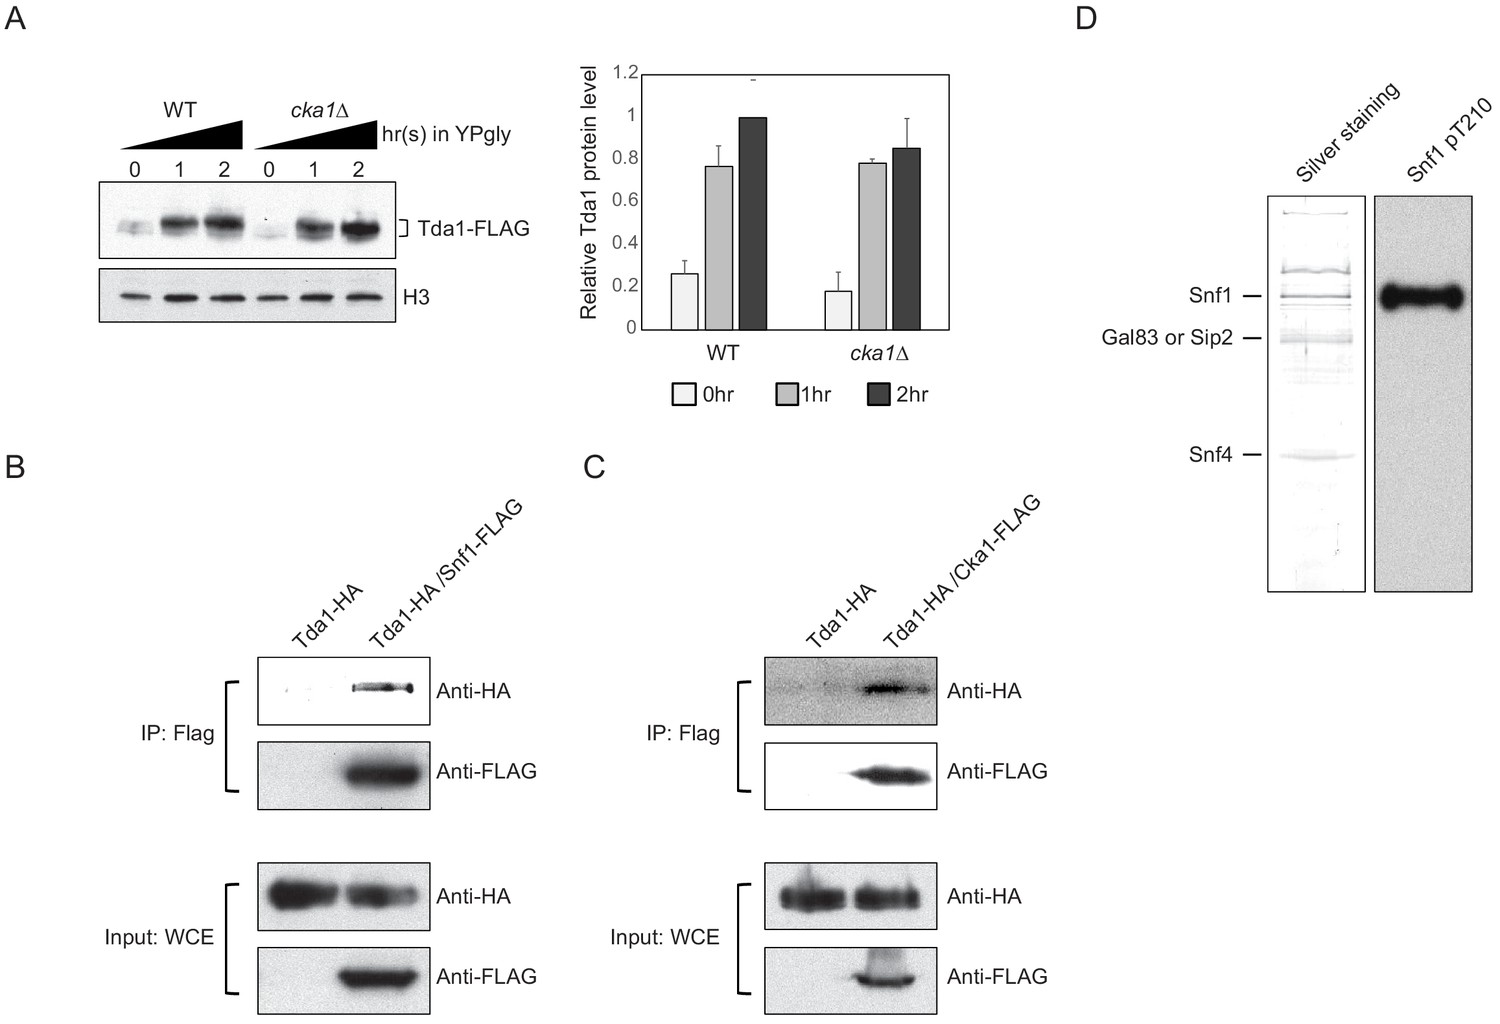
Snf1 phosphorylates Tda1 at C-terminus.
(A) (Left panel) Tda1-3xFLAG protein level changes in WT and cka1Δ upon media shift from YPD to YPgly measured by western blot against FLAG tag. (Right panel) The relative band intensities of Tda1 to H3 with error bars indicating STD from three biological replicates. (B and C) Tda1 co-immunoprecipitation assay using (B) FLAG-tagged Snf1 or (C) FLAG-tagged Cka1 as a bait in YPgly media. Immunoprecipitated Tda1 was detected by western blot against HA tag. Tda1-HA strain without any FLAG-tagged protein was used as a negative control. (D) The silver staining (left panel) or western blot against Snf1 pT210 (right panel) of yeast FLAG purified Snf1 from reg1Δ background.
Figure 6 with 2 supplements

Tda1 S483/T484 phosphorylation by Snf1 is required for the Tda1 activity in vivo.
(A) Schematic map of Tda1 phosphorylation sites (denoted as red circles) by recombinant Snf1-CAT and Cka1. (B) Global H3pT11 levels of Tda1 phosphorylation sites defective mutants taken from saturated cultures in YPD media. The Tda1 constructs were expressed in pRS416 shuttling vectors and their expression was governed by ADH1 promoter. ‘Vector only’ construct indicates the pRS416 with ADH1 promoter only. (C) H3pT11 levels upon media shift from YPD to YPgly in tda1Δ cells expressing Tda1 WT, Tda1 S483A/T484A, or Tda1 Δ396–417 constructs under an ADH1 promoter. (D) In vitro kinase assay of yeast FLAG purified Tda1 WT or Tda1 S483A/T484A protein using core histones as substrates. All reaction mixtures were incubated at 30°C for indicated times.
Figure 6—figure supplement 1
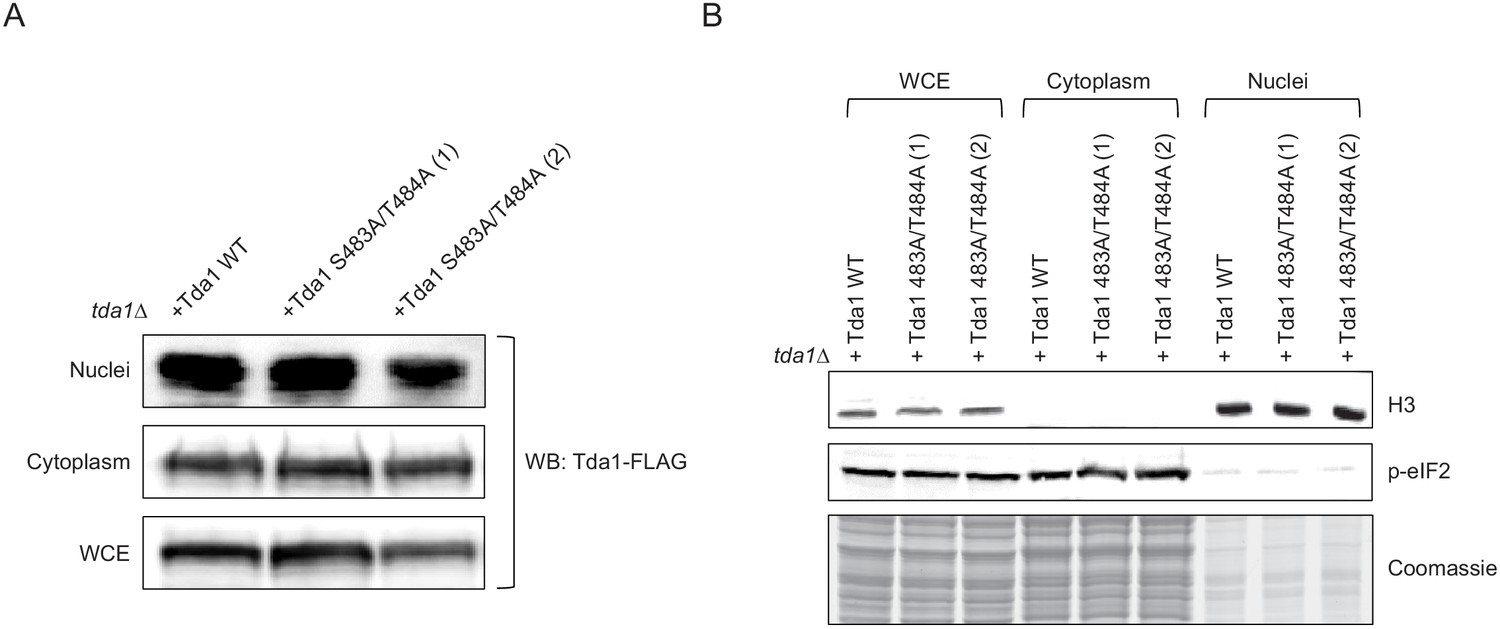
Tda1 S483/T484 phosphorylation by Snf1 is required for the nuclear Tda1 activity.
(A) Subcellular localization of Tda1 WT and Tda1 S483A/T484A proteins tagged with C-terminal 3xFLAG tag measured by western blot. The cells were taken from YPgly media cultures incubated for 2 hr after the media shift from YPD. (B) 0.5% of whole-cell extract (WCE), 0.5% of cytoplasm, and 1% of nuclei samples used in (A) were subjected to western blots to confirm efficient subcellular fractionation. Histone H3 and p-eIF2 antibodies were used as the nuclear and cytoplasmic markers, respectively.
Figure 6—figure supplement 2
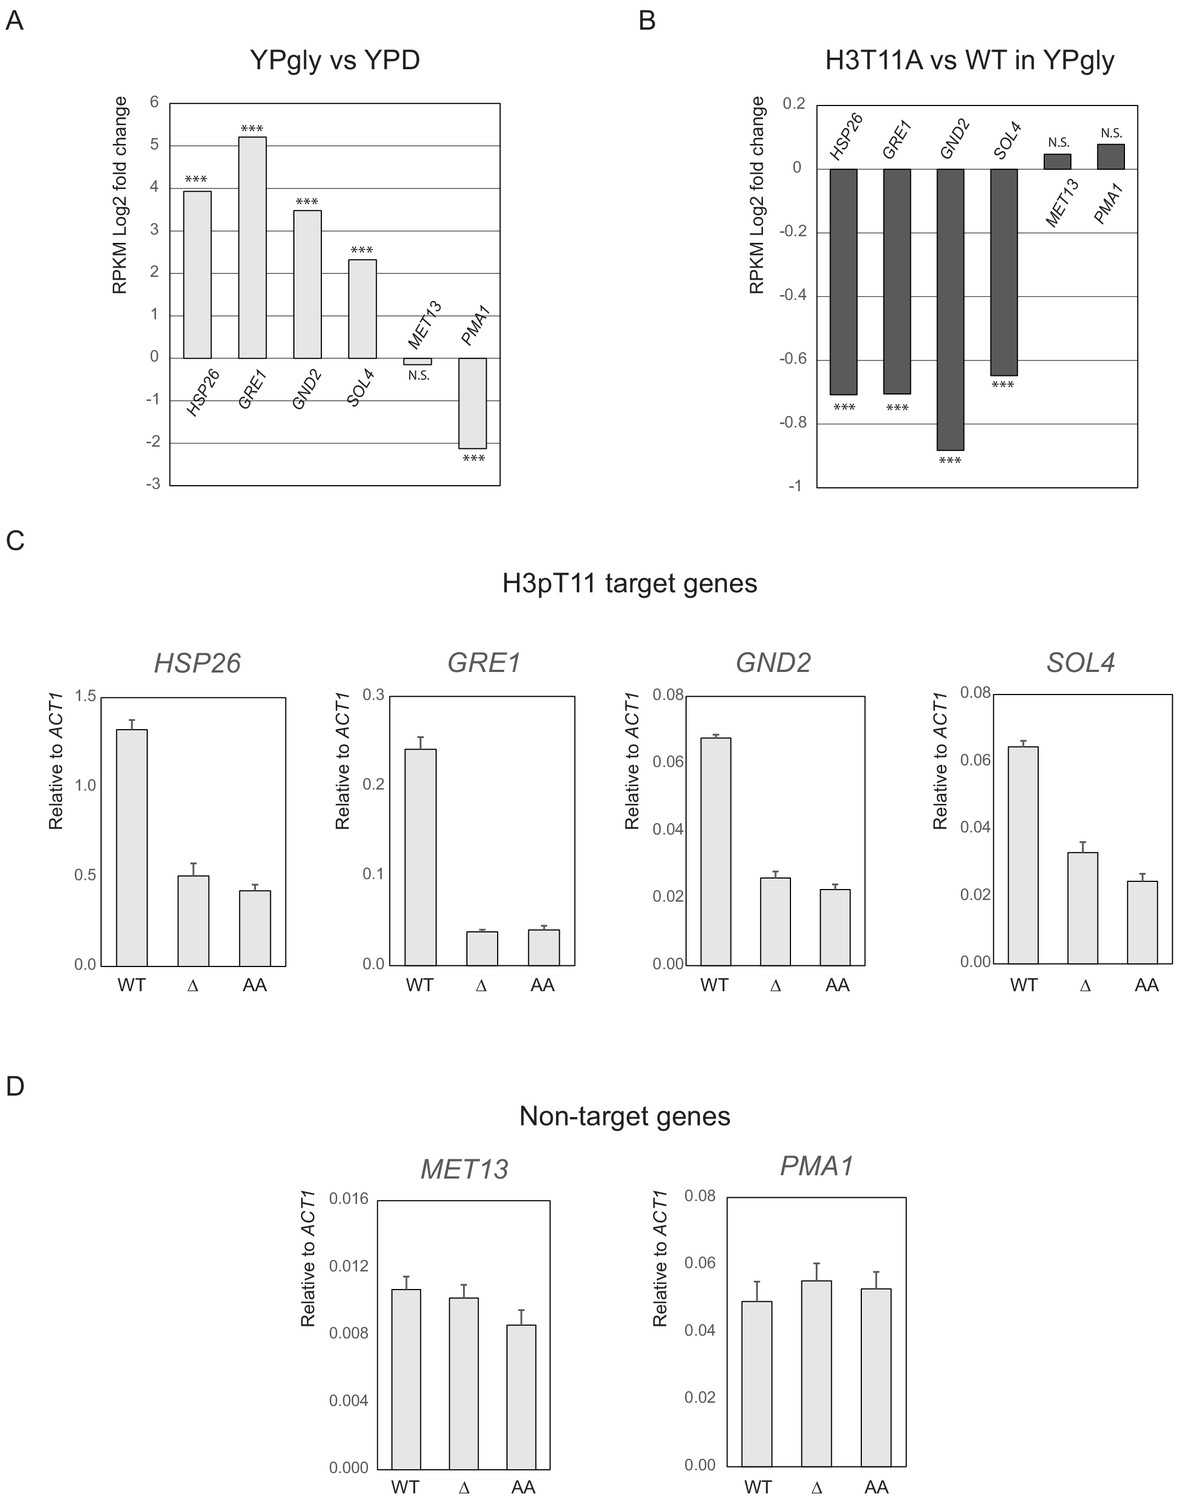
Tda1 S483/T484 phosphorylation is required for the transcription of H3pT11 target genes.
(A and B) Log2 fold changes of RPKM (reads per kilobase of transcript, per million mapped reads) values in WT upon media shift from YPD to YPgly media (A) or in H3T11A mutant compared to WT in YPgly media (B), at four H3pT11 target genes (HSP26, GRE1, GND2, and SOL4) and two non-target genes (MET13 and PMA1). ***p-value<0.001; N.S.: not significant. The RPKM values and p-values were acquired from dataset GEO accession number GSE111217 and are listed in Figure 6—figure supplement 2—source data 1. (C and D) The relative gene expression ratio compared to ACT1 genes at four H3pT11 target genes (C) and two non-target genes (D) in WT, tda1Δ (Δ), and Tda1 S483A/T484A (AA) mutant. Error bars indicate STD of three biological replicates. Cycle threshold (Ct) values of Q-RT-PCR results are listed in Figure 6—figure supplement 2—source data 1.
-
Figure 6—figure supplement 2—source data 1
Raw data used for Figure 6—figure supplement 2.
- https://cdn.elifesciences.org/articles/64588/elife-64588-fig6-figsupp2-data1-v2.xlsx
Figure 7 with 1 supplement
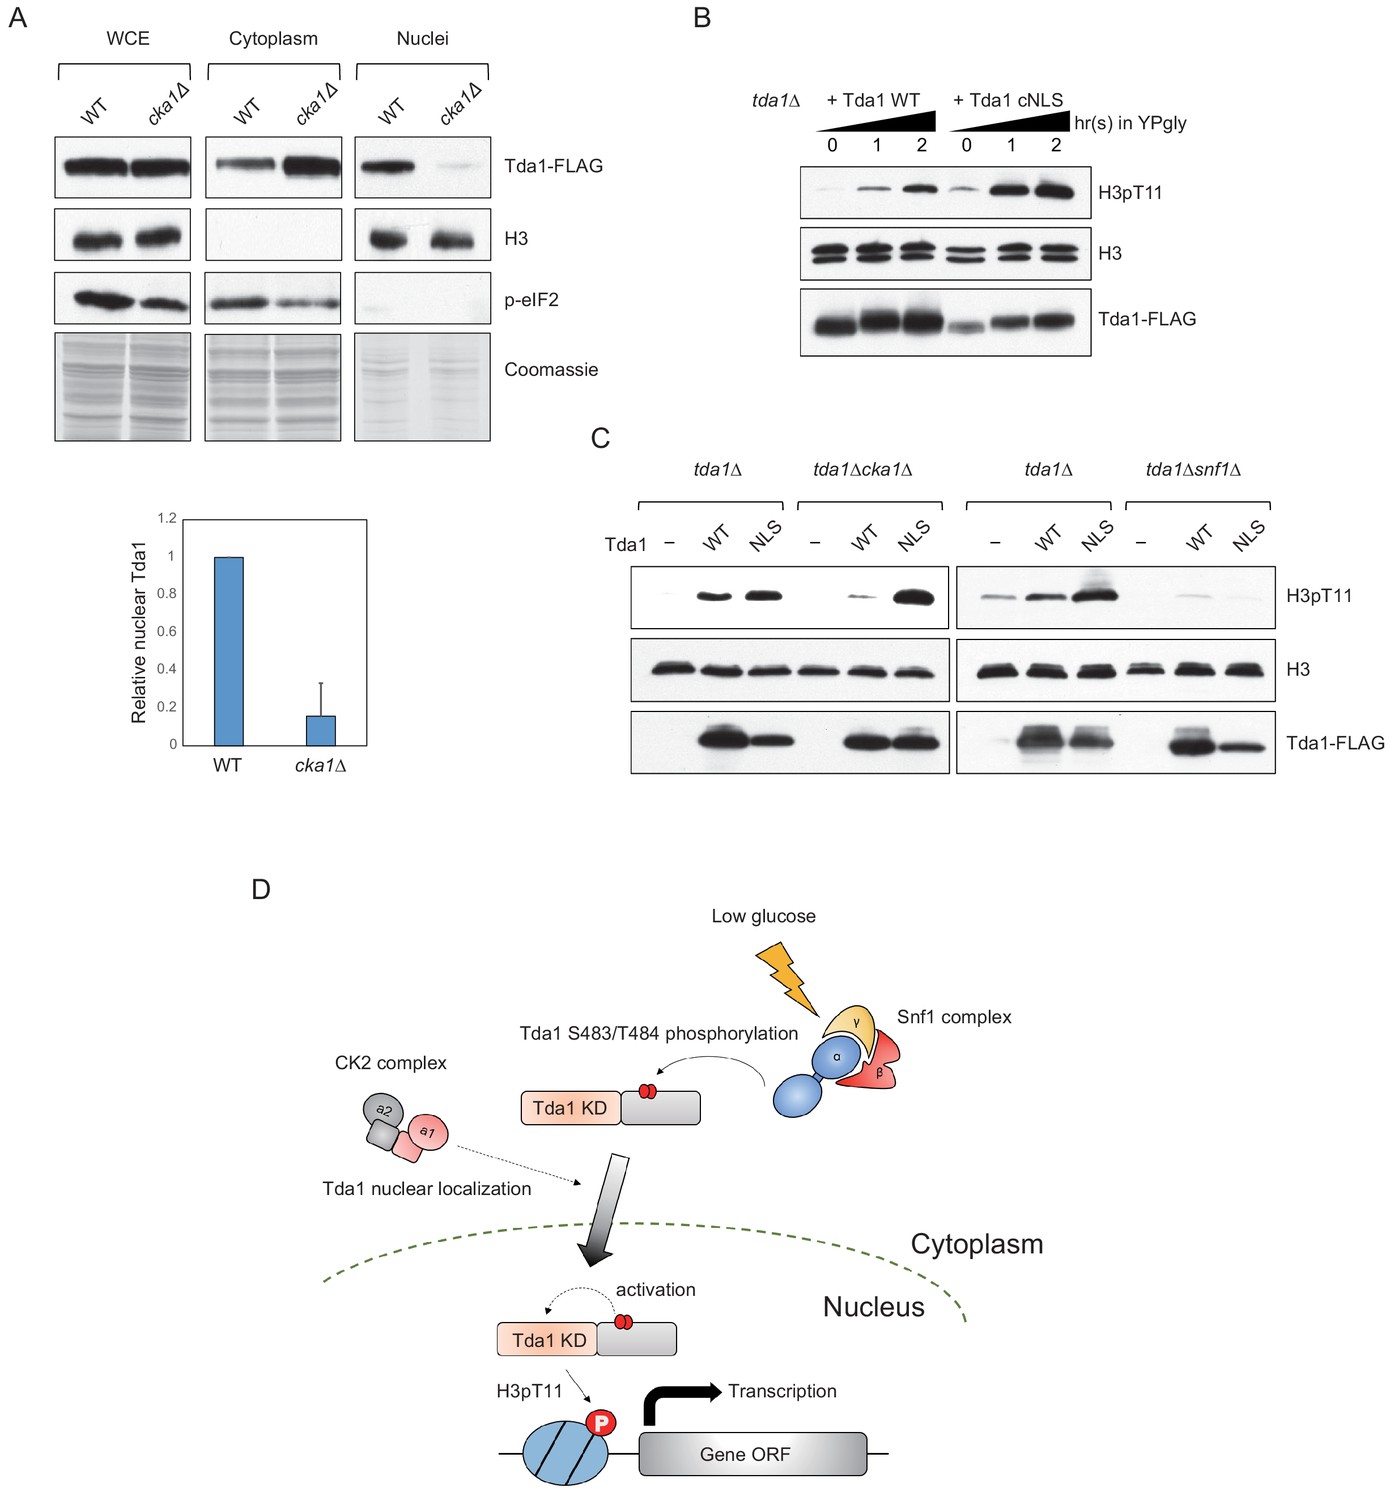
CK2 regulates Tda1 nuclear localization.
(A) (Upper panels) Subcellular localization of Tda1-3xFLAG proteins in WT and cka1Δ mutant. whole-cell extract (WCE), cytoplasm, and nuclei samples were taken from YPgly media cultures incubated for 2 hr after the media shift from YPD, then analyzed by western blot. Histone H3 and p-eIF2 antibodies were used for the nuclear and cytoplasmic marker, respectively. (Lower panel) The relative band intensities of nuclear Tda1 to WCE Tda1 are presented with error bars indicating STD of three biological replicates. (B) H3pT11-level changes in Tda1 WT and Tda1 with C-terminally tagged cMyc NLS upon media shift from YPD to YPgly analyzed by western blots. (C) H3pT11 restoration by genome integrated Tda1 WT or Tda1 with cMyc NLS in tda1Δ, tda1Δcka1Δ, and tda1Δsnf1Δ backgrounds measured by western blots. The cells were taken from YPgly media cultures incubated for 2 hr after the media shift from YPD. (D) Summary model of the Tda1 regulation by Snf1 and Cka1. The red ellipses represent phosphorylation.
Figure 7—figure supplement 1
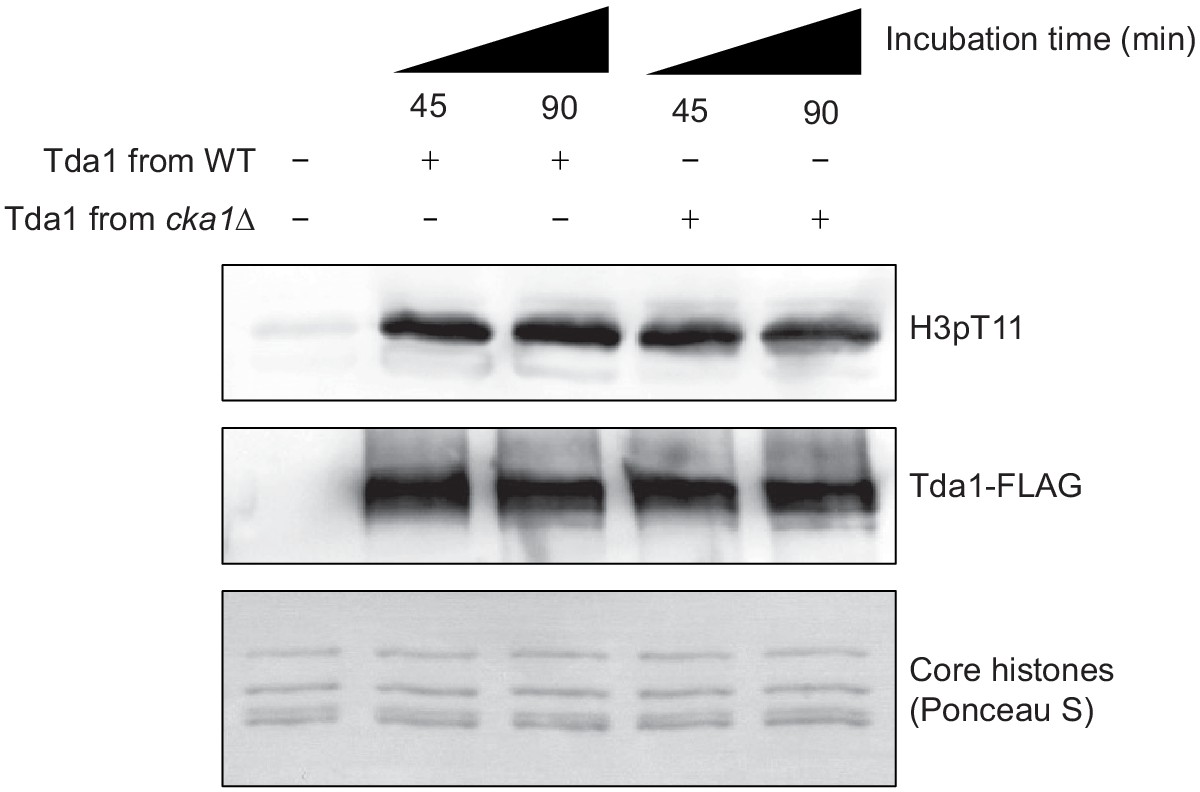
CK2 does not regulate Tda1 activity.
In vitro kinase assay of yeast FLAG-tagged Tda1 purified from WT or cka1Δ background. Core histones were used as substrates. The reaction mixtures were incubated at 30°C for indicated times.
Author response image 1
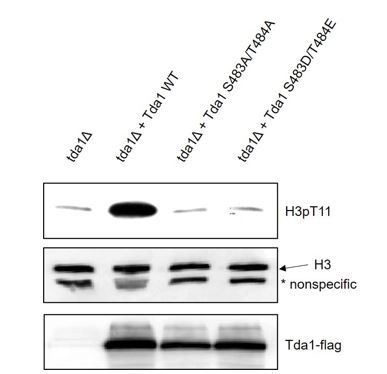
H3pT11 levels of Tda1 WT, Tda1 S483A/T484A, and Tda1 S483D/T484E mutant expressing strains analyzed by western blot.
Cells were taken from overnight saturated media.
Tables
Key resources table
| Reagent type (species) or resource | Designation | Source or reference | Identifiers | Additional information |
|---|---|---|---|---|
| Strain, strain background (Saccharomyces cerevisiae) | BY4741 | Open Biosystems | Cat# YSC1048 | All yeast strains derived from BY4741 are listed in Supplementary file 2 |
| Strain, strain background (Saccharomyces cerevisiae) | W303-1A | Euroscarf | Cat# BMA64-1A | All yeast strains derived from W303-1A are listed in Supplementary file 2 |
| Antibody | Anti-H3pT11 (Rabbit polyclonal) | Abcam | Cat# ab5168, RRID:AB_304759 | (1:100) |
| Antibody | Anti-H3 (Rabbit polyclonal) | Abcam | Cat# ab1791, RRID:AB_302613 | (1:1000) |
| Antibody | Anti-FLAG (Mouse monoclonal) | MilliporeSigma | Cat# F1804, RRID:AB_262044 | (1:10,000) |
| Antibody | Anti-HA (Rat monoclonal) | Roche | Cat# 12013819001, RRID:AB_390917 | (1:1000) |
| Antibody | Anti-Snf1 pT210 (Rabbit polyclonal) | Cell Signaling | Cat# 2531, RRID:AB_330330 | (1:100) |
| Antibody | Anti-H3pS10 (Rabbit polyclonal) | Abcam | Cat# ab5176, RRID:AB_304763 | (1:1000) |
| Antibody | Anti-GST (Rabbit polyclonal) | Santa Cruz Biotechnology | Cat# sc-459, RRID:AB_631586 | (1:500) |
| Antibody | Anti-phosphoserine (Rabbit polyclonal) | MilliporeSigma | Cat# AB1603, RRID:AB_390205 | (1:1000) |
| Antibody | Anti-phospho-eIF2alpha (Rabbit polyclonal) | Cell signaling | Cat# 9721, RRID:AB_330951 | (1:500) |
| Antibody | Anti-CBP (Rabbit polyclonal) | Venkatesh et al., 2012, PMID:22914091 | N/A | (1:2000) |
| Recombinant DNA reagent | pET29a-YS14 | Addgene | Cat# 66890 RRID:Addgene_66890 | |
| Recombinant DNA reagent | pFA6A-NatMX6 | Euroscarf | Cat# P30437 | |
| Recombinant DNA reagent | pFA6a–6XGLY–3XFLAG–HIS3M × 6 | Addgene | Cat# 20753 RRID:Addgene_20753 | |
| Recombinant DNA reagent | pFA6A-HIS3M × 6 | Addgene | Cat# 41596 RRID:Addgene_41596 | |
| Recombinant DNA reagent | pGEX4T-1 | MilliporeSigma | Cat# GE28-9549-49 | |
| Recombinant DNA reagent | pGEX4T2-Snf1-cat | Addgene | Cat# 52683 RRID:Addgene_52683 | |
| Recombinant DNA reagent | pRS416-ADH1 promoter | In this study, Figure 6B | N/A | |
| Recombinant DNA reagent | pRS416-ADH1 promoter-Tda1 WT 3xFLAG | In this study, Figure 6B | N/A | |
| Recombinant DNA reagent | pRS416-ADH1 promoter-Tda1 Δ396–417 3xFLAG | In this study, Figure 6B | N/A | |
| Recombinant DNA reagent | pRS416-ADH1 promoter-Tda1 S483A/T484A 3xFLAG | In this study, Figure 6B | N/A | |
| Recombinant DNA reagent | pRS416-ADH1 promoter-Tda1 S570A 3xFLAG | In this study, Figure 6B | N/A | |
| Recombinant DNA reagent | pRS416-ADH1 promoter-Tda1 S578A 3xFLAG | In this study, Figure 6B | N/A | |
| Recombinant DNA reagent | pRS406-ADH1 promoter-Tda1 WT 3xFLAG | In this study, Figure 6C | N/A | |
| Recombinant DNA reagent | pRS406-ADH1promoter-Tda1 Δ396–417 3xFLAG | In this study, Figure 6C | N/A | |
| Recombinant DNA reagent | pRS406-ADH1promoter-Tda1 S483A/T484A 3xFLAG | In this study, Figure 6C | N/A | |
| Recombinant DNA reagent | pRS406-ADH1promoter-Tda1 WT 3xFLAG cNLS | In this study, Figure 7C | N/A | |
| Peptide, recombinant protein | Casein Kinase II | New England Biolabs | Cat# P6010 | |
| Peptide, recombinant protein | CaMKK2 | Abnova | Cat# H00010645-P01 | |
| Peptide, recombinant protein | Lambda phosphatase | New England Biolabs | Cat# P0753 | |
| Peptide, recombinant protein | rLys-C, Mass Spec Grade | Promega | Cat# V1671 | |
| Peptide, recombinant protein | Sequencing Grade Modified Trypsin | Promega | Cat# V5111 | |
| Commercial assay or kit | DNA-free DNA Removal Kit | ThermoFisher | Cat# AM1906 | |
| Commercial assay or kit | ImProm II reverse transcription system | Promega | Cat# A3800 | |
| Chemical compound, drug | CX-4945 | Abcam | Cat# ab141350 | |
| Chemical compound, drug | Glycerol | Fisher Scientific | Cat# BP229 | |
| Chemical compound, drug | ATP | Thermo Scientific | Cat# R0441 | |
| Chemical compound, drug | GTP | Thermo Scientific | Cat# R0461 | |
| Software, algorithm | ProLuCID | Eng et al., 1994, PMID:24226387 | http://fields.scripps.edu/yates/wp/ | |
| Software, algorithm | DTAselect | Tabb et al., 2002, PMID:12643522 | http://fields.scripps.edu/yates/wp/ | |
| Software, algorithm | CONTRAST | Tabb et al., 2002, PMID:12643522 | http://fields.scripps.edu/yates/wp/ |
Additional files
-
Supplementary file 1
Tda1 C fragment phosphorylation by recombinant Snf1-CAT and Cka1.
The MudPIT analysis results showing the Tda1 C fragment (Tda1C, Tda1 aa 354–586) phosphorylation sites from in vitro kinase assays using Tda1C only, Tda1C with Snf1-CAT (Tda1C + rSnf1-CAT), and Tda1C with Cka1 (Tda1C + rCka1), respectively. Snf1-CAT was activated by pre-incubation with human CaMKK2 before the kinase assay with Tda1C. The Tda1 phosphorylation sites by Snf1-CAT are classified into three groups (I, II, and III) by the proximity of phosphorylation sites. (Total: total peptides detected, Modified: the number of phosphorylation containing peptides, PTM%: the percentage of modified peptide compared to total peptide detected.)
- https://cdn.elifesciences.org/articles/64588/elife-64588-supp1-v2.xlsx
-
Supplementary file 2
Yeast strains used in this study.
- https://cdn.elifesciences.org/articles/64588/elife-64588-supp2-v2.xlsx
-
Transparent reporting form
- https://cdn.elifesciences.org/articles/64588/elife-64588-transrepform-v2.pdf
Download links
A two-part list of links to download the article, or parts of the article, in various formats.
Downloads (link to download the article as PDF)
Open citations (links to open the citations from this article in various online reference manager services)
Cite this article (links to download the citations from this article in formats compatible with various reference manager tools)
Yeast Nuak1 phosphorylates histone H3 threonine 11 in low glucose stress by the cooperation of AMPK and CK2 signaling
eLife 9:e64588.
https://doi.org/10.7554/eLife.64588


