Combinations of maternal-specific repressive epigenetic marks in the endosperm control seed dormancy
- Department of Plant Biology, Uppsala BioCenter, Swedish University of Agricultural Sciences and Linnean Centre for Plant Biology, Sweden
- Max Planck Institute of Molecular Plant Physiology, Germany
Figures
Figure 1 with 2 supplements
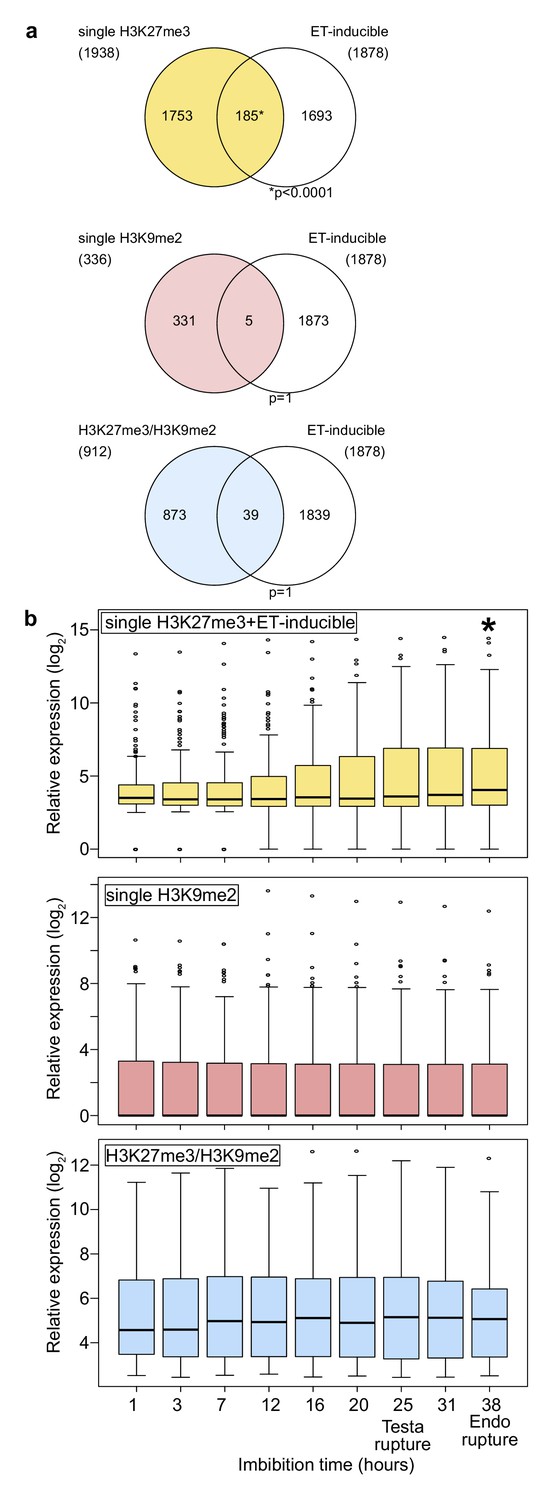
Genes marked by H3K27me3 become activated in the endosperm during germination.
(a) Venn diagrams show overlaps between three groups of genes with different patterns of histone modifications and ethylene (ET)-inducible genes in seedlings. ET-inducible genes identified in a previous study (Das et al., 2016) were compared with genes marked by the indicated histone modifications in the developing endosperm (Moreno-Romero et al., 2016). Asterisks indicate significant overlap (p<0.0001, Fisher’s exact test). (b) Box plots show relative expression profiles of genes marked by the indicated histone modifications in the endosperm during germination. Time-course expression profiles of ethylene inducible genes with single H3K27me3 (top; 185 genes), single H3K9me2 (middle; 336 genes), and H3K27me3, H3K9me2 and CHG methylation (bottom; 227 genes). Expression data are endosperm-specific transcriptome data during germination (Dekkers et al., 2013). The time points of testa rupture and endosperm (Endo) rupture are shown. Asterisks indicate significant differences compared to the time point at 1 hr of imbibition (p<0.01, Wilcoxon test).
Figure 1—figure supplement 1
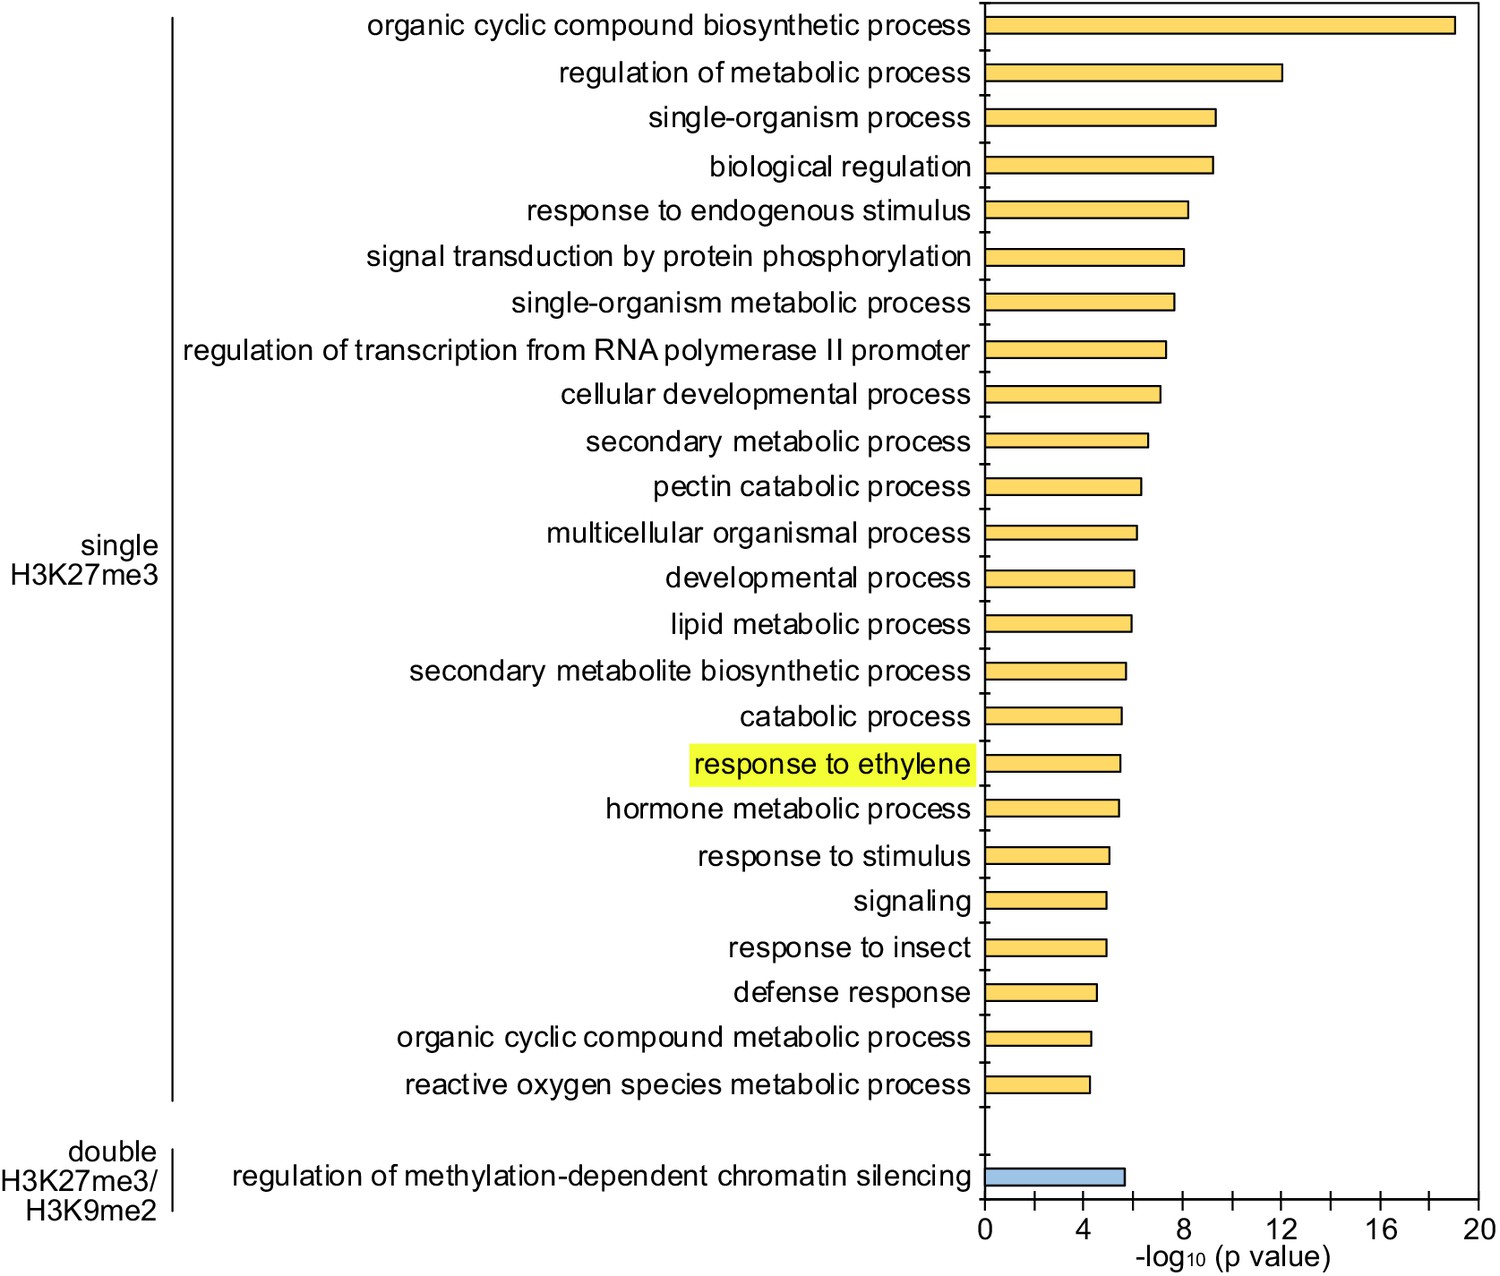
Enrichment of GOs among genes with single H3K27me3 and double H3K27me3/H3K9me2 on the maternal genome in the endosperm.
Maternal-specific epigenetic marks in the developing endosperm were derived from published data (Moreno-Romero et al., 2016). There was no enriched GO for genes marked by single H3K9me2. GOs related to ethylene signaling are highlighted.
Figure 1—figure supplement 2
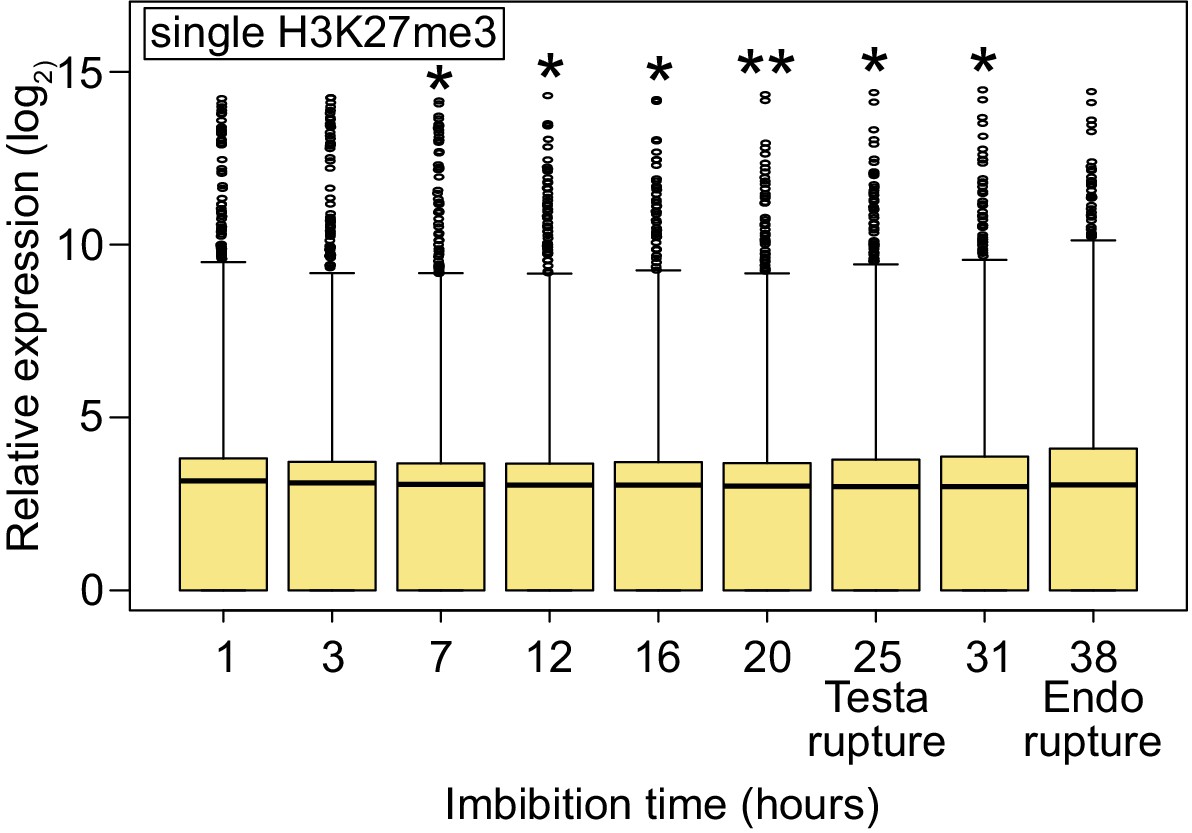
Expression profiles of all genes with single H3K27me3 during germination.
Box plots show the expression of all genes with single H3K27me3 in the endosperm during germination (based on published data [Dekkers et al., 2013]). The time points of testa rupture and endosperm (Endo) rupture are shown. Asterisks indicate significant differences compared to 1 hour of imbibition (*p<0.05; **p<0.01, Wilcoxon test).
Figure 2 with 1 supplement
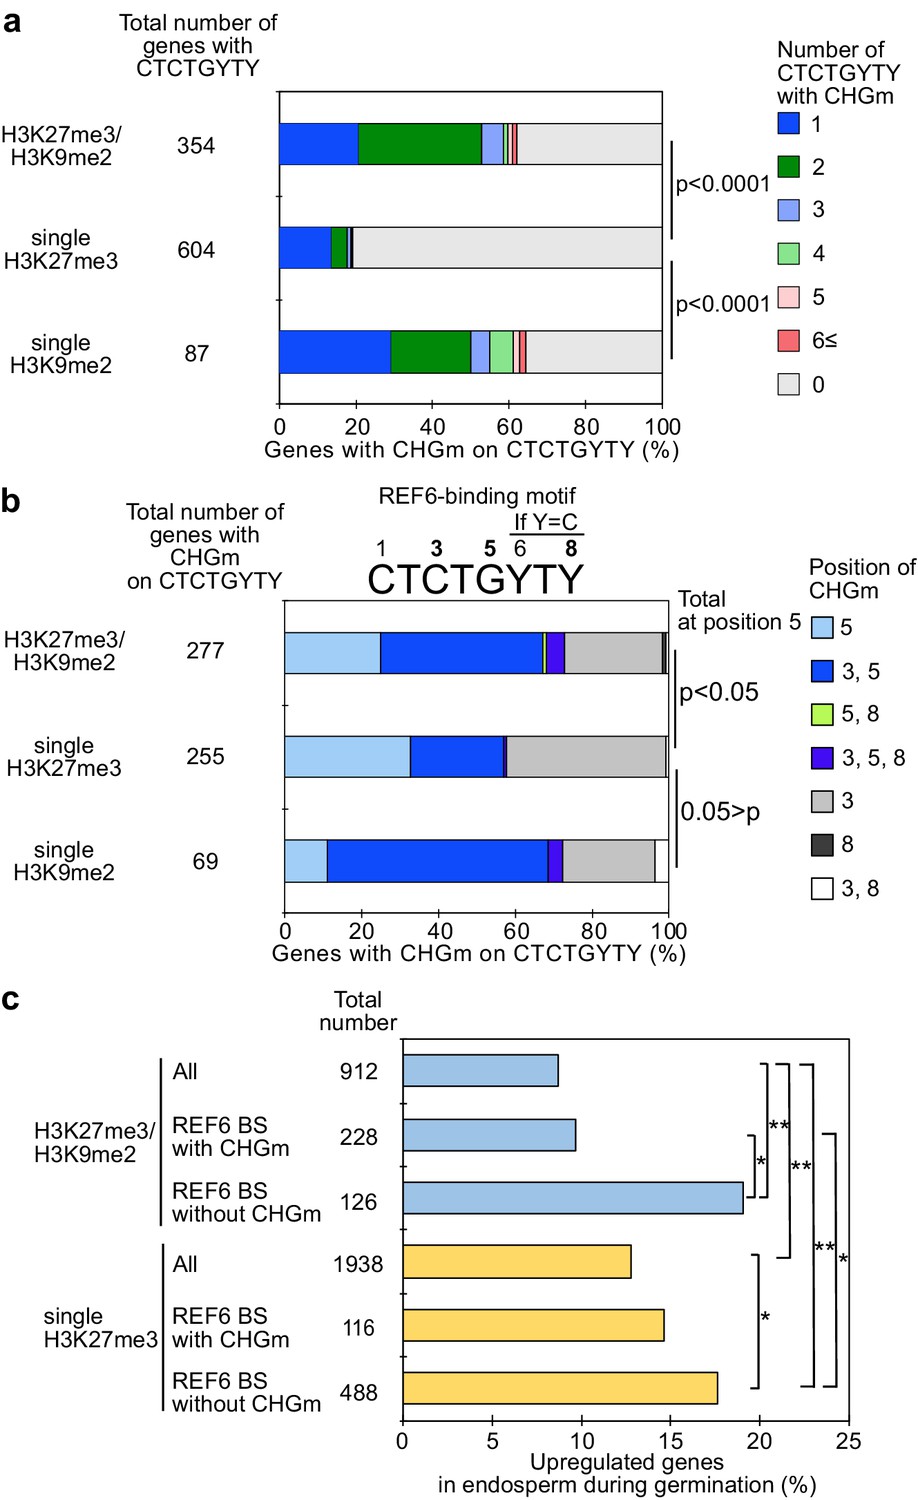
Gene activation during germination depends on CHG methylation (CHGm) on REF6 binding sites (REF6-BS).
(a) Plot shows the percentage of REF6-BS with CHGm in the three groups of genes with different combinations of histone modifications. CHGm on REF6-BS in gene bodies was determined based on published DNA methylome data (Park et al., 2016). p values were calculated using pairwise Fisher’s exact test and Benjamini–Hochberg correction. (b) Plot shows the percentage of CHGm on different cytosine positions of REF6-BS in the three groups of genes with different combinations of histone modifications. CHGm on REF6-BS in gene bodies was determined based on published DNA methylome data (Park et al., 2016). Numbers above the REF6-BS indicate possible positions of DNA methylation, of which positions 3, 5, and 8 can be targeted by CHGm. p values were calculated using pairwise Fisher’s exact test and Benjamini–Hochberg correction and indicate significance for CHGm on position five in REF6-BS. (c) Plot shows the percentage of upregulated genes with double H3K27m3/H3K9me2 and single H3K27me3 in the endosperm during germination depending on CHGm on REF6-BS. Gene expression is based on previously published endosperm-specific transcriptome data during germination (Dekkers et al., 2013). Compared were expression levels between 1 and 38 hours of imbibition (1≦Log2FC, p<0.05). Asterisks indicate significant differences between two categories (*p<0.05; **p<0.01; pairwise Fisher’s exact test with Benjamini–Hochberg correction).
Figure 2—figure supplement 1
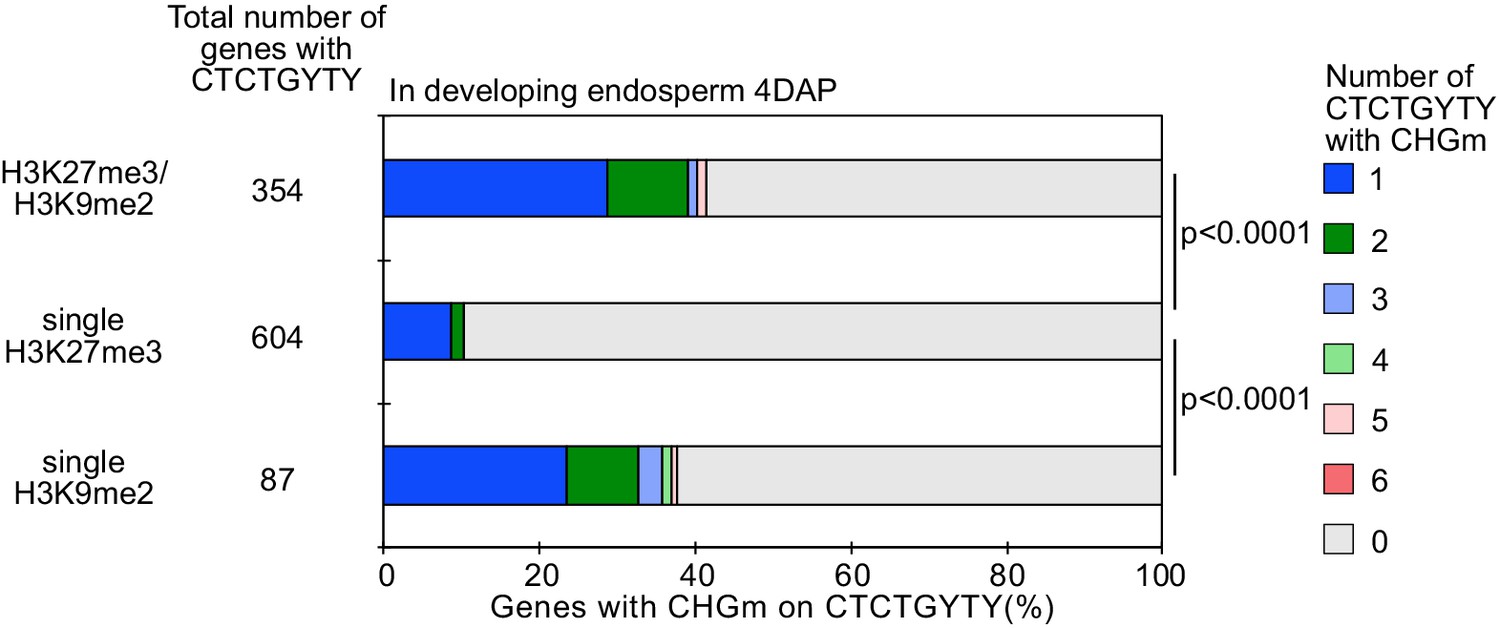
Percentage of REF6-binding sites (REF6-BS) with CHG methylation (CHGm) (based on published data [Moreno-Romero et al., 2016]) among three groups of genes with different combinations of histone modifications (based on published data [Moreno-Romero et al., 2016]) in developing endosperm.
p values were calculated using pairwise Fisher’s exact test with Benjamini–Hochberg correction.
Figure 3 with 3 supplements
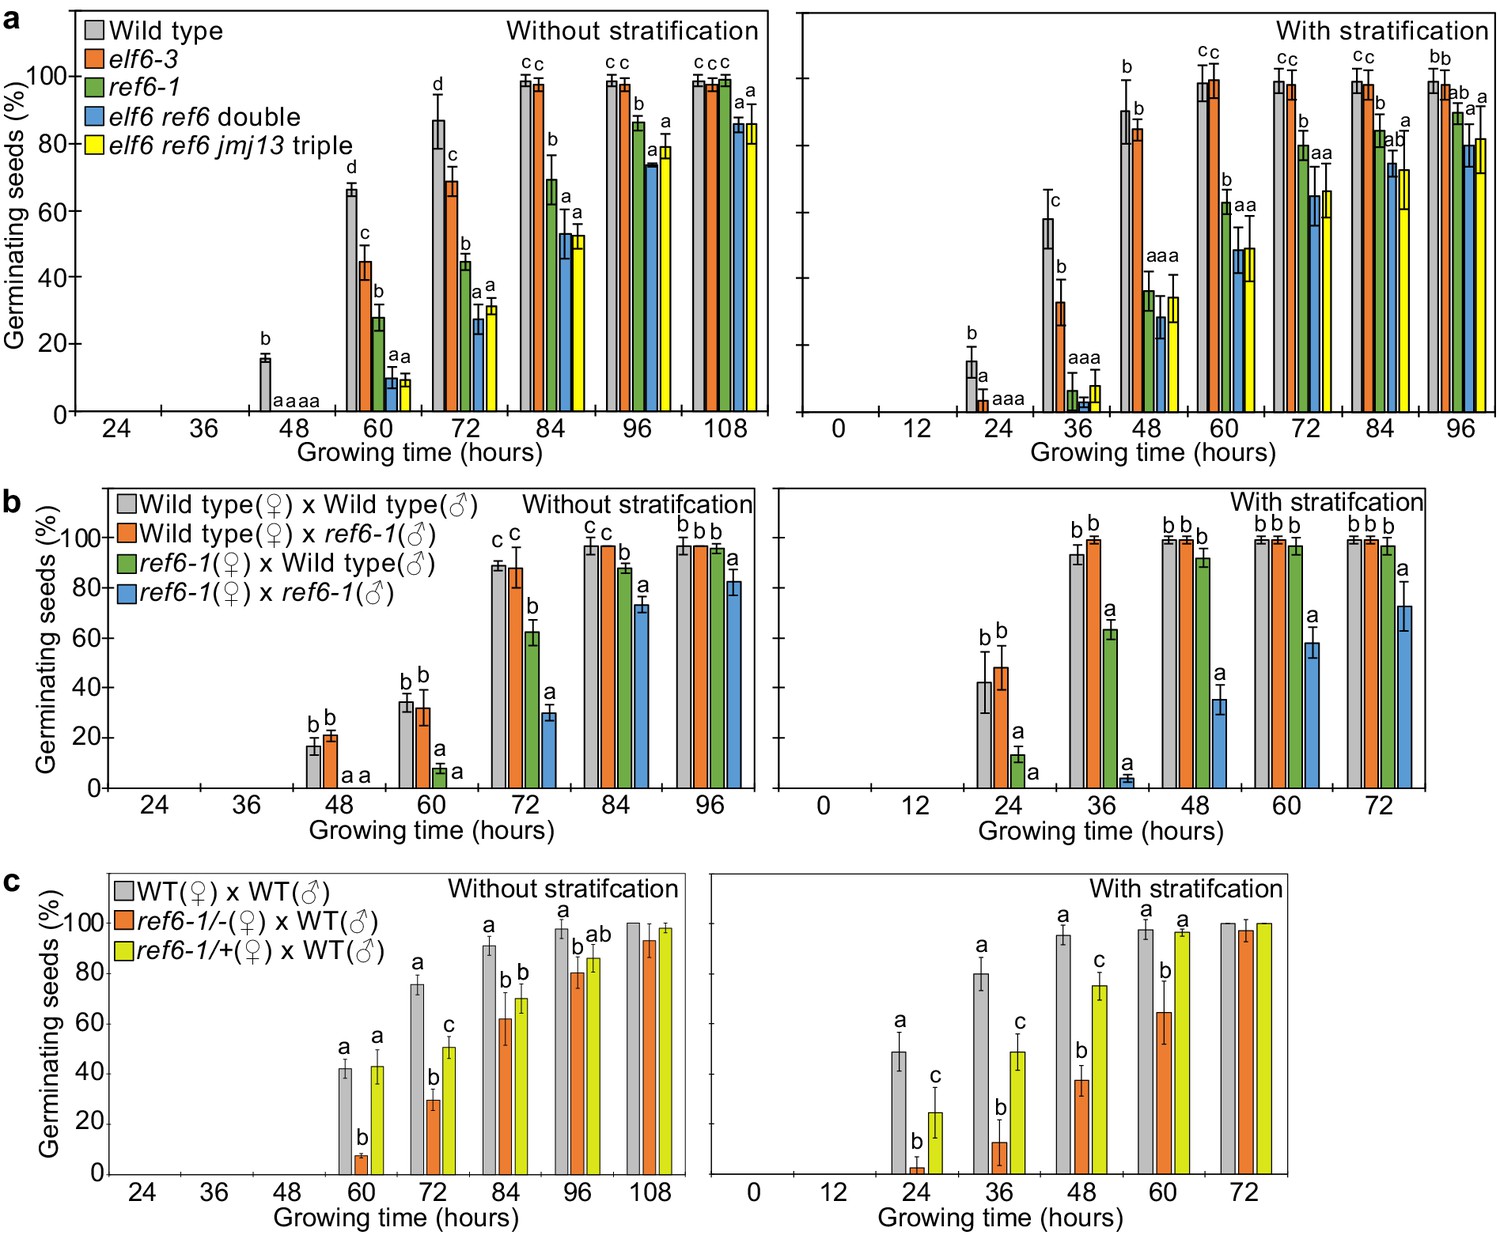
REF6 is the major H3K27me3 demethylase controlling seed dormancy.
(a) Plots show the percentage of germinating seeds of wild type, elf6-3 single, ref6-1 single, elf6-3 ref6C double, and elf6-3 ref6C jmj13G triple mutants with and without stratification. Error bars indicate SD from three biological replicates (n = 120 total). Letters above bars indicate significant differences among genotypes (p<0.05, Tukey’s multiple range test). (b) Germination phenotypes of seeds generated by reciprocal crosses between wild type and ref6-1. Plots show the percentage of germinating seeds with and without stratification. Error bars indicate SD from three biological replicates (n = 120 total). Letters above bars indicate significant differences among genotypes (p<0.05, Tukey’s multiple range test). (c) Plots show the percentage of germinating seeds with and without stratification of wild type (WT), F1 seeds generated by crossing maternal heterozygous or homozygous ref6-1 and paternal wild type. Error bars indicate SD from three biological replicates (n = 90 total). Letters above bars indicate significant differences among genotypes (p<0.05, Tukey’s multiple range test).
Figure 3—figure supplement 1
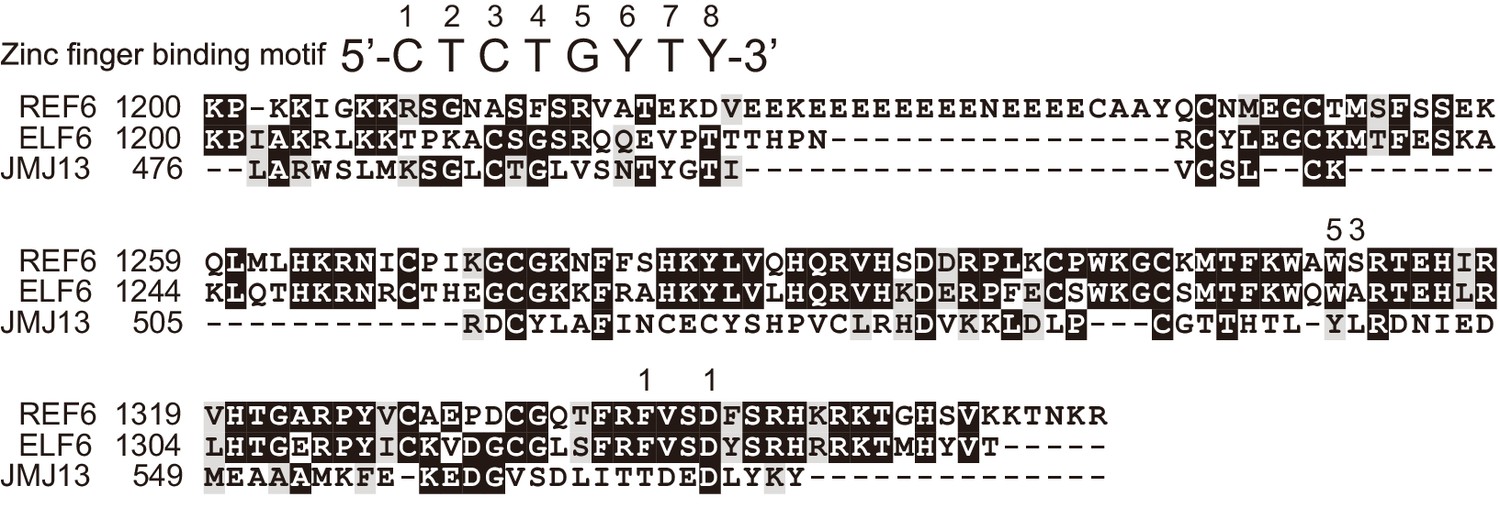
Alignment of the predicted DNA-binding motifs of REF6, ELF6, and JMJ13.
The REF6-binding site is shown above the alignment. Amino acids that are required to recognize the corresponding positions of nucleotides in the REF6-binding site are indicated by numbers. Data are based on a previous report (Qiu et al., 2019). Numbers on the left of the alignment correspond to the amino acid sequence numbers of the respective proteins.
Figure 3—figure supplement 2
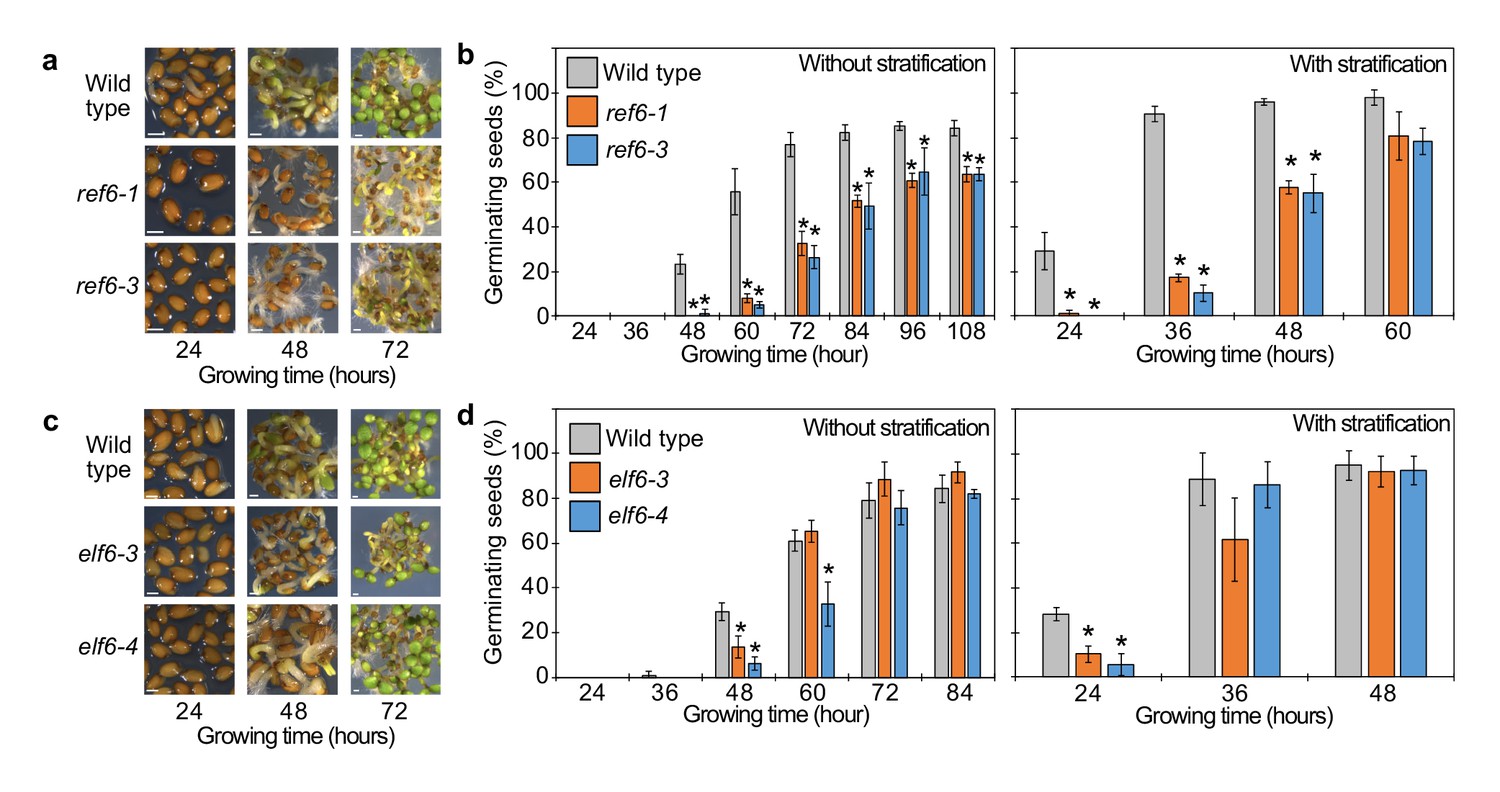
Germination phenotypes of ref6, elf6 single mutants.
(a) Germination phenotypes of ref6-1 and ref6-3 mutants at 24, 36, and 48 hr after stratification. Scale bars indicate 100 μm. (b) Plots show the percentage of germinating seeds of wild type, ref6-1, and ref6-3 with and without stratification. Error bars indicate SD from three biological replicates (n = 120 total). Asterisks indicate significant differences compared to wild type (p<0.05, Bonferroni-corrected Student’s t test). (c) Germination phenotypes of elf6-3 and elf6-4 mutants at 24, 36, and 48 hr after stratification. Scale bars indicate 100 μm. (d) Plots show the percentage of germinating seeds of wild type, elf6-3, and elf6-4 after stratification. Asterisks indicate significant differences compare to wild type (p<0.05, Bonferroni-corrected Student’s t test).
Figure 3—figure supplement 3
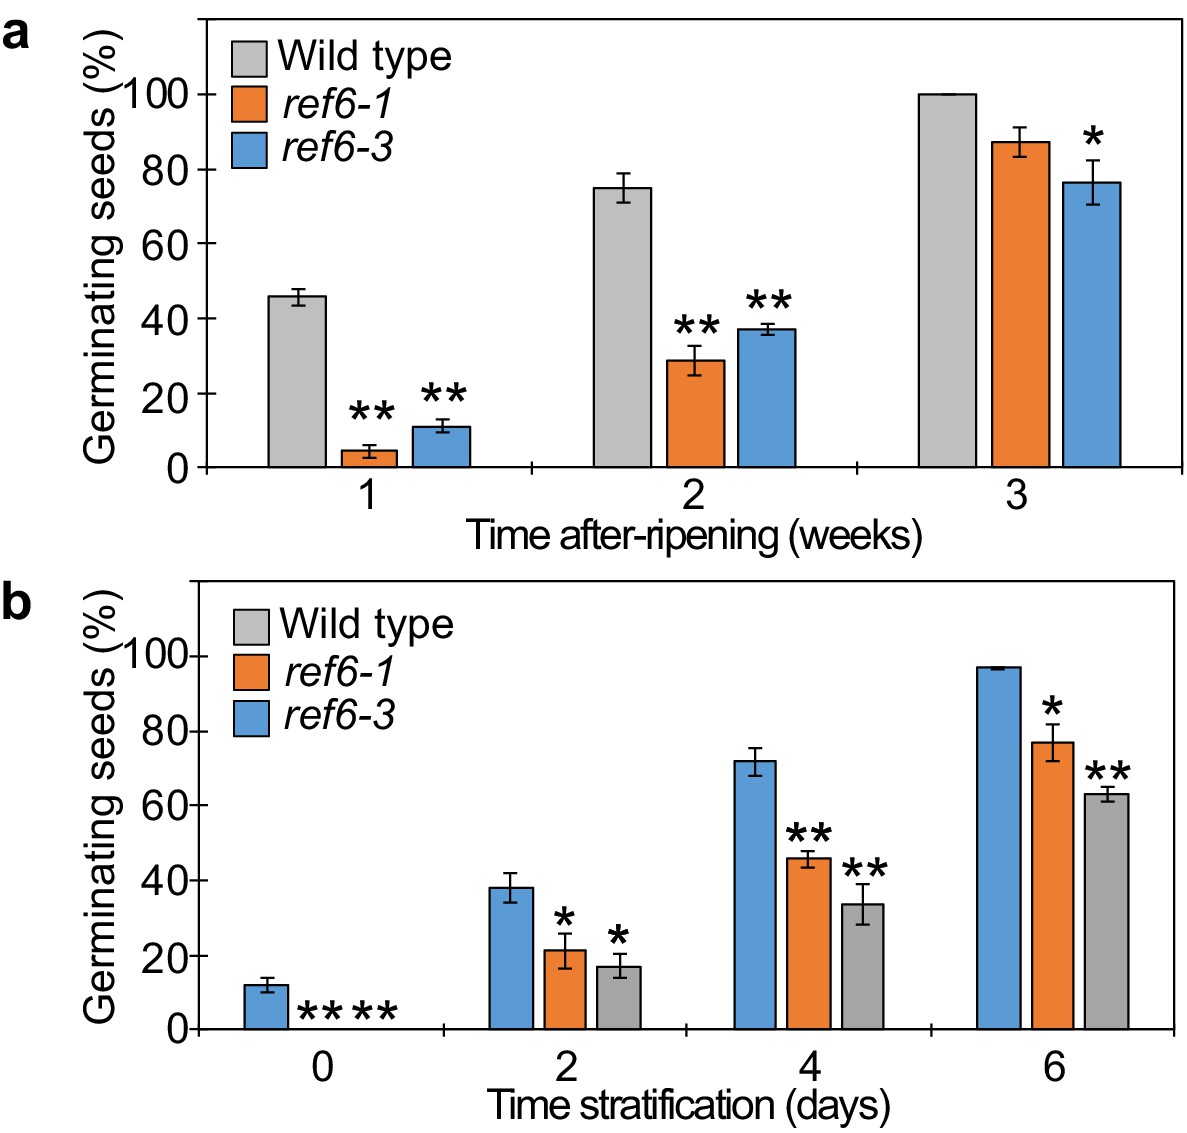
Seed dormant phenotypes of ref6 mutants.
(a) Plot shows the percentage of germinating seeds after 96 hours of incubation under normal conditions without stratification after different periods of after-ripening. Error bars indicate SD from three biological replicates (n = 120 total). Asterisks indicate significant differences compared to wild type (p<0.05, Bonferroni-corrected Student’s t test). (b) Plots show the percentage of germinating seeds that developed under low temperature (10°C) and were grown after 7 days of incubation under normal conditions after different periods of stratification. Error bars indicate SD from three biological replicates (n = 120 total). Asterisks indicate significant differences compared to wild type (p<0.05, Bonferroni-corrected Student’s t test).
Figure 4 with 1 supplement
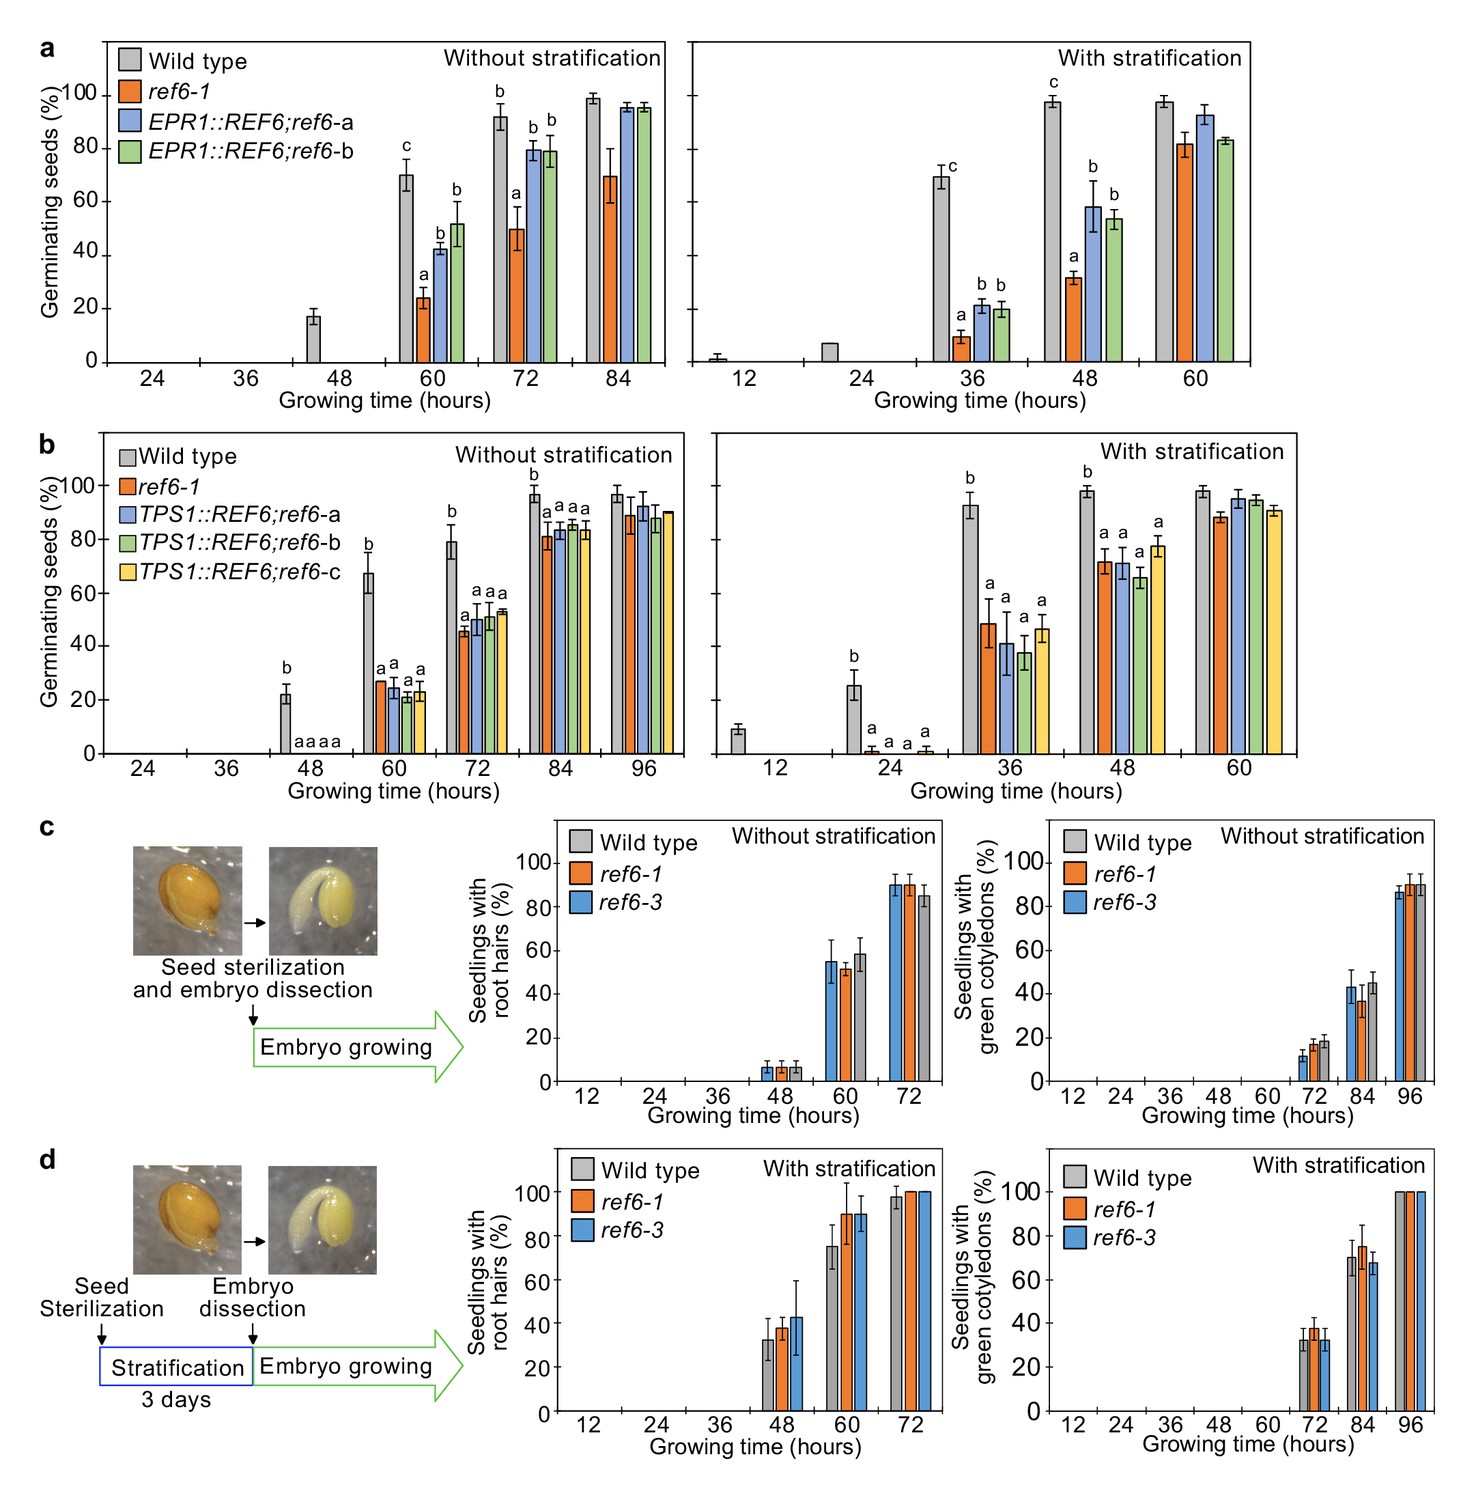
REF6 expression in the endosperm promotes germination.
(a) Germination phenotypes of the ref6-1 mutant and transgenic lines in the ref6-1 background expressing REF6 under control of the micropylar endosperm-specific EPR1 promoter. Plots show the percentage of germinating seeds of wild-type, ref6-1, and complemented lines (EPR1::REF6;ref6-1-a and b) with and without stratification. Error bars indicate SD from three biological replicates (n = 120 total). The letters above the bars indicate significant differences among plant lines (p<0.05, Tukey’s multiple range test). (b) Germination phenotypes of the ref6-1 mutant and transgenic lines in the ref6-1 background expressing REF6 under control of the embryo-specific TPS1 promoter during germination. Plots show the percentage of germinating seeds of wild-type, ref6-1, and complemented lines (TPS1::REF6;ref6-1 a, b, and c) with and without stratification. Details are shown in the legend of (a). (c) and (d) Germination phenotypes of ref6-1 mutant embryos dissected from seeds without (c) and with (d) stratification. Embryos of wild-type, ref6-1, and ref6-3 plants were manually dissected from seeds. Plots show the percentage of seedlings with root hairs and green cotyledons. Error bars indicate SD from three biological replicates (n = 90 total). The data at each time point were evaluated using one-way ANOVA, no significant differences were detected (p>0.05).
Figure 4—figure supplement 1
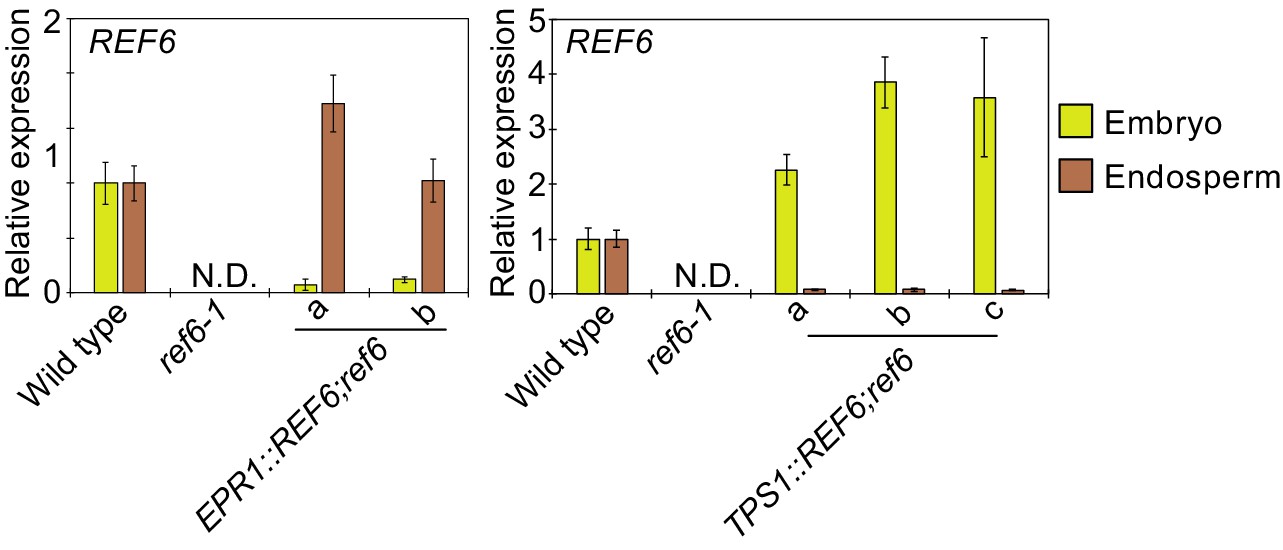
Plots show the expression of REF6 in the endosperm of EPR1::REF6;ref6-1 and TPS1::REF6;ref6-1 during germination as determined by RT-qPCR.
Embryos of wild-type and the transgene containing plants were dissected after 72 hr of stratification and 24 hr of incubation under normal conditions. Error bars indicate SD from technical triplicates. Relative expression to wild-type plants were shown.
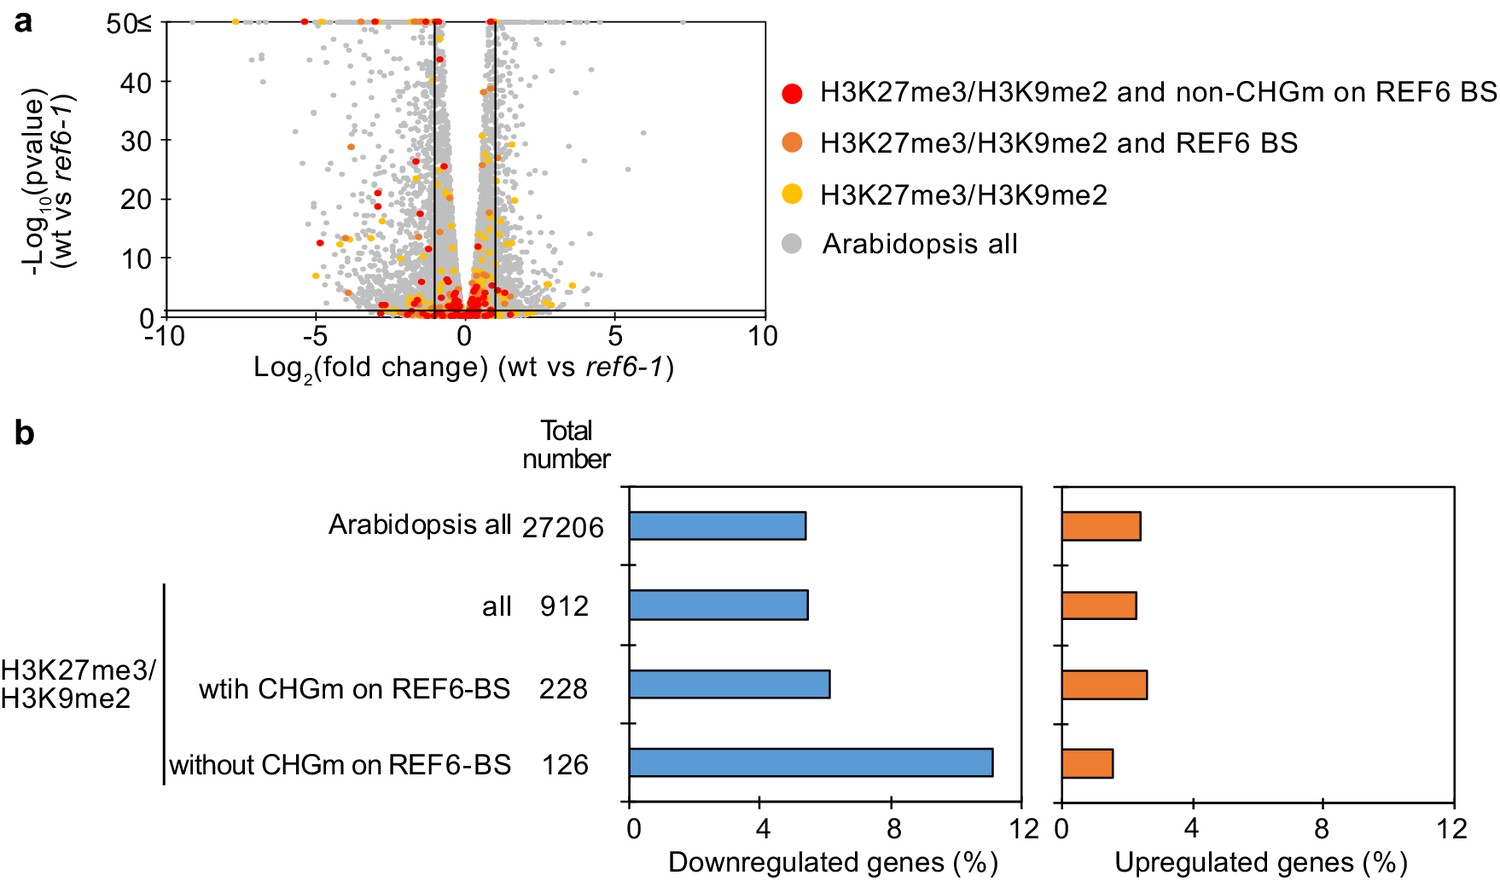
Figure 5 with 4 supplements
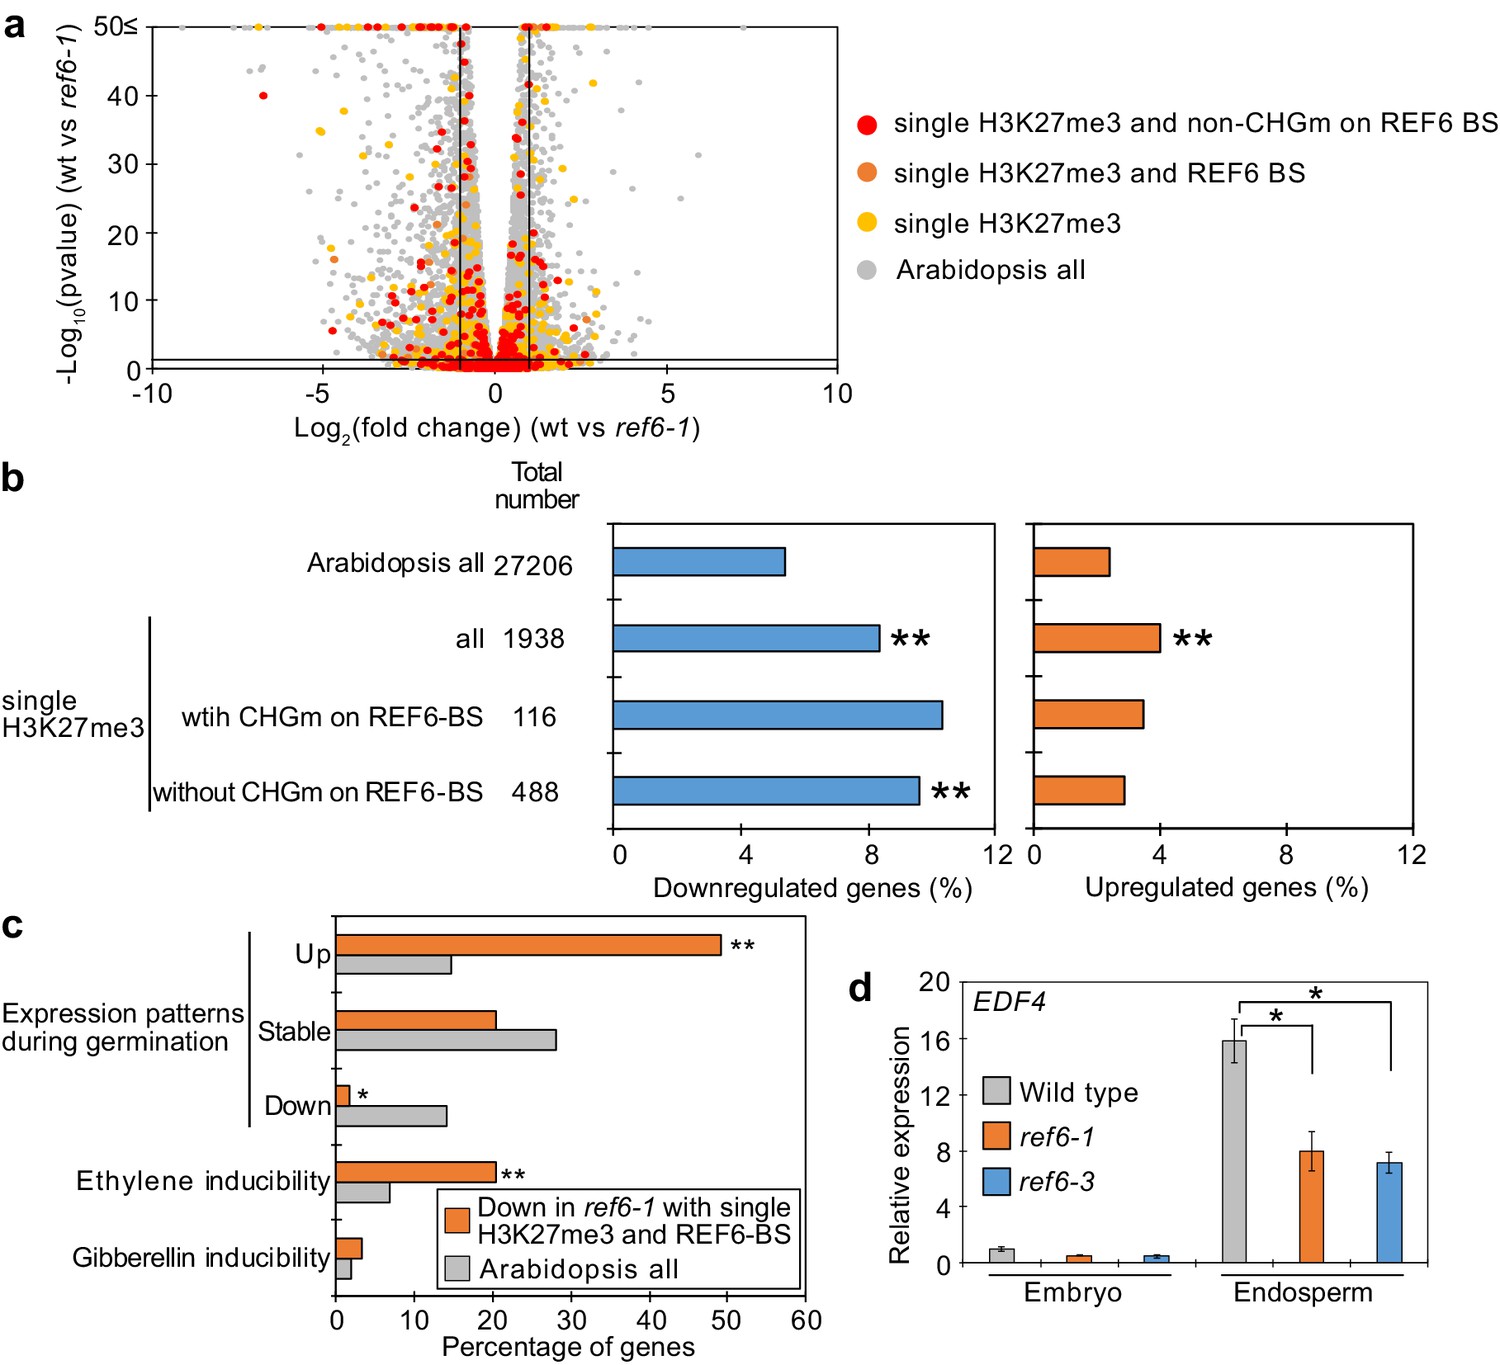
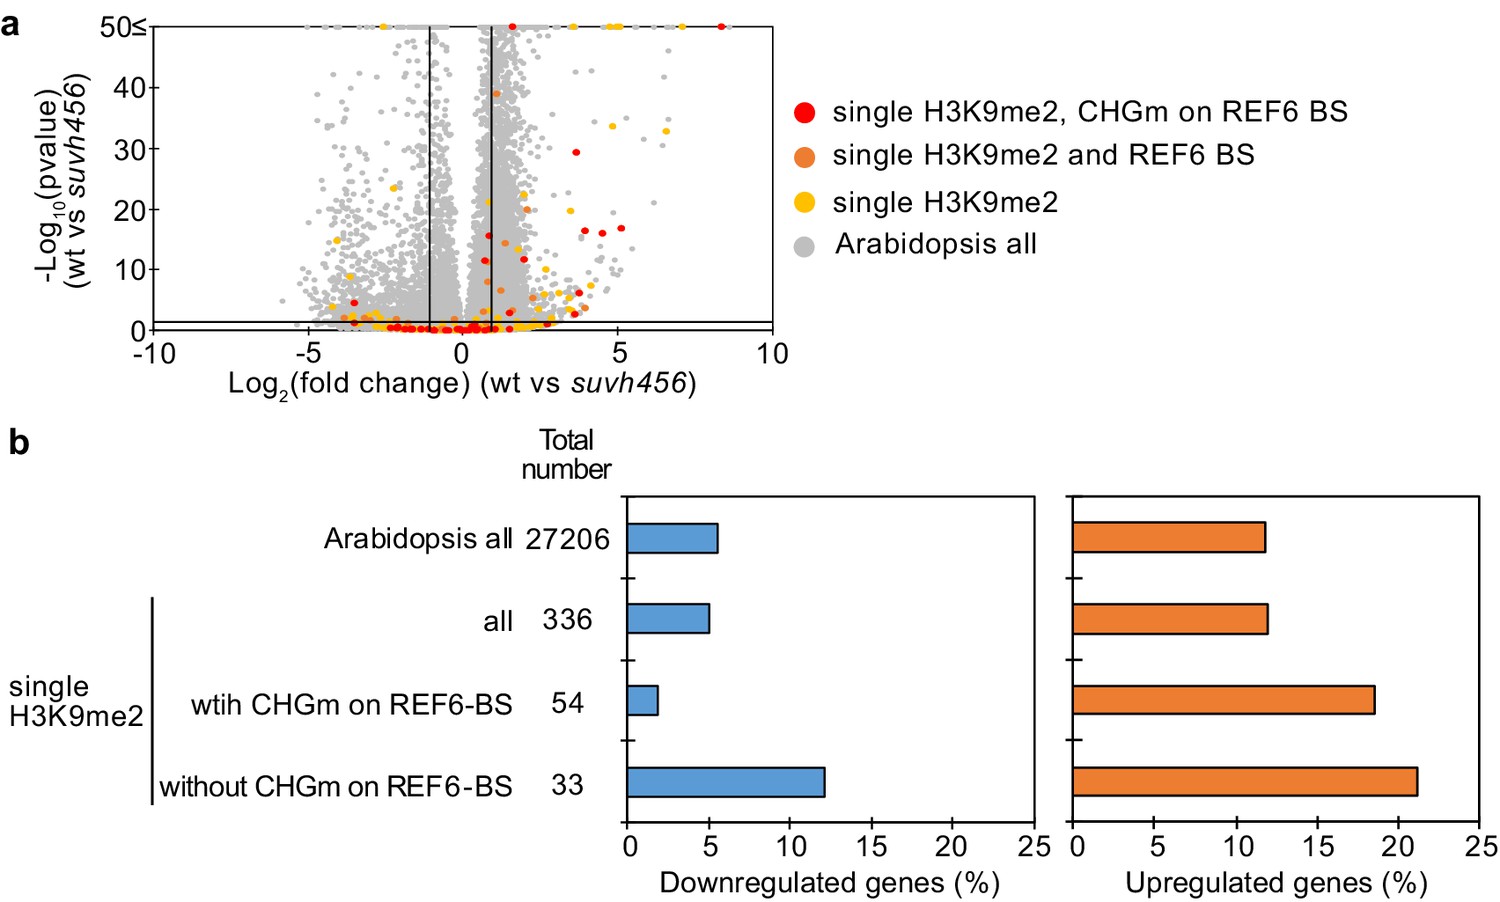
Genes marked by single H3K27me3 are activated by REF6 during germination.
(a) Volcano plot shows differentially expressed genes with single H3K27me3 and REF6-binding sites (REF6-BS) in ref6-1. The color of dots corresponds to the following gene categories: red dots represent genes with single H3K27me3 and non-CHG methylation (CHGm) on REF6-BS, orange dots represent genes with single H3K27me3 and REF6-BS (excluding non-CHGm REF6-BS), yellow dots represent genes with single H3K27me3 (excluding REF6-BS), and gray dots represent Arabidopsis all genes (excluding genes with single H3K27me3). Vertical and horizontal lines mark thresholds of up- and downregulated genes (1≦Log2FC, Log2FC≦–1 and p<0.05). (b) Plots show the percentage of up- (1≦Log2FC, p<0.05) and downregulated (Log2FC≦–1, p<0.05) genes in the endosperm of ref6-1 during germination. Compared are genes with single H3K27me3 and presence or absence of (CHGm on REF6-BS. CHGm was determined based on published data Park et al., 2016). Asterisks indicate significant differences compared to Arabidopsis all genes (*p<0.05, **p<0.01, pairwise Fisher’s exact test with Benjamini–Hochberg correction). (c) Plot shows the expression of genes with single H3K27me3 and REF6-BS that were downregulated in endosperm of ref6-1. Gene expression was calculated based on tissue-specific transcriptome data in the endosperm during germination (Dekkers et al., 2013). Expression levels were compared between 1 and 38 hours after imbibition. Expression changes were defined as follows: upregulated genes (1≦Log2FC and p<0.05), downregulated genes (Log2FC≦–1 and p<0.05), stably expressed genes (–1≦Log2FC≦1 and p<0.05) and non-expressed genes. Percentage of ethylene and gibberellin inducible genes was calculated based on transcriptome data from seedlings (Cao et al., 2006; Das et al., 2016). Asterisks indicate significant differences compared to Arabidopsis all genes (*p<0.01, **p<0.001, Fisher’s exact test). (d) Plot shows expression of EDF4 in the endosperm of ref6-1 during germination as determined by RT-qPCR. Embryos of wild-type, ref6-1, and ref6-3 mutants were dissected after 72 hr of stratification and 24 hr of incubation under normal conditions. Error bars indicate SD from technical triplicates. Asterisks indicate significant differences compared to wild type (p<0.01, Bonferroni-corrected Student’s t test).
-
Figure 5—source data 1
RNA-seq data in the ref6 mutant endosperm during germination.
- https://cdn.elifesciences.org/articles/64593/elife-64593-fig5-data1-v2.xlsx
Figure 5—figure supplement 1
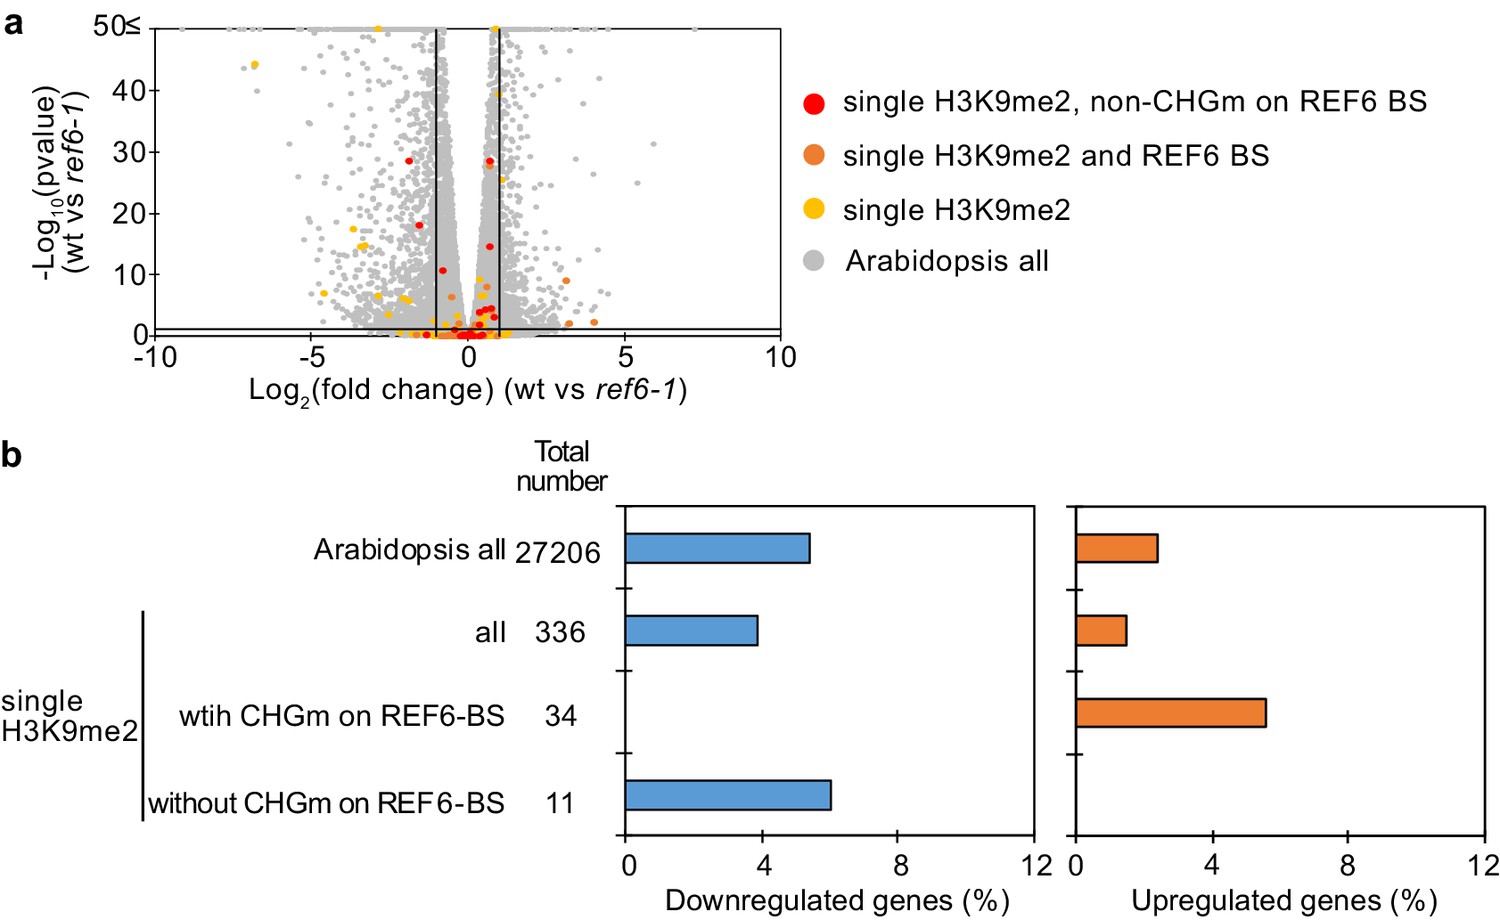
Transcriptome analyses of genes with single H3K9me2 in the ref6 endosperm during germination.
(a) Volcano plot shows differentially expressed genes with single H3K9me2 and REF6-binding sites (REF6-BS) in ref6-1. The color of dots corresponds to the following gene categories: red dots represent genes with single H3K9me2 and non-CHG methylation (CHGm) on REF6-BS, orange dots represent genes with single H3K9me2 and REF6-BS (excluding non-CHGm REF6-BS), yellow dots represent genes with single H3K9me2 (excluding REF6-BS), and gray dots represent Arabidopsis all genes (excluding genes with single H3K9me2). Vertical and horizontal lines mark thresholds of up- and downregulated genes (1≦Log2FC, Log2FC≦–1 and p<0.05). (b) Plots show the percentage of up- and downregulated genes in the endosperm of ref6-1 during germination. Compared were genes with single H3K9me2 and presence or absence of CHGm on REF6-BS (based on published data [Park et al., 2016]). Pairwise Fisher’s exact tests with Benjamini–Hochberg correction did not detect significant differences compared to Arabidopsis all genes (p>0.05).
Figure 5—figure supplement 2
Transcriptome analyses of genes with double H3K27me3/H3K9me2 in the ref6 endosperm during germination.
(a) Volcano plot shows differentially expressed genes with double H3K27me3/H3K9me2 and non-CHGm on REF6-BS in ref6-1. The color of dots corresponds to the following gene categories: red dots represent genes with double H3K27me3/H3K9me2 and non-CHG methylation on REF6-BS, orange dots represent genes with double H3K27me3/H3K9me2 and REF6-BS (excluding non-CHGm REF6-BS), yellow dots represent genes with double H3K27me3/H3K9me2 (excluding REF6-BS), and gray dots represent Arabidopsis all genes (excluding genes with double H3K27me3/H3K9me2). Vertical and horizontal lines mark thresholds of up- and downregulated genes (1≦Log2FC, Log2FC≦–1 and p<0.05). (b) Plots show the percentage of up- and downregulated genes in the endosperm of ref6-1 during germination. Compared were genes with double H3K27me3/H3K9me2 and presence or absence of CHGm on REF6-BS (based on published data [Park et al., 2016]). Pairwise Fisher’s exact tests with Benjamini-Hochberg correction did not detect significant differences compared to Arabidopsis all genes (p>0.05).
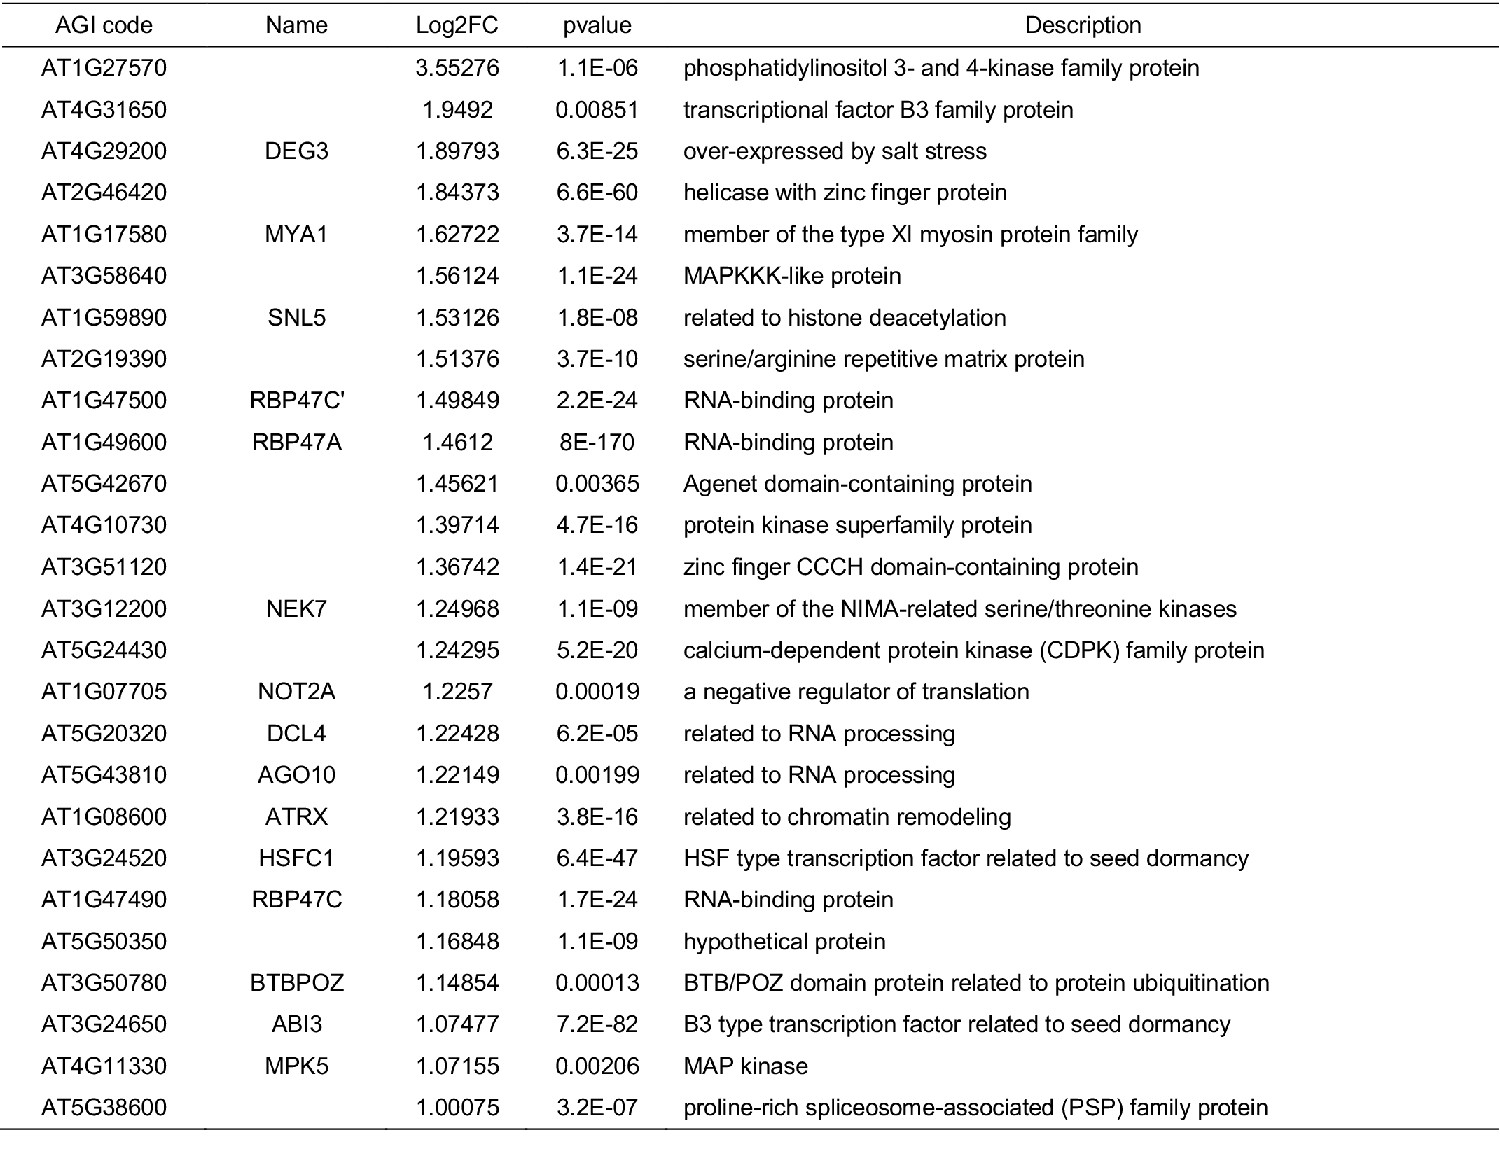
Figure 5—figure supplement 3
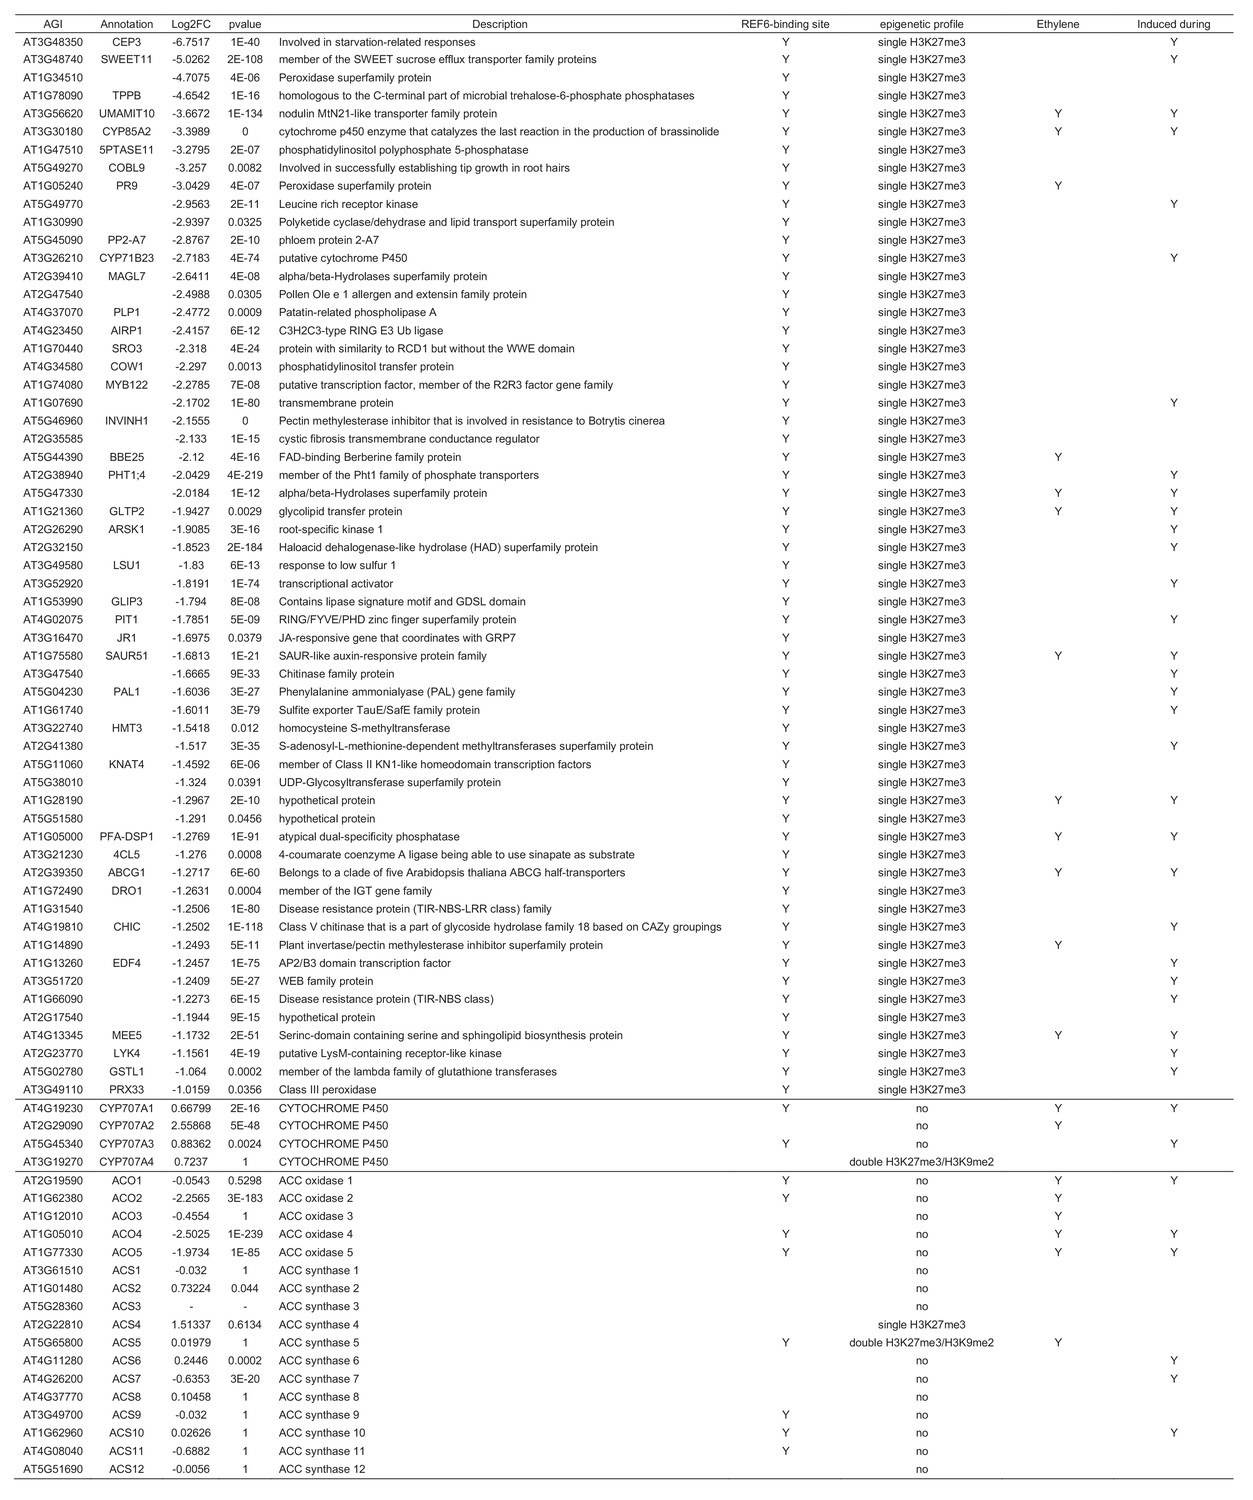
List of downregulated genes with single H3K27me3 and REF6-binding sites that were downregulated in ref6-1 and expression of CYP707A family genes and ethylene biosynthesis genes.
Ethylene inducibility and gene induction during germination are based on previous transcriptome analyses (Das et al., 2016; Dekkers et al., 2013).
Figure 5—figure supplement 4
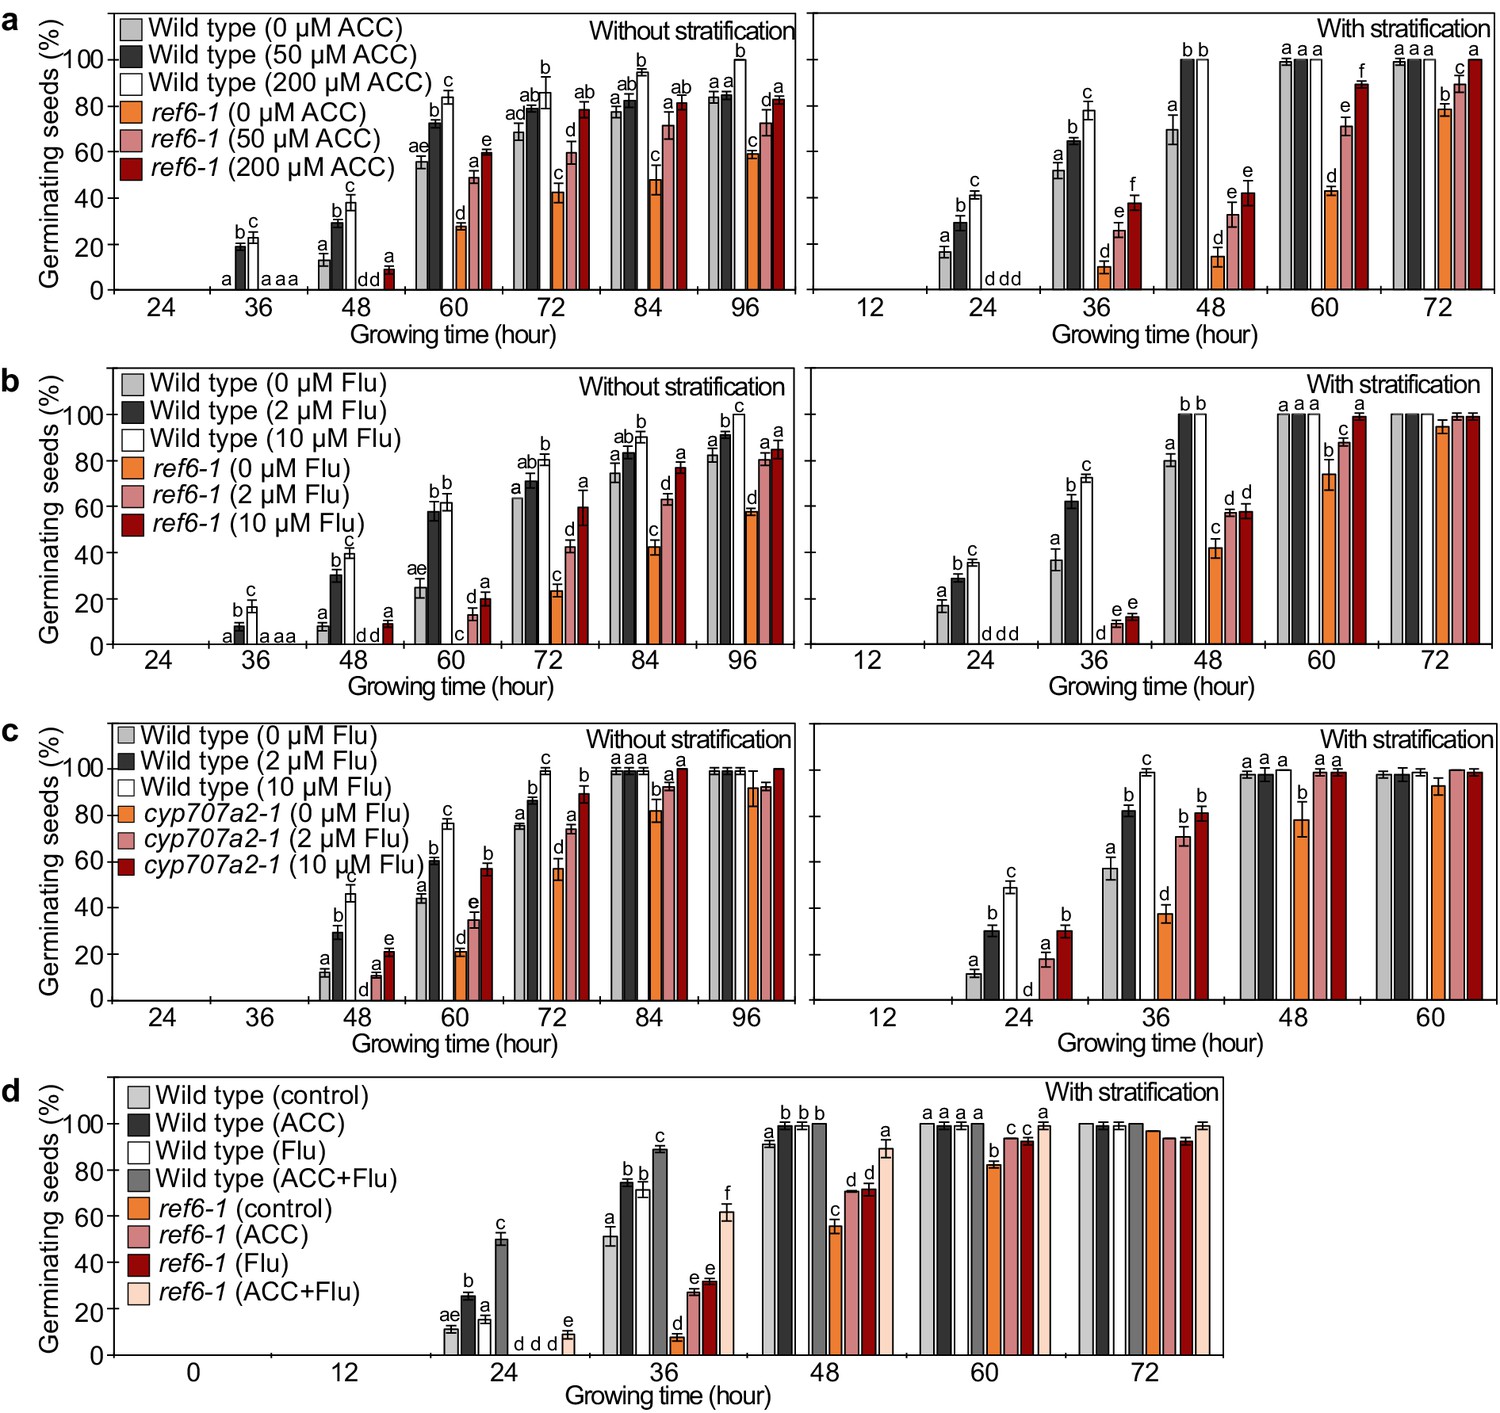
Analysis of the effect of exogenous chemical treatment impacting on ABA and ethylene pathways in the ref6-1 mutant.
(a) Plots show the percentage of germinating seeds of wild type and ref6-1 mutants with and without stratification treated with different concentrations of the ethylene precursor 1-aminocyclopropanecarboxylic acid (ACC). Error bars indicate SD from three biological replicates (n = 120 total). The letters above the bars indicate significant differences among genotypes with different treatment (p<0.05, Tukey’s multiple range test). (b) Plots shows the percentage of germinating seeds of wild type and ref6-1 mutants with and without stratification treated with different concentrations of the ABA biosynthesis inhibitor fluridone (Flu). Details are shown in the legend of Figure 5a. (c) Plots shows the percentage of germinating seeds of wild-type and cyp707a2-1 mutants with and without stratification treated with different concentrations of fluridone (Flu). Details are shown in the legend of Figure 5a. (d) Plots shows the percentage of germinating seeds of wild type and ref6-1 mutants treated with ACC (200 µM) and/or fluridone (Flu, 10 µM) and after stratification. Details are shown in the legend of Figure 5a.
Figure 6 with 2 supplements
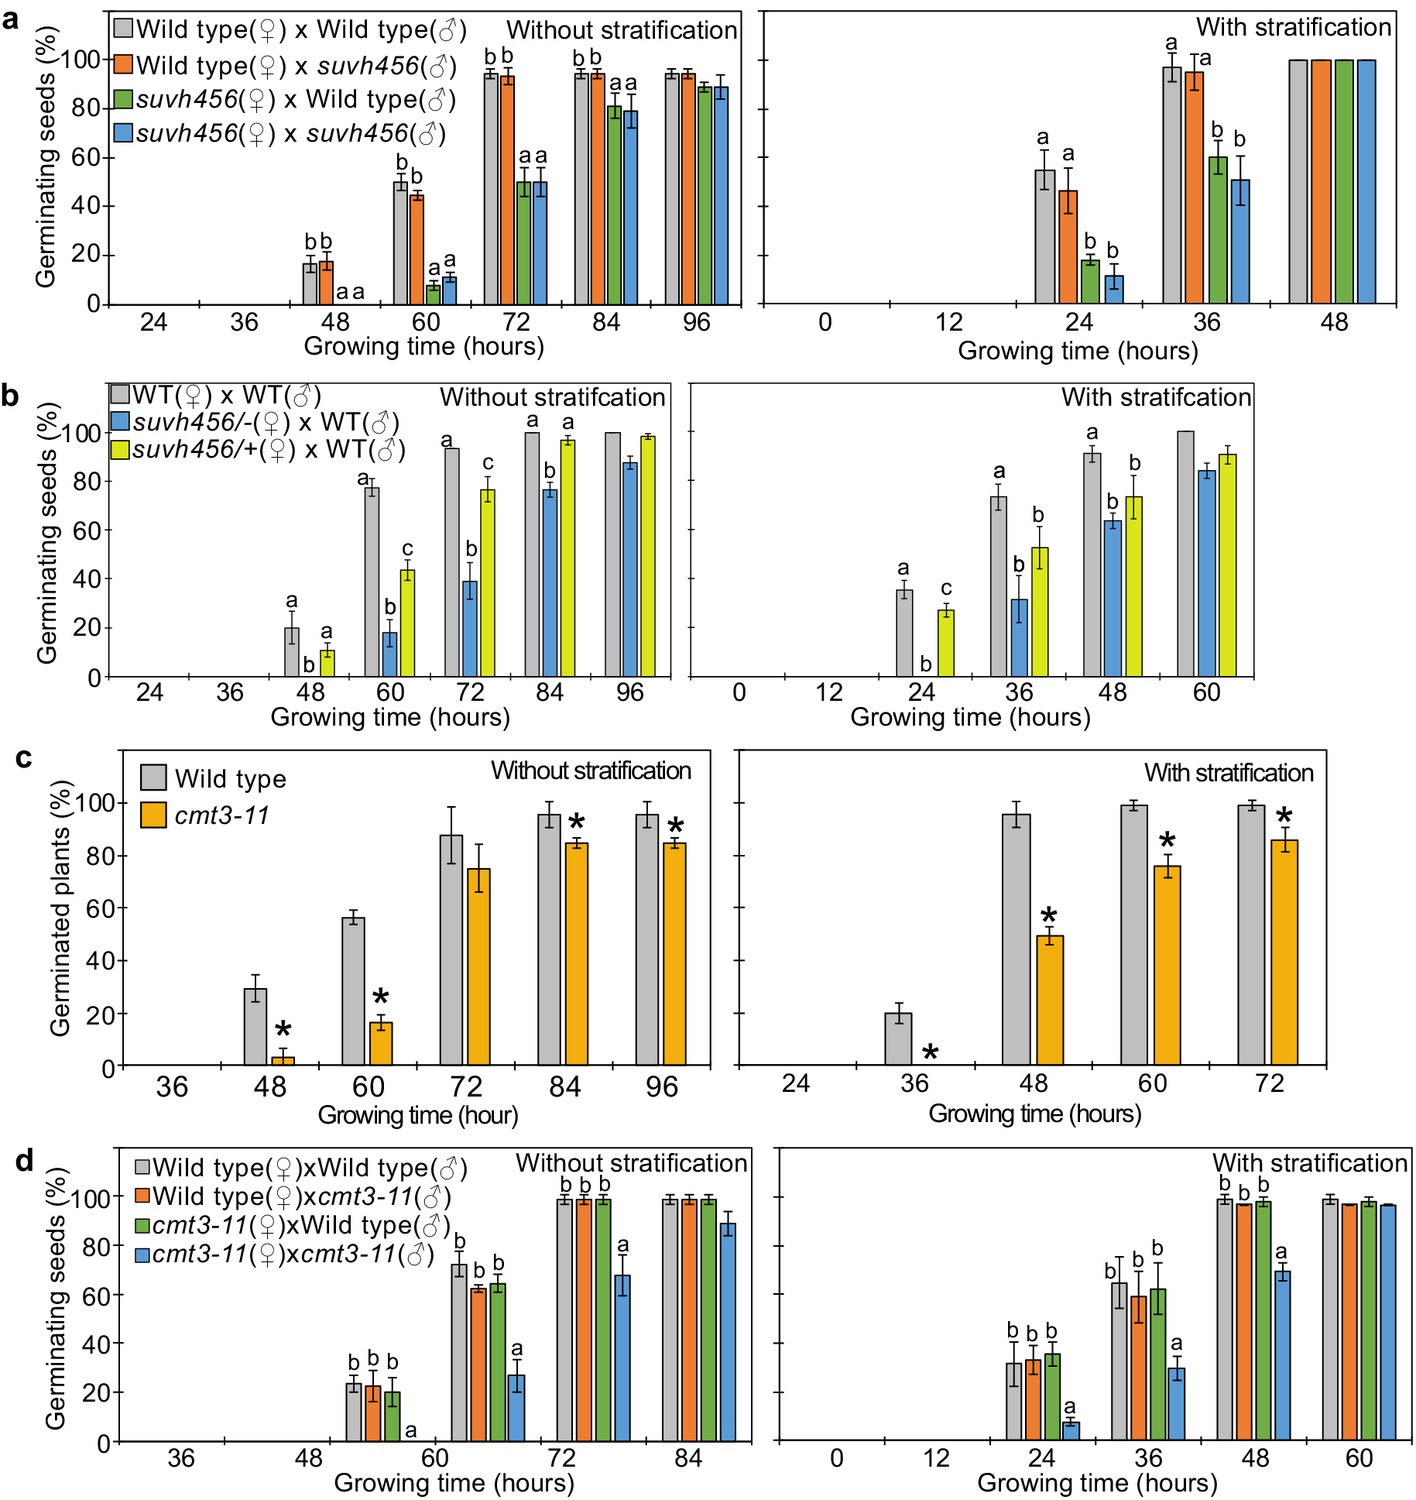
SUVH4/5/6 and CMT3 are necessary to promoter germination.
(a) Germination phenotypes of seeds generated by reciprocal crosses between wild-type and suvh456 triple mutants. Plots show the percentage of germinating seeds with and without stratification. Error bars indicate SD from three biological replicates (n = 120 total). The letters above the bars indicate significant differences between genotypes (p<0.05, Tukey’s multiple range test). (b) Plots show the percentage of germinating seeds with and without stratification of wild-type (WT) and F1 seeds generated by crossing maternal heterozygous or homozygous suvh456 and paternal wild type. Error bars indicate SD from three biological replicates (n = 90 total). Letters above bars indicate significant differences among genotypes (p<0.05, Tukey’s multiple range test). (c) Plots show percentage of germinating seeds of wild-type and cmt3-11 mutant with and without stratification. Error bars indicate SD from three biological replicates (n = 120 total). Asterisks indicate significant differences compared to wild type (p<0.05, Student’s t test). (d) Germination phenotypes of seeds generated by reciprocal crosses between wild-type and cmt3-11 mutant. Details are shown in the legend of (a).
Figure 6—figure supplement 1
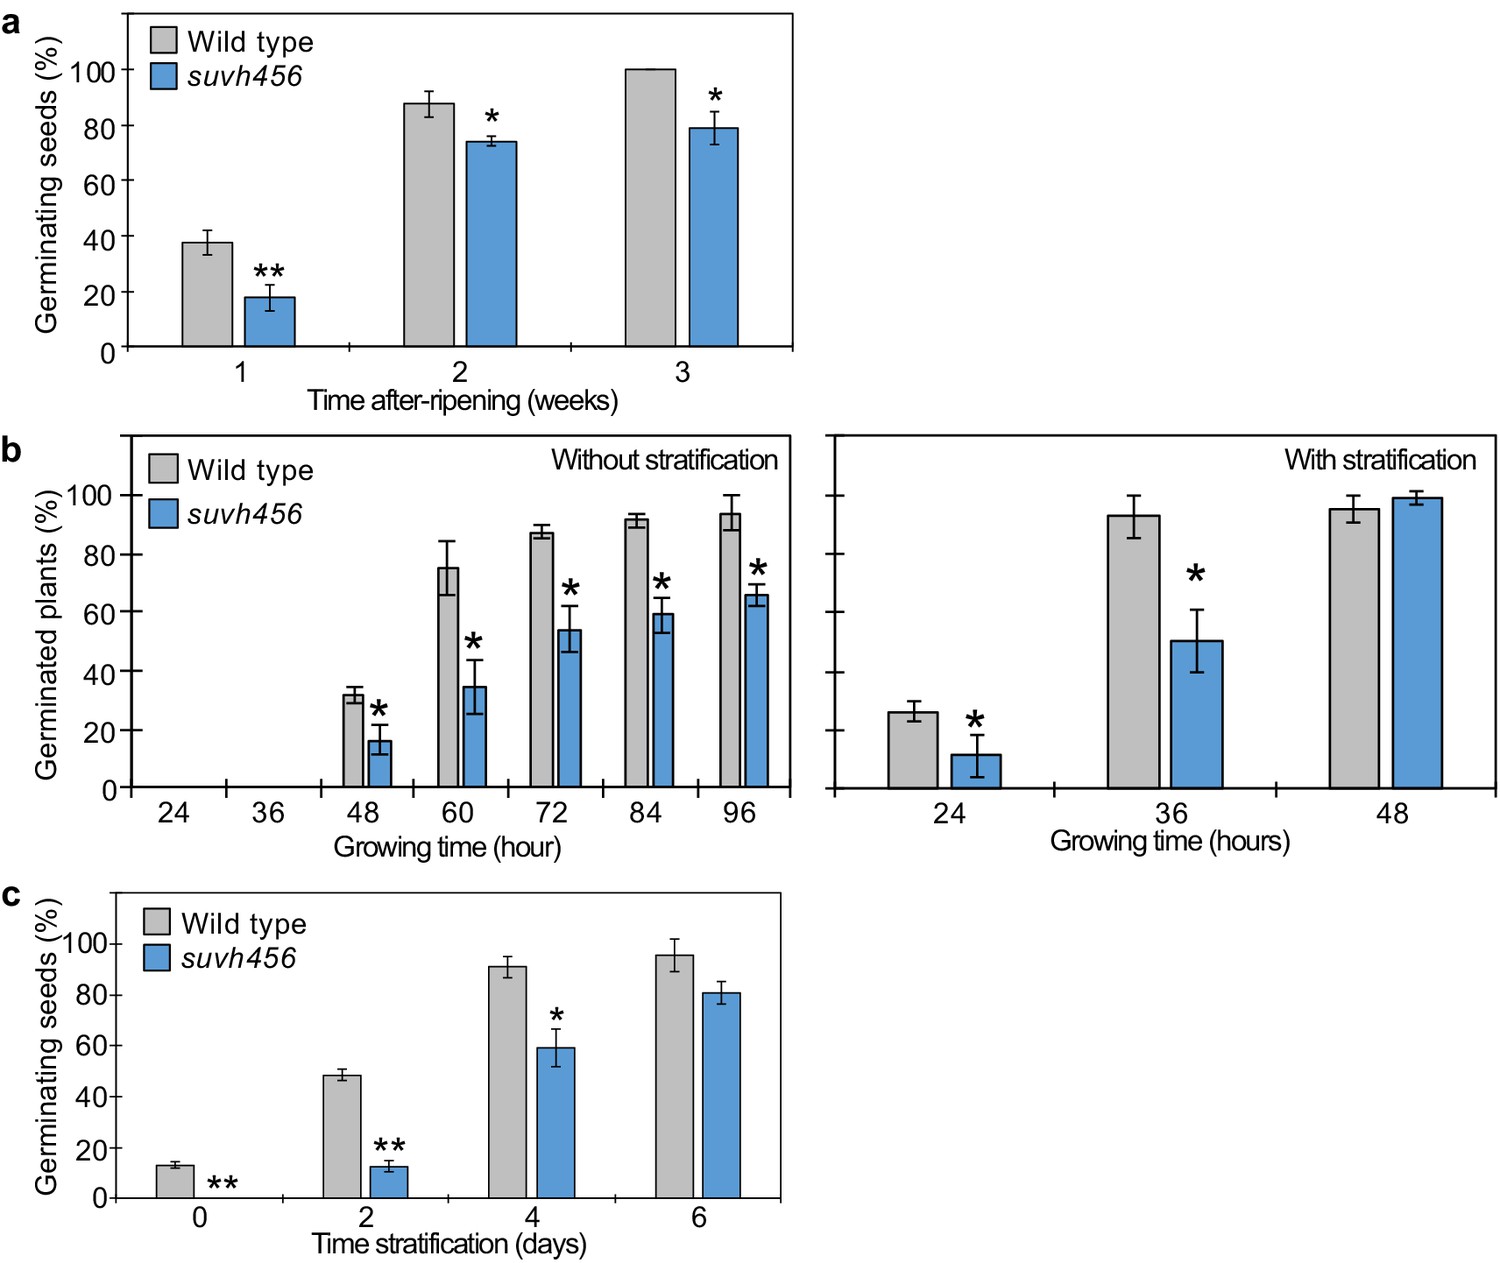
Seed dormant phenotypes of suvh456 mutants.
(a) Plot shows the percentage of germinating seeds after 96 hr of incubation under normal conditions without stratification after different periods of after-ripening. Error bars indicate SD from three biological replicates (n = 120 total). Asterisks indicate significant differences compared to wild type (p<0.05, Student’s t test). (b) Plots show percentage of germinating seeds of wild type and suvh456 triple mutants with and without stratification. Error bars indicate SD from three biological replicates (n = 120 total). Asterisks indicate significant differences compared to wild type (p<0.05, Student’s t test). (c) Plots show the percentage of germinating seeds that developed under low temperature (10°C) and were grown after 7 days of incubation under normal conditions after different periods of stratification. Error bars indicate SD from three biological replicates (n = 120 total). Asterisks indicate significant differences compared to wild type (p<0.05, Student’s t test).
Figure 6—figure supplement 2
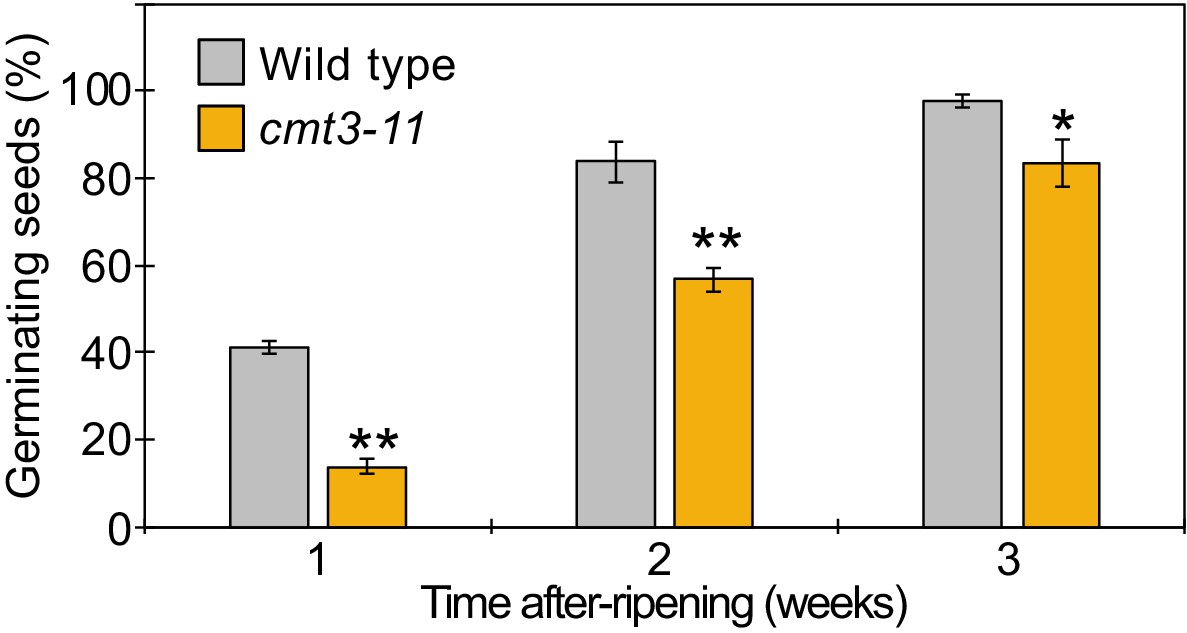
Seed dormant phenotypes of cmt3-11 mutant.
Plot shows the percentage of germinating seeds after 96 hr of incubation under normal conditions without stratification after different periods of after-ripening. Error bars indicate SD from three biological replicates (n = 120 total). Asterisks indicate significant differences compared to wild type (p<0.05, Student’s t test).
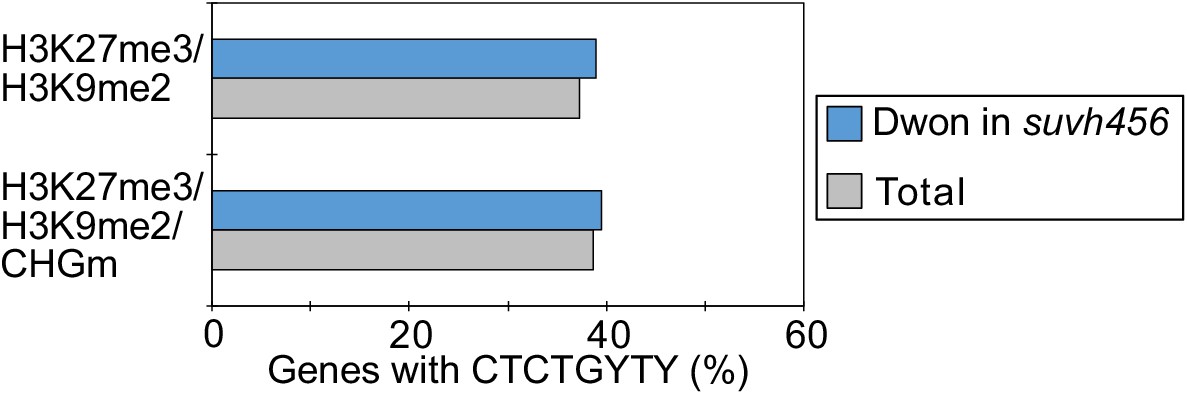
Figure 7 with 5 supplements
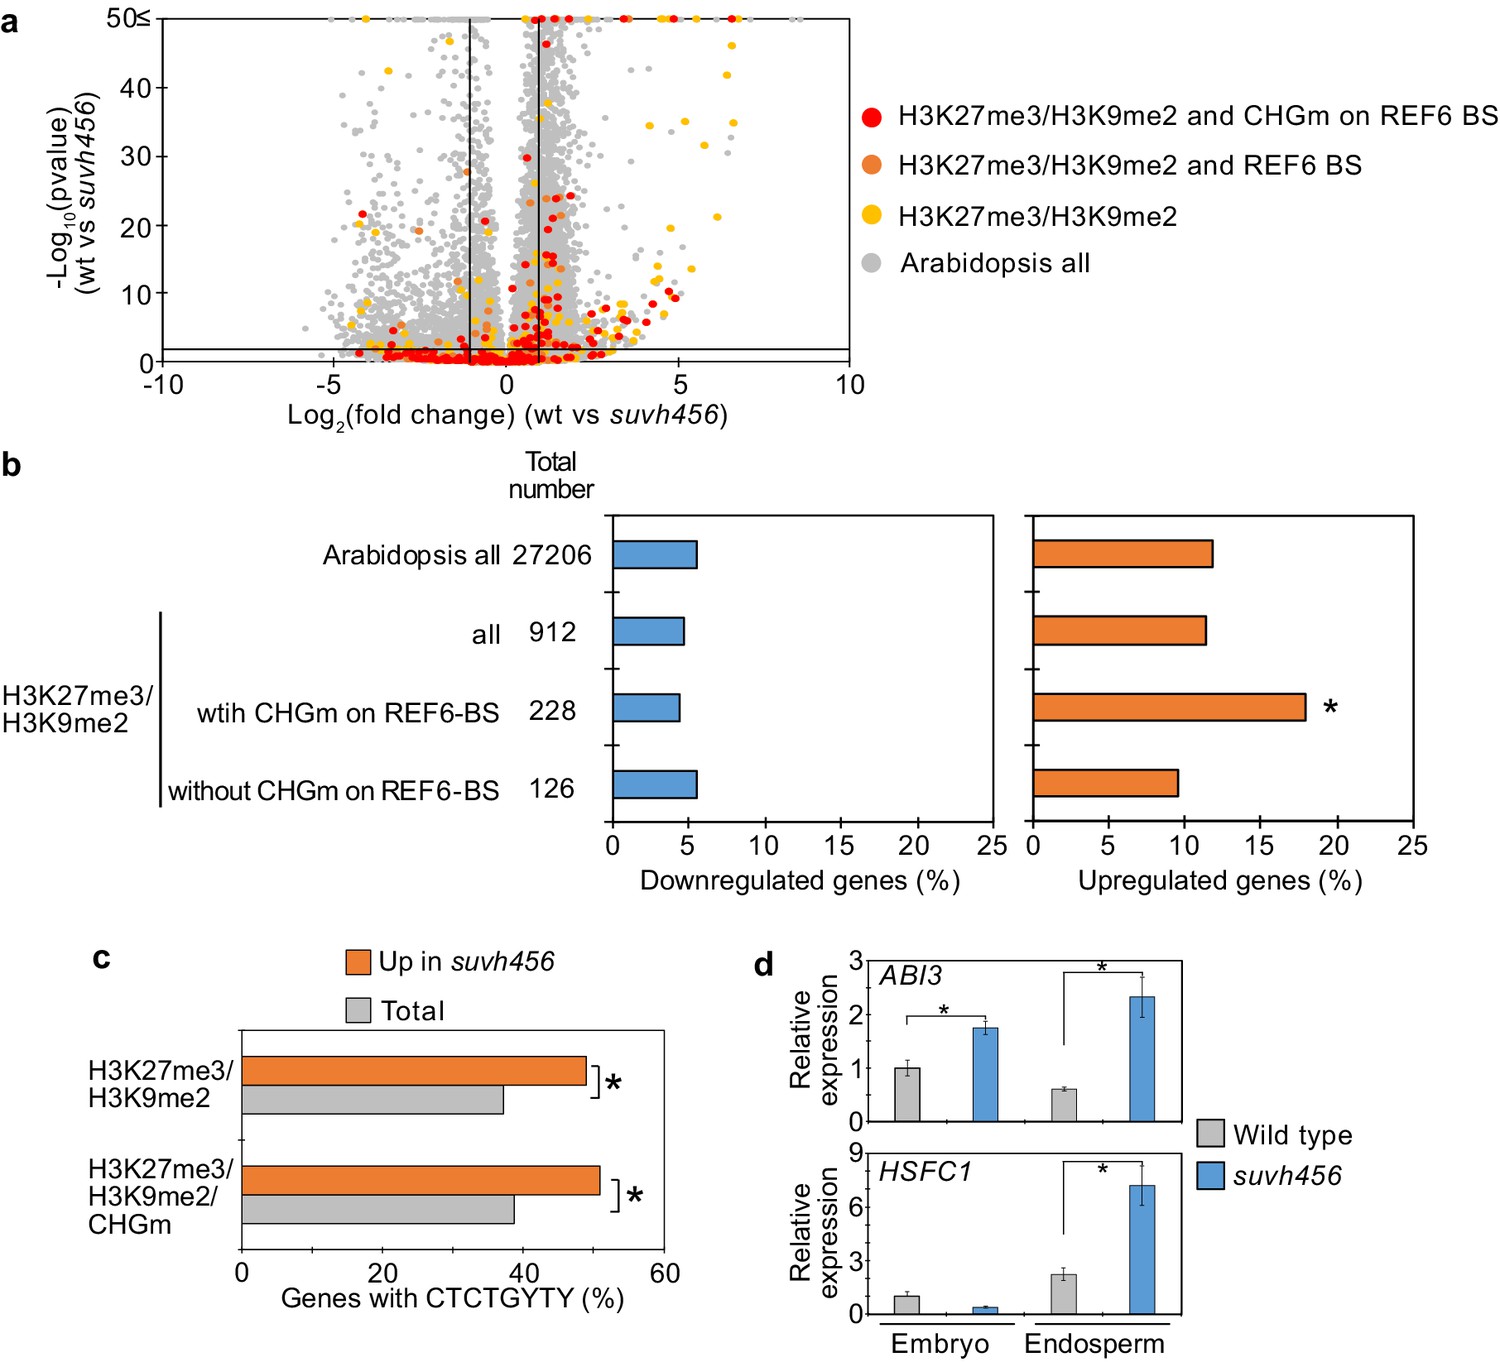
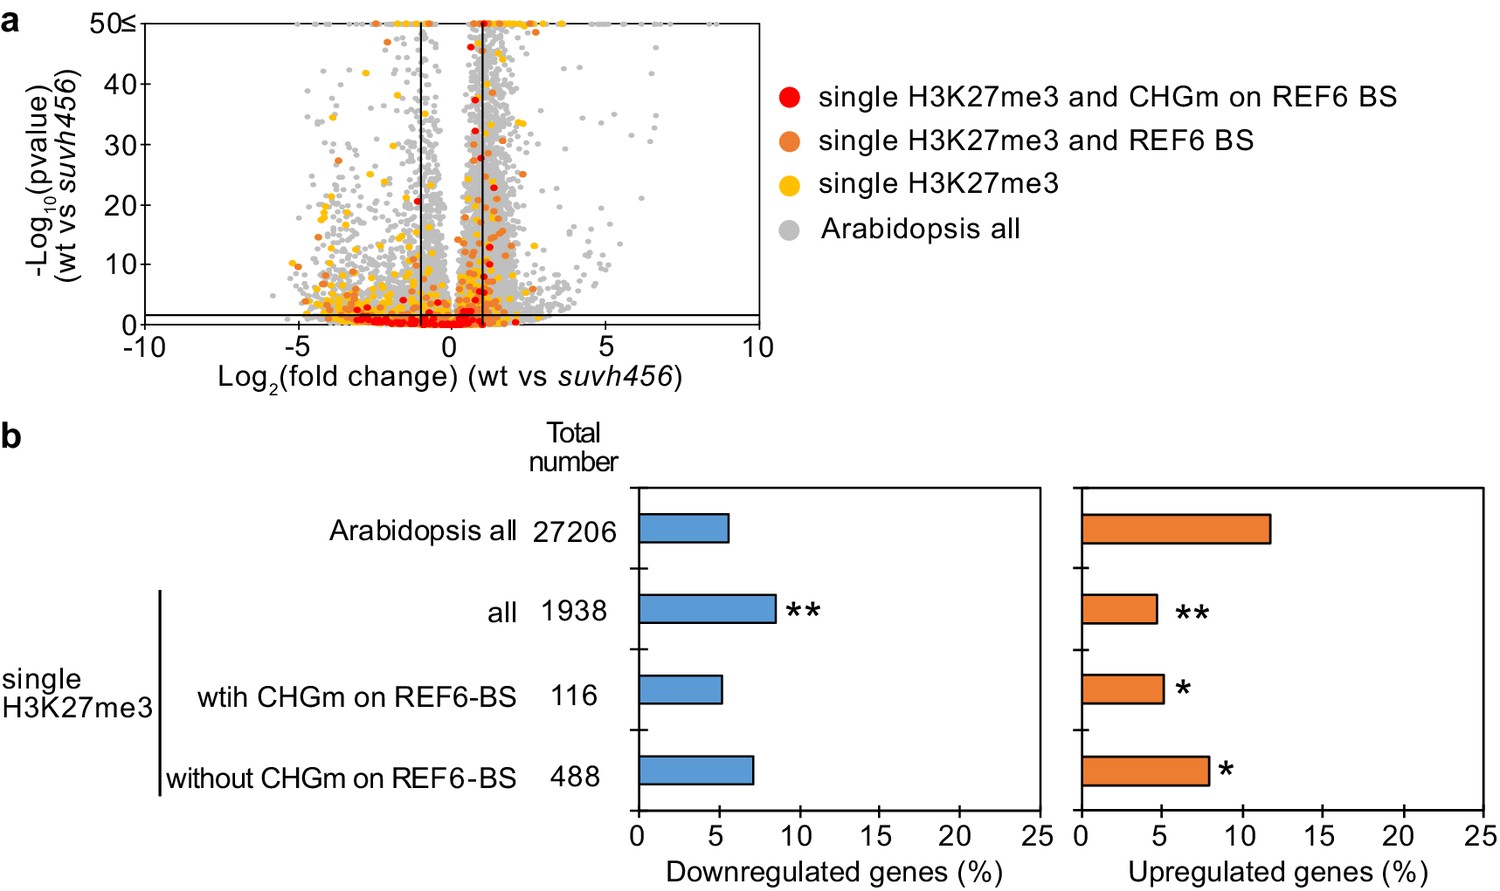
SUVH4/5/6 are required for the suppression of genes with H3K27me3/H3K9me2 and CHG methylation (CHGm) on REF6-binding sites (REF6-BS).
(a) Volcano plot shows differentially expressed genes with double H3K27me3/H3K9me2 and CHGm on REF6-BS in suvh456. The color of dots corresponds to the following gene categories: red dots represent genes with double H3K27me3/H3K9me2 and CHGm on REF6-BS, orange dots represent genes with double H3K27me3/H3K9me2 and REF6-BS (excluding CHGm REF6-BS), yellow dots represent genes with double H3K27me3/H3K9me2 (excluding REF6-BS), and gray dots represent Arabidopsis all genes (excluding genes with H3K27me3/H3K9me2). Vertical and horizontal lines mark thresholds of up- and downregulated genes are shown (1≦Log2FC, Log2FC≦–1, p<0.05). (b) Plots show the percentage of up-(1≦Log2FC, p<0.05) and downregulated (Log2FC≦–1, p<0.05) genes in the endosperm of suvh456 during germination. Compared are genes with double H3K27me3/H3K9me2 and presence or absence of CHGm on REF6-BS. CHGm was determined based on published data (Park et al., 2016). Asterisks indicate significant differences compared to Arabidopsis all genes (p<0.05, pairwise Fisher’s exact test with Benjamini–Hochberg correction). (c) Plot shows the enrichment of REF6-BS among upregulated (1≦Log2FC, p<0.05) genes in the endosperm of suvh456 during germination. Compared are genes with the indicated combinations of histone modifications and presence (>0.04) or absence (≤0.04) of CHGm. CHGm levels were determined based on published data (Park et al., 2016). Asterisks indicate significant differences between two categories (p<0.05, Fisher’s exact test). (d) Plots show the expression of ABI3 and HSFC1 in the endosperm of suvh456 during germination as determined by RT-qPCR. Embryos of wild type and the suvh456 triple mutant were dissected after 72 hr of stratification and 24 hr of incubation under normal conditions. Error bars indicate SD from technical triplicates. Asterisks indicate significant differences between wild type and suvh456 (p<0.01, Student’s t test).
-
Figure 7—source data 1
RNA-seq data in the suvh456 mutant endosperm during germination.
- https://cdn.elifesciences.org/articles/64593/elife-64593-fig7-data1-v2.xlsx
Figure 7—figure supplement 1
Enrichment of REF6-binding sites (REF6-BS) among downregulated genes in the endosperm of suvh456 during germination.
Compared are genes with different combinations of histone modifications and presence (>0.04) or absence (≤0.04) of CHGm. CHGm levels were determined based on published data (Park et al., 2016). Plot shows percentage of genes with REF6-BS in gene bodies among each category of downregulated genes in suvh456 (Log2FC≦–1, p<0.05). Fisher’s exact tests did not detect significant differences between total and downregulated genes in suvh456 in each category (p>0.05).
Figure 7—figure supplement 2
Transcriptome analyses of genes with single H3K9me2 in suvh456 mutant endosperm during germination.
(a) Volcano plot shows differentially expressed genes with single H3K9me2 and CHGm on REF6-BS in suvh456. The color of dots corresponds to the following gene categories: red dots represent genes with single H3K9me2 and CHGm on REF6-BS, orange dots represent genes with single H3K9me2 and REF6-BS (excluding CHGm REF6-BS), yellow dots represent genes with single H3K9me2 (excluding REF6-BS), and gray dots represent Arabidopsis all genes (excluding genes with single H3K9me2). Vertical and horizontal lines mark thresholds of up- and downregulated genes (1≦Log2FC, Log2FC≦–1 and p<0.05). (b) Plots show the percentage of up- (1≦Log2FC, p<0.05) and downregulated (Log2FC≦–1, p<0.05) genes in the endosperm of suvh456 during germination. Compared were genes with single H3K9me2 and presence or absence of CHGm on REF6-BS based on published data (Park et al., 2016). Pairwise Fisher’s exact tests with Benjamini–Hochberg correction did not detect significant differences compared to Arabidopsis all genes (p>0.05).
Figure 7—figure supplement 3
List of upregulated genes (1≦Log2FC, p<0.05) with H3K27me3, H3K9me2, CHG methylation, and REF6-binding sites in suvh456 endosperm of during germination.
Figure 7—figure supplement 4
Transcriptome analyses of genes with single H3K27me3 in suvh456 mutant endosperm during germination.
(a) Volcano plot shows differentially expressed genes with single H3K27me3 and CHGm on REF6-BS in suvh456. The color of dots corresponds to the following gene categories: red dots represent genes with single H3K27me3 and CHGm on REF6-BS, orange dots represent genes with single H3K27me3 and REF6-BS (excluding CHGm REF6-BS), yellow dots represent genes with single H3K27me3 (excluding REF6-BS), and gray dots represent Arabidopsis all genes (excluding single H3K27me3). Vertical and horizontal lines mark thresholds of up- and downregulated genes (1≦Log2FC, Log2FC≦–1 and p<0.05). (b) Plots show the percentage of up- and downregulated genes in the endosperm of suvh456 during germination. Compared are genes with single H3K27me3 and presence or absence of CHGm on REF6-BS based on published data (Park et al., 2016). Asterisks indicate significant differences compared to Arabidopsis all genes (*p<0.05, **p<0.01, pairwise Fisher’s exact test with Benjamini–Hochberg correction).
Figure 7—figure supplement 5
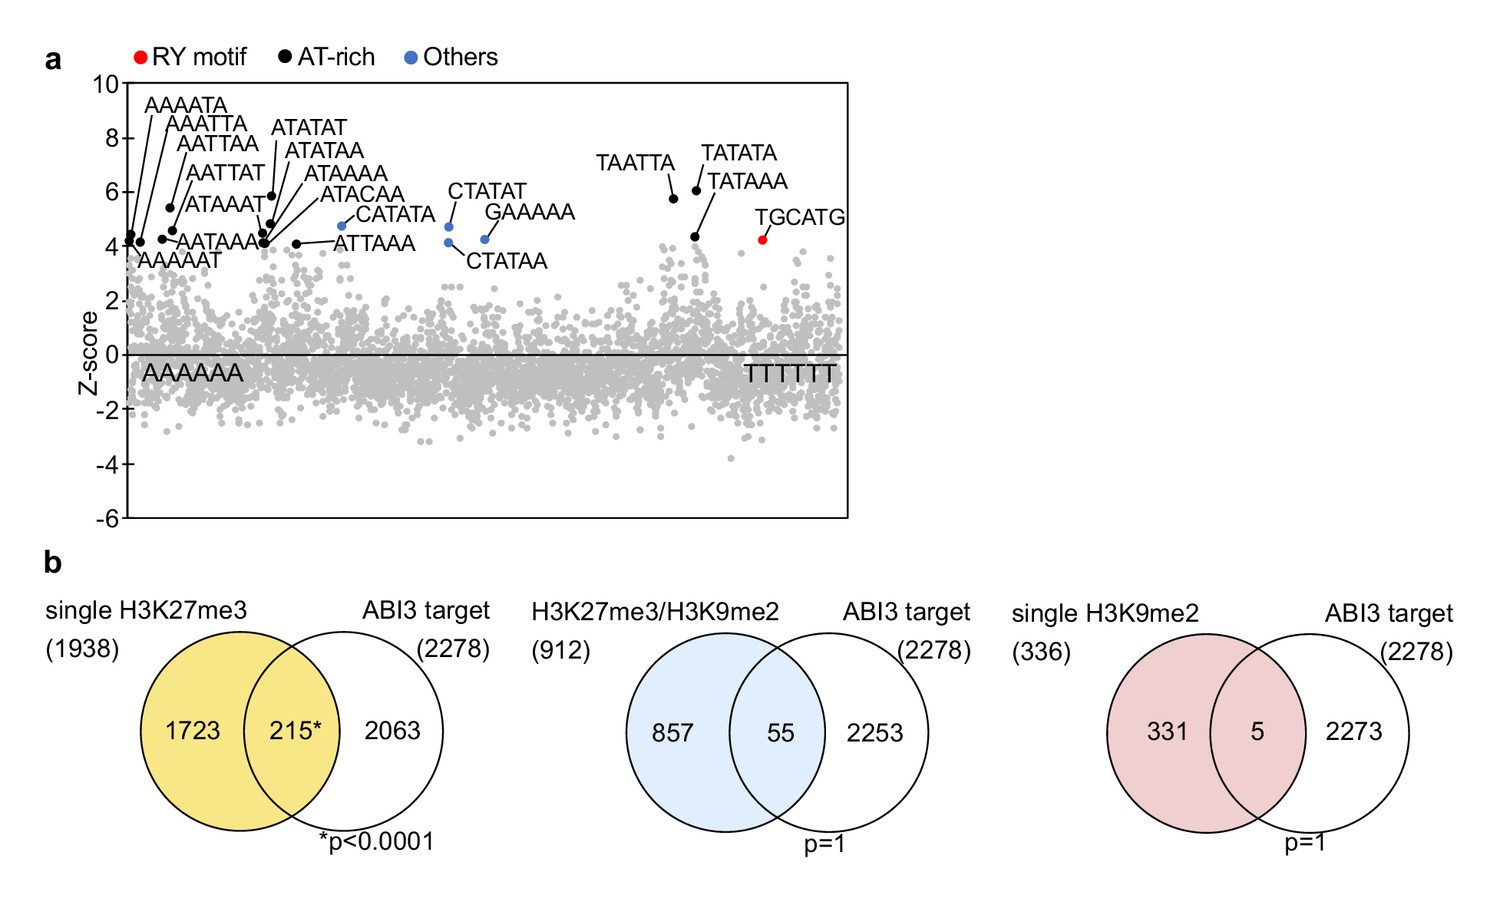
Possible effect of upregulated ABI3 on the suppression of genes with single H3K27me3 in suvh456.
(a) Overrepresentation analysis of hexamer sequences in the promoters of downregulated genes with single H3K27me3 in suvh456. Z-scores (y axes) for the observed frequencies of all hexamer sequences (x axes) are presented in the scatter plot. The top 20 conserved RY-motif (red), AT-rich sequences (black), and other sequences (blue) are exhibited. (b) Venn diagrams show overlaps between three groups of genes with different patterns of histone modifications and direct ABI3 target genes (Tian et al., 2020). The asterisk indicates significant overlap (p<0.0001, Fisher’s exact test).
Figure 8 with 5 supplements
Maternal- and paternal-specific epigenetic marks regulate parental-specific gene expression in the endosperm during germination.
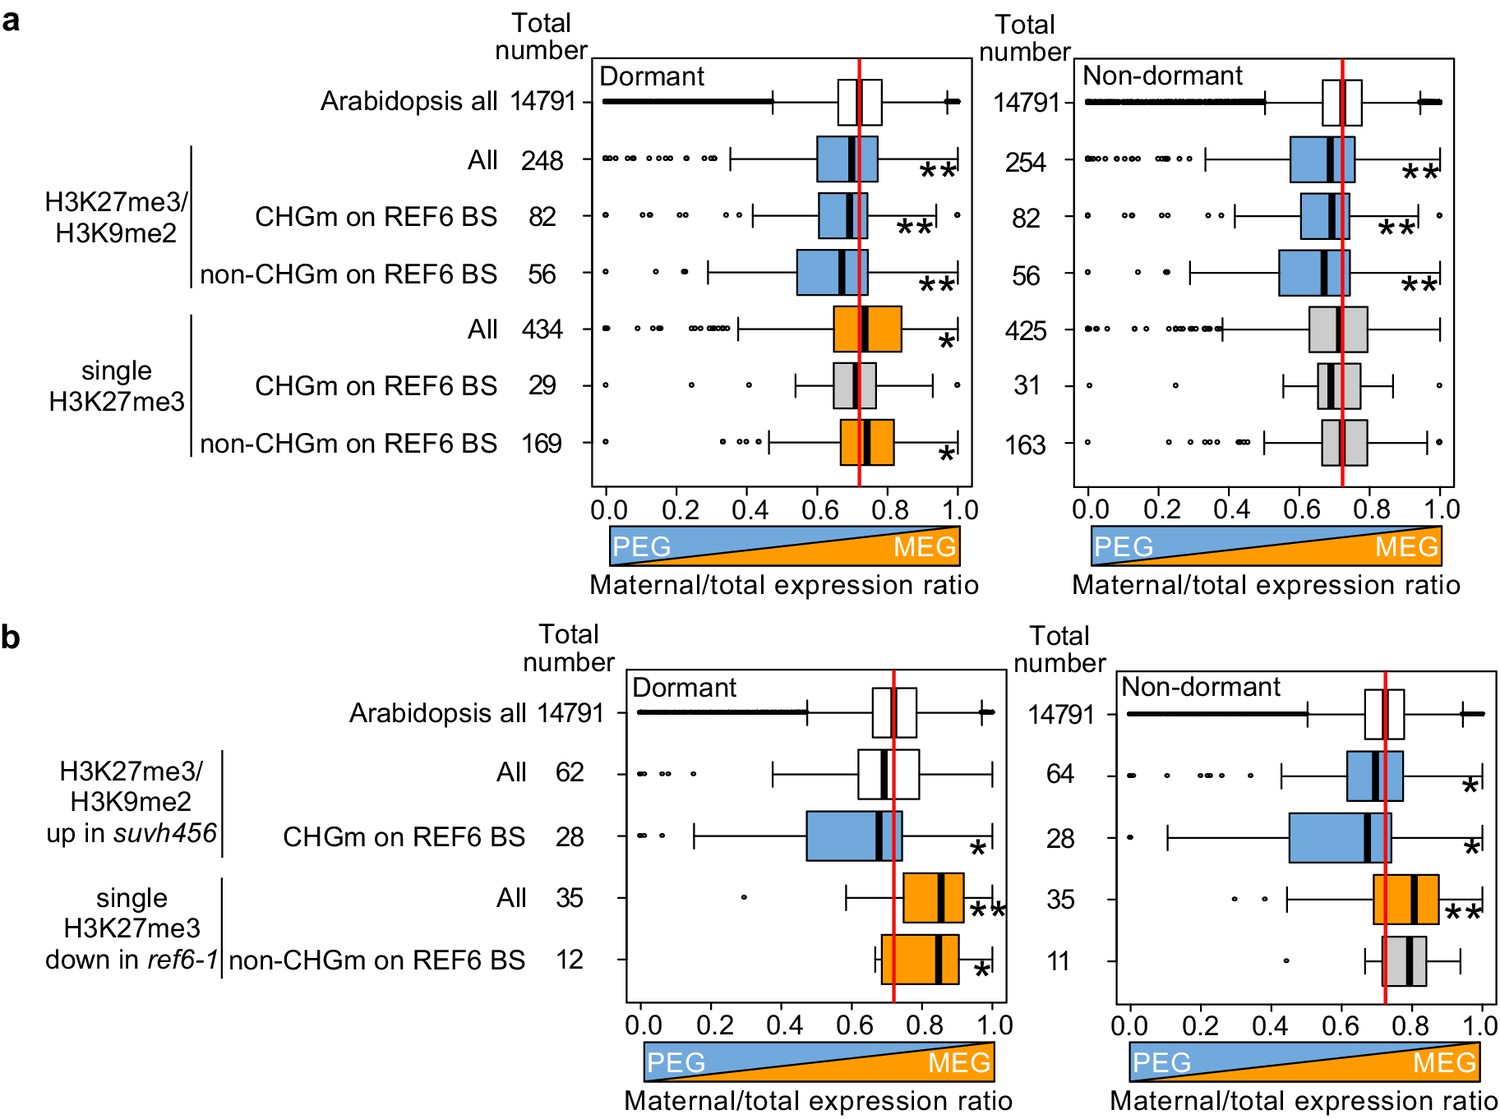
(a) Box plots show the mean values of maternal to total reads of genes expressed in the endosperm in dormant and non-dormant seeds. Compared are Arabidopsis all genes, all genes with double H3K27me3/H3K9me2 and single H3K27me3 depending on the presence or absence of CHG methylation (CHGm) on REF6-binding sites (REF6-BS) based on published data (Park et al., 2016). Parental-specific transcriptome data in the endosperm during germination from F1 seeds (maternal Col × paternal Cvi) were previously published (Piskurewicz et al., 2016). Boxes show medians and the interquartile range, and error bars show full-range excluding outliers. Numbers of genes in each category are shown beside the boxes. Asterisks indicates significant differences compared to Arabidopsis all genes (*p<0.05, **p<0.01, pairwise Wilcoxon test with Benjamini–Hochberg correction). Significantly paternally and maternally biased groups are shown in blue and orange, respectively. (b) Box plots show mean values of maternal to total reads in the endosperm of dormant and non-dormant seeds of Arabidopsis all genes, upregulated genes with double H3K27me3/H3K9me2 in suvh456, and downregulated genes with single H3K27me3 in ref6-1. Details are shown in the legend of (a).
Figure 8—figure supplement 1
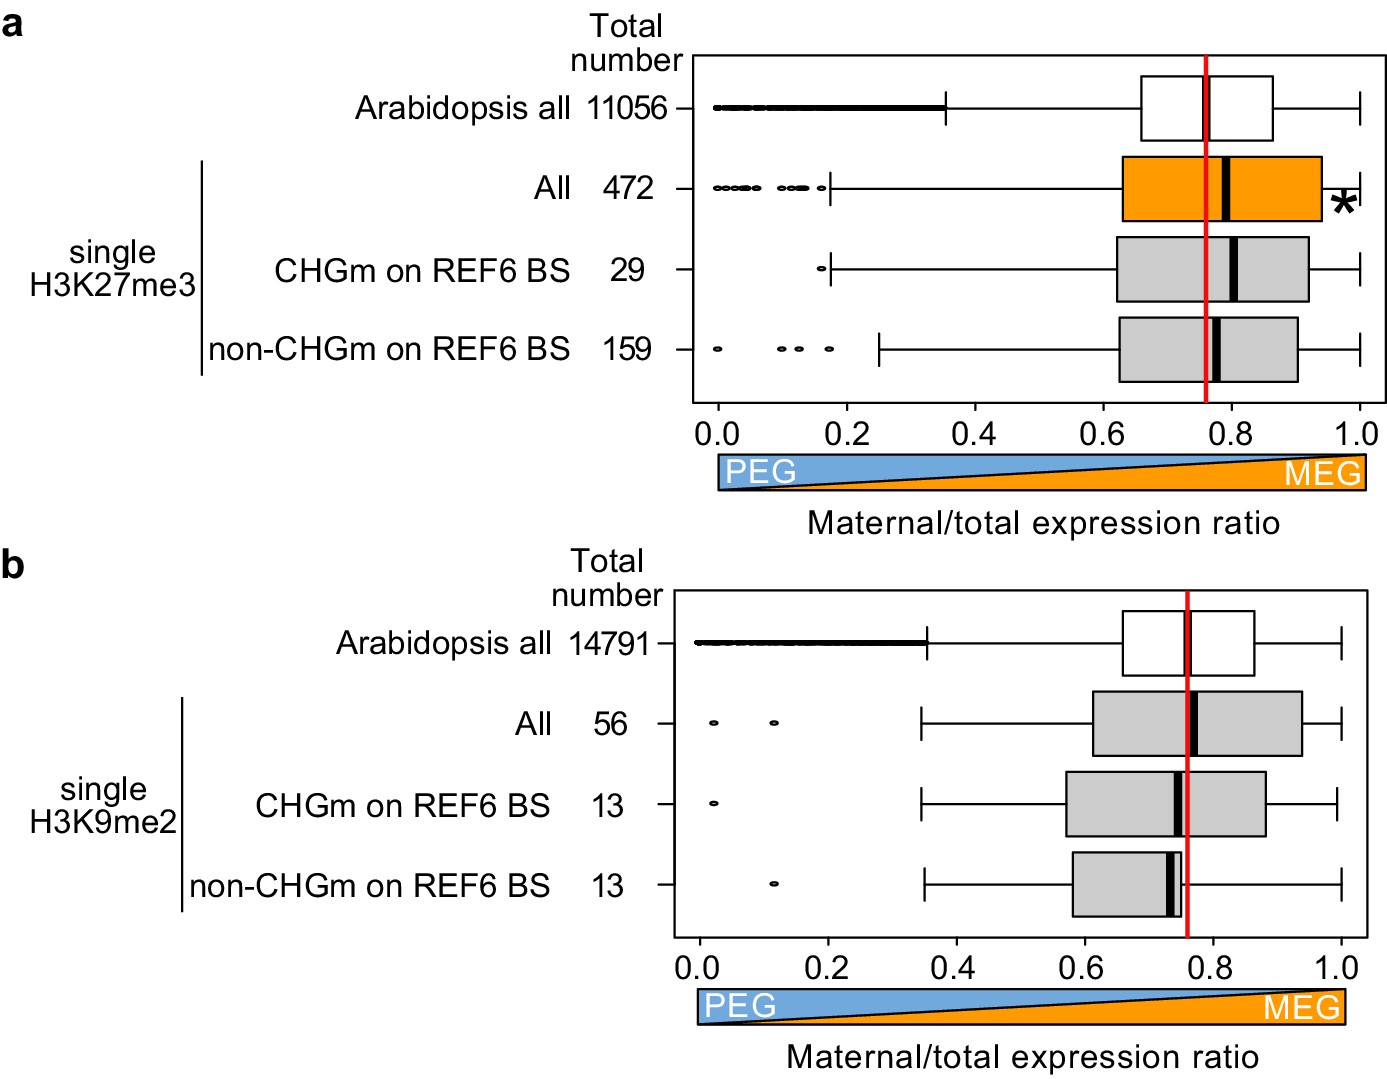
Effects of maternal-specific epigenetic marks on parental-specific gene expression profiles in the endosperm during development.
(a) Box plots show mean values of maternal to total reads of Arabidopsis all genes and genes with single H3K27me3 and CHG methylation (CHGm) on REF6-binding sites (REF6-BS) (Park et al., 2016) in the endosperm of maternal Col× paternal Ler seeds at 4 days after pollination (Moreno-Romero et al., 2016). Boxes show medians and the interquartile range and error bars show the full-range excluding outliers. Numbers of genes in each category are shown beside the boxes. Asterisks indicate significant differences compared to the mean value of Arabidopsis all genes (p<0.05, pairwise Wilcoxon test with Benjamini–Hochberg correction). Significantly maternally biased groups are shown in orange. (b) Box plots show mean values of maternal to total reads of Arabidopsis all genes and genes with single H3K9me2 and CHGm (Park et al., 2016) on REF6-BS in the endosperm of maternal Col× paternal Cvi seeds during germination (Piskurewicz et al., 2016). REF6-BS. Details are shown in the legend of (a). Pairwise Wilcoxon tests with Benjamini–Hochberg correction between mean values of each gene category comparing to Arabidopsis all genes did not detect significant differences (p>0.05).
Figure 8—figure supplement 2
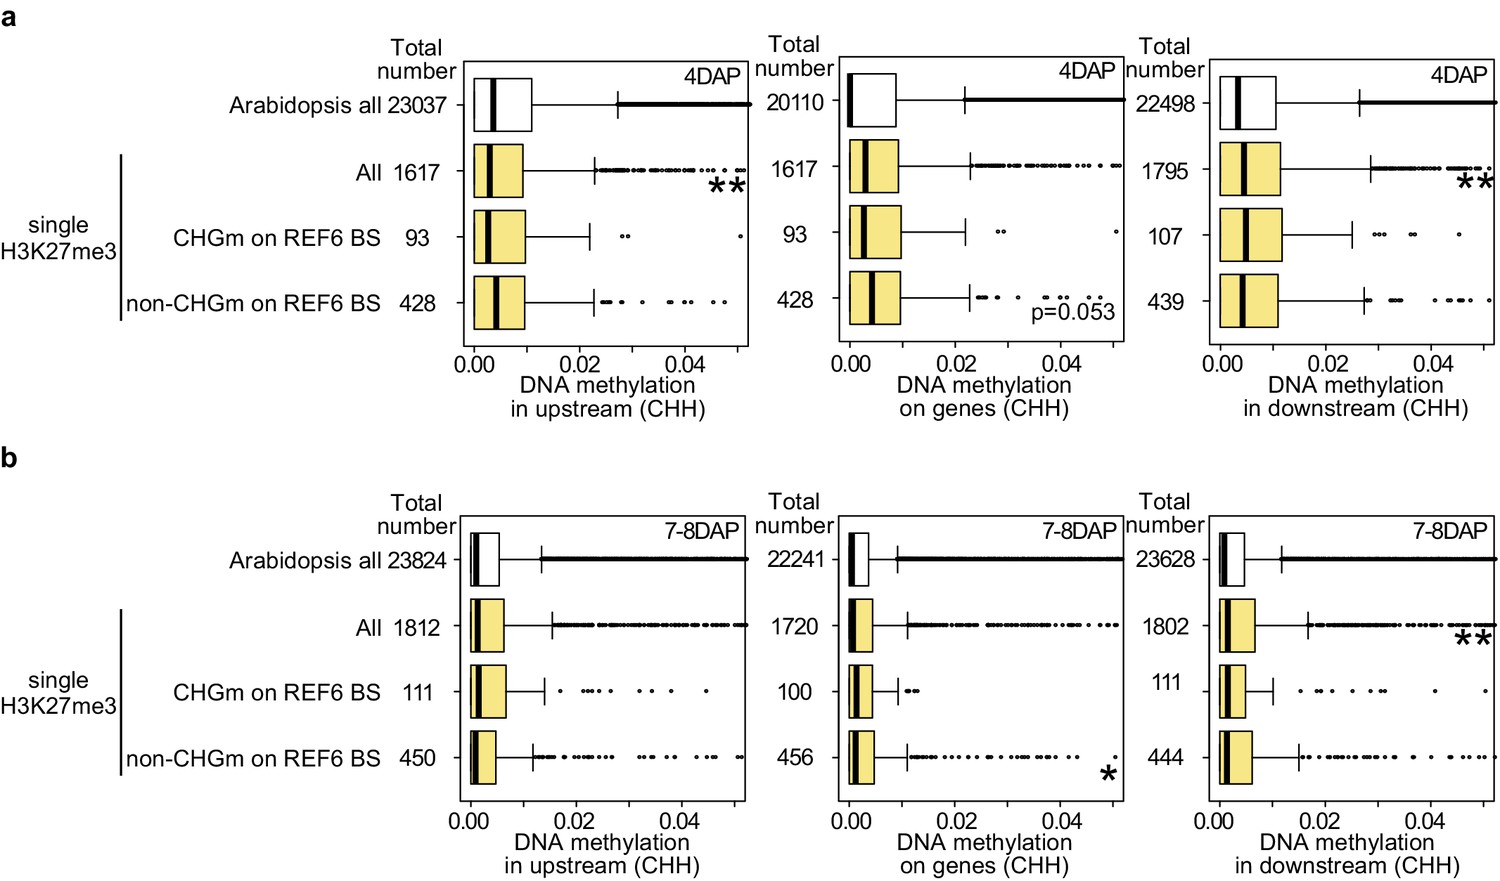
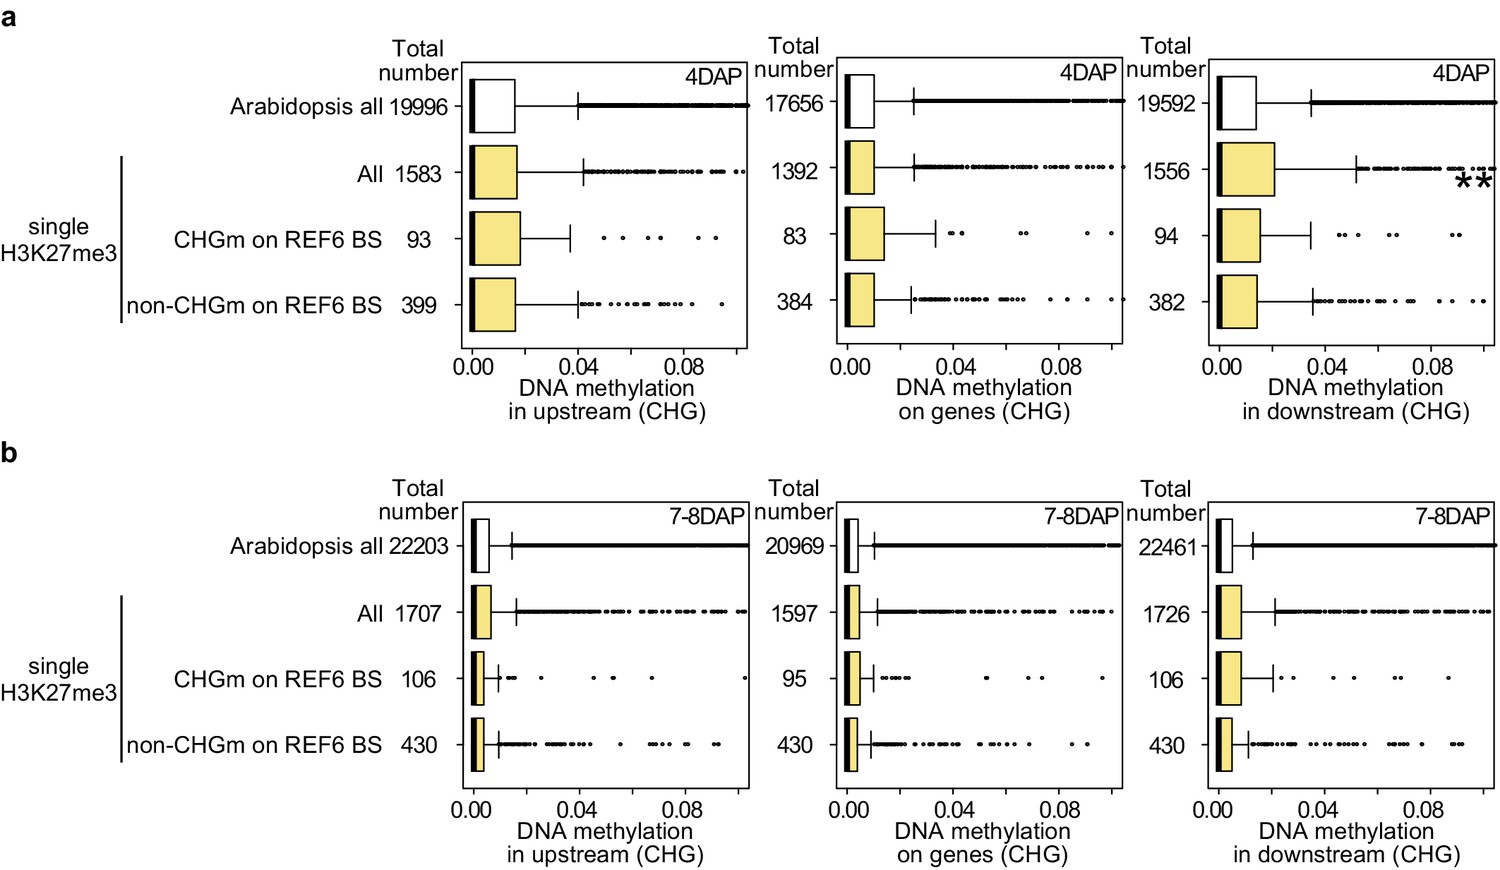
Levels of paternal CHH methylation at 4DAP (a) and 7-8DAP (b) on genes marked by H3K27me3 on the maternal alleles and with methylated or unmethylated REF6-BS within gene bodies and 2 kb up- and downstream regions.
Mean values of relative DNA methylation levels in the developing endosperm of F1 seeds (maternal Ler × paternal Col) were from previously published data (Ibarra et al., 2012; Moreno-Romero et al., 2016). Asterisks indicates significant differences compared to Arabidopsis all genes (*p<0.05; **p<0.01; pairwise Wilcoxon test with Benjamini–Hochberg correction).
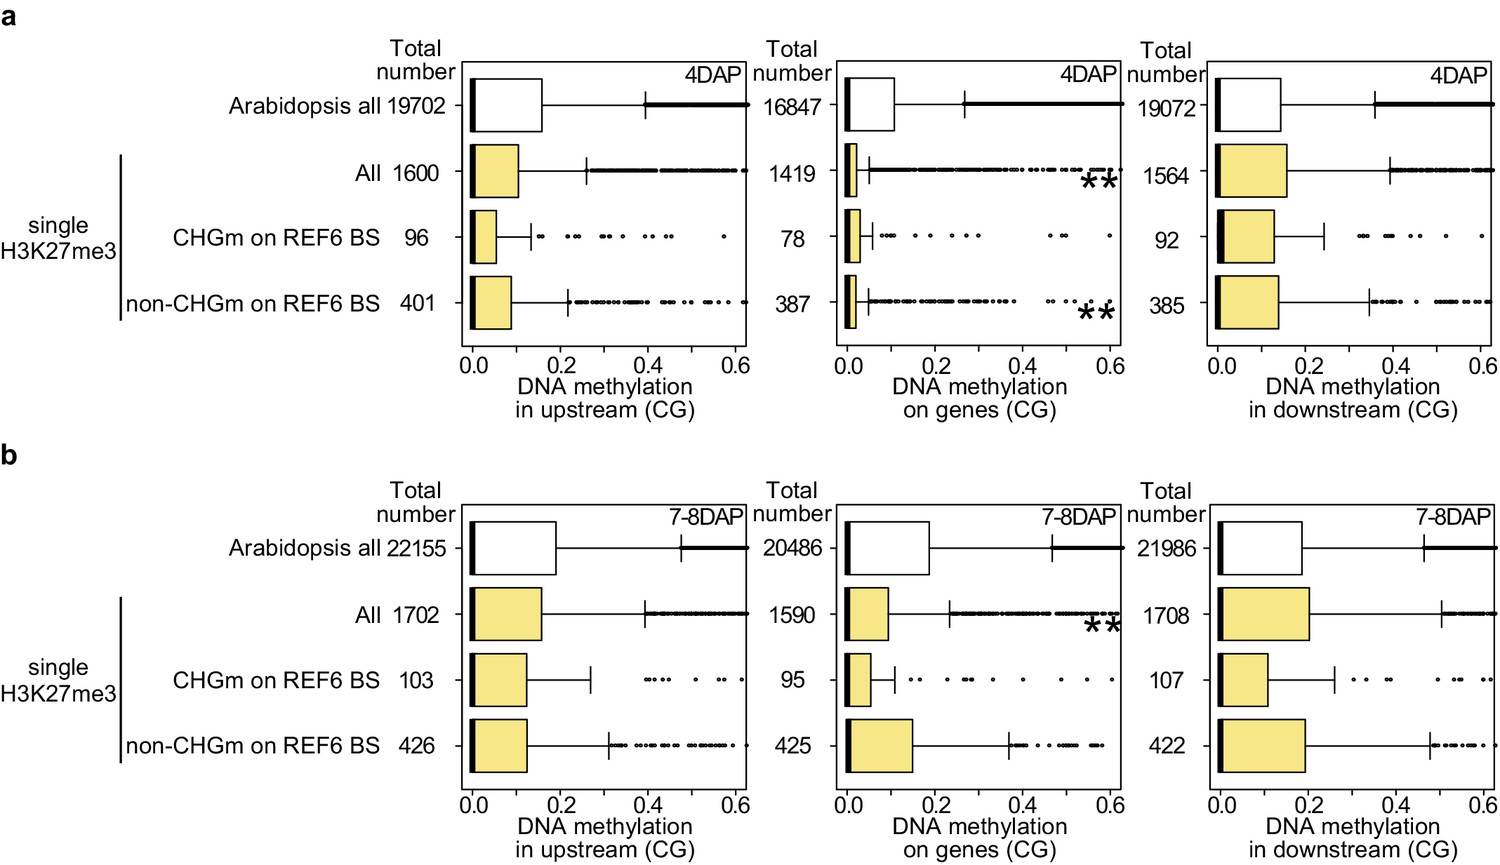
Figure 8—figure supplement 3
Levels of paternal CHG methylation at 4DAP (a) and 7-8DAP (b) on genes marked by H3K27me3 on the maternal alleles and with methylated or unmethylated REF6-BS within gene bodies and 2 kb up- and downstream regions.
Details are shown in the legend of Figure 8—figure supplement 2.
Figure 8—figure supplement 4
Levels of paternal CG methylation at 4DAP (a) and 7-8DAP (b) on genes marked by H3K27me3 on the maternal alleles and with methylated or unmethylated REF6-BS within gene bodies and 2 kb up- and downstream regions.
Details are shown in the legend of Figure 8—figure supplement 2.
Figure 8—figure supplement 5
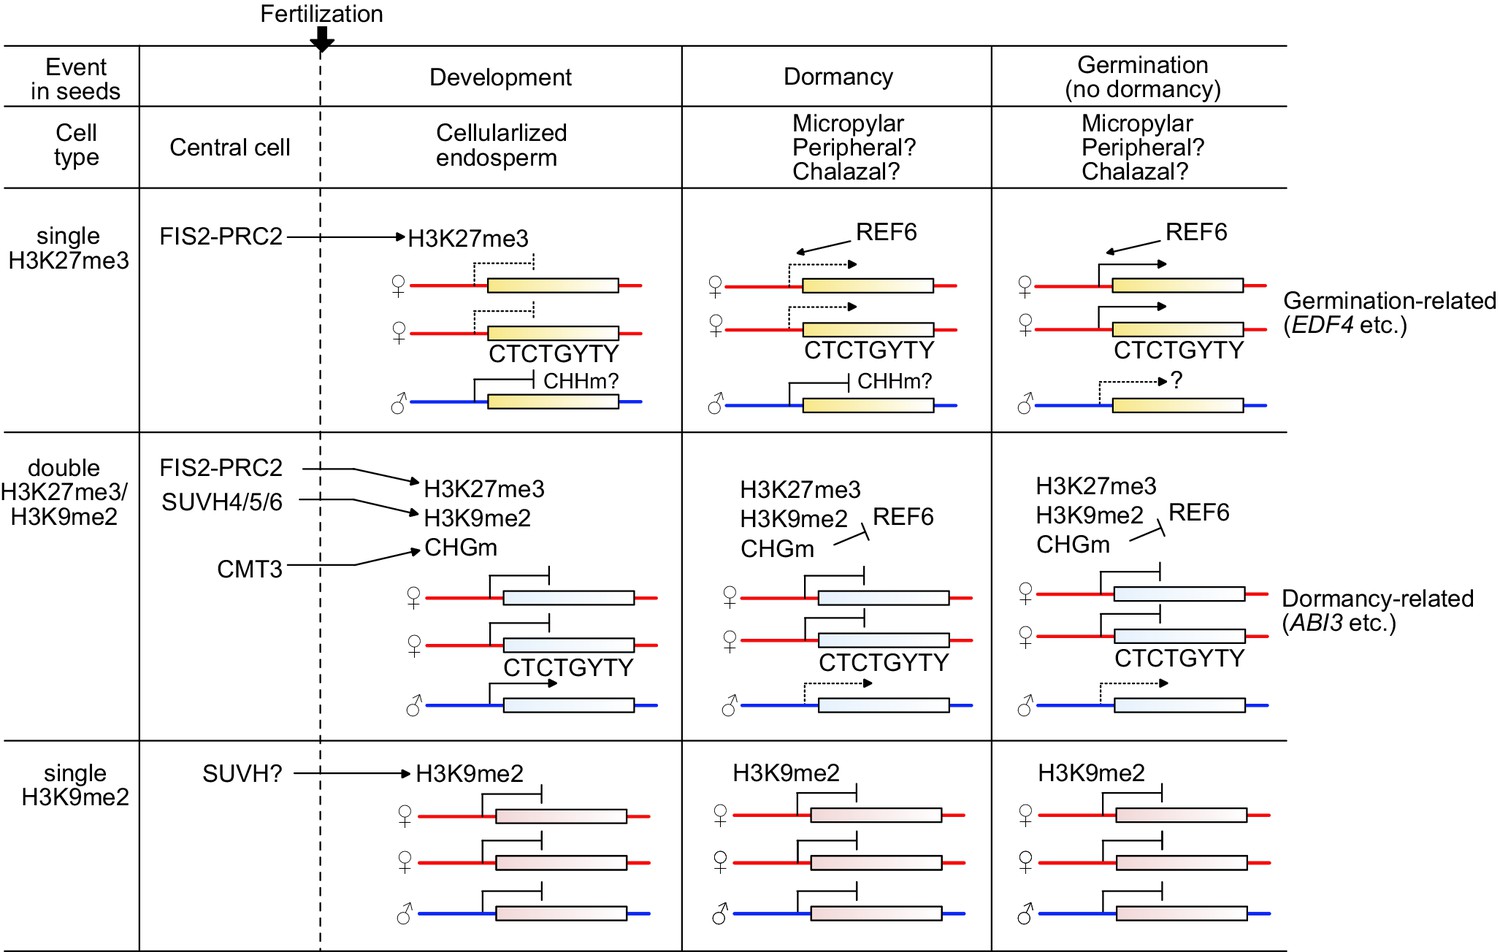
Model depicting the relationship between epigenetic patterns in the endosperm during seed development and gene regulatory mechanisms in the endosperm during seed germination.
The FIS-PRC2 establishes H3K27me3 in the central cell on defined target genes. In the endosperm, the maternal alleles remain repressed, but germination-related genes (e.g. EDF4) become targeted and activated before or during germination by the action of REF6. CHHm seems to play a role in silencing of the paternal alleles, but this requires further validation. The maternally biased expression pattern of genes with single H3K27me3 in dormant seeds are turned into biallelic expression in non-dormant seeds. The FIS-PRC2 and/or H3K27me3 can recruit H3K9me2 and CHG methylation (CHGm) to dormancy-related genes. SUVH4/5/6 and CMT3 establish H3K9me2 and CHGm on genes with H3K27me3 (e.g. ABI3), respectively. The presence of triple repressive marks H3K27me3/H3K9me2/CHGm on CTCTGYTY REF6-binding sites prevents REF6 targeting, causing stable repression of the maternal alleles of dormancy-related genes. Paternally expressed genes (PEGs) are enriched among the genes with triple repressive marks. Based on the limited effect of the suvh456 mutant on the expression of genes with single H3K9me2, other SUVH proteins than SUVH4/5/6 possibly suppress genes through mediating single H3K9me2.
Additional files
-
Supplementary file 1
Primers used in this study.
- https://cdn.elifesciences.org/articles/64593/elife-64593-supp1-v2.docx
-
Transparent reporting form
- https://cdn.elifesciences.org/articles/64593/elife-64593-transrepform1-v2.docx
Download links
A two-part list of links to download the article, or parts of the article, in various formats.
Downloads (link to download the article as PDF)
Open citations (links to open the citations from this article in various online reference manager services)
Cite this article (links to download the citations from this article in formats compatible with various reference manager tools)
Combinations of maternal-specific repressive epigenetic marks in the endosperm control seed dormancy
eLife 10:e64593.
https://doi.org/10.7554/eLife.64593


