Genomic epidemiology of COVID-19 in care homes in the east of England
- Cambridge University Hospitals NHS Foundation Trust, Departments of Infectious Diseases and Microbiology, United Kingdom
- University of Cambridge, Department of Medicine, United Kingdom
- Wellcome Sanger Institute, United Kingdom
- Cambridgeshire County Council, United Kingdom
- Public Health England, United Kingdom
- University of Cambridge, Department of Pathology, Division of Virology, United Kingdom
- Public Health England Clinical Microbiology and Public Health Laboratory, United Kingdom
- The Francis Crick Institute, United Kingdom
- Department of Haematology, Hammersmith Hospital, Imperial College Healthcare NHS Trust, United Kingdom
Figures
Figure 1 with 3 supplements
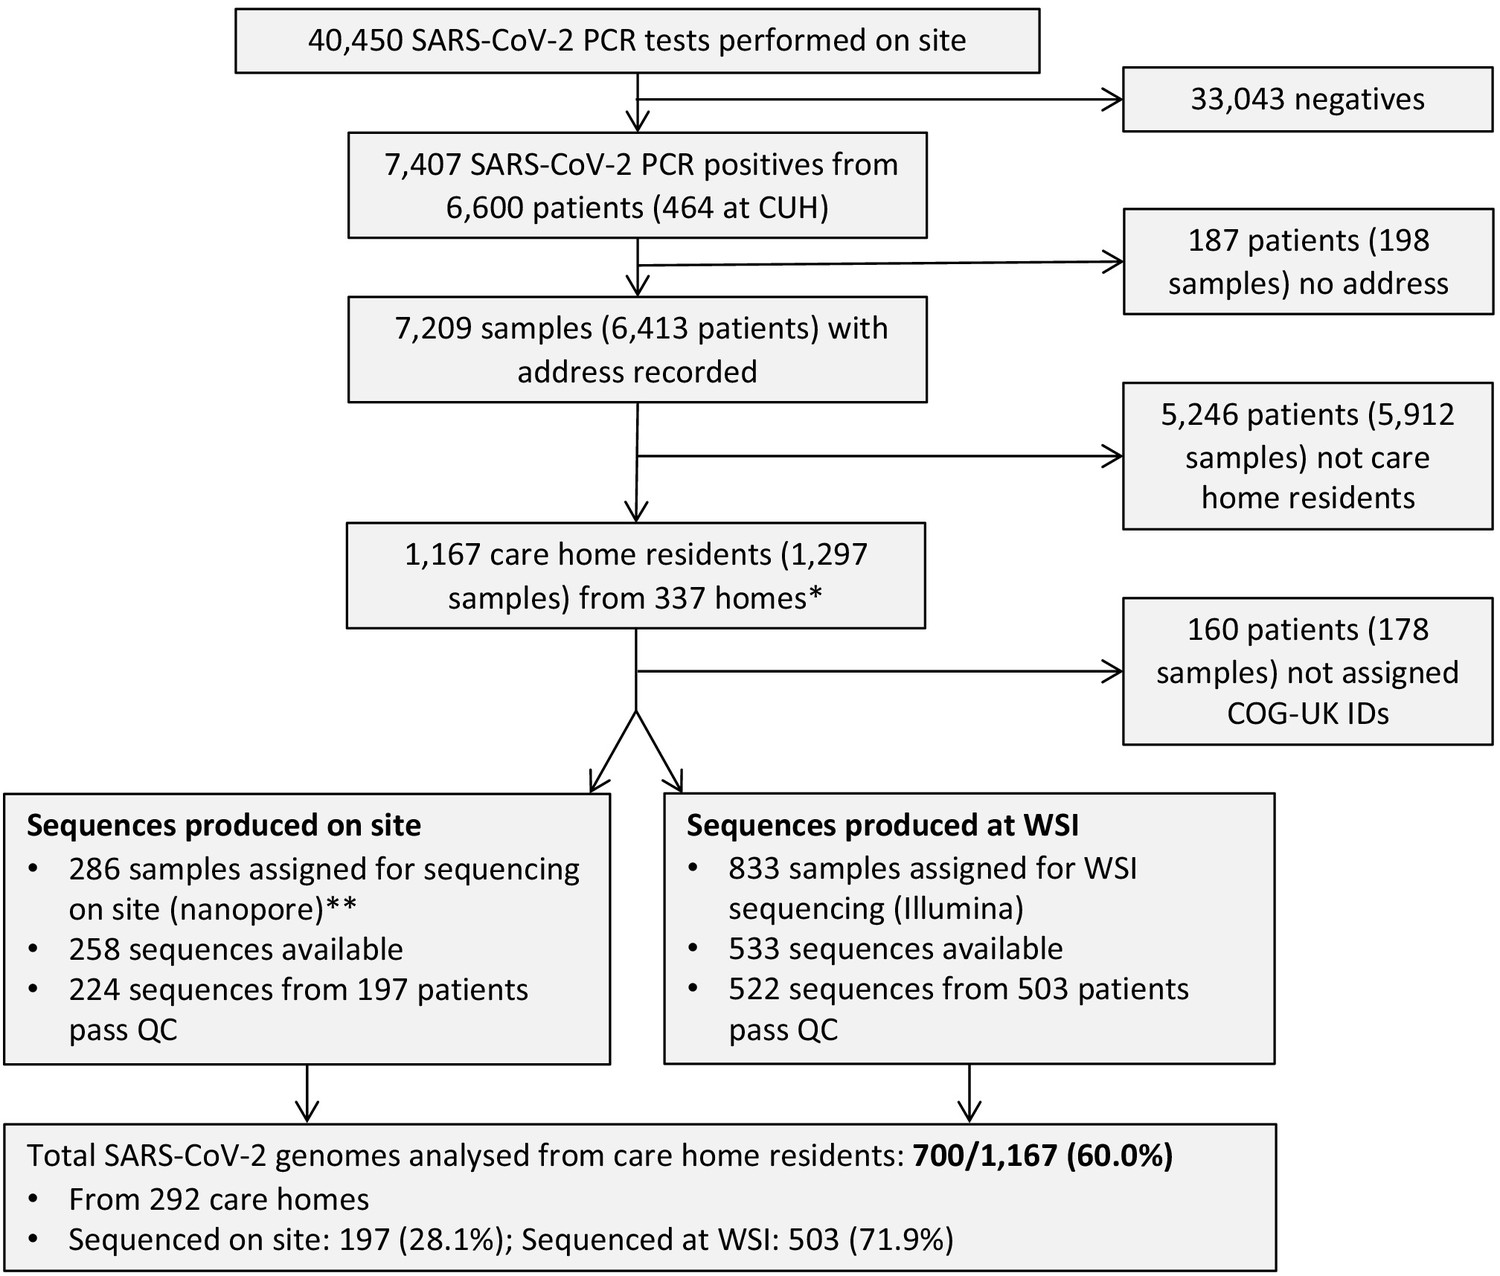
Study flow diagram Out of 6600 patients testing positive in the Cambridge Microbiology Public Health Laboratory (CMPHL) during the study period, 1167 were identified as being care home residents from 337 care homes.
(The methodology for assigning care home status is described in main text and Figure 1—figure supplement 1). Out of 1297 samples from 1167 care home residents, 286 samples were assigned for nanopore sequencing on site and 833 samples for sequencing at the Wellcome Sanger Institute (WSI). Of these, 258 and 533 sequences were available and downloaded from the MRC-CLIMB server at the time of running the analysis, respectively. Of these available genomes, 224 and 522 passed sequencing quality control thresholds (described in Materials and methods), respectively. This yielded the final analysis set of 700 high-coverage genomes from care home residents (representing 292 care homes): 197 genomes sequenced on site by nanopore and 503 sequences at WSI by Illumina. * 193 care homes were registered with the CQC as being residential homes without nursing care, referred to as ‘residential homes’ in main text, and 144 had nursing care available, referred to as ‘nursing homes’. ** Samples were selected for nanopore sequencing on site if they were inpatients or healthcare workers at Cambridge University Hospitals NHS Foundation Trust (CUH), where we prioritised rapid turnaround time to investigate hospital-acquired infections, plus a randomised selection of other East of England samples to provide broader genomic context to the CUH cases. The remaining samples not selected for nanopore sequencing on site, where available, were sent to WSI for sequencing.
Figure 1—figure supplement 1
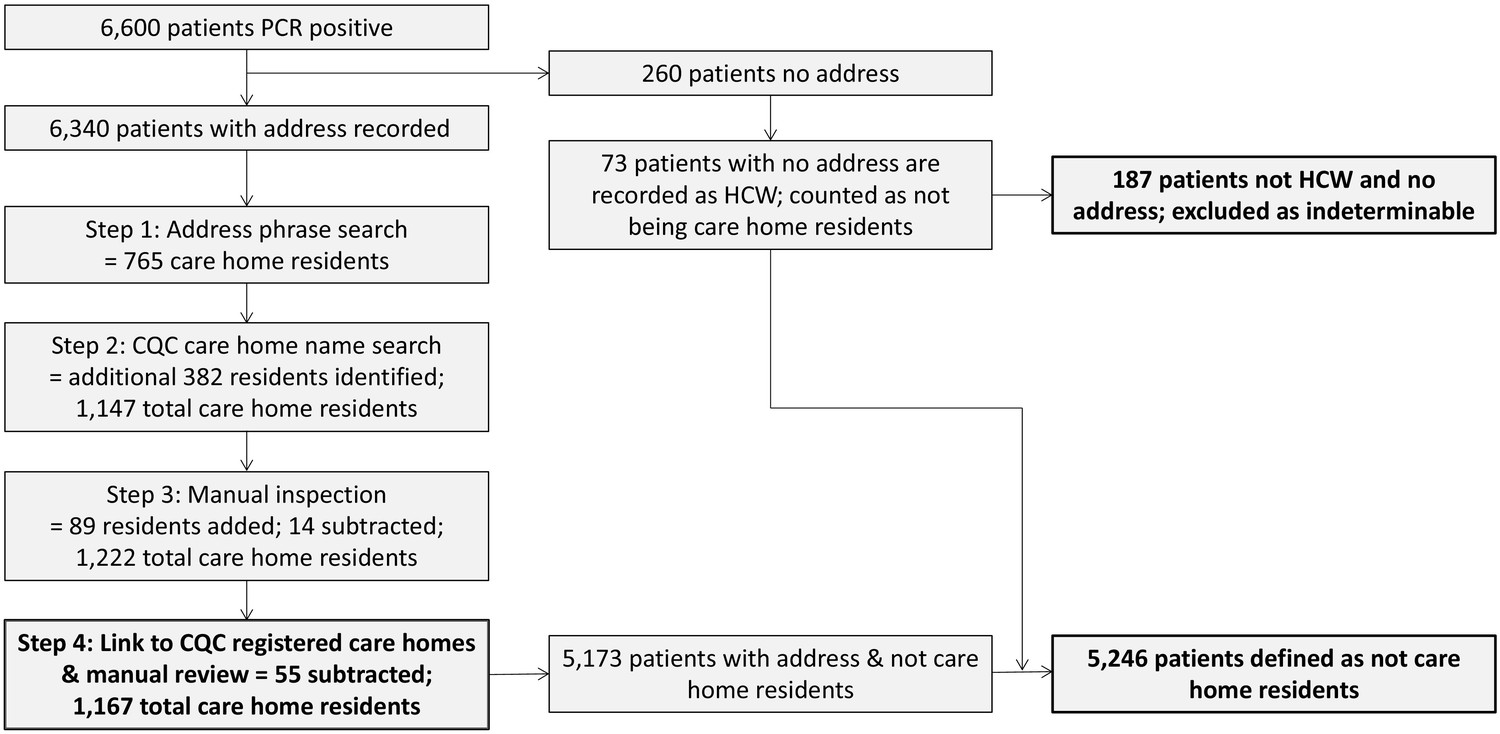
Flow diagram for identifying care homes from Cambridge-COGUK metadata Steps for identifying care home residents (further details in Materials and methods).
First, the address field in the patient electronic healthcare records was searched for matching terms indicating a care home (e.g. ‘care home’, ‘nursing home’, etc). Second, the patient address field was searched for matching terms from a list of care home names registered to the Care Quality Commission (CQC). The resulting list was manually inspected and every care home included in the study was linked to a registered CQC care home. CQC coding of whether the care home had nursing care available was used (referred to as ‘nursing homes’ if nursing care was available and ‘residential homes’ if not). If the address information was incomplete (no postcode and/or no address line) then the case was excluded as impossible to determine whether or not the patient was from a care home, unless the person was known to be a healthcare worker (HCW), in which case it was assumed they were not a care home resident. This process yielded the final result of 1167 care home residents from 337 care homes; 5246 individuals that were not care home residents, and 187 individuals that were indeterminable.
Figure 1—figure supplement 2
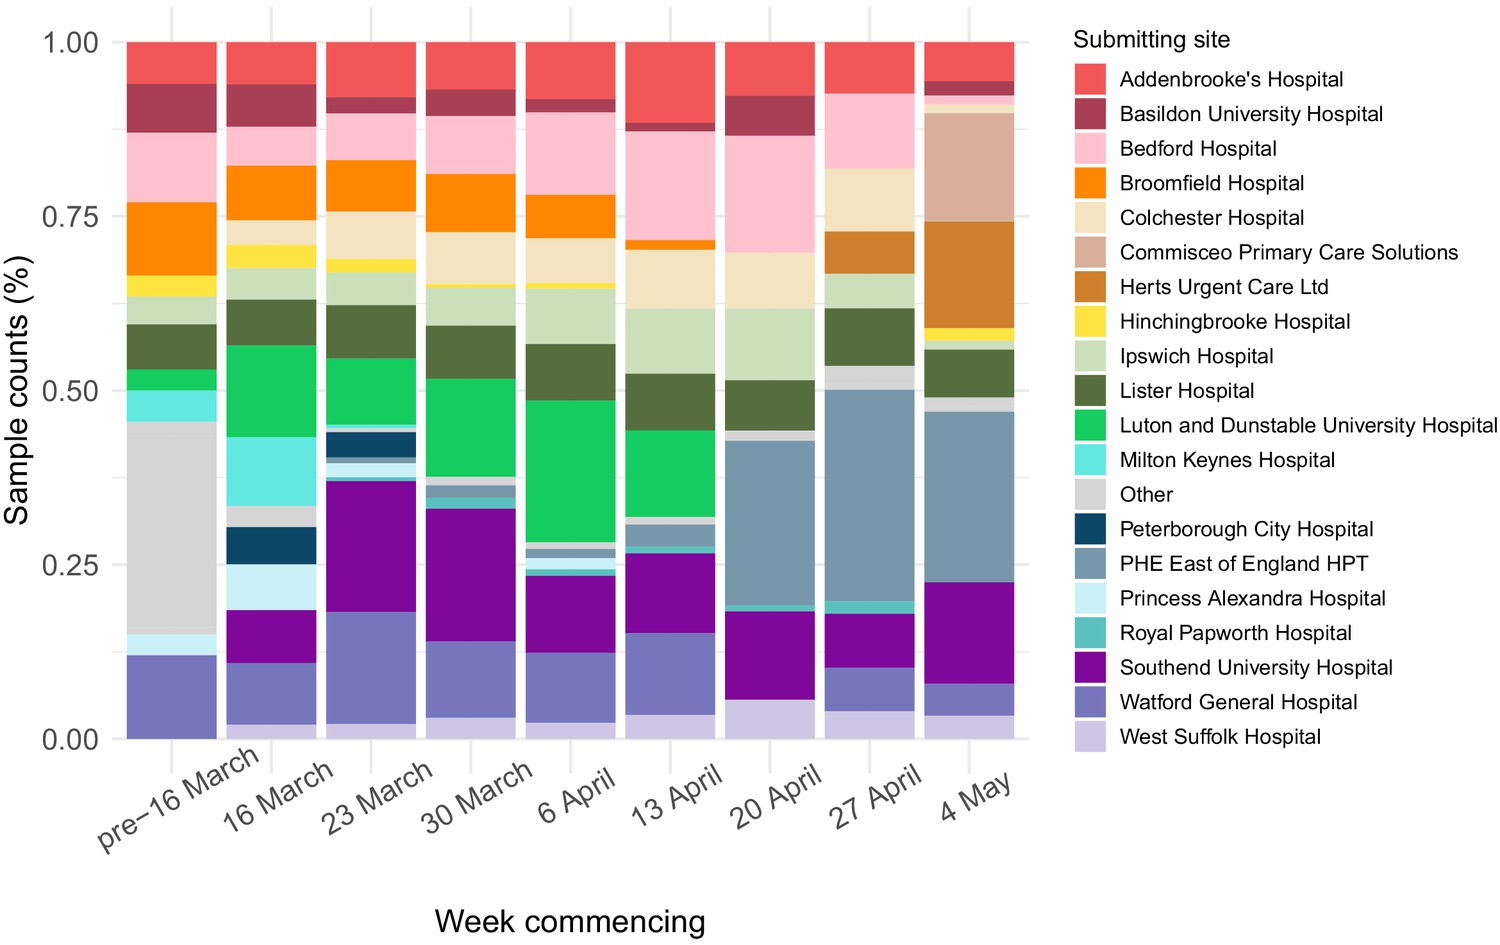
Breakdown of main organisations submitting samples to Cambridge PHE Laboratory over study period per week.
Only showing sites that submitted samples from >50 people with positive test results over study period, otherwise counted as ‘Other’. To maintain patient anonymity, per time interval only showing sites that submitted samples from >5 people with positive test results (otherwise counted as ‘Other’). Data prior to 16 March is amalgamated due to low sample numbers. Note that over the course of the study, some sites changed testing provider from CMPHL as further testing sites became available around the region. This explains some of the variation in the relative proportion of cases submitted from each site. The numbers reported here do not necessarily reflect total case numbers for each hospital or submitting organisation, as tests may have been performed elsewhere or metadata not collected in this study; the numbers are included purely to indicate where the samples included in this study originated from.
Figure 1—figure supplement 3
UK care home testing policy timeline.
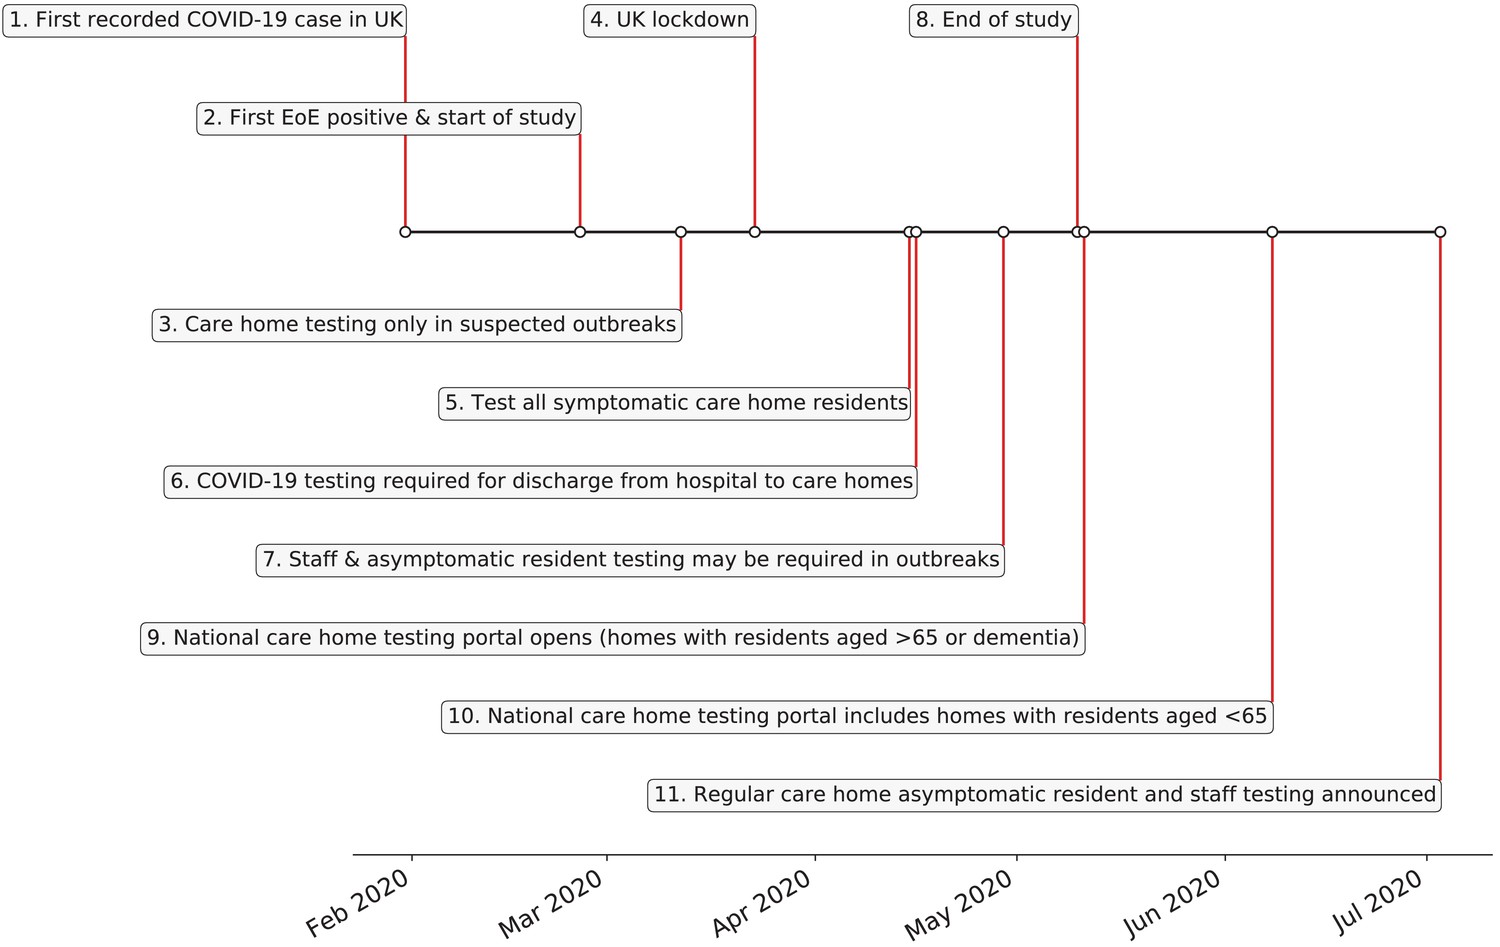
(1) 31st January – first recorded case of covid-19 in the UK. (2) 26th February - first case of COVID-19 in the East of England; start date of this study. (3) 12th March – individuals in the community advised to self-isolate for 7 days, without testing. Testing only offered to care homes in the context of a suspected outbreak. (4) 23rd March - UK lockdown officially begins. (5) 15th April – action plan announced to test all symptomatic residents in care homes, plus testing of all residents prior to admission to care home from hospital. (6) 29th April – testing guidance amended to reflect that asymptomatic as well symptomatic residents and staff in care homes may need to be tested as part of an outbreak. (7) Policy for COVID-19 testing prior to discharge to care homes instigated 16th April: https://www.gov.uk/government/publications/coronavirus-covid-19-adult-social-care-action-plan/covid-19-our-action-plan-for-adult-social-care. (8) 10th May - end date of this study. (9) 11th May – national whole care home testing portal (offering a single test to all staff and residents) goes live for care homes with residents aged 65 years and over or dementia patients. (10) 8th June – national whole care home testing portal extends eligibility to care homes with residents aged under 65 years. (11) 3rd July – announcement that regular asymptomatic testing for care home staff and residents will be rolled out through the national whole care home testing portal in July for homes with residents aged over 65 years or dementia patients. References: Public Health England, 2020b; The Health Foundation, 2020.
Figure 2 with 1 supplement
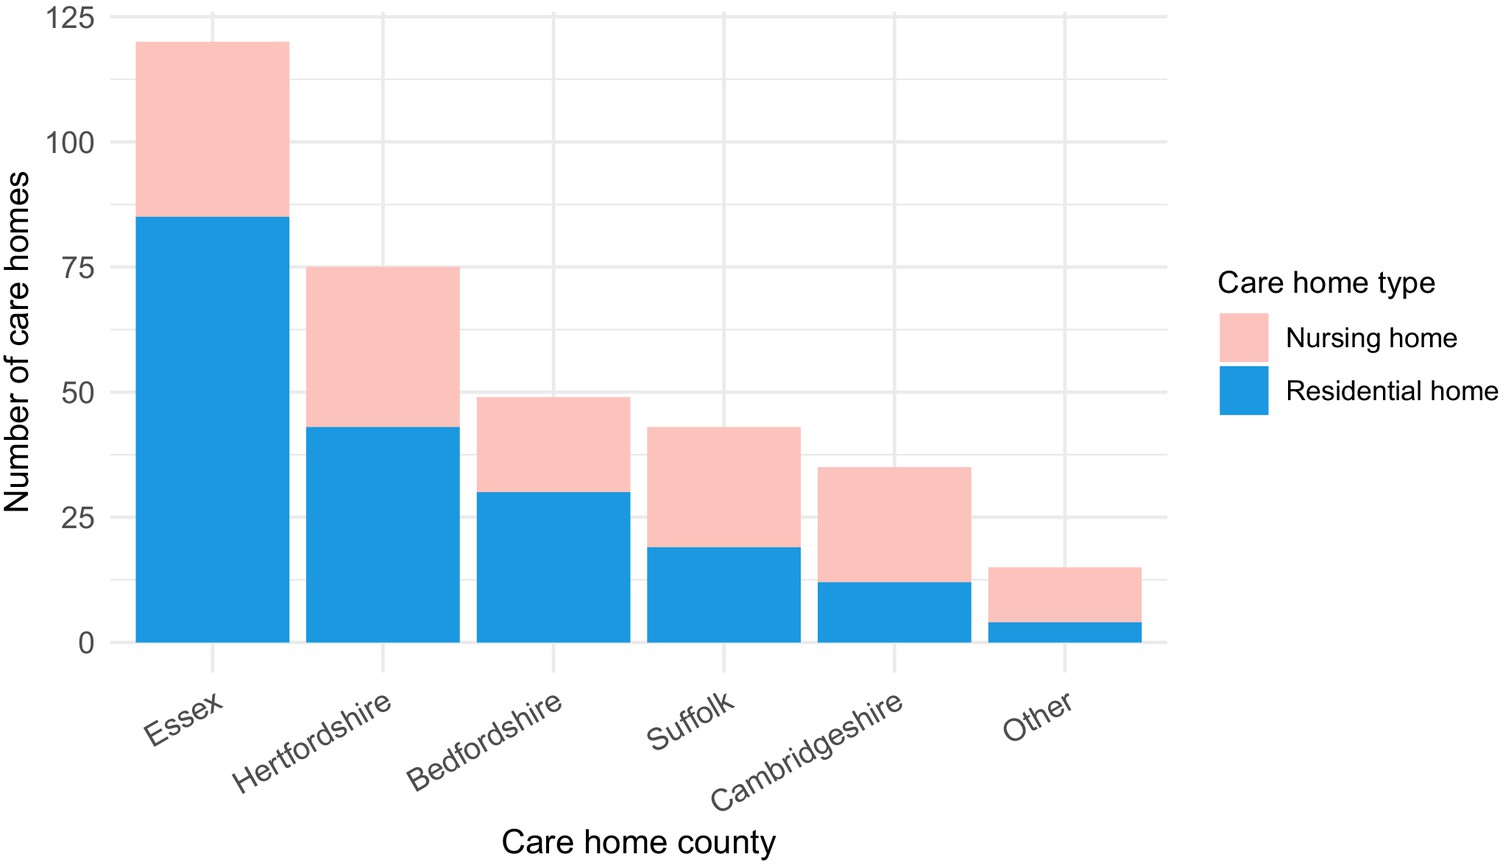
Care home locations by county, showing nursing, and residential homes.
Only showing the five counties with the largest number of cases (all >25) to preserve patient anonymity. Definitions of ‘nursing home’ and ‘residential home’ are based on Care Quality Commission (CQC) information on whether nursing care is or is not present. If no nursing care is available the home is classified as a residential home. If the care home offers nursing care (including if it can offer both nursing and residential care) then the home is classified as a nursing home.
Figure 2—figure supplement 1
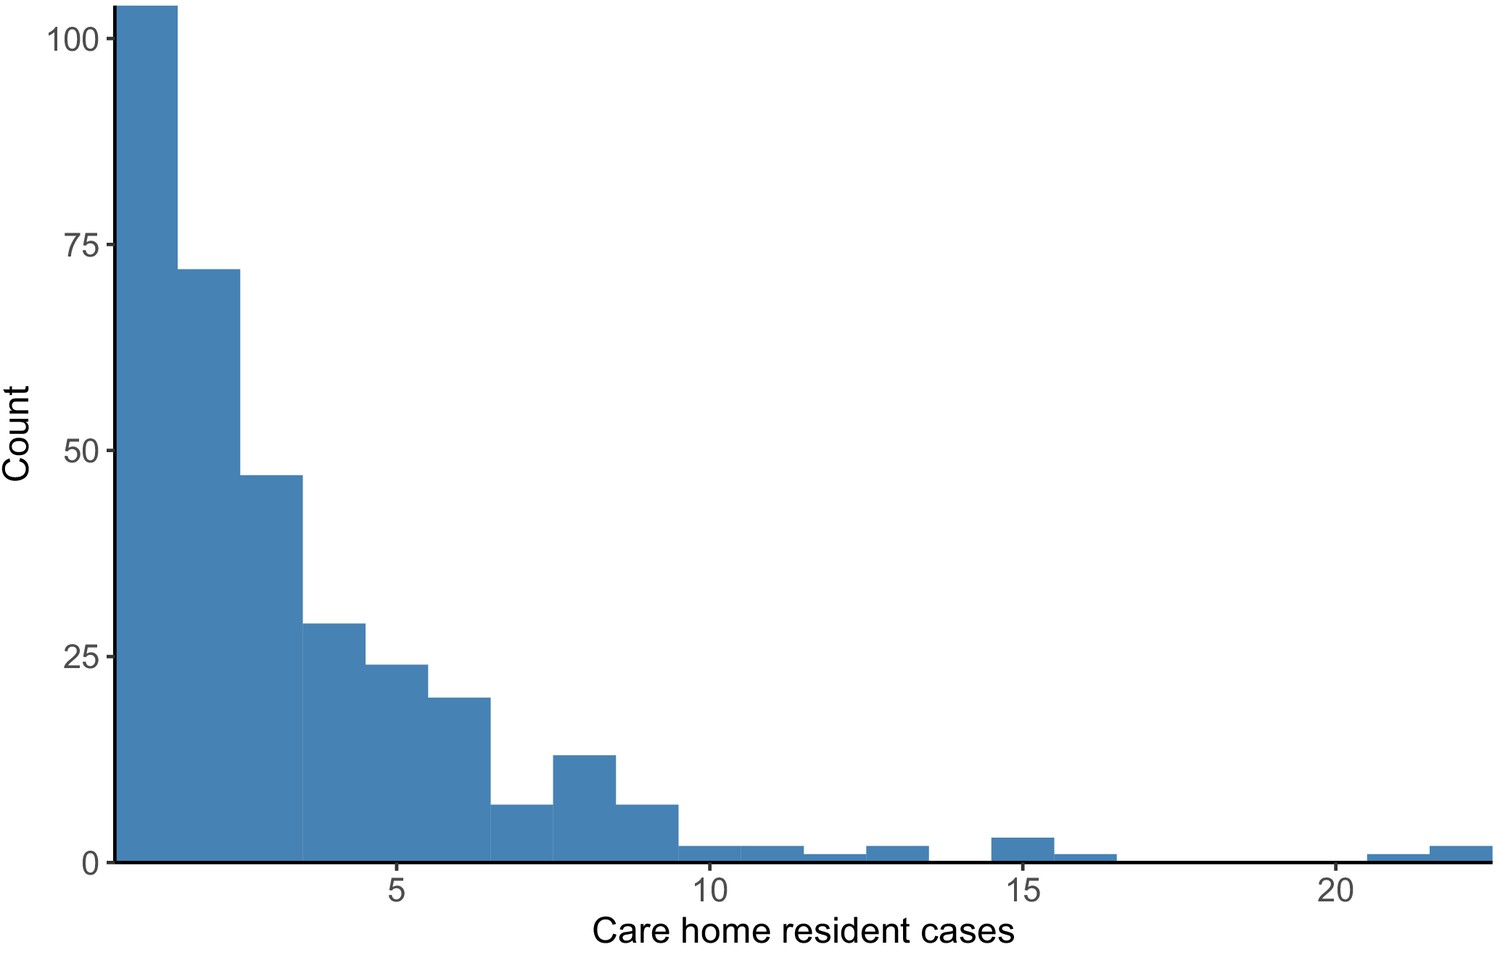
Distribution of cases per care home.
The number of positive cases per care home was highly skewed, such that a relatively small number of care homes contributed a large proportion of cases (right-hand side of the plot). Plot produced with R package ggplot2 using geom_histogram with binwidth = 1.
Figure 3 with 1 supplement
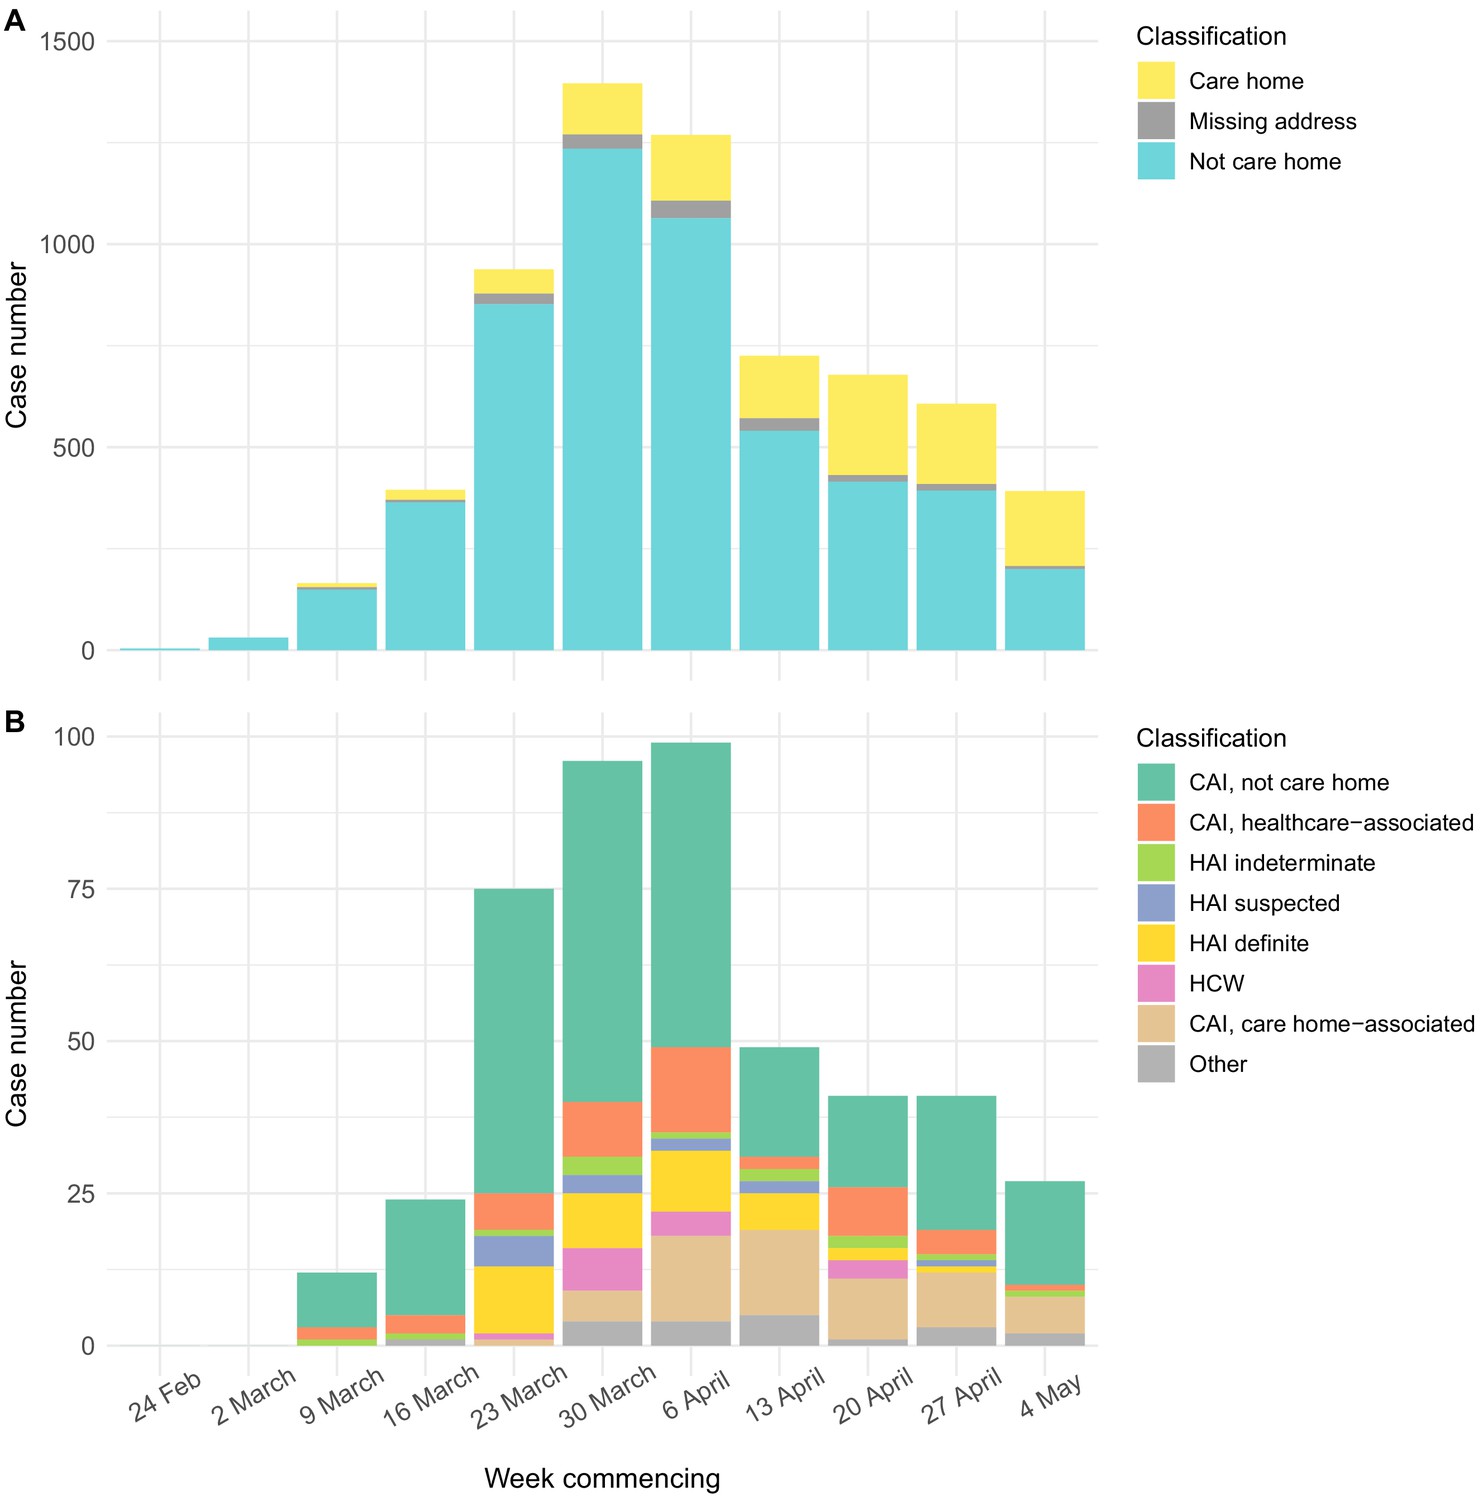
Epidemic curves for EoE and CUH showing care home residents.
Number of positive cases per week over the study period for different infection sources, for all samples tested from EoE at the Cambridge PHE laboratory (A), or those tested at CUH acute medical services (B). Peak of the epidemic for samples tested at the Cambridge PHE laboratory and CUH acute medical services were weeks commencing 30th March and 6th April, respectively. UK lockdown started 23rd March 2020. In both settings, a prolonged right-hand ‘tail’ was observed as case numbers gradually fell. The relative proportion of cases admitted from care homes increased over this period for both sample sets, while the contribution of general community cases fell more quickly. However, interpreting these trends is confounded by the changing profile of COVID-19 testing nationally and regionally. If the patient address was missing, and they were not a HCW, then the care home status was undetermined. CAI = Community Acquired Infection; EoE = East of England; HAI = Hospital Acquired Infection; HCW = Healthcare Worker; ‘Other’ mainly comprise inpatient transfers from other hospitals to CUH for which metadata was lacking to determine the infection category. CAI was considered ‘healthcare-associated’ if there had been healthcare contact within 14 days of first positive swab. The three categories of HAI were defined based on the difference in days between admission and first positive swab, reflecting increasing likelihood of hospital acquisition: indeterminate = 3–6 days; suspected 7–14 days; definite >14 days (as used in Meredith et al., 2020).
Figure 3—figure supplement 1
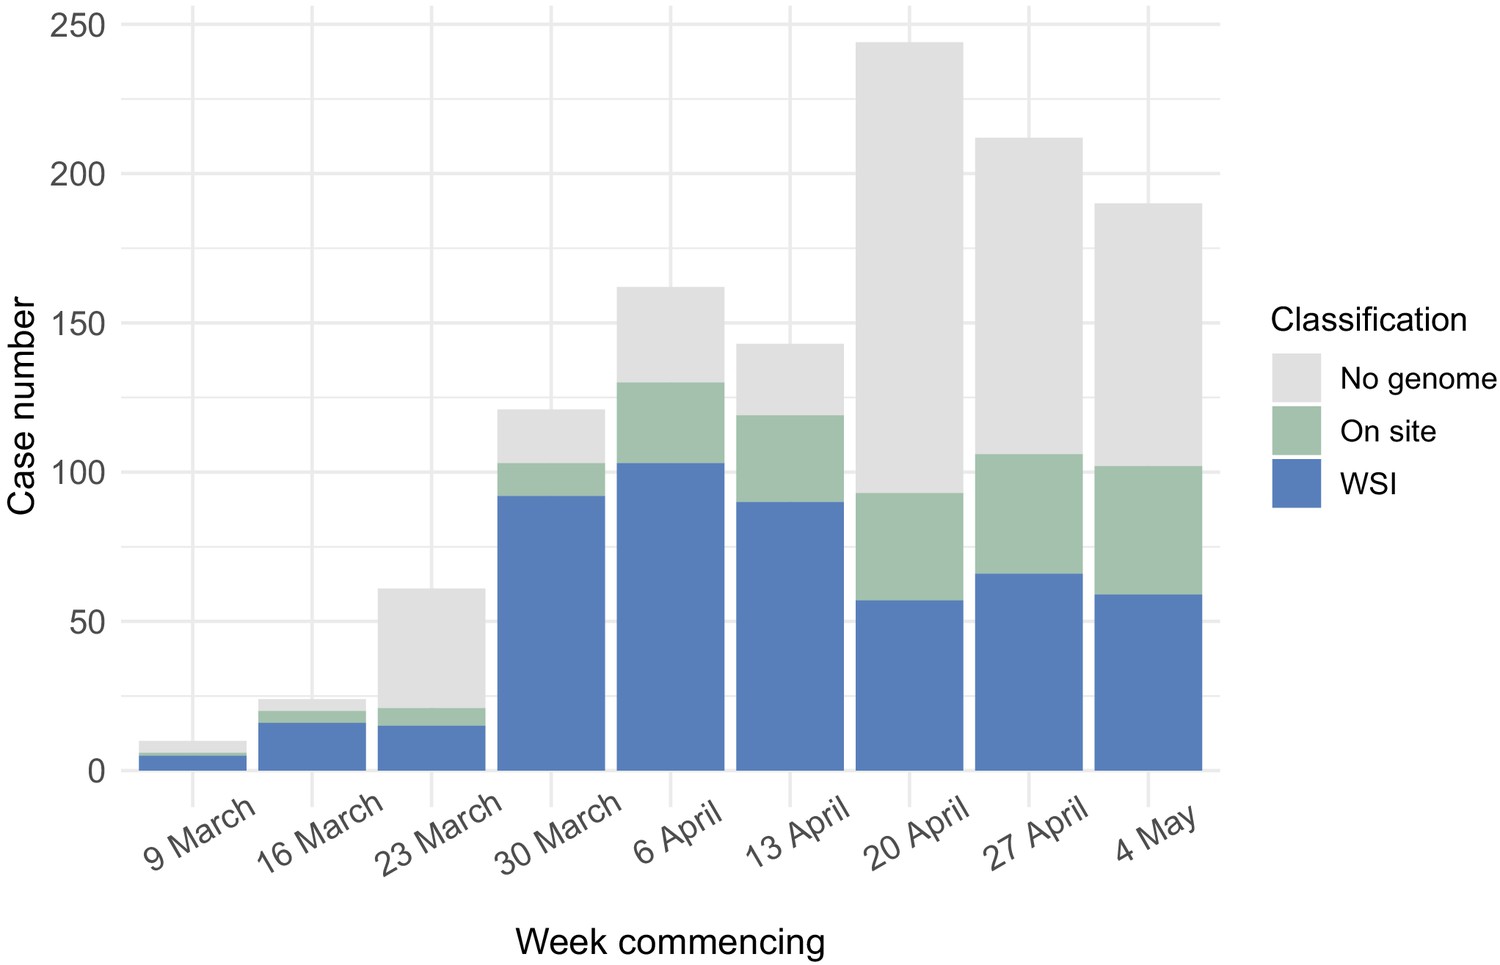
Care home residents per week showing genome sequencing site.
Plot shows total care home residents testing positive per week over the study period, showing number of care home residents with genomes included in the study broken down by sequencing location (on site in the Department of Pathology, Division of Virology or at the Wellcome Sanger Institute).
Figure 4 with 1 supplement
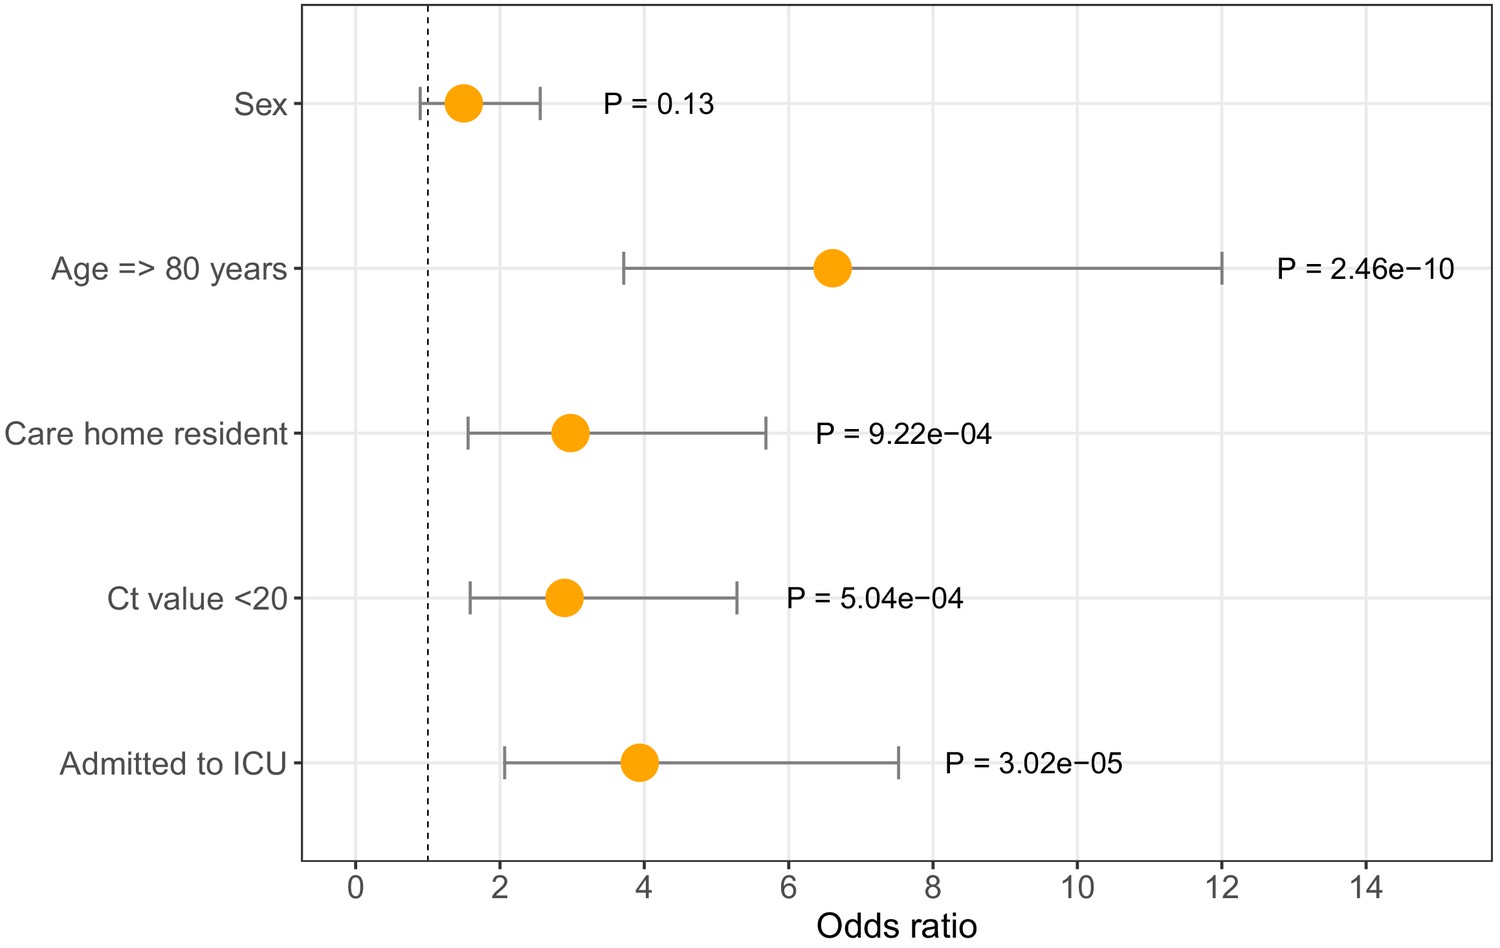
Odds ratios for mortality at 30 days.
Logistic regression analysis showing odds of death at 30 days (with 95% confidence intervals) for five available metadata variables: patient sex, age (here categorised as >80 years), whether they were a care home resident, the diagnostic Ct value (here categorised as <20), and whether they were admitted to the intensive care unit. Overall there were 116 deaths within 30 days of diagnosis (out of 464 CUH patients). ICU = intensive care unit. Ct = Cycle threshold for diagnostic PCR.
Figure 4—figure supplement 1
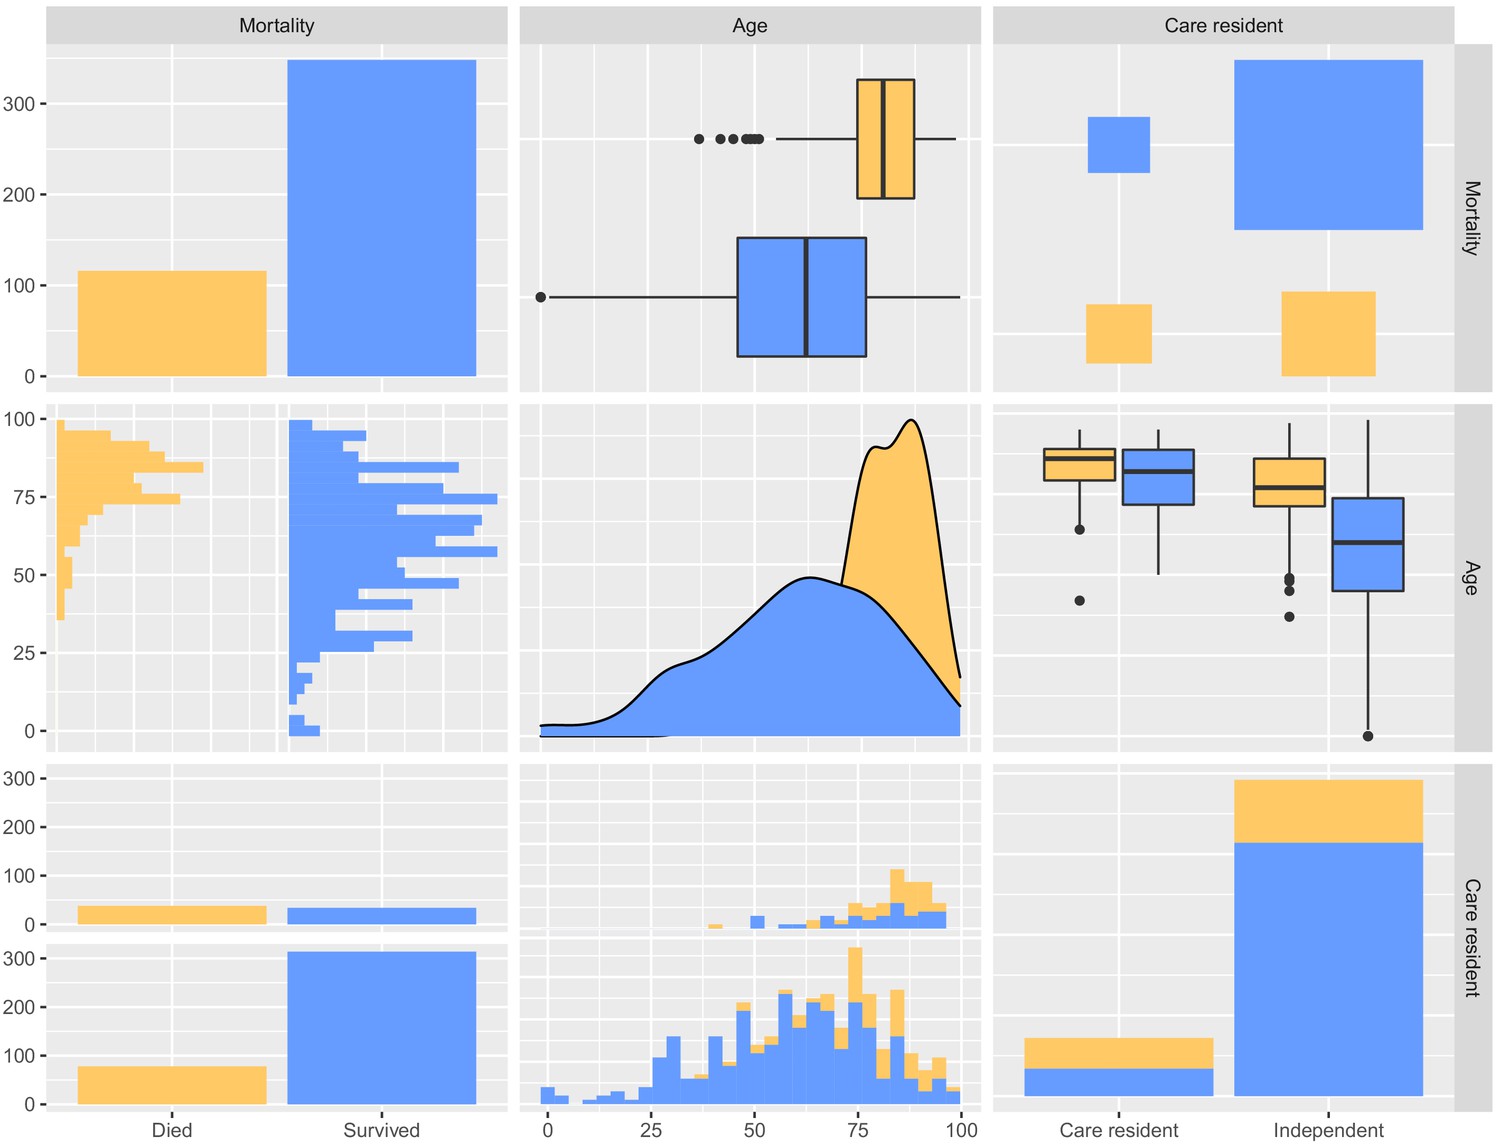
Pairwise comparisons of mortality at 30 days, age and whether the person was a care home resident.
Each plot compares two of these three variables to visualise cross-associations, and the data are divided in each case into individuals that died (yellow) or survived (blue). The plot was produced using GGally::ggpairs().
Figure 5 with 2 supplements
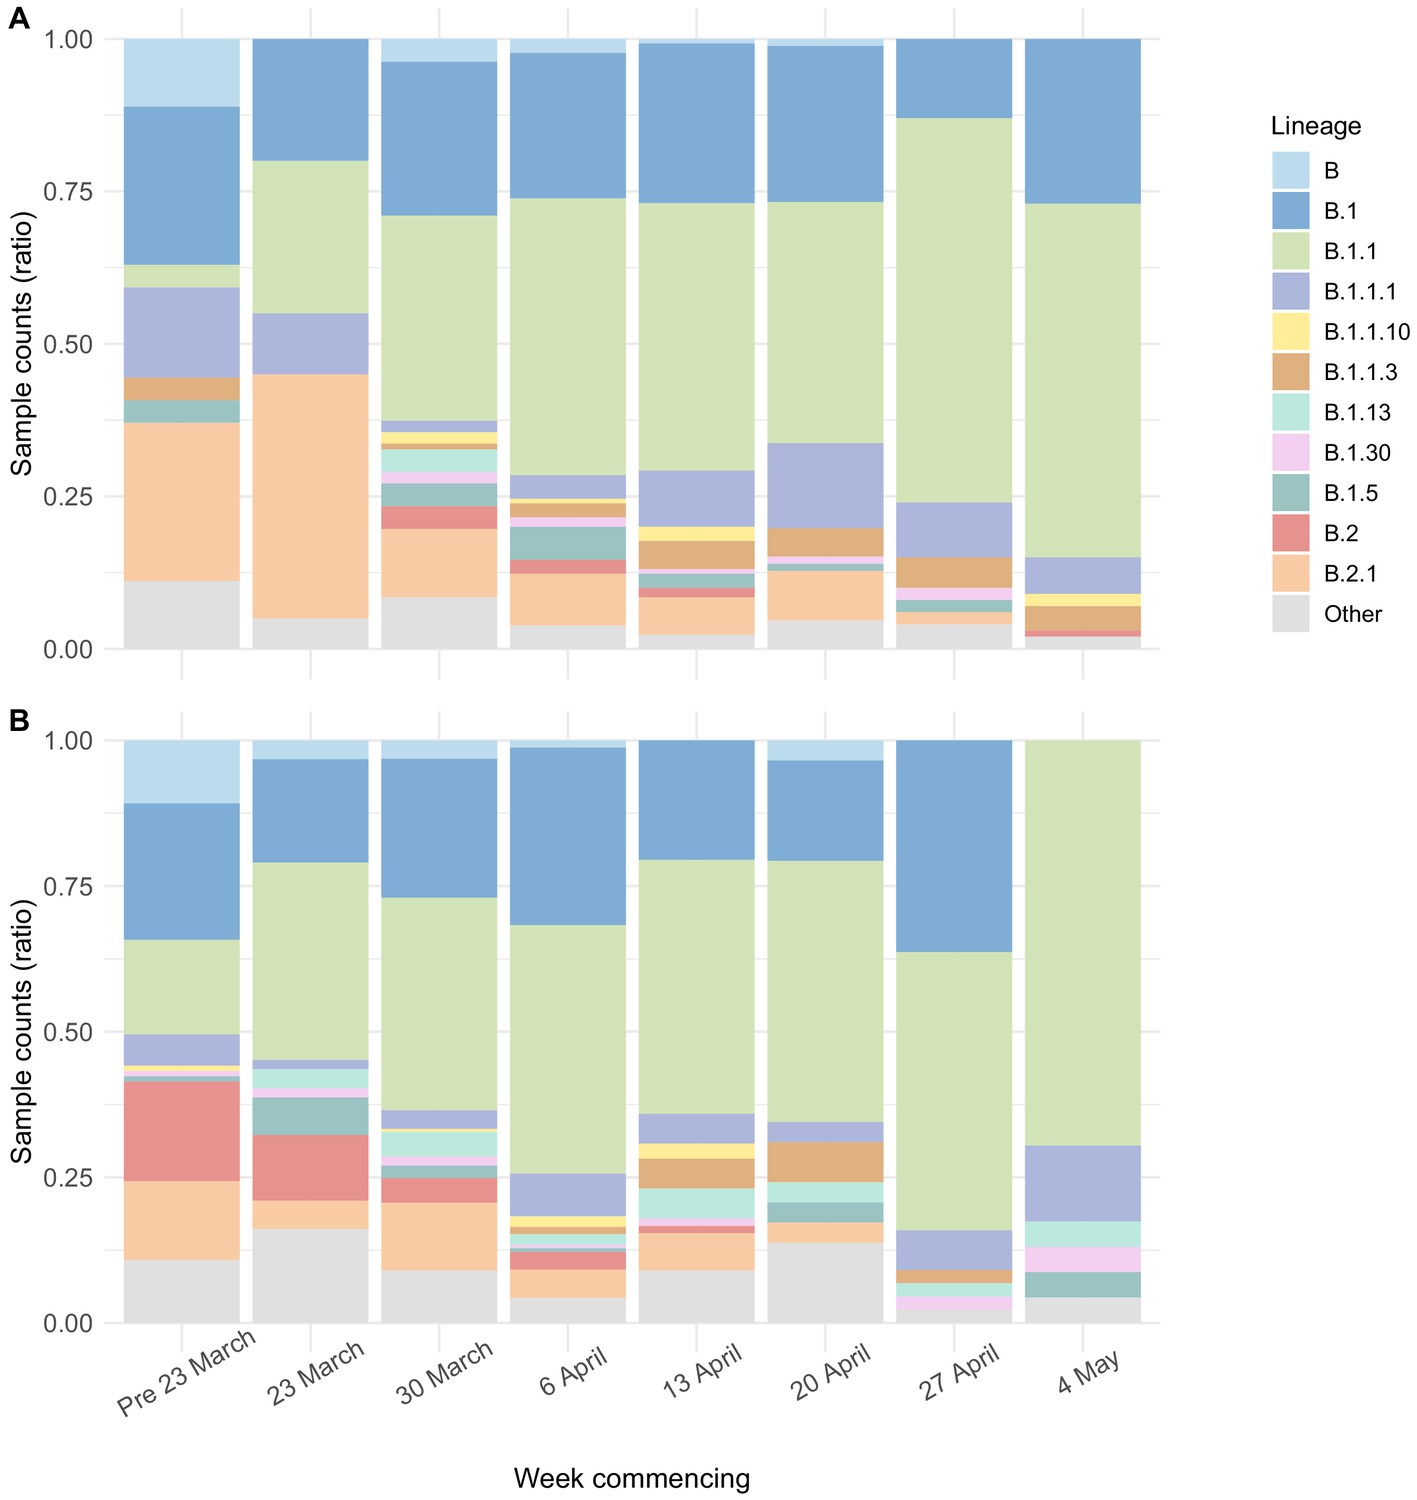
Viral lineage compositions in care home and non-care home samples.
Plots showing the ratios of SARS-CoV-2 viral lineages for 700 care home resident genomes (A) and a randomly selected subset of 700 non-care home residents (B). The proportion of lineage B.1.1 increased over the study period in both care home and non-care home residents. Lineages defined using pangolin. Data also presented in Table 5.
Figure 5—figure supplement 1
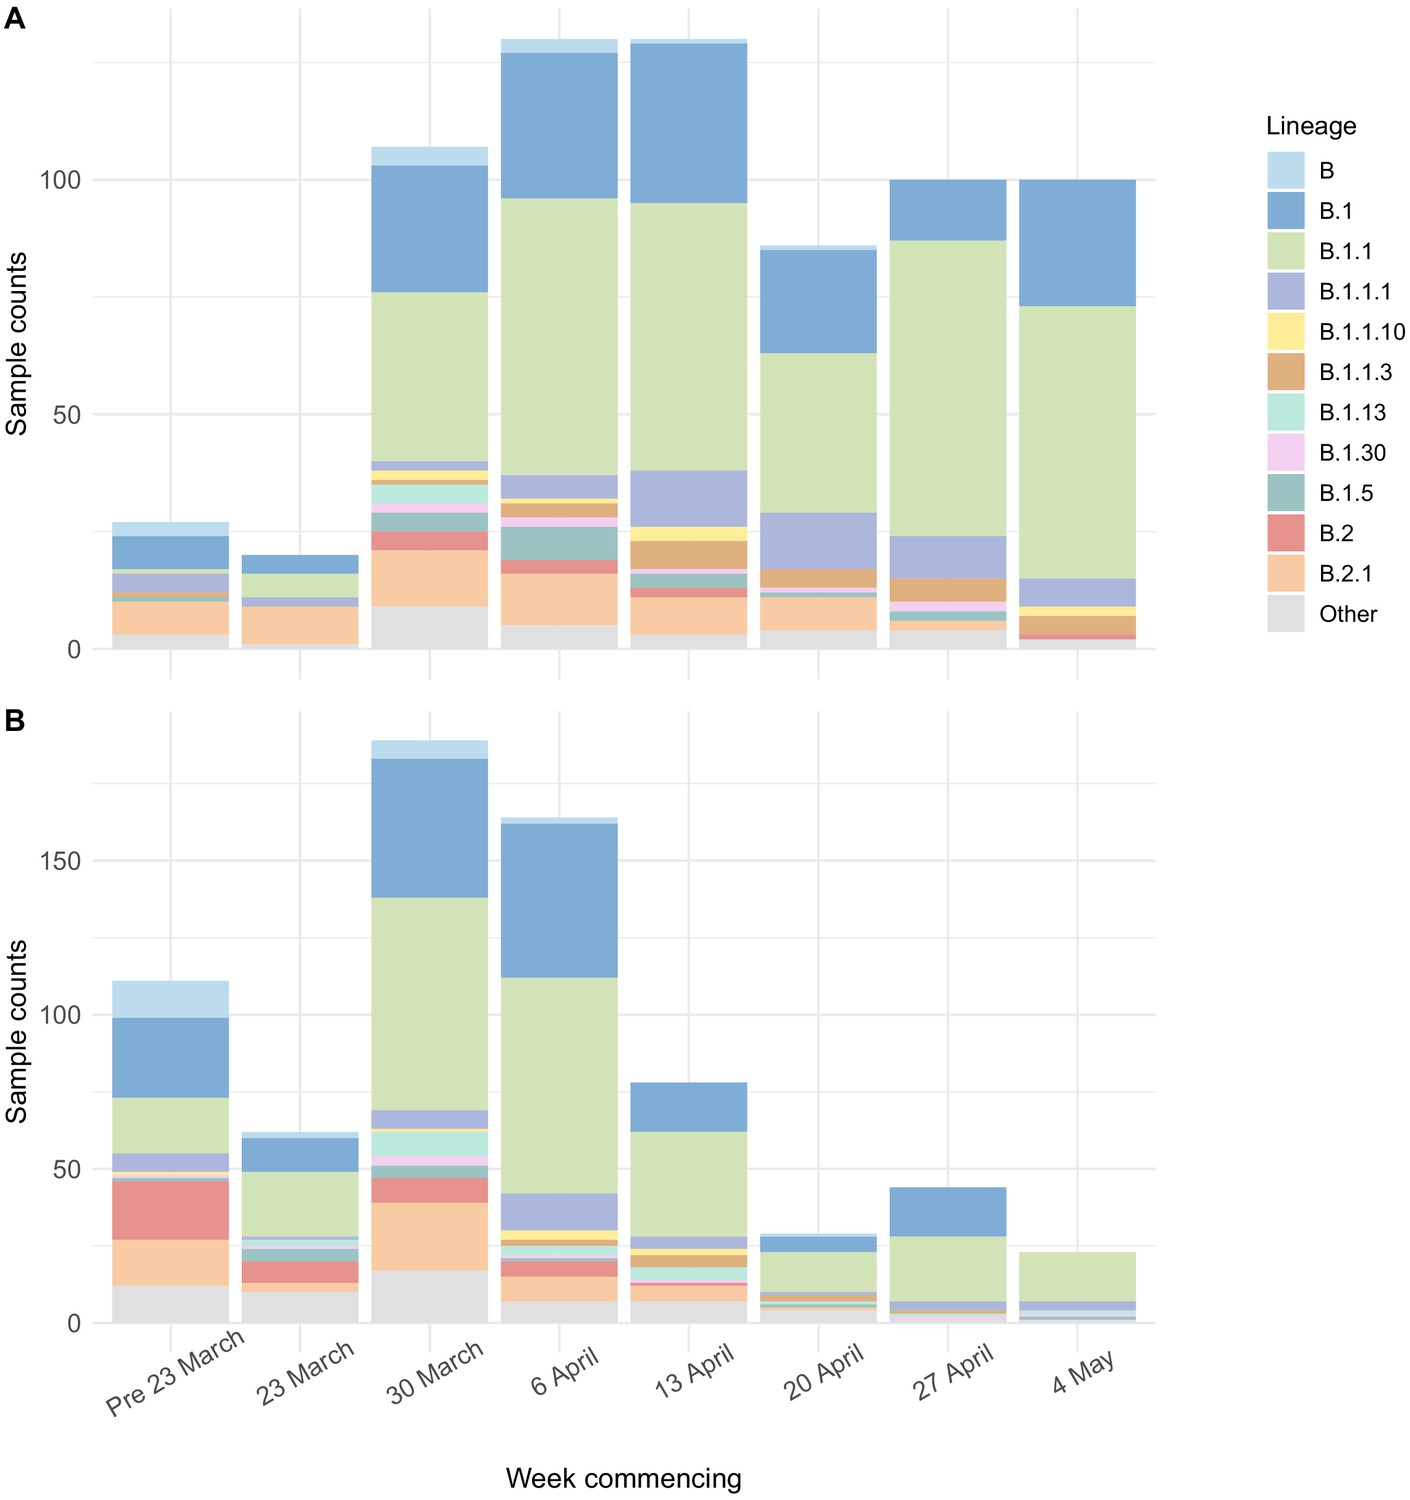
Viral lineage compositions in care home and non-care home samples by count.
Plots showing the counts of SARS-CoV-2 viral lineages for 700 care home resident genomes (A) and a randomly selected subset of 700 non-care home residents (B). Lineages defined using pangolin. Data also presented in Table 5.
Figure 5—figure supplement 2

Distribution of pairwise SNP differences between care home samples.
Pairwise SNP differences between the 700 care home residents (244,650 comparisons). There was a median of eight single nucleotide polymorphisms (SNPs) separating care home genomes (interquartile range, IQR 6–12, range 0–29), compared to 9 (IQR 5–13, range 0–28) for randomly selected non-care home samples (p=0.95, Wilcoxon rank sum test).
Figure 6 with 1 supplement
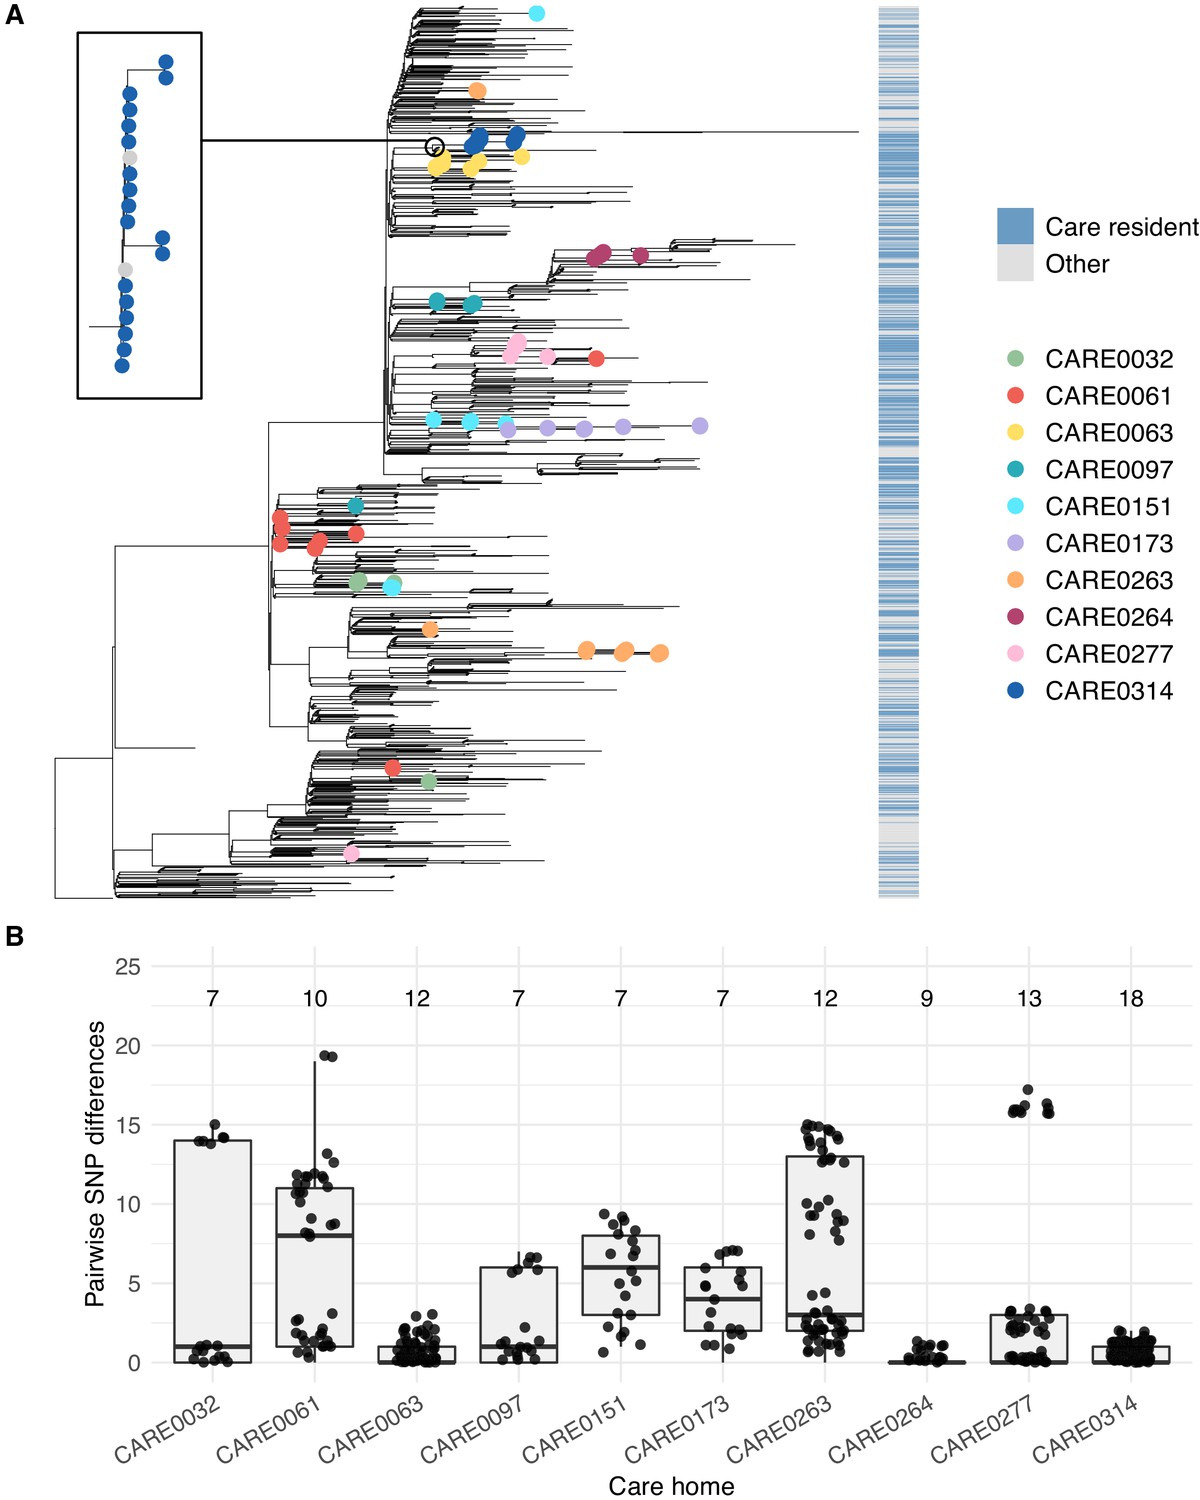
Care home clustering on viral phylogenetic tree and within-care home pairwise SNP differences.
(A) Phylogenetic tree of 1400 East of England SARS-CoV-2 genomes rooted on a sample from Wuhan, China, collected December 2019, including 700 care home residents and 700 randomly selected non-care home residents. The colour bar (right) indicates whether samples were from care home residents (blue) or non-care home residents (grey). Samples from the 10 care homes with the largest number of genomes are highlighted by coloured circles on branch tips. A magnified subtree of the branch containing all 18 samples from care home CARE0314 is shown to the left. These genomes were all either identical or differed by one SNP from the most common genome in this cluster. Two non-care home genomes are also present in this group. Across the dataset, viruses from care home residents and people not living in care homes are phylogenetically intermixed, consistent with viral transmission between these two settings. (B) Distributions of pairwise SNP differences for the 10 care homes with the largest number of genomes (same samples as highlighted in the branch tips of panel A). Numbers above each box indicate the number of genomes present from that care home. Among the ten care homes with the largest number of genomes, some clustered closely on the phylogenetic tree with low pairwise SNP differences (e.g. CARE0063, CARE0264, CARE0314); in contrast, some care homes were distributed across the tree with higher pairwise SNP differences (e.g. CARE0061, CARE0151, CARE0173, CARE0263). Clusters within each care home were defined using integrated genomic and temporal data using the transcluster algorithm and are shown in Figure 7.
Figure 6—figure supplement 1
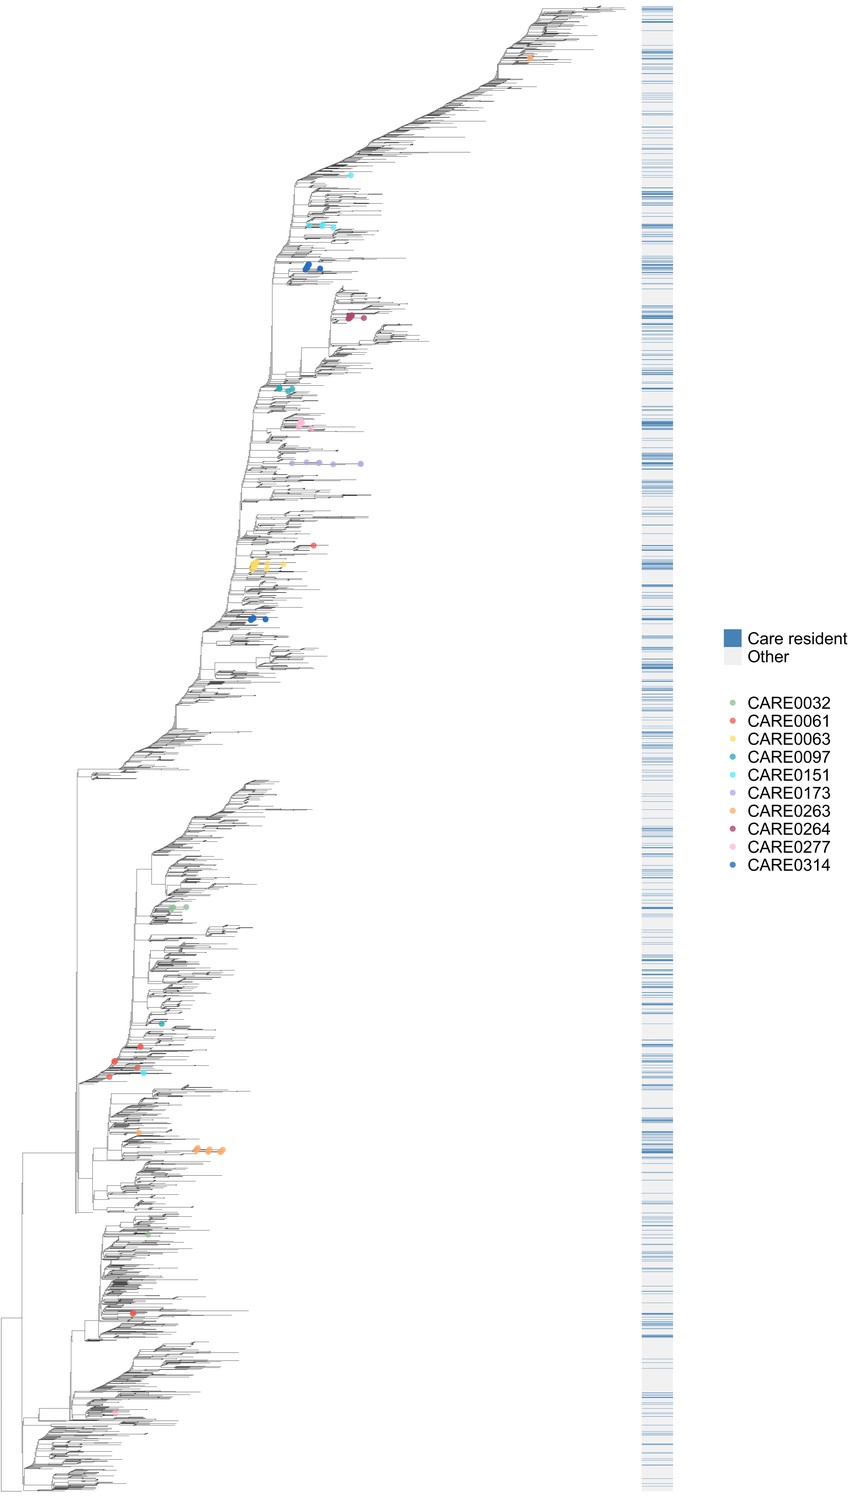
Phylogenetic tree of all available genomes highlighting care home and non-care home samples.
Of the 6600 individuals in the study, 1167 were identified as care home residents and 5246 were not care home residents (187 were undetermined). 700/1167 (60.0%) care home residents had genomes available that passed quality control (QC) filtering at time of analysis. Of 5246, 3745 (71.4%) non-care home residents had genomes available and passing the same QC filtering at time of analysis, accessed from the COG-UK public database (https://www.cogconsortium.uk/data/). This tree comprises all 700 care home and 3745 non-care home genomes from the study (total 4445 samples), rooted on a 2019 genome from Wuhan, China. As with Figure 6, the colour bar (right) indicates whether samples were from care home residents (blue) or non-care home residents (grey). Samples from the ten care homes with the largest number of genomes are highlighted by coloured circles on branch tips. This supports the findings shown in Figure 6 using the randomly selected sub-sample of non-care home samples, (1) that care home genomes were phylogenetically intermixed with non-care home genomes (consistent with transmission between care homes and outside of care homes) and (2) that, using the 10 care homes with the largest number of samples as examples, some care homes were monophyletic (such as CARE0314) while others were polyphyletic (such as CARE0061). Even for polyphyletic care homes (implying multiple independent introductions of the virus among residents), the majority of samples were usually attributable to a single dominant cluster (described further in main text).
Figure 7 with 7 supplements
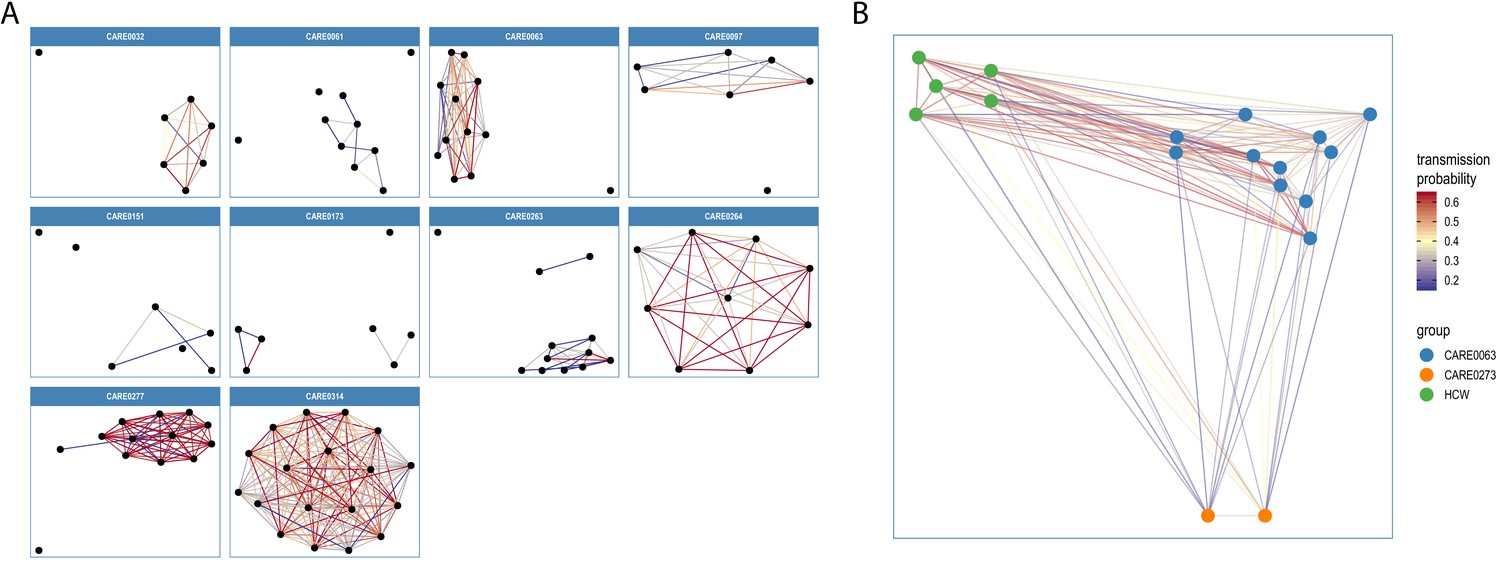
Visualisations of SARS-CoV-2 clusters among care home residents.
Transmission networks were produced using a derivative of the transcluster algorithm, which incorporates pairwise date and genetic differences to estimate the probability of cases being connected within a defined number of intermediate hosts. Clusters were defined using a probability threshold of >15% for cases being linked by <2 intermediate hosts (further details in Materials and methods). (A) Transmission clusters for the ten care homes with the largest number of care home residents with available genomes. Consistent with Figure 6, several of the 10 care homes with the largest number of genomes comprised single transmission clusters (e.g. CARE0314), while others contained two or more clusters consistent with multiple independent transmission sources among the residents. These data alone do not indicate where the residents acquired their infections, and hospital-acquired infections for some of the clusters is a possibility alongside multiple introductions into the same care homes. (B) Visualisation of transmission links between residents of two nearby carehomes and a group of healthcare workers (HCW). Two care homes, CARE0063 (blue) and CARE0273 (orange), each had strong transmission links identified with the transcluster algorithm to a group of HCW (green). The HCW comprised paramedics and care home carers – one working at CARE0063 and the other working at an unknown care home. We do not have confirmatory epidemiological data available, but this raises the possibility of the cases sharing a linked transmission network.
Figure 7—figure supplement 1
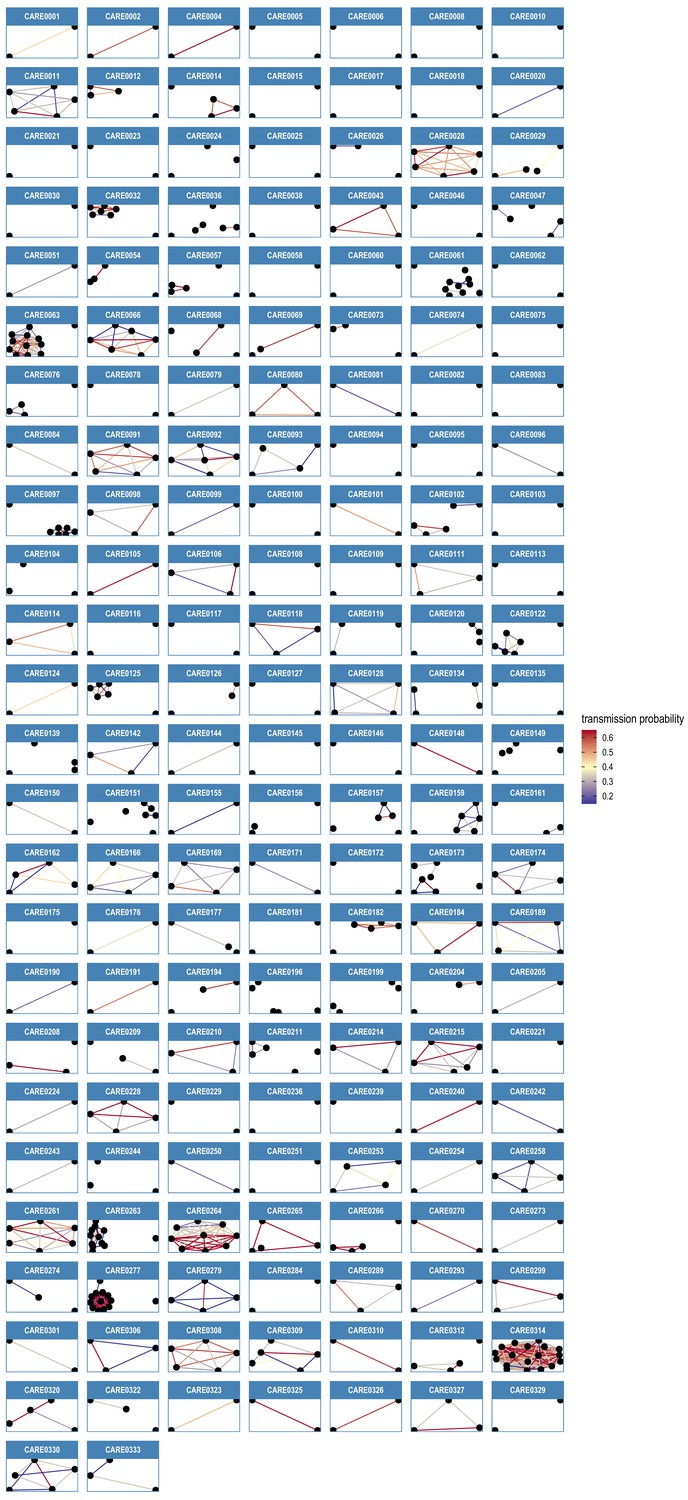
Transmission network diagrams for all care homes with two or more cases with genomic data.
Transmission networks were produced using a derivative of the transcluster algorithm, which incorporates pairwise date and genetic differences to estimate the probability of cases being connected within a defined number of intermediate hosts. Clusters were defined using a probability threshold of >15% for cases being linked by <2 intermediate hosts (further details in Materials and methods). This figure displays data from all care homes with >2 samples with genomic data.
Figure 7—figure supplement 2
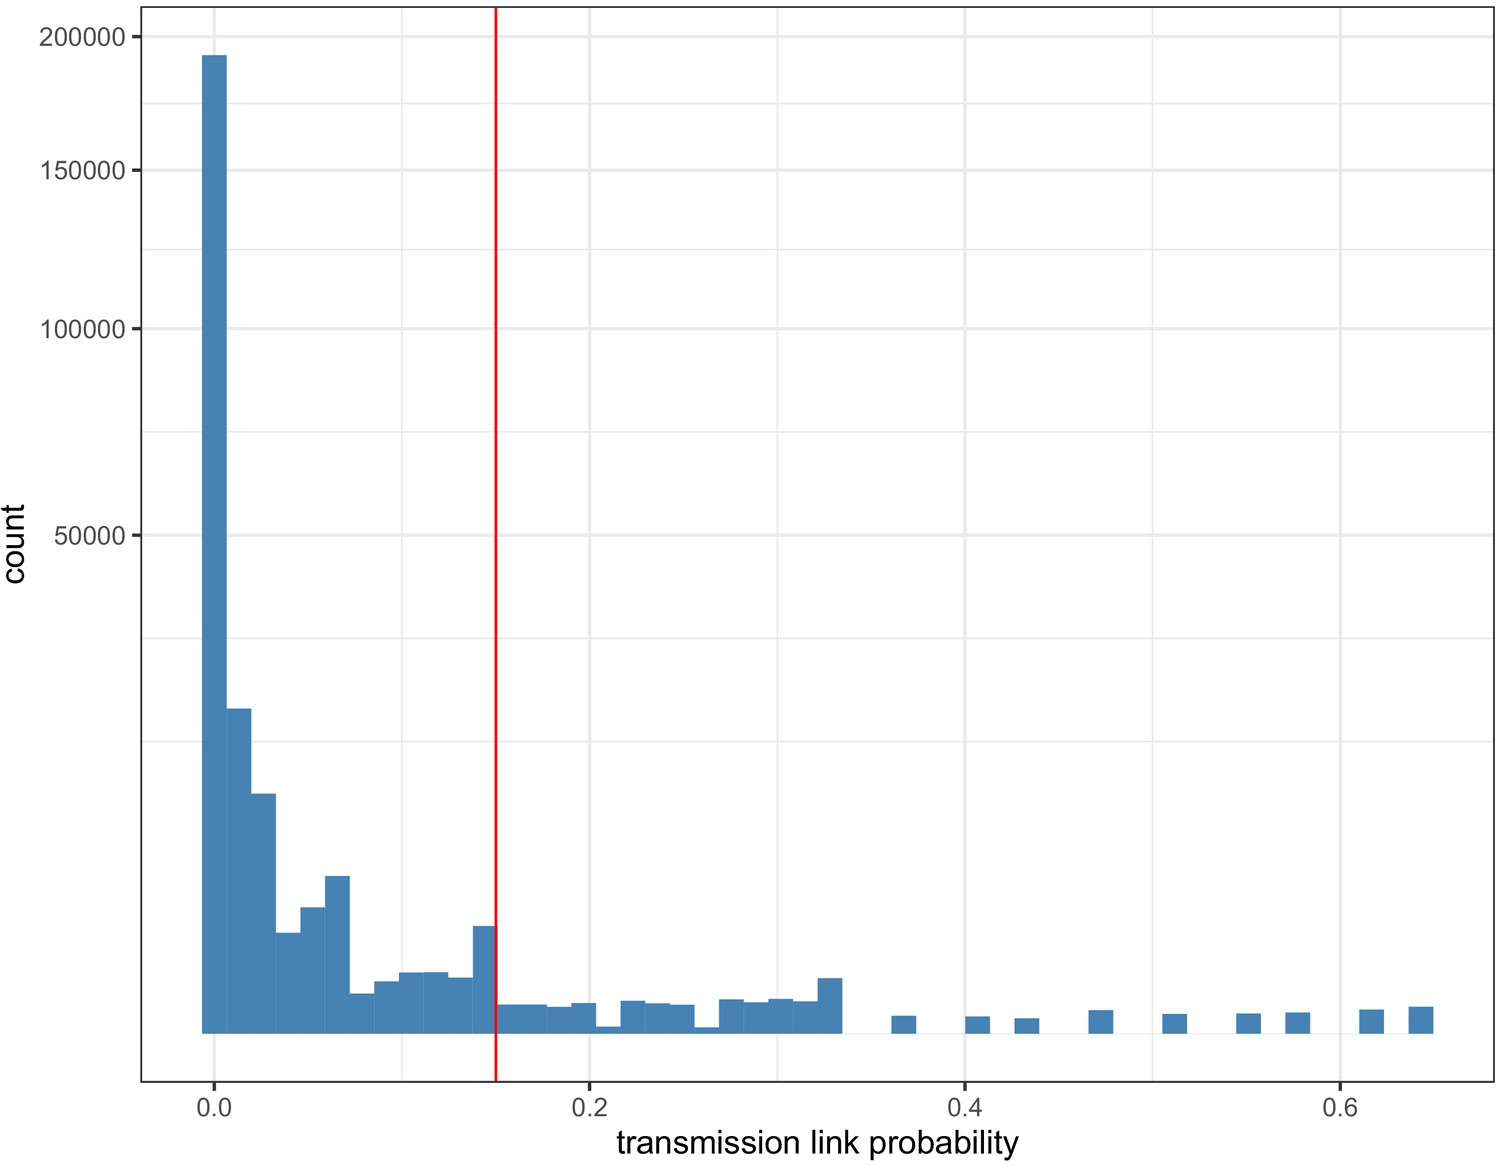
Histogram of pairwise transmission probabilities between care home samples.
Histogram of the pairwise probabilities for cases being connected by <2 intermediate hosts for all 700 care home residents as inferred by the transcluster algorithm, with vertical red line at 0.15 showing the cutoff used to identify care home clusters in our analysis. Note the data gaps along the x-axis reflect the inherent discontinuity of the input datasets, measured in days and SNP differences between cases.
Figure 7—figure supplement 3
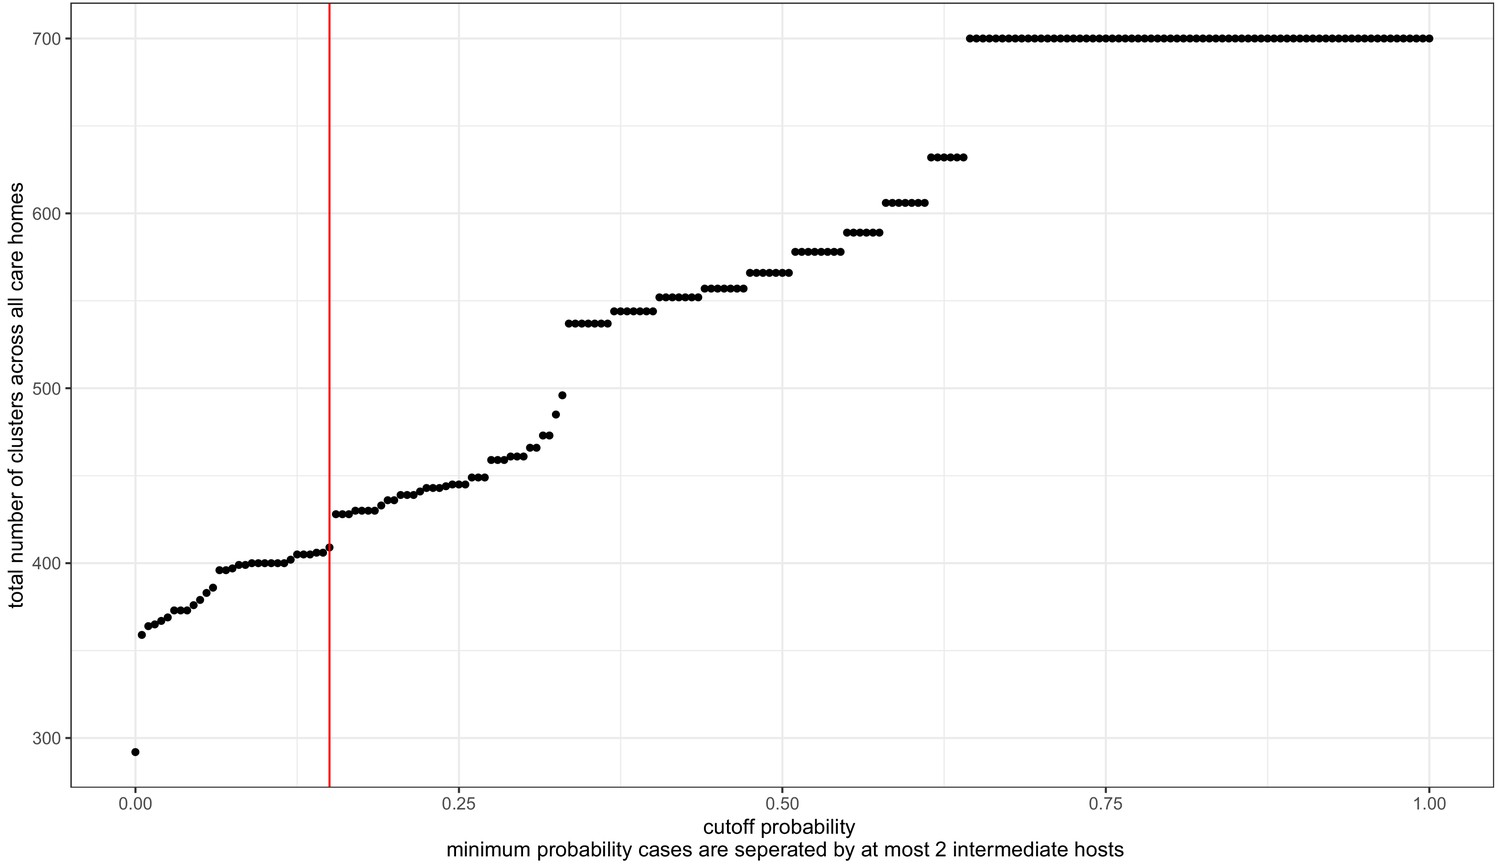
Transmission probability threshold vs number of care home clusters.
The transcluster algorithm computes the likelihood of two samples being linked within a given number of intermediate hosts, based on the date and genetic differences between samples (assuming a given serial interval and mutation rate, further details in Materials and methods). Changing the probability threshold used to define clusters changes the number of clusters defined, with a higher threshold yielding more clusters (and higher likelihood of transmission within each cluster). The dataset analysed contained 700 genomes from residents in 292 care homes, and we treated each care home separately as microcosms of potential infection networks. Therefore, the highest theoretical number of clusters is 700, if every genome were its own cluster; and the lowest possible number of clusters is 292, if every person within each care home was part of the same cluster. The cut-off used (>15% probability of transmission with <2 intermediate hosts) is indicated by the red vertical line. This is arbitrary, and was selected (1) because the distribution of pairwise SNP and date differences within resulting clusters appeared reasonable (Figure 7—figure supplements 4 and 5) and because of a ‘jump’ in the number of clusters occurring at that point.
Figure 7—figure supplement 4
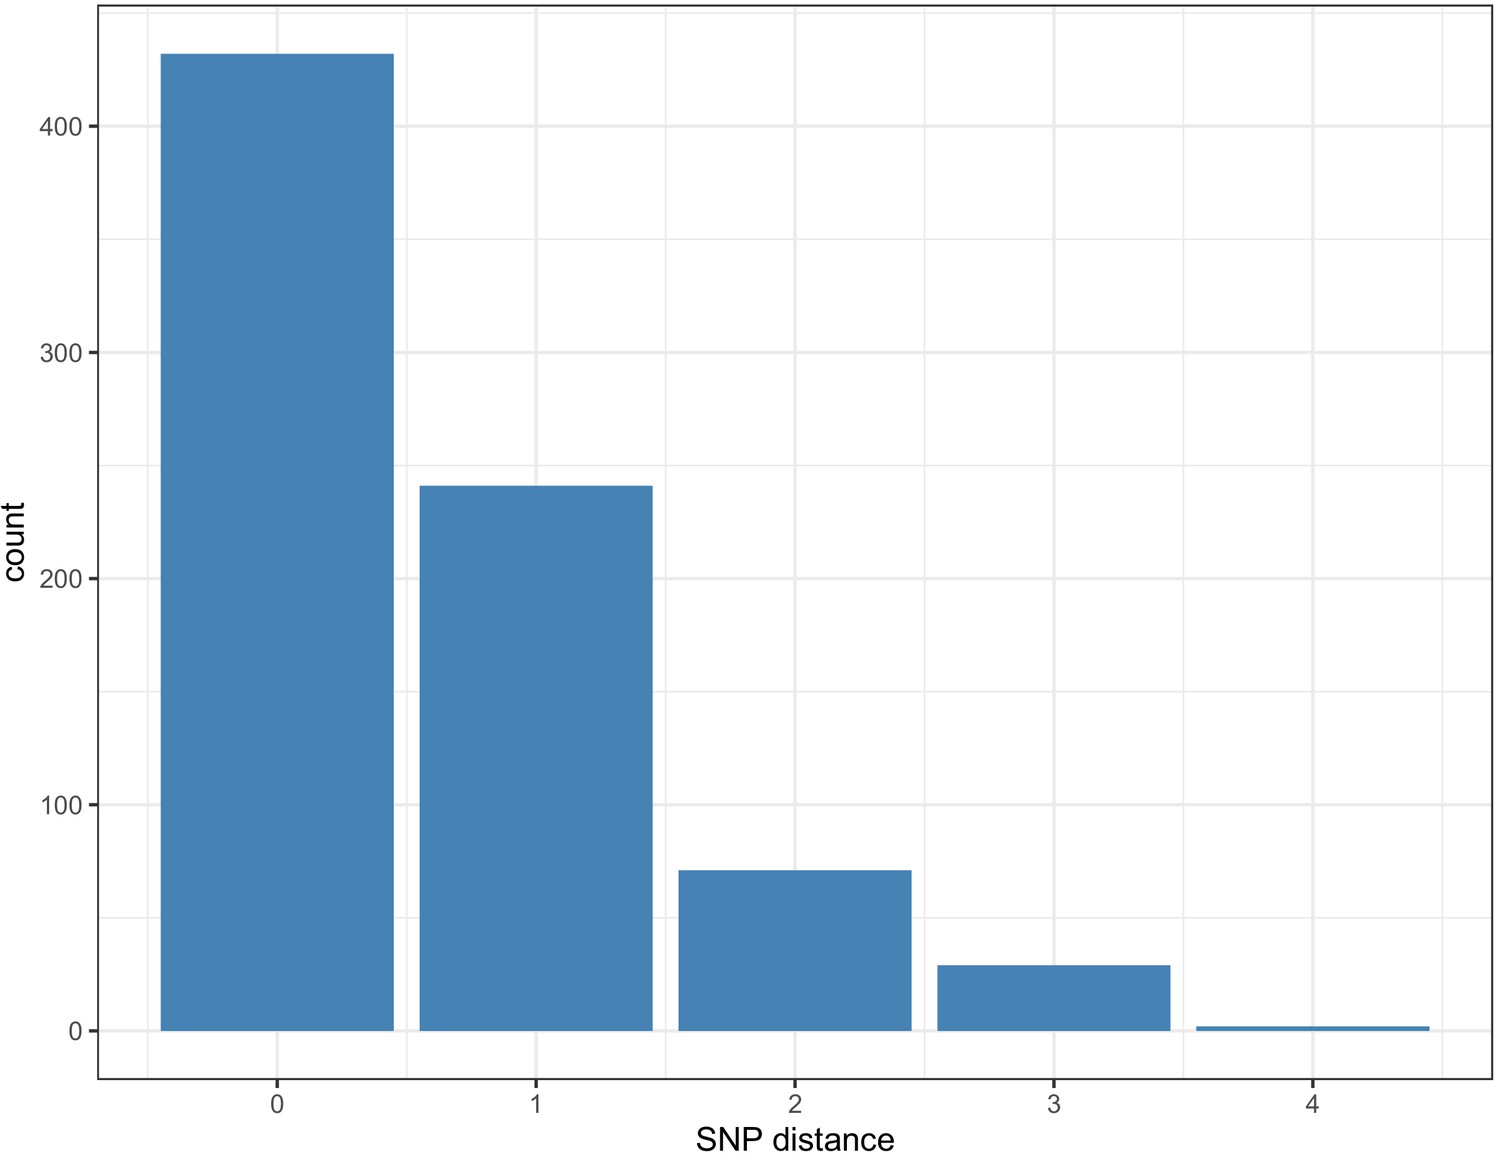
Pairwise SNP difference distribution between samples within clusters.
Within each cluster, 673/775 (86.8%) of pairwise links that had a > 15% probability of transmission with <2 intermediate hosts had 0 or one pairwise SNP differences (maximum 4).
Figure 7—figure supplement 5
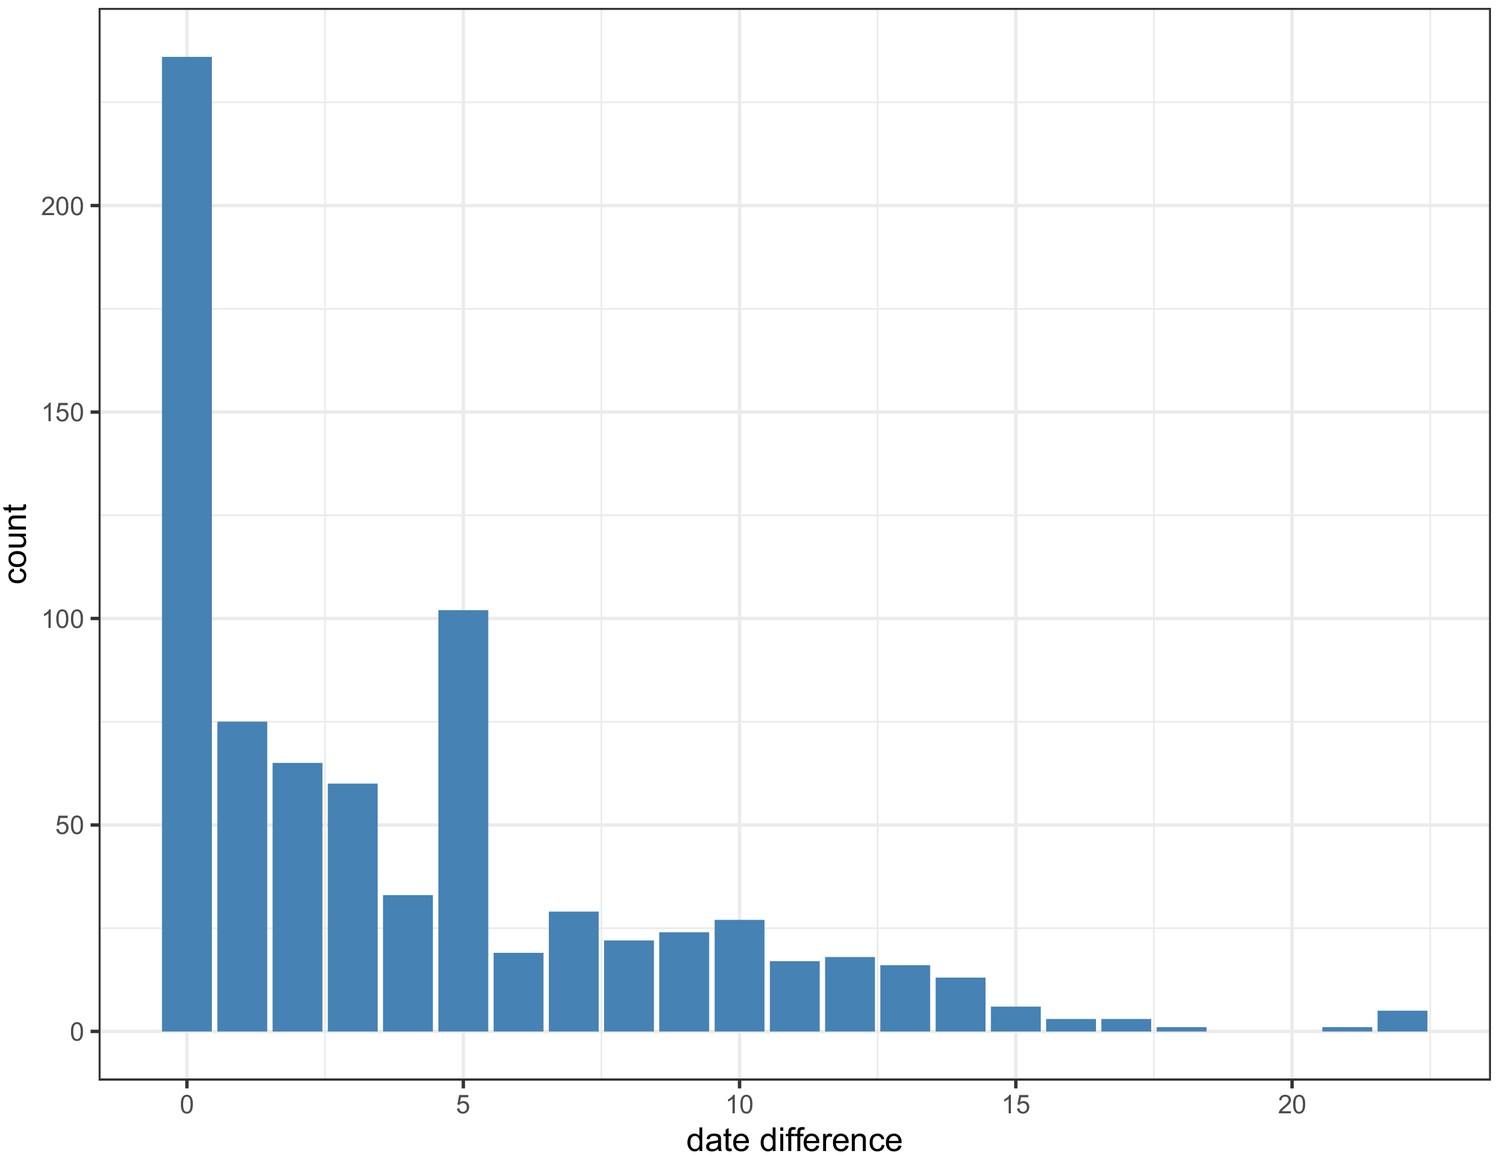
Pairwise date difference distribution between samples within clusters, aggregated across dataset.
Within each cluster, 756/775 (97.5%) of pairwise links that had a > 15% probability of transmission with <2 intermediate hosts cases were sampled <14 days apart (maximum 22 days).
Figure 7—figure supplement 6
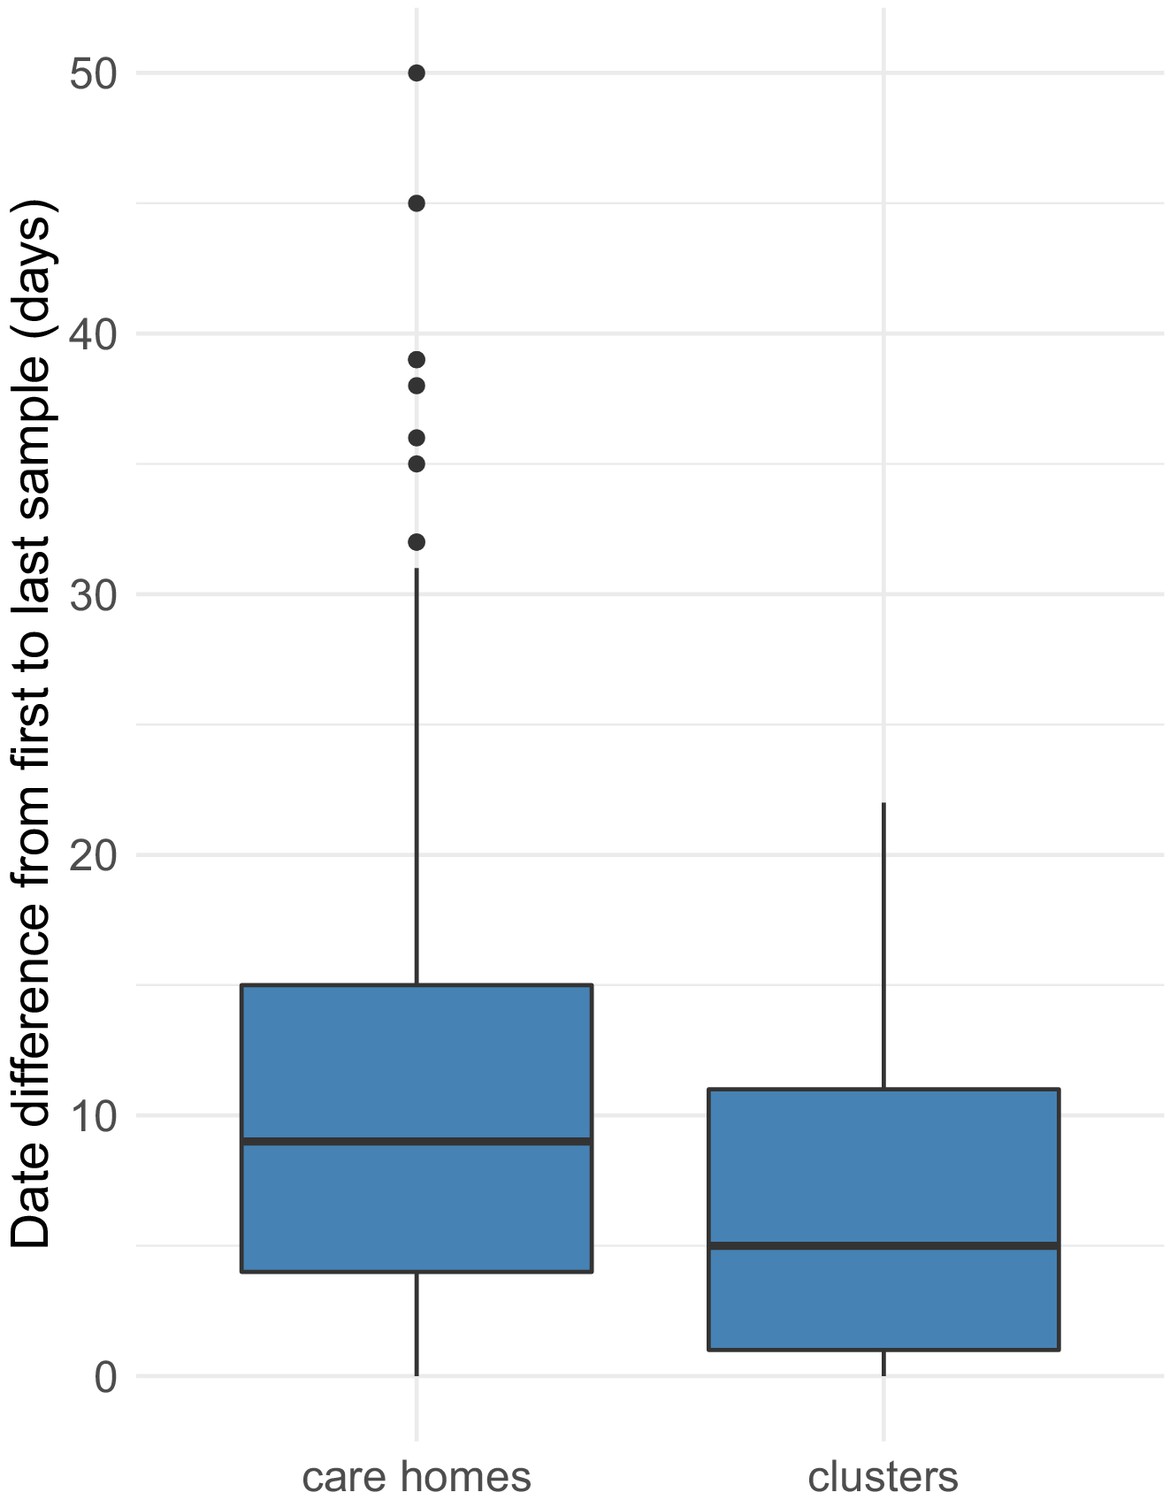
Distributions of date ranges (from first to last sampling dates) for care homes vs clusters.
Date ranges were calculated by subtracting the date of the first sample from the last sample for each care home (left) or cluster (right). Care homes and clusters were only included in this analysis if there were >2 samples with available genomic data in that care home or cluster. Of 292, 170 (58%) care homes had two or more cases with genomic data (578 individuals), compared with 133/409 (33%) clusters (424 individuals). Using these datasets, there was a median of 9 days (IQR: 4–15, range: 0–50) from the first case to the last case within each care home, compared with 5 days (IQR: 1–11, range: 0–22) from the first case to the last case within each cluster (p=9.2e-06, Wilcoxon rank sum test). As expected, the transcluster algorithm produces clusters with a narrower and smaller date range between samples than for the care homes as a whole. Collection date was used for sample dates; if collection date was missing then receive date in the laboratory was used instead.
Figure 7—figure supplement 7
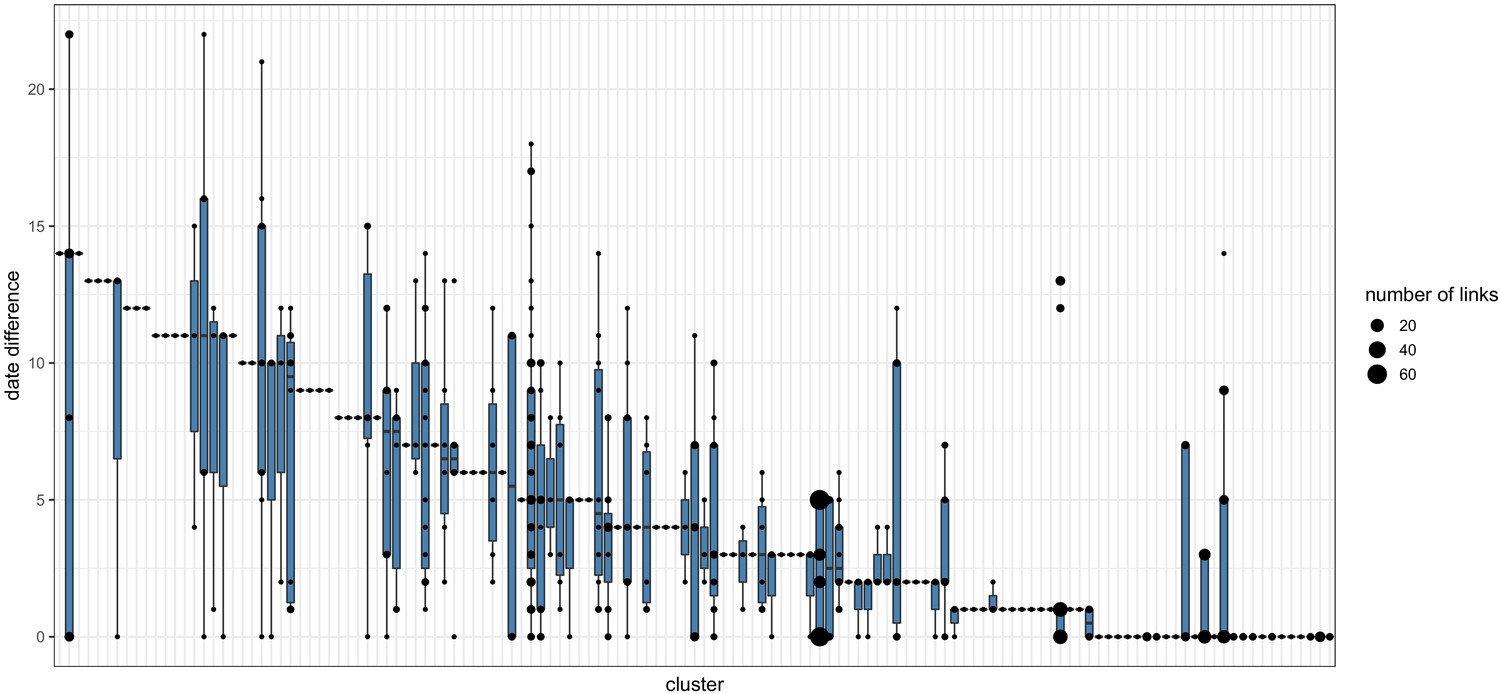
Pairwise date difference distribution between samples within each cluster.
Boxplots indicate the median and interquartile ranges for the number of days separating samples found to be within the same transmission cluster by the transcluster algorithm. The boxplots are overlaid with points representing the underlying transmission links. Larger points are used to represent cases where many transmission links within a cluster are separated by the same number of days.
Scheme 1

Diagram representing transmission dynamics between two samples.
Tables
Table 1
Epidemiological characteristics of care home and non-care home residents with COVID-19 included in the study.
The total sample set for this study comprised 6600 individuals. Of these, care home residency status could be established for 6413 (97.2%). 1167/6413 (18.2%) individuals were identified as being care home residents, of which 700/1167 (60.0%) had genomic data available that passed quality control filtering and were used for identifying care home clusters using the transcluster algorithm (described in Methods and main text). The subset of individuals (464/6600, 7.03%) that were tested at Cambridge University Hospitals (CUH) had richer metadata available and were used for analysing intensive care unit (ICU) admissions and 30 day mortality after first positive test, shown here. Not showing precise values where the number of cases is equal to or less than five individuals, to preserve patient anonymity. Ct = Cycle threshold; CUH = Cambridge University Hospitals; ICU = Intensive Care Unit; IQR = interquartile range.
| Variable | Care home residents (all) | Non-care home residents (all) | Care home residents with genomes |
|---|---|---|---|
| Number (%) | 1167/6413 (18.2%) | 5246/6413 (81.8%) | 700/1167 (60%) |
| Female (%) | 624/1167 (53.5%) | 2338/5246 (44.6%) | 363/700 (51.9%) |
| Male (%) | 543/1167 (46.5%) | 2908/5246 (55.4%) | 337/700 (48.1%) |
| Age in years (median, IQR, range) | 86 (IQR: 79–90, range: 30–100) | 65 (IQR: 48–80, range: 0–100) | 86 (IQR: 78–90, range: 42–99) |
| Diagnostic Ct value | 26 (IQR: 22–29) | 25 (IQR: 21–29) | 24 (IQR: 20–27) |
| Tested at CUH (%) | 72/464 (15.5%) | 392/464 (84.5%) | 54/72 (75%) |
| CUH patient admitted to ICU (%) | <5/72 (<7%) | 84/392 (21.4%) | <5/54 (<9%) |
| CUH patient 30 day mortality (%) | 34/72 (47.2%) | 78/392 (19.9%) | 23/54 (42.6%) |
| Number of care homes | 337 | - | 292 |
| Cases/ care home (median, IQR, range) | 2 (IQR: 1–5, range: 1–22) | - | 2 (IQR: 1–3, range: 1–18) |
| Care homes with > 5 cases | 85/337 (25.2%) | - | 32/292 (11%) |
Table 2
Case numbers from care homes and non-care home residents per week for full dataset tested at Cambridge CMPHL.
Data plotted in Figure 3A of main text, showing case numbers for care homes, non-care homes, and undetermined, for all EoE samples tested at CMPHL. The proportion of COVID-19 cases from care home residents increased in April and May; however, this may reflect the changing profile of samples submitted to the Cambridge CMPHL rather than underlying epidemiological trends.
| Week commencing | Care home resident | Not determined | Not care home resident | Weekly total | Care home resident (%) |
|---|---|---|---|---|---|
| 24-Feb | 0 | 0 | <5 | <5 | 0.0% |
| 02-Mar | 0 | 0 | 31 | 31 | 0.0% |
| 09-Mar | 10 | 6 | 149 | 165 | 6.1% |
| 16-Mar | 25 | 6 | 364 | 395 | 6.3% |
| 23-Mar | 60 | 26 | 852 | 938 | 6.4% |
| 30-Mar | 126 | 35 | 1235 | 1396 | 9.0% |
| 06-Apr | 162 | 43 | 1064 | 1269 | 12.8% |
| 13-Apr | 154 | 31 | 540 | 725 | 21.2% |
| 20-Apr | 247 | 16 | 415 | 678 | 36.4% |
| 27-Apr | 198 | 16 | 393 | 607 | 32.6% |
| 04-May | 185 | 8 | 199 | 392 | 47.2% |
Table 3
Proportion of community acquired, care home-associated COVID-19 infections tested at Cambridge University Hospitals.
The proportion of community onset, care home-associated COVID-19 infections tested at Cambridge University Hospitals (CUH) peaked in mid to late April. Total cases shows the total number of new COVID-19 cases diagnosed at CUH that week. ‘Community acquired’ was defined as first positive test <48 hr from admission and no healthcare contact within the previous 14 days. Not showing precise values if number of patients is less than or equal to five to preserve patient anonymity.
| Week | Total weekly COVID-19 cases | Community acquired, care home-associated (%) |
|---|---|---|
| 09-Mar | 12 | 0 (0%) |
| 16-Mar | 24 | 0 (0%) |
| 23-Mar | 75 | <5 (<7%) |
| 30-Mar | 96 | <5 (<5.2%) |
| 06-Apr | 99 | 14 (14.1%) |
| 13-Apr | 49 | 14 (28.6%) |
| 20-Apr | 41 | 10 (24.4%) |
| 27-Apr | 41 | 9 (22.0%) |
| 04-May | 27 | 6 (22.2%) |
Table 4
Odds ratios for mortality at 30 days.
Logistic regression analysis of odds of mortality at 30 days. Age > 80 years, being a care home resident, being admitted to ICU and Ct <20 were significantly associated with increased odds of death at 30 days post-diagnosis (p<0.05). OR = Odds Ratios. CI = Confidence Interval. ICU = intensive care unit. Ct = Cycle threshold for diagnostic PCR.
| Variable | OR | 95% CI low | 95% CI high | P value |
|---|---|---|---|---|
| Age >= 80 | 6.6 | 3.7 | 12.0 | 2.46E-10 |
| Sex | 1.5 | 0.9 | 2.6 | 1.30E-01 |
| Care resident status | 3.0 | 1.6 | 5.7 | 9.22E-04 |
| ICU admission | 3.9 | 2.1 | 7.5 | 3.02E-05 |
| Ct value < 20 | 2.9 | 1.6 | 5.3 | 5.04E-04 |
Table 5
Proportion of care home and non-care home samples that were lineage B.1.1.
The proportion of lineage B.1.1 (defined using the Pangolin tool) increased from earlier to later sampling weeks, for both care home and non-care home samples. Data based on the 700 care home residents with genomic data available and 700 randomly selected non-care home samples. ‘Early’ was defined as the period from the start of the study (26th February 2020) to 29th March 2020. ‘Late’ was defined as 20th April 2020 to the end of the study (10th May 2020).
| Care home status | Early | Late | % change |
|---|---|---|---|
| Care home resident | 6/47 (12.8%) | 155/286 (54.2%) | + 41.40% |
| Not care home resident | 39/173 (22.5%) | 50/96 (52.1%) | + 29.50% |
Table 6
Outbreak characteristics for 10 care homes with the largest number of SARS-CoV-2 genomes.
Epidemiological characteristics of the 10 care homes with the largest number of genomes are shown. Collectively these comprised 102 cases (102/700 (14%) of the total number of care home cases with genomic data available). ‘Cluster count’ refers to the number of SARS-CoV-2 clusters within each care home defined by transcluster (described in Materials and methods and main text). ‘Major cluster count’ shows the count for the dominant cluster (with the largest number of cases) and its percentage contribution to total case numbers for each care home. ‘Care home date range’ indicates the number of days from first sample to last sample date for residents from each care home. ‘Cluster date range’ indicates the number of days from first sample to last sample date for residents from each cluster within that care home, as defined by the transcluster algorithm, also showing the sample count (n) for each cluster. Sampling dates used collection date if known, or receive date in the diagnostic laboratory if collection date was unknown. The date range for each care home is typically larger than the date range for clusters within care homes, except for single-cluster care homes like CARE0314. This is consistent with the transcluster algorithm defining groups of cases occurring closer together in time. While the care homes frequently had more than one introduction of the virus among residents (i.e. >1 clusters), there was usually a single dominant cluster responsible for the majority of cases. Individual counts of males and females for each care home are not shown as this generally gave counts of less than five, risking patient anonymity. Overall, there were 59/102 (57.8%) females for these 10 care homes.
| Care home code | Sample count | Age (median, IQR, range) | Ct values (median, IQR, range) | Cluster count | Major cluster count | Care home date range (days) | Cluster date range (days, sample count) |
|---|---|---|---|---|---|---|---|
| CARE0032 | 7 | 87 (IQR: 81–91, range: 56–93) | 23 (IQR: 22–24, range: 14–26) | 2 | 6/7 (85.7%) | 39 | 0 days, n = 1 10 days, n = 6 |
| CARE0061 | 10 | 88.5 (IQR: 87–92.2, range: 84–97) | 23 (IQR: 21.2–26.5, range: 12–33) | 4 | 7/10 (70%) | 38 | 0 days, n = 1 22 days, n = 7 0 days, n = 1 0 days, n = 1 |
| CARE0063 | 12 | 74.5 (IQR: 67.8–81, range: 42–94) | 23 (IQR: 20.8–27, range: 14–30) | 2 | 11/12 (91.7%) | 21 | 18 days, n = 11 0 days, n = 1 |
| CARE0097 | 7 | 90 (IQR: 82.5–92, range: 73–95) | 23 (IQR: 20.5–24, range: 17–27) | 2 | 6/7 (85.7%) | 28 | 0 days, n = 1 14 days, n = 6 |
| CARE0151 | 7 | 81 (IQR: 77–89, range: 69–96) | 20 (IQR: 19–25.5, range: 17–30) | 4 | 4/7 (57.1%) | 20 | 0 days, n = 1 0 days, n = 4 0 days, n = 1 0 days, n = 1 |
| CARE0173 | 7 | 81 (IQR: 77.5–94, range: 71–95) | 19 (IQR: 17.5–26, range: 15–27) | 3 | 3/7 (42.9%) | 21 | 0 days, n = 1 3 days, n = 3 0 days, n = 3 |
| CARE0263 | 12 | 85.5 (IQR: 81.8–90.5, range: 69–97) | 19.5 (IQR: 18.5–24.8, range: 14–29) | 3 | 9/12 (75%) | 3 | 3 days, n = 9 0 days, n = 2 0 days, n = 1 |
| CARE0264 | 9 | 91 (IQR: 82–95, range: 73–96) | 26 (IQR: 25–27, range: 18–29) | 1 | 9/9 (100%) | 14 | 14 days, n = 9 |
| CARE0277 | 13 | 84 (IQR: 82–89, range: 71–94) | 26 (IQR: 24–27, range: 23–29) | 2 | 12/13 (92.3%) | 13 | 13 days, n = 12 0 days, n = 1 |
| CARE0314 | 18 | 87.5 (IQR: 81.2–90.8, range: 74–97) | 24 (IQR: 22.2–26, range: 14–29) | 1 | 18/18 (100%) | 5 | 5 days, n = 18 |
Table 7
Hospitalisation data for the 700 care home residents with genomic data available 700/1167 (60.0%) care home residents identified in the study had genomic data available and were used to define care home SARS-CoV-2 clusters.
We investigated the proportions of these care home residents that were hospitalised and may have acquired their infections through interactions with hospitals. This was possible for 694/700 (99.1%) individuals who had NHS numbers documented that could be linked with national hospitalisation data. Being hospitalised due to COVOD-19 was defined as the date of first positive sampling being within 2 days prior to admission up to 7 days post-admission. Suspected hospital-acquired COVID-19 infections were defined as first positive test being 7 days or more after hospital admission date and prior to discharge date (N = 13) or within 7 days following hospital discharge (N = 27). Of the latter group, 10 individuals were admitted to hospital and discharged on the same day prior to their positive test, nine were admitted for 1–7 days, and eight had been admitted for greater than 7 days.
| Category | Counts (%) |
|---|---|
| Care home residents with genomic data | 700 |
| Care home residents with genomic data that could be linked to hospitalisation data | 694/700 (99.1%) |
| Hospitalised during study period | 470/694 (67.7%) |
| Hospitalised due to COVID-19 | 398/694 (57.3%) |
| Suspected hospital-acquired COVID-19 | 40/694 (5.76%) |
| Discharged within 7 days of positive test | 230/694 (33.1%) |
Additional files
-
Supplementary file 1
Supplementary materials for ‘Genomic epidemiology of COVID-19 in care homes in the East of England’.
- https://cdn.elifesciences.org/articles/64618/elife-64618-supp1-v3.docx
-
Transparent reporting form
- https://cdn.elifesciences.org/articles/64618/elife-64618-transrepform-v3.docx
Download links
A two-part list of links to download the article, or parts of the article, in various formats.
Downloads (link to download the article as PDF)
Open citations (links to open the citations from this article in various online reference manager services)
Cite this article (links to download the citations from this article in formats compatible with various reference manager tools)
Genomic epidemiology of COVID-19 in care homes in the east of England
eLife 10:e64618.
https://doi.org/10.7554/eLife.64618


