Temporal pattern and synergy influence activity of ERK signaling pathways during L-LTP induction
- Department of Chemistry and Biochemistry, George Mason University, United States
- Laboratory of Neuroinformatic, Nencki Institute of Experimental Biology of Polish Academy of Sciences, Poland
- Interdisciplinary Program in Neuroscience, Bioengineering Department, George Mason University, United States
- Krasnow Institute for Advanced Study, George Mason University, United States
Figures
Figure 1
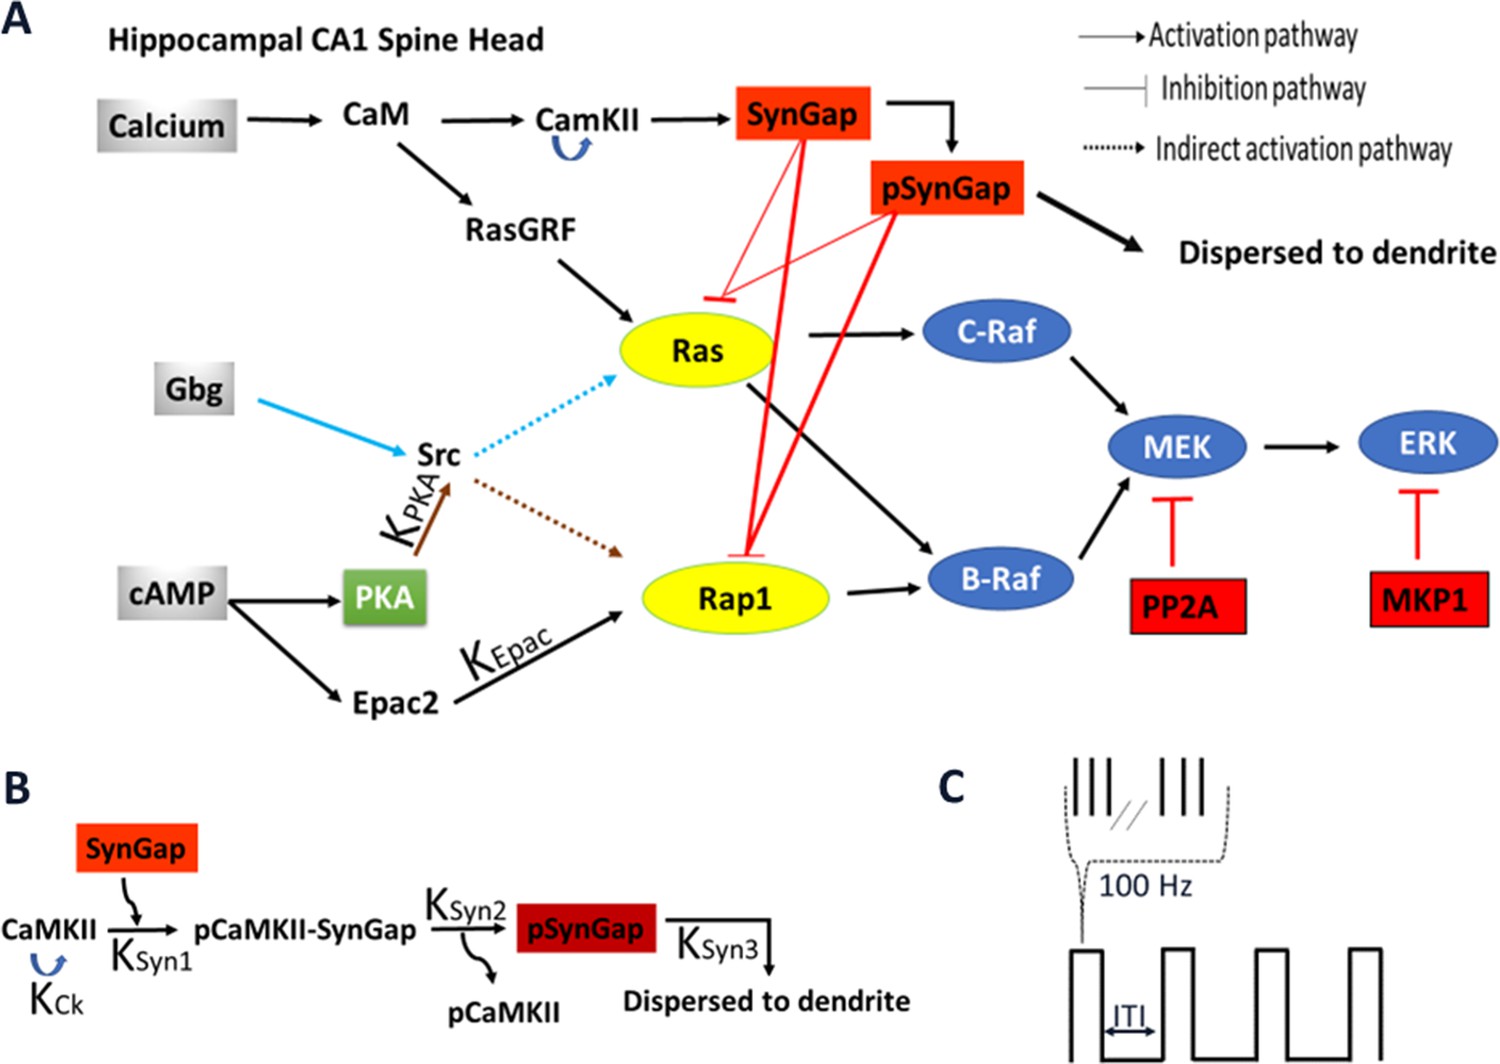
Schematic representation of signaling pathways activating ERK.
(A) Five pathways are included in the model: calcium activation of (1) RasGRF followed by RasGTP production or (2) CaMKII phosphorylation of SynGap followed by increasing RasGTP and Rap1GTP lifetime; cAMP activation of (3) Epac or (4) PKA phosphorylation of Src family kinase, leading to Rap1GTP production; Gi subtype of GTP binding protein (Giβγ) (5) recruits Src family kinase followed by activation of RasGTP. (B) Four effects of CaMKII on SynGap were evaluated. KCK: No autophosphorylation of CaMKII, KSyn1: No pCaMKII binding to SynGap, KSyn2: SynGap binds to pCaMKII, but cannot be phosphorylated, KSyn3: SynGap phosphorylated, but not dispersed to the dendrite. (C) LTP protocols: four trains of 100 Hz (each 1 s duration) spaced by different intertrial intervals: 3, 20, 40, 80, and 300 s.
-
Figure 1—source data 1
Reactions and rate constants involved in signaling pathway leading to Ras and Rap1 activation.
- https://cdn.elifesciences.org/articles/64644/elife-64644-fig1-data1-v2.docx
-
Figure 1—source data 2
Reactions and rate constants involved in signaling pathway of SynGap.
- https://cdn.elifesciences.org/articles/64644/elife-64644-fig1-data2-v2.docx
-
Figure 1—source data 3
Reactions and rate constants involved in core ERK signaling pathway.
- https://cdn.elifesciences.org/articles/64644/elife-64644-fig1-data3-v2.docx
-
Figure 1—source data 4
Reactions and rate constants involved in signaling pathways from calcium to CaMKII.
- https://cdn.elifesciences.org/articles/64644/elife-64644-fig1-data4-v2.docx
-
Figure 1—source data 5
Reactions and rate constants involved in signaling pathways leading from cAMP to PKA.
- https://cdn.elifesciences.org/articles/64644/elife-64644-fig1-data5-v2.docx
-
Figure 1—source data 6
Total concentrations of molecule species.
- https://cdn.elifesciences.org/articles/64644/elife-64644-fig1-data6-v2.docx
Figure 2 with 1 supplement
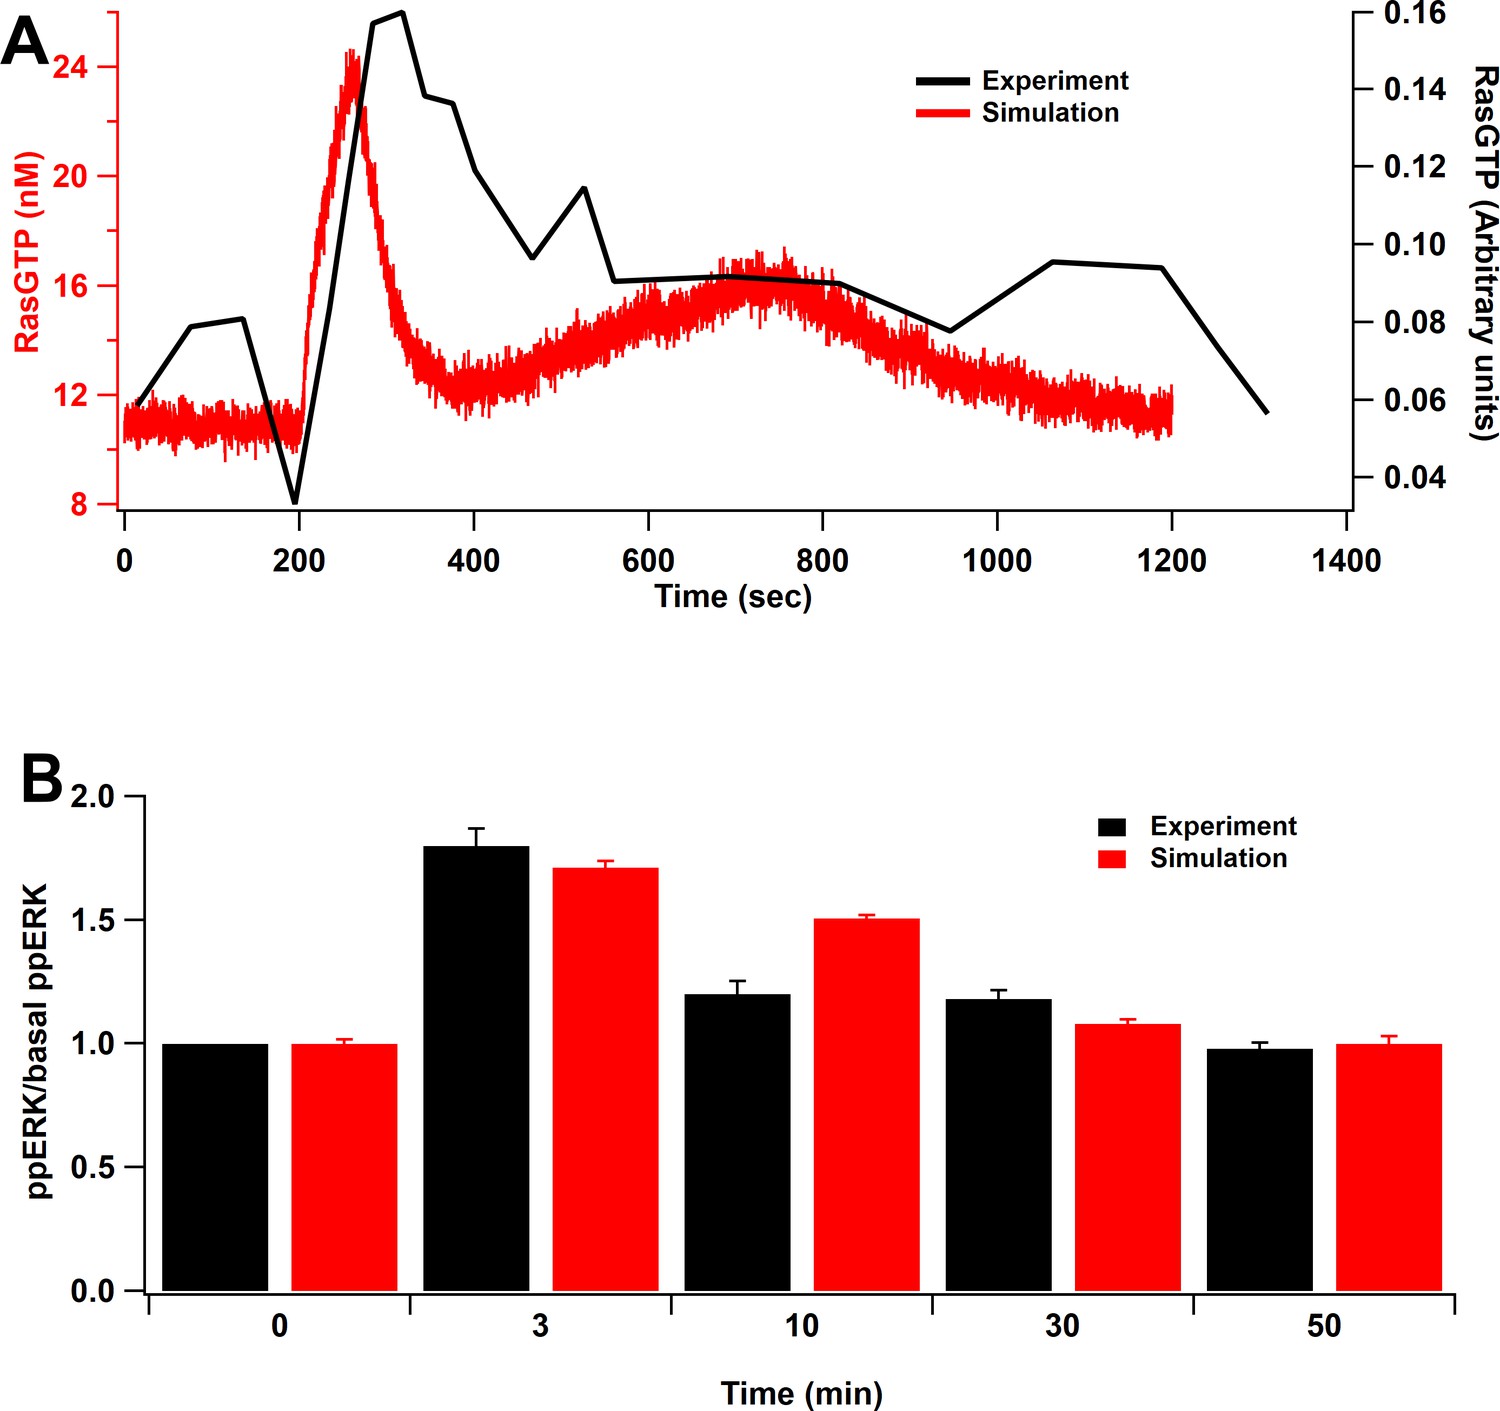
Model validation.
(A) Time course of RasGTP in response to 30 pulses at 0.5 Hz (Harvey et al., 2008). RasGTP dynamics are qualitatively consistent with experimental measurements. (B) Relative increase of ppERK in response to L-LTP stimuli (two bursts of 100 Hz for 1 s, bursts separated by 20 s) (Kasahara et al., 2001). Simulation shows qualitative match of ERK activation to the experimental model as ppERK peaks around 3 min after stimulation and returns to basal about 30 min after stimulation.
Figure 2—figure supplement 1
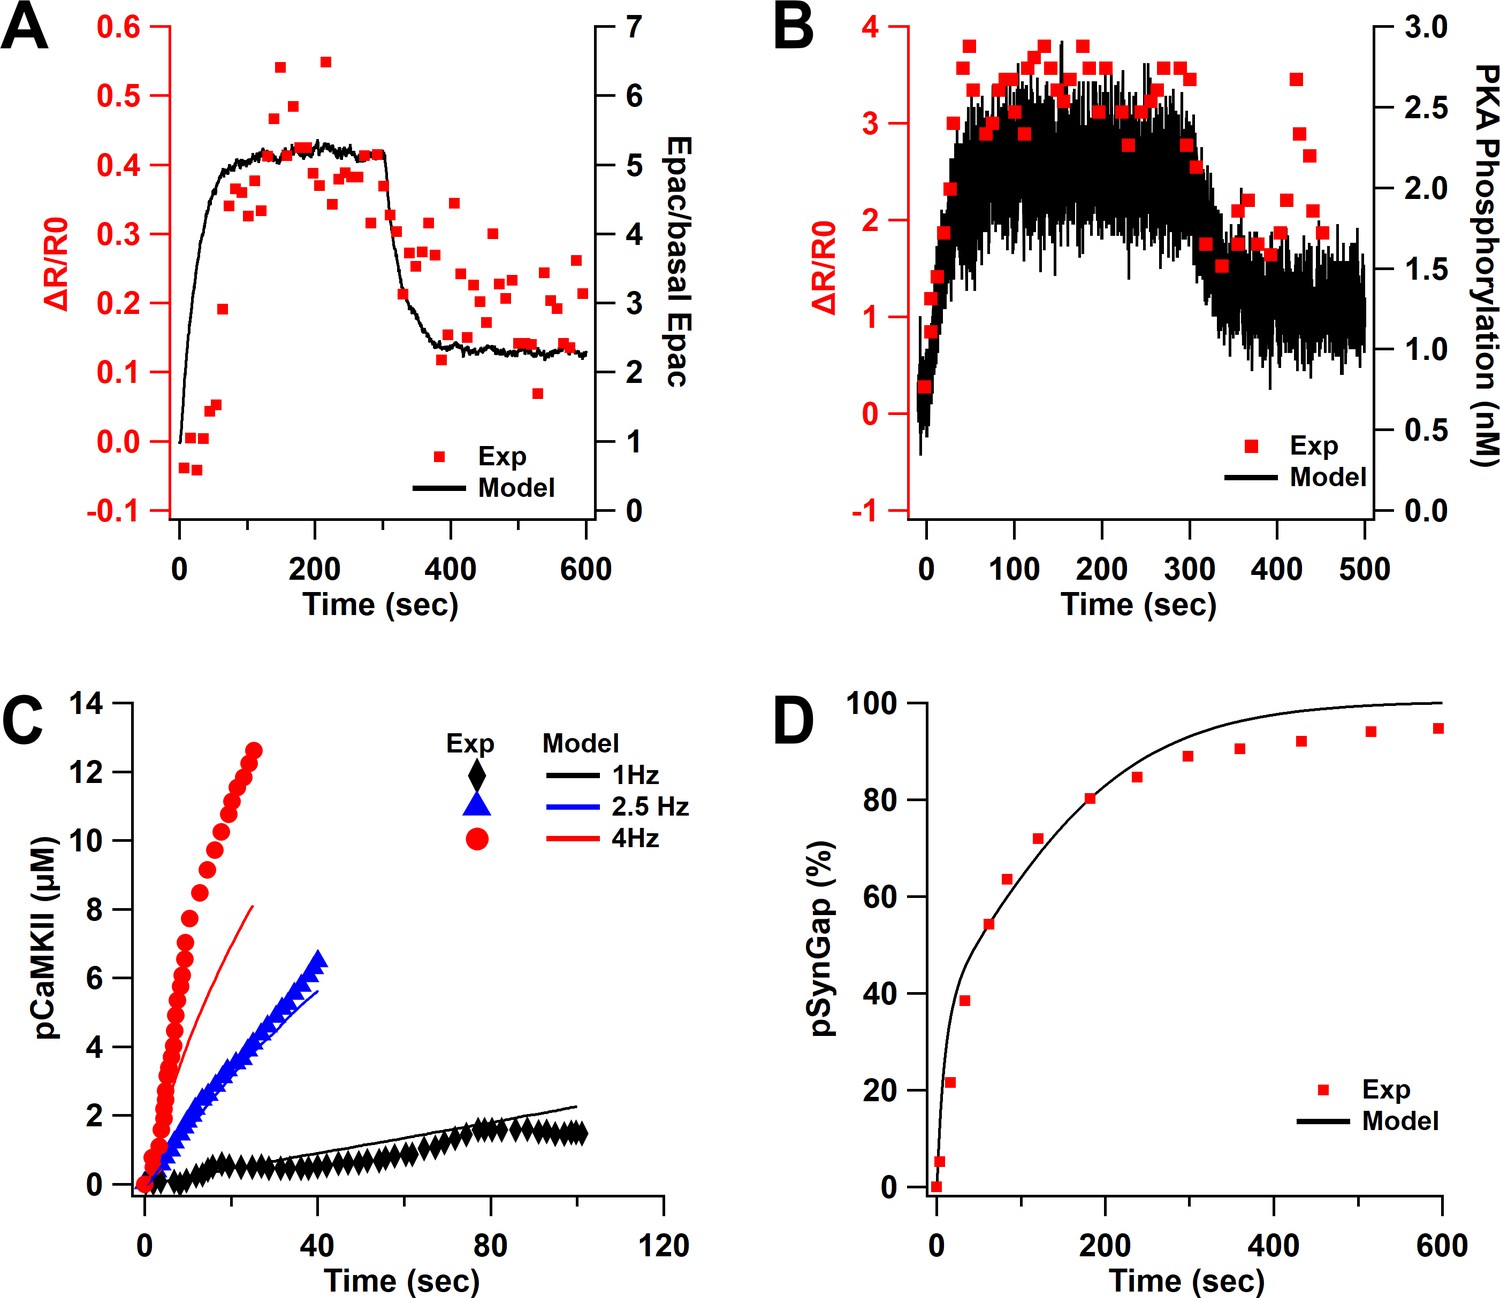
Model validation.
(A) Epac activity in response to 1 µM ISO in the model is similar to dynamics of experimentally measured Epac fluorescence (Luczak et al., 2017). (B) Time course of PKA phosphorylation of Src in response to 1 µM ISO is similar to the PKA FRET sensor activity (Luczak et al., 2017). (C, D) Parameter optimization matches experimental data of CaMKII (De Koninck and Schulman, 1998) (C) and SynGap phosphorylation (Walkup et al., 2015) (D).
Figure 3 with 1 supplement
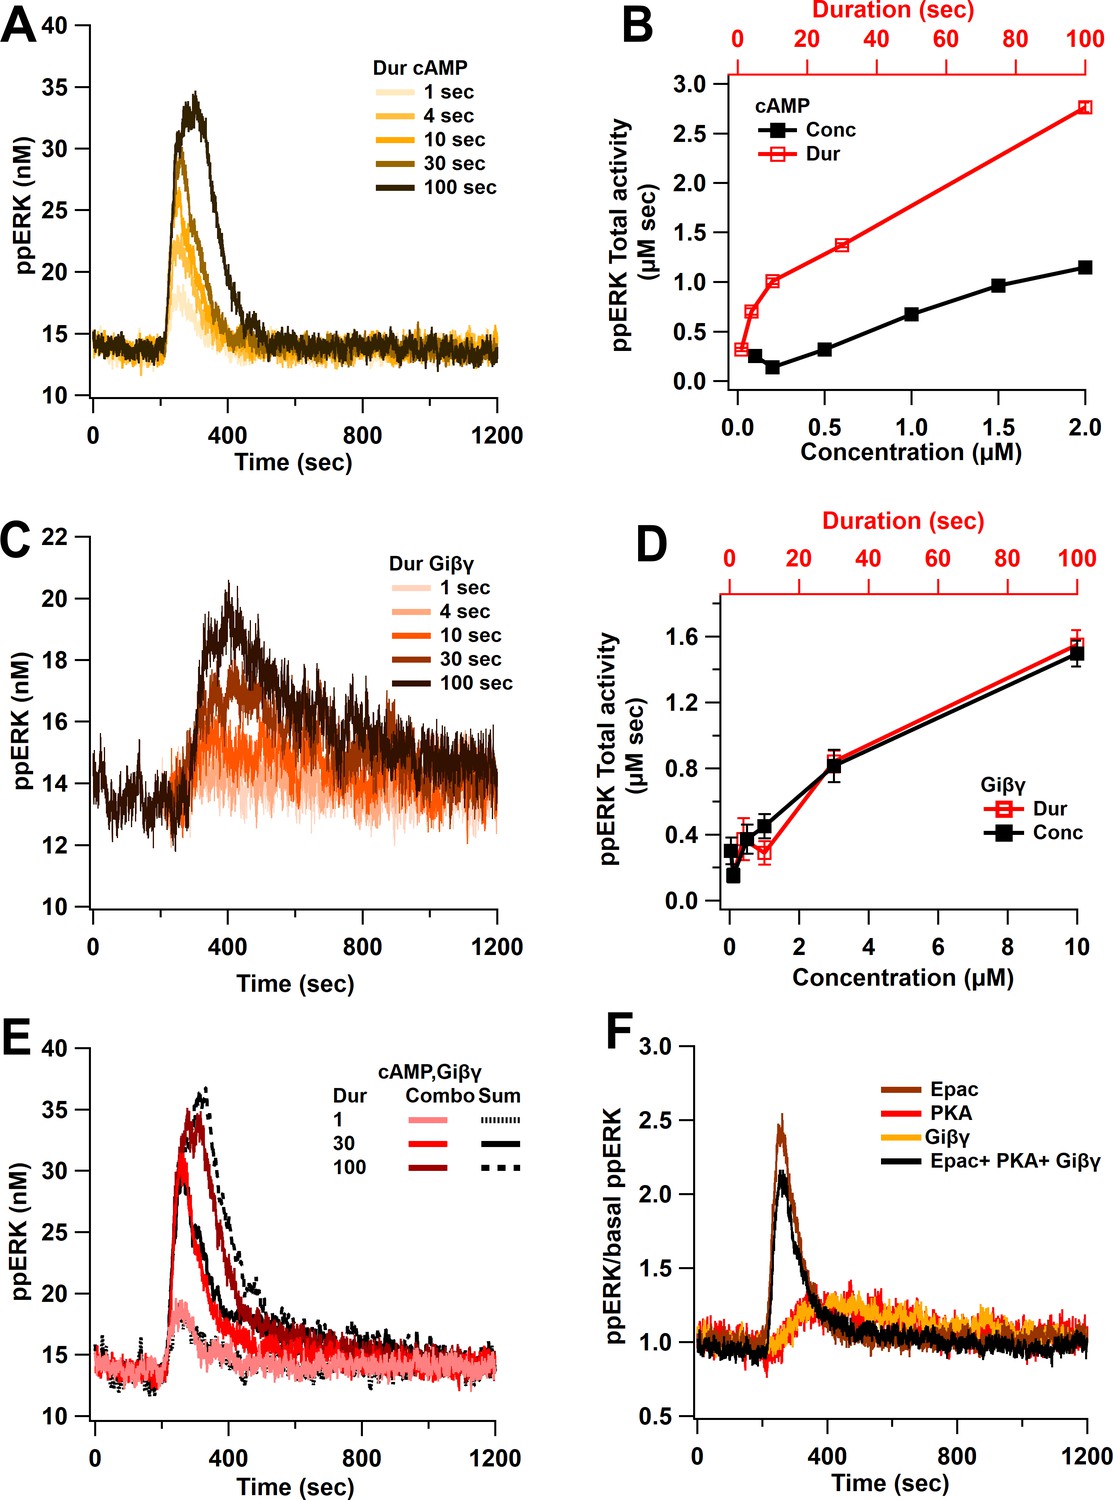
Linear activation of ERK by cAMP pathways.
(A) ppERK response to a single pulse of 0.5 μM cAMP is graded with duration. (B) Integral of ppERK concentration over time (AUC) in response to different cAMP concentrations (for 1 s) and different cAMP durations (with a concentration of 0.5 μM). (C) Time course of ppERK in response to single pulses of 0.1 μM Giβγ for different durations. Recruitment of ERK by Giβγ binding protein shows delayed activation. (D) Total activity of ppERK in response to different Giβγ concentrations (for 1 s) and durations (with a concentration of 0.1 μM). Increasing duration or concentration are similarly effective in increasing ppERK. (E) Direct and indirect cAMP pathways combine linearly for all duration inputs and sublinearly, with prolonged duration inputs. Two-way ANCOVA (analysis of covariance) of ppERK AUC versus stimulation characteristics (duration) and type (combination versus summation) as factors (N = 5 in each group) is significant for both duration and type (F (2,47) = 419.5, T < 0.001; P(dur) < 0.0001, T(dur) = 28.61, P(type) < 0.0001, T(type) = 4.54). Combo: response to Giβγ and cAMP, sum: sum of the responses in (A) and (C). (F) Ratio of ppERK to basal ppERK in response to cAMP activation of PKA, Epac or Giβγ (0.5 μM (cAMP) or 0.1 μM (Giβγ) for 30 s). ppERK increases quickly and transiently with Epac and with a delay and more prolonged in response to PKA or Giβγ.
Figure 3—figure supplement 1
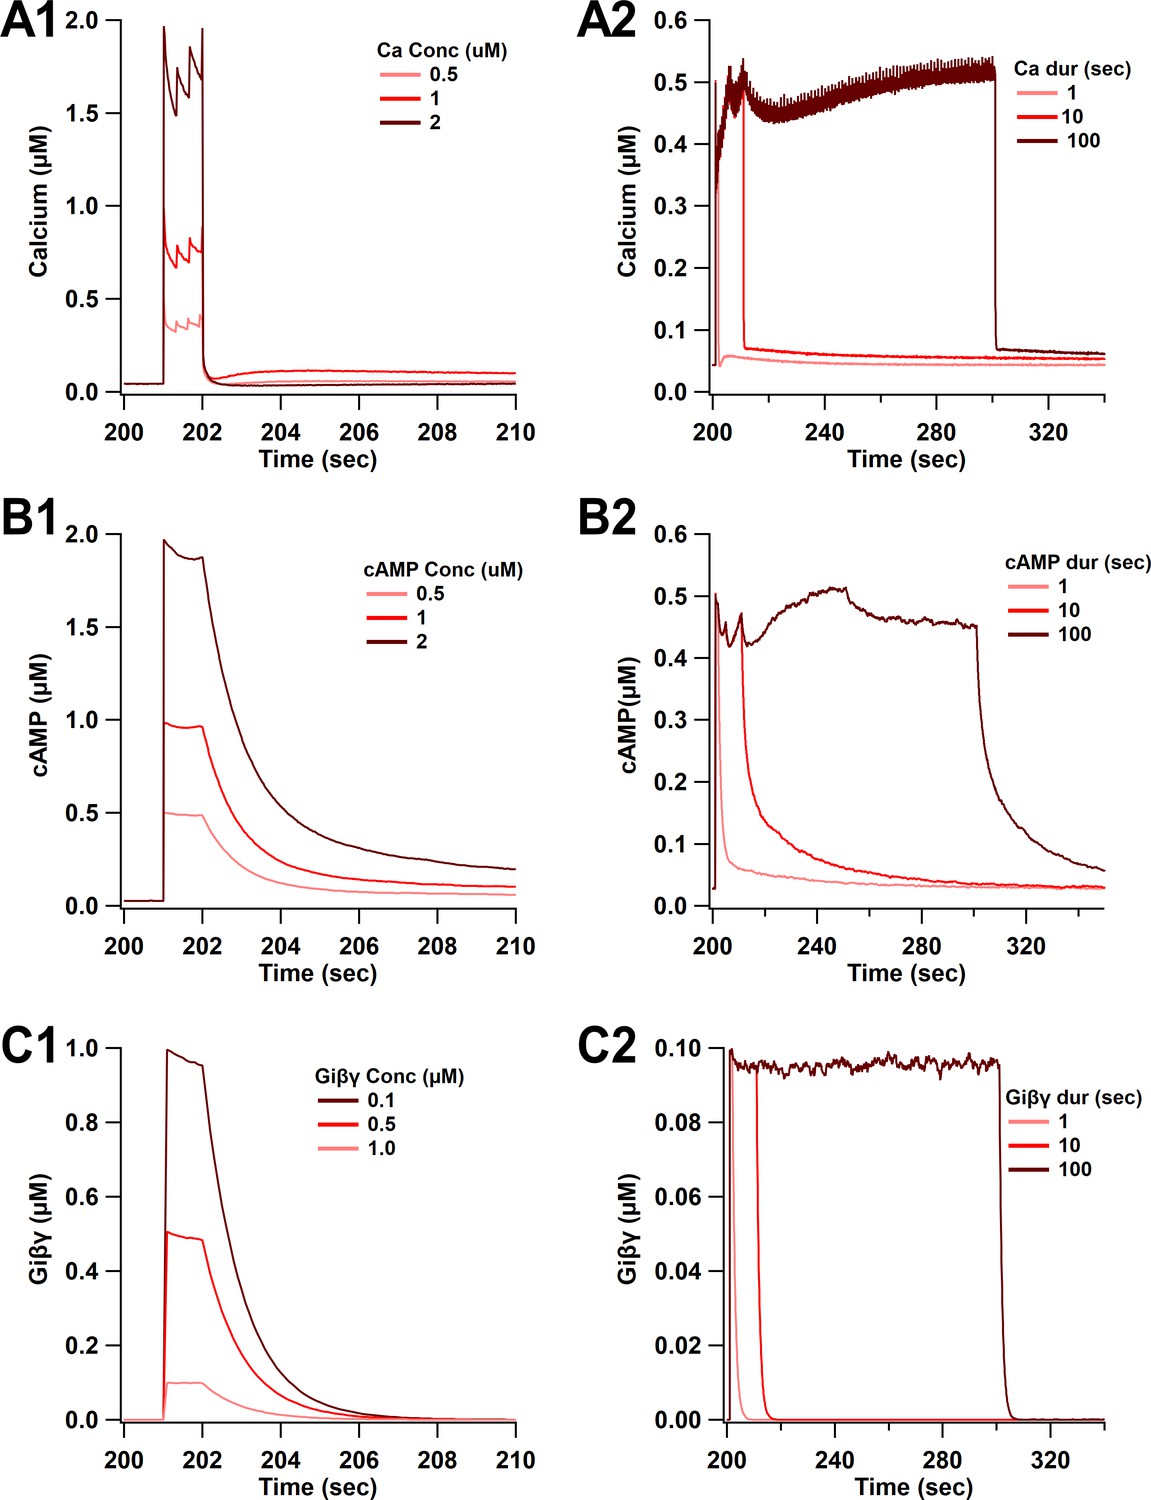
Time course of synaptic inputs for single-pulse simulations.
(A) Calcium concentration. (A1) Three different concentrations of 1 s duration. (A2) Three different durations of 0.5 µM concentration. (B) cAMP concentration. cAMP decay is slower than calcium decay as observed experimentally. (B1) Three different concentrations of 1 s duration. (B2) Three different durations of 0.5 µM concentration. (C) Giβγ concentration. (C1) Three different concentrations of 1 s duration. (C2) Three different durations of 0.5 µM concentration.
Figure 4

Nonlinear activation of ERK by calcium pathway.
(A) Time course shows a sustained ppERK when calcium is above amplitude threshold (2 μM) for 1 s duration. (B) Total ppERK activity over time in response to different calcium concentrations (for 1 s) and different calcium durations (with a concentration of 0.5 μM) reveals ultrasensitive response. (C) With CaMKII activity blocked, RasGRF is the sole calcium-activated pathway to ERK activation. ERK activation is no longer ultrasensitive. (D) pCaMKII and ppERK activities in response to 0.5 μM for 30 s of calcium decrease with increased PP1. Similar results were observed with different concentrations or duration. (E) Increasing PP1 quantity decreases the steepness of ppERK vs duration (log10) curve. (F) Total ERK activity changes with SynGap availability. Blocking dispersion of SynGAP reduces ppERK, whereas allowing CaMKII to bind but not phosphorylate SynGAP enhances ppERK. (G) Ratio of ppERK to basal ppERK in response to calcium activation of RasGRF or SynGap alone (0.5 µM calcium for 30 s), compared with control (SynGap + RasGRF).
Figure 5
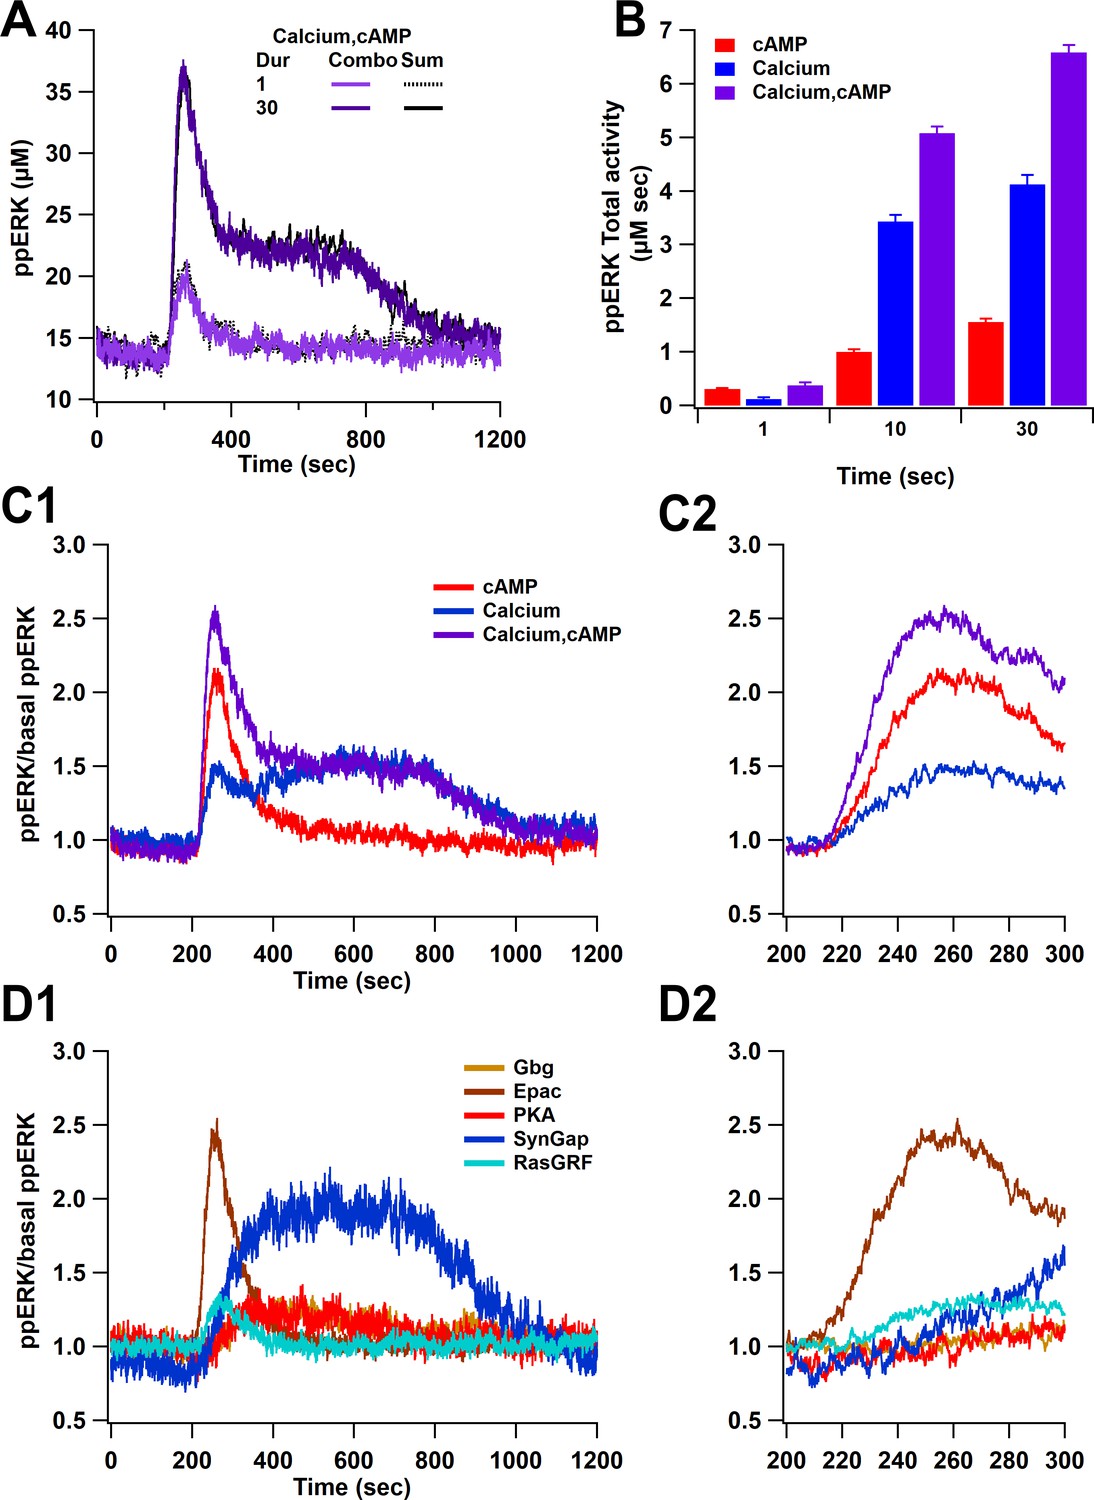
Overall ppERK response is a linear combination of response to calcium and cAMP.
(A) Time course of ppERK response to calcium and cAMP. Calcium in combination with cAMP traces overlaps with the sum of the single pathway responses for both short and long duration stimuli. Two-way ANCOVA (analysis of covariance) of ppERK AUC versus stimulation characteristics (duration) and type (combination versus summation) as factors (N=5 in each group) is significant for both stimulation but not type (F (2,47) = 65.55, P(dur) < 0.0001, T(stim) = 11.41, P(type) = 0.35, T(type) = −0.945). (B) Summary of ppERK AUC versus duration shows that the fraction of ppERK produced by calcium pathways increases with duration of the stimulation. (C) Dynamics of ppERK, relative to basal ppERK, in response to cAMP (0.5 µM cAMP and 0.1 µM Giβγ for 30 s), calcium (0.5 µM for 30 s), or combination. ppERK increases transiently with cAMP, with a delay in response to calcium and is higher with combination (calcium and cAMP ). (D) Dynamics of single pathways. Ratio of ppERK to basal ppERK in response to PKA (0.5 µM cAMP), Epac (0.5 µM cAMP), Giβγ (0.1 µM), RasGRF (0.5 µM calcium), and SynGap (pCaMKII feedforward loop; 0.5 µM calcium) for 30 s. Epac and RasGRF produce transient ppERK, whereas PKA, Giβγ, and SynGap produce transient and delayed ppERK. C2 and D2 expand the first 100 s after stimulation of C1 and D1, respectively.
Figure 6 with 1 supplement
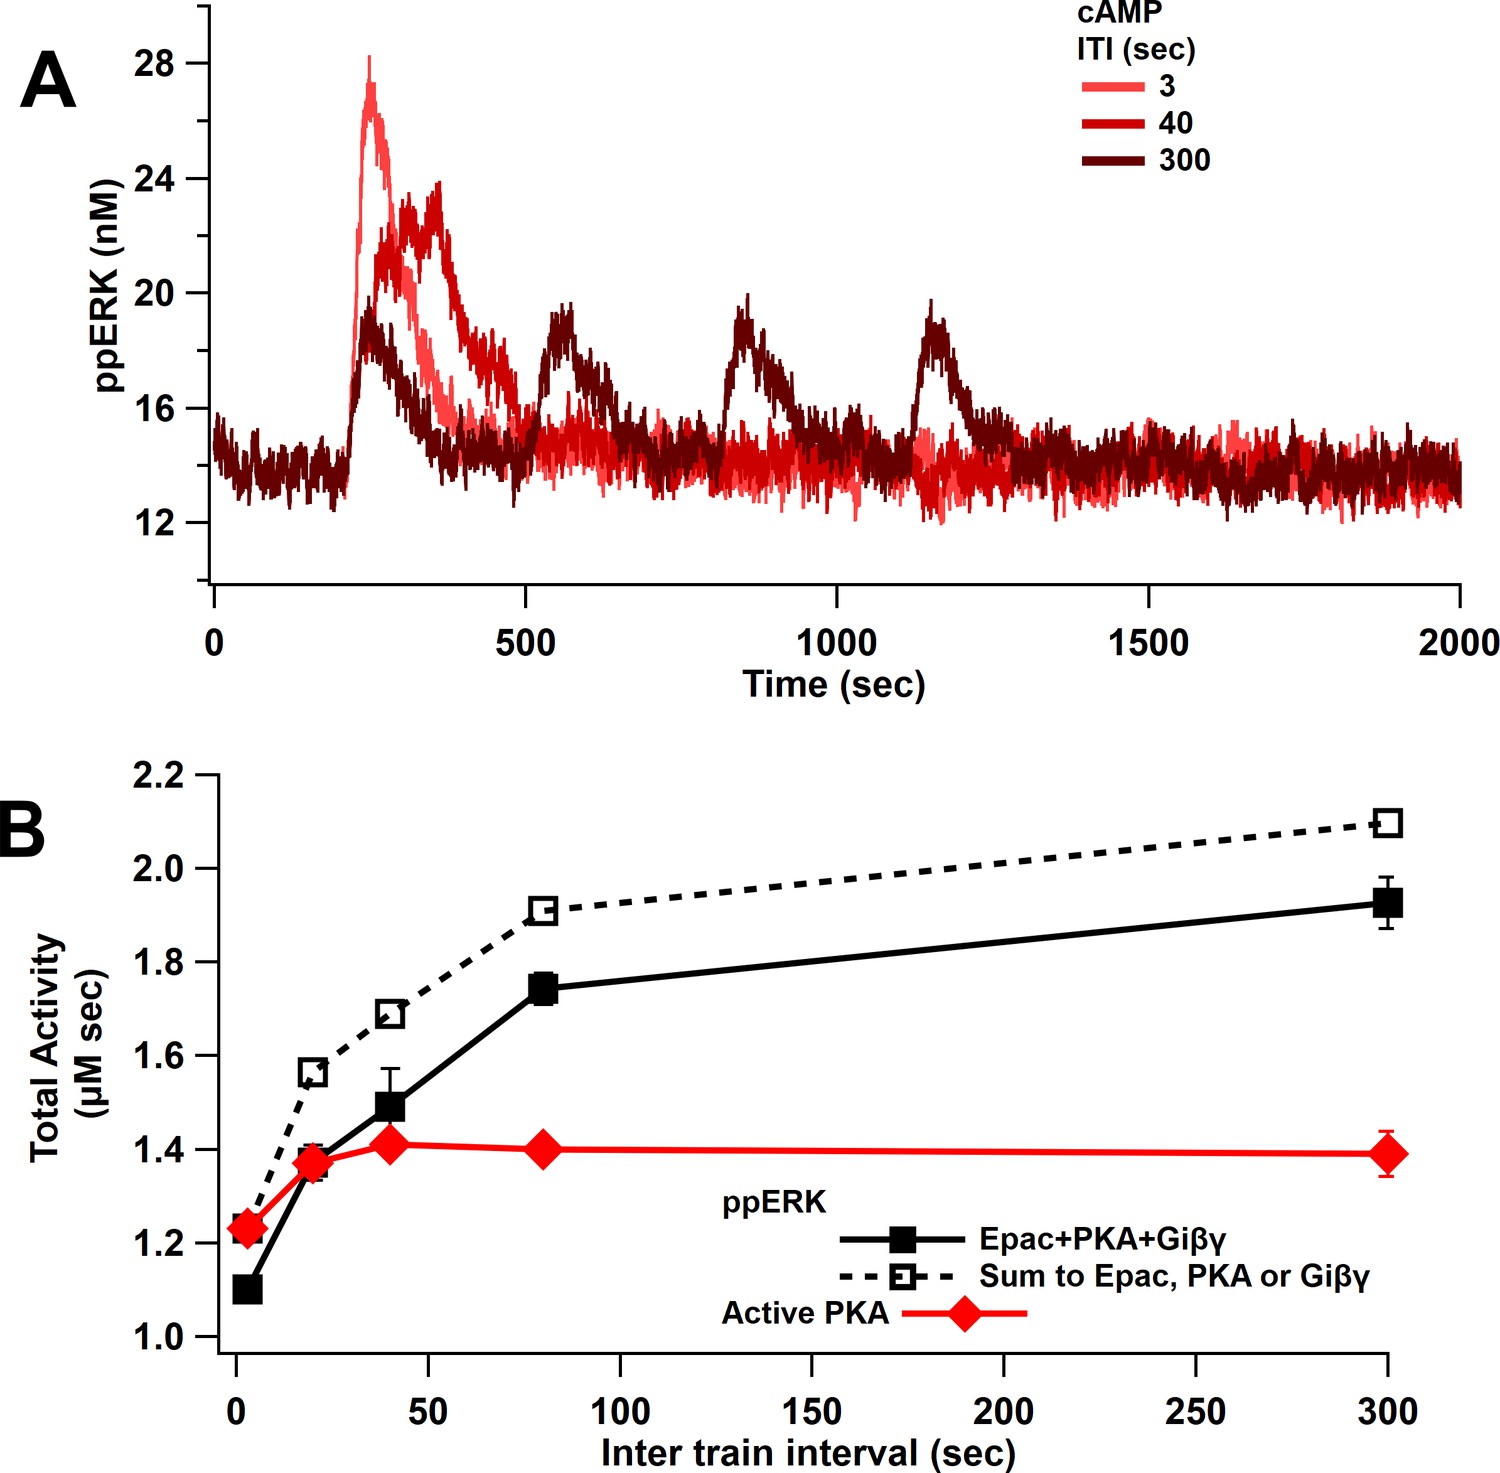
ppERK favors spaced stimuli in response to cAMP input.
(A) Time course of ppERK in response to 4 trains of 100 Hz stimuli of cAMP (Epac, PKA, Giβγ pathways). ppERK peak amplitude decreases with ITI, but the AUC increases with ITI. (B) Total kinase activity in response to cAMP shows that ppERK exhibits sublinear response to cAMP stimuli: the sum (dashed line) is higher than ppERK in response to combination (solid black line). PKA and ppERK have similar temporal sensitivity, favoring spaced stimuli. Two-way ANCOVA (analysis of covariance) of ppERK AUC versus stimulation characteristics (ITI) and type (combination versus summation) as factors (N = 5 in each group) is significant for both stimulation ITI and type (F (2,47) = 42.25, T < 0.0001; T(ITI) = 4.67, P(ITI) < 0.0001, T(type) = 7.92, P(type) < 0.0001).
Figure 6—figure supplement 1
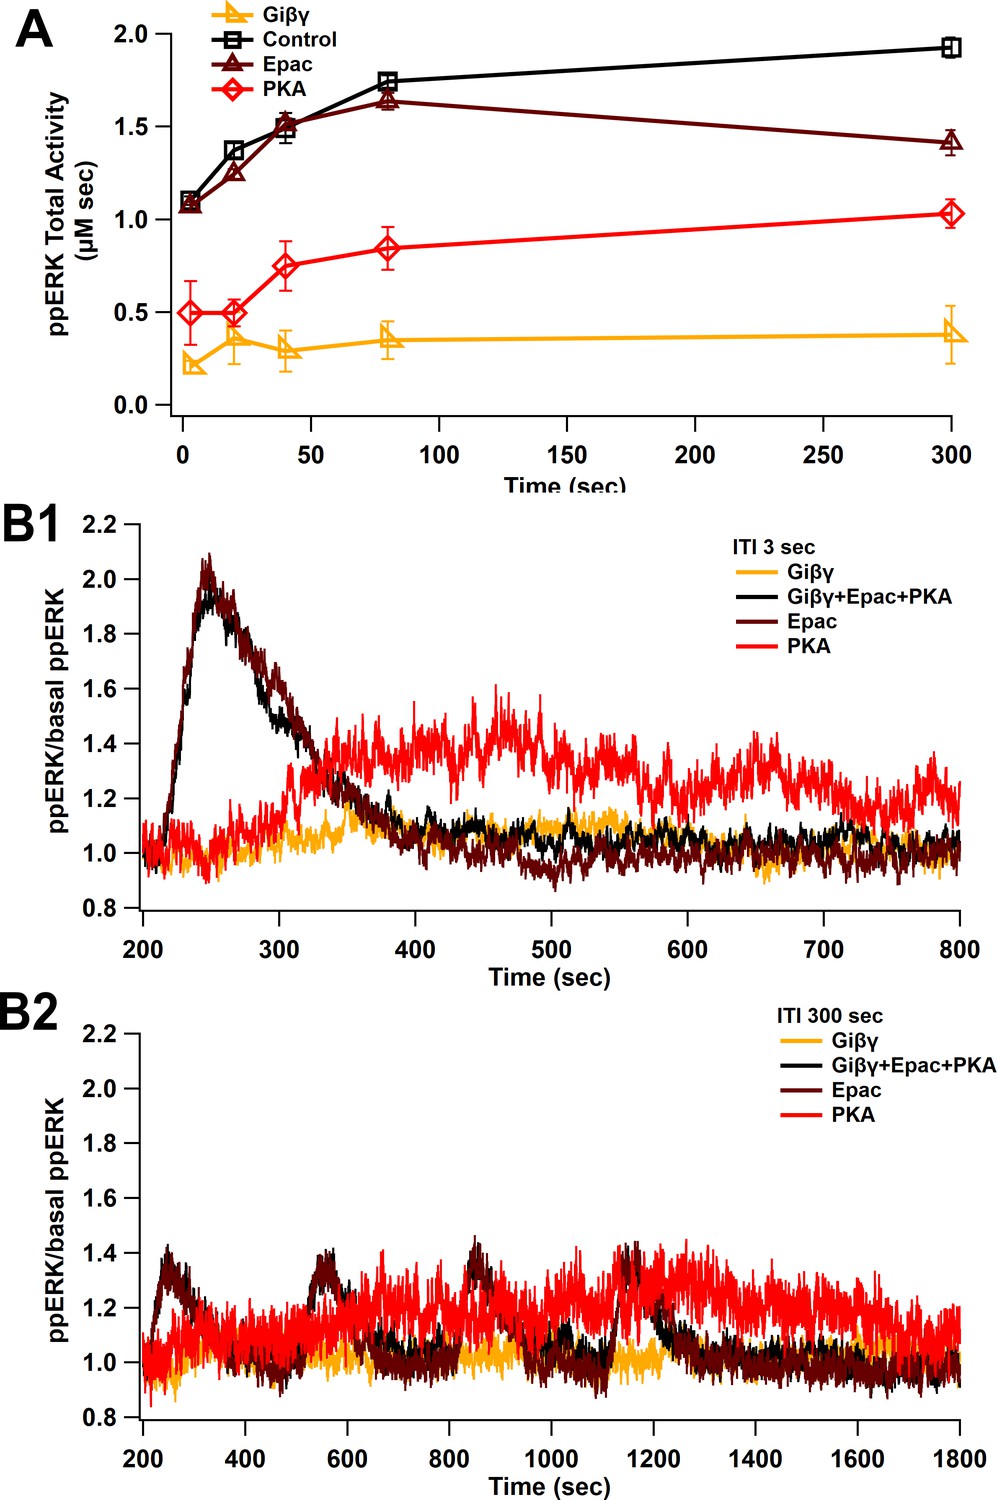
Uniform ppERK temporal sensitivity within cAMP pathways.
(A) The model is stimulated using L-LTP patterns of input with only a single cAMP pathway active, either Epac, PKA, or Giβγ. Total ppERK versus ITI follows a similar pattern for all pathways, though Epac contributes more, especially for short intertrain intervals. (B) Time courses of cAMP pathways at 3 (B1) and 300 (B2) s ITI. Epac pathway contributes more to ppERK with 3 s (short) ITI, while PKA contributes more with 300 s (spaced) ITI.
Figure 7 with 2 supplements

ppERK favors spaced stimuli in response to calcium input, in contrast to temporal sensitivity of CaMKII.
(A) Time course of ppERK in response to four trains of 100 Hz calcium stimuli (1 μM concentration) shows sustained and prolong ppERK with 3 and 40 s ITI. (B) ppERK AUC changes with PP1 quantity, but still is highest for spaced ITIs. (C) Increasing PP1 quantity or lowering calcium concentration makes CaMKII more sensitive to shorter ITIs.
Figure 7—figure supplement 1
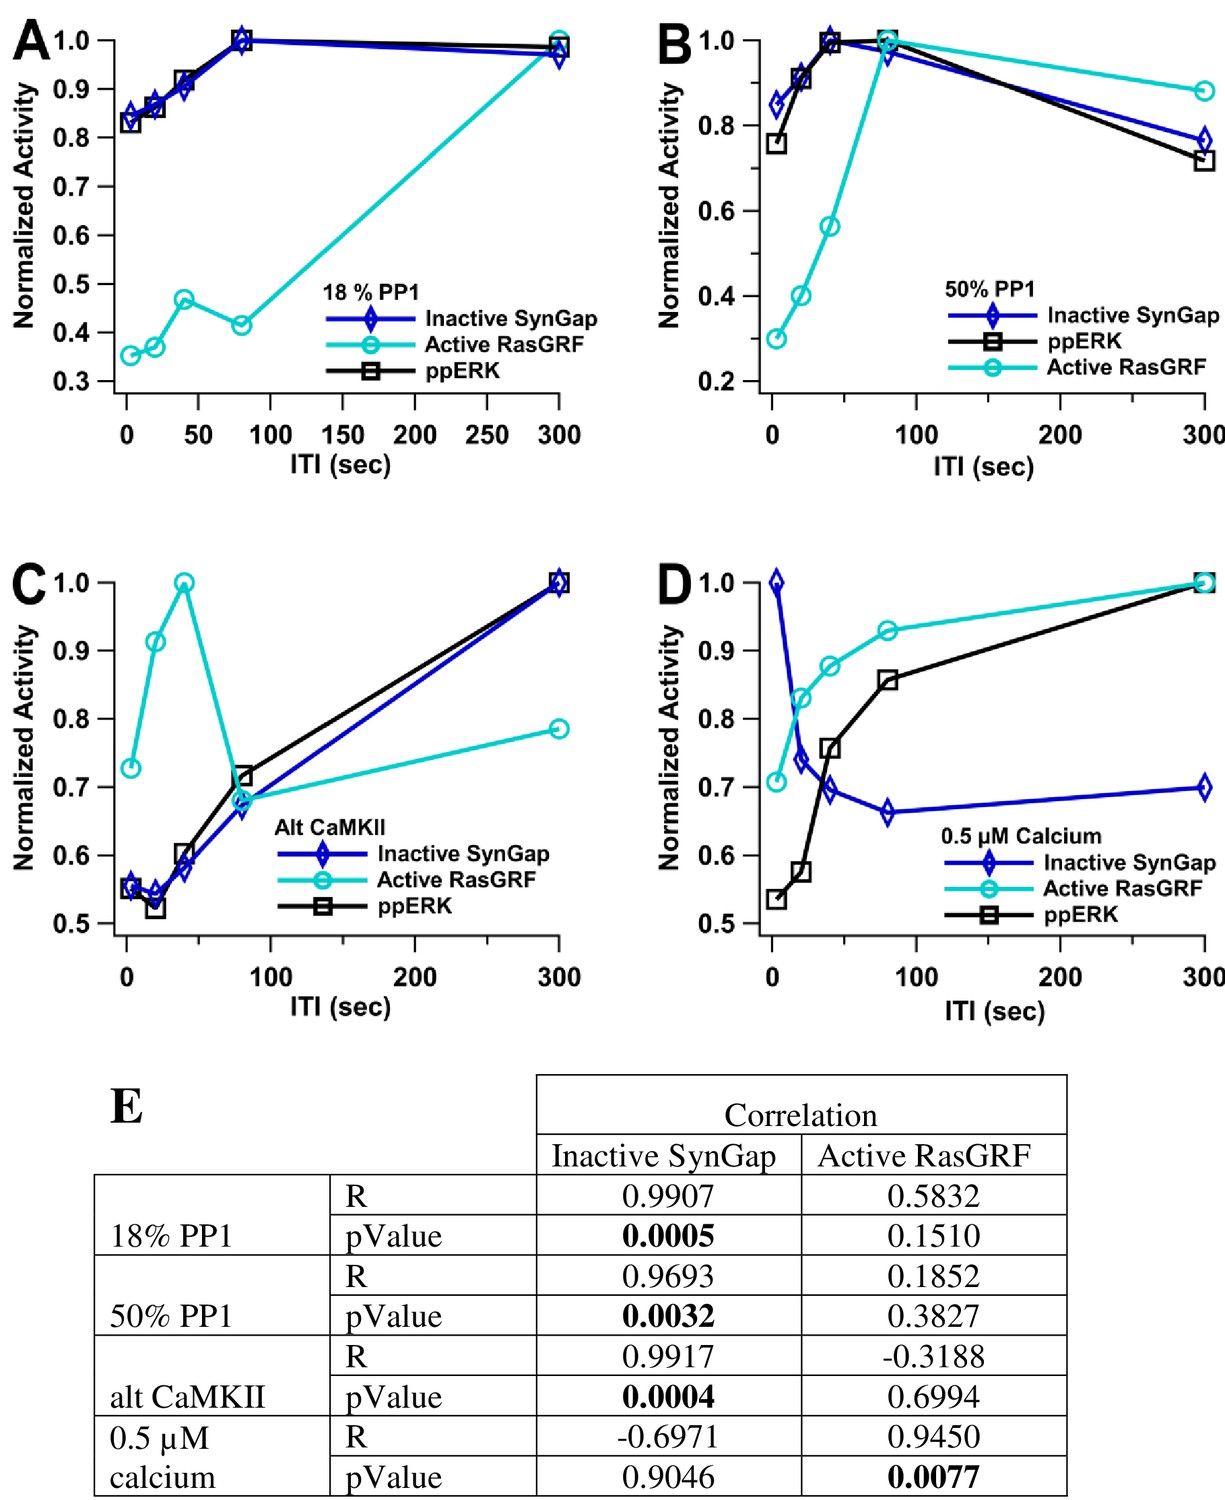
ppERK temporal sensitivity is similar to that of inactive SynGap.
Normalized activity is the total activity divided by the maximum total activity (over all ITI). Inactive SynGap is the SynGap bound to pCaMKII or dispersed to the dendrite. Active RasGRF is the RasGRF bound to calmodulin. The model is simulated using L-LTP patterns of input. (A, B) Using 1 µM calcium, temporal sensitivity of ppERK is similar to inactive SynGap regardless of PP1 quantity. (C) temporal sensitivity of ppERK is similar to inactive SynGap using alternative CaMKII model (D). Temporal sensitivity of ppERK matches active RasGRF more than inactive SynGap with low calcium concentration. (E). Pearson's R correlation was calculated between ppERK and SynGap or RasGRF. Correlation coefficients (R) demonstrate that the temporal pattern of ppERK is highly correlated with the temporal pattern of inactive SynGap, except with low calcium, in which case it is highly correlated with the temporal pattern of RasGRF.
Figure 7—figure supplement 2
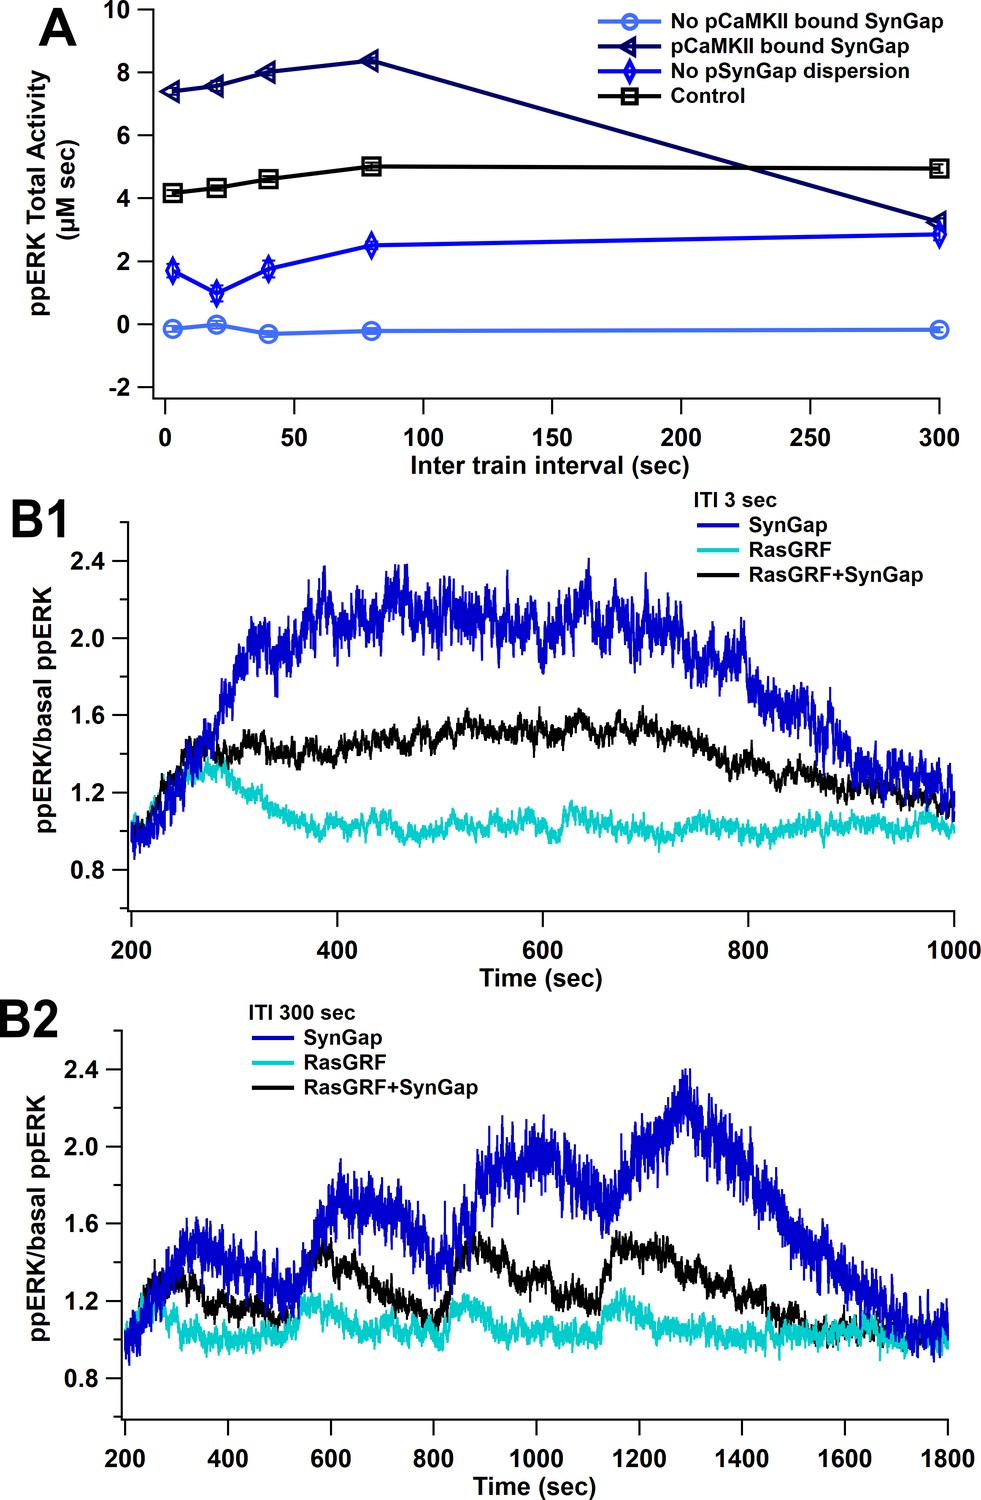
SynGap availability controls the magnitude of ppERK during L-LTP induction.
The model is simulated using L-LTP patterns of input with 1 µM calcium. (A) Blocking dispersion of pSynGap to the dendrite or blocking CaMKII catalytic activity (pCaMKII bound SynGap) reduces ppERK, whereas allowing CaMKII to bind (but not phosphorylate) SynGap (No pCaMKII bound SynGap) enhances total ERK activity. (B) Time course of ppERK produced by calcium pathways at 3 (B1) and 300 (B2) s ITI. ERK activation by SynGap is enhanced and delayed when RasGRF is blocked.
Figure 8 with 4 supplements
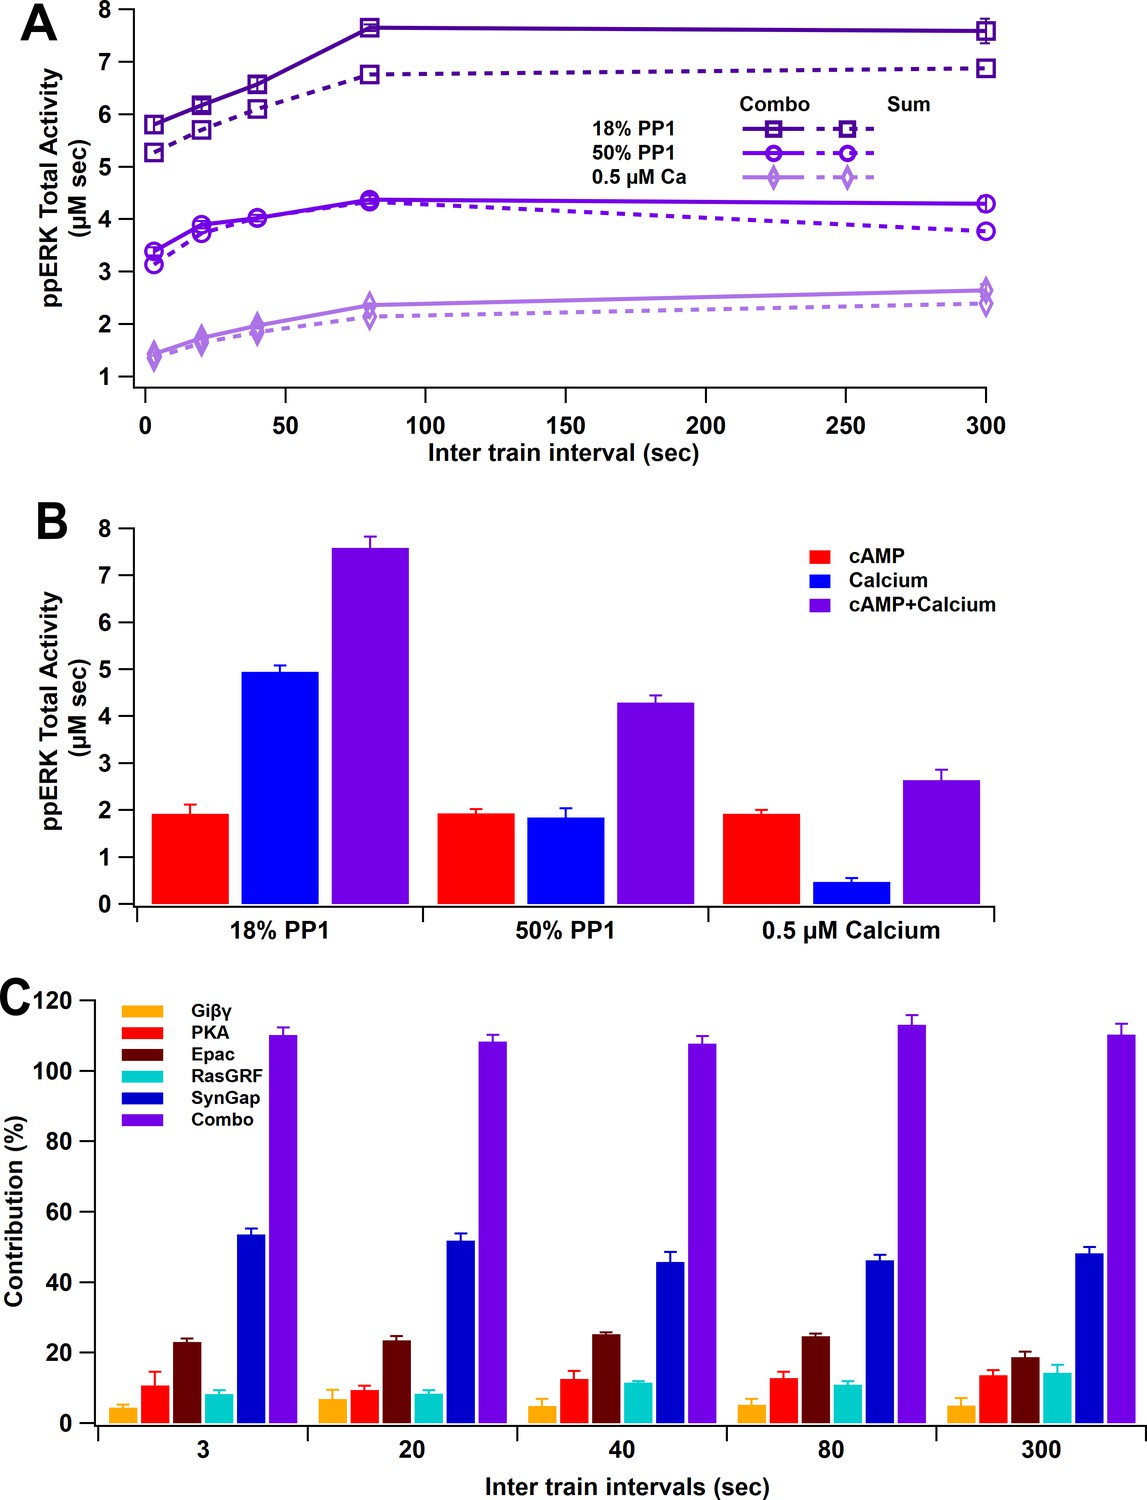
ppERK integration of calcium and cAMP inputs can be linear or supralinear.
(A) ppERK mostly increases with temporal interval, with the greatest quantity occurring at 80 s (above calcium threshold or 18% PP1) or 300 s (below calcium threshold). Supralinear summation occurs at 18% PP1 and linear summation occurs at low calcium or high PP1 – conditions that reduce ultrasensitivity of CaMKII (Figure 3E). Supralinearity is indicated by the response to the combination of cAMP and calcium (Combo) being greater than the sum of responses to calcium and cAMP separately. ANCOVA results are in Table 5. (B) Summary of ppERK total activity in response to 300 s ITI. The contribution of the calcium pathway relative to the cAMP pathway is greatest when calcium is above threshold for an ultrasensitive CaMKII response. (C) Qualitative single pathway contribution to ppERK (ppERK from single pathway divided by ppERK from all pathways; sum of pathways exceeds 100%). The contribution of SynGap decreases with ITI, whereas other pathways increase with ITI.
Figure 8—figure supplement 1
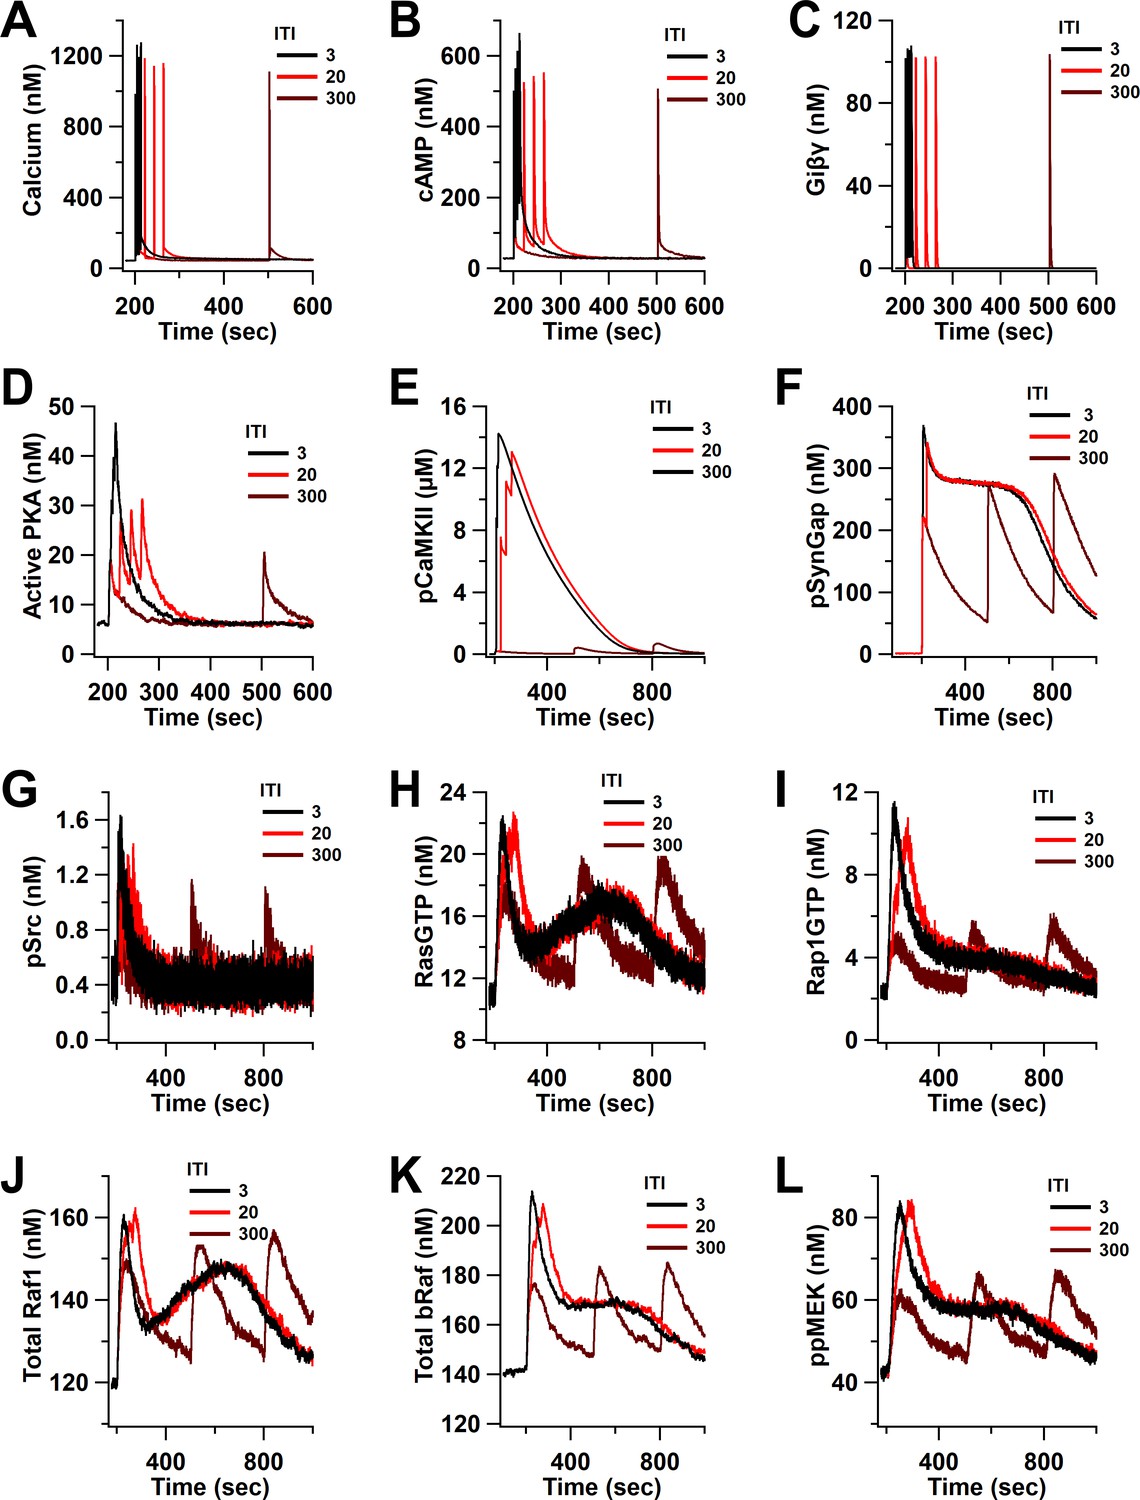
Time course of inputs and key molecules upstream of ERK in response to four trains separated by 3, 20, and 300 s.
(A) calcium, (B) cAMP, (C) Giβγ, (D) active PKA, (E) phosphorylated CaMKII, (F) phosphorylated SynGap, (G) phosphorylated Src, (H) RasGTP, (I) Rap1GTP, (J) total active Raf1, (K) total bRaf, (L) ppMEK.
Figure 8—figure supplement 2
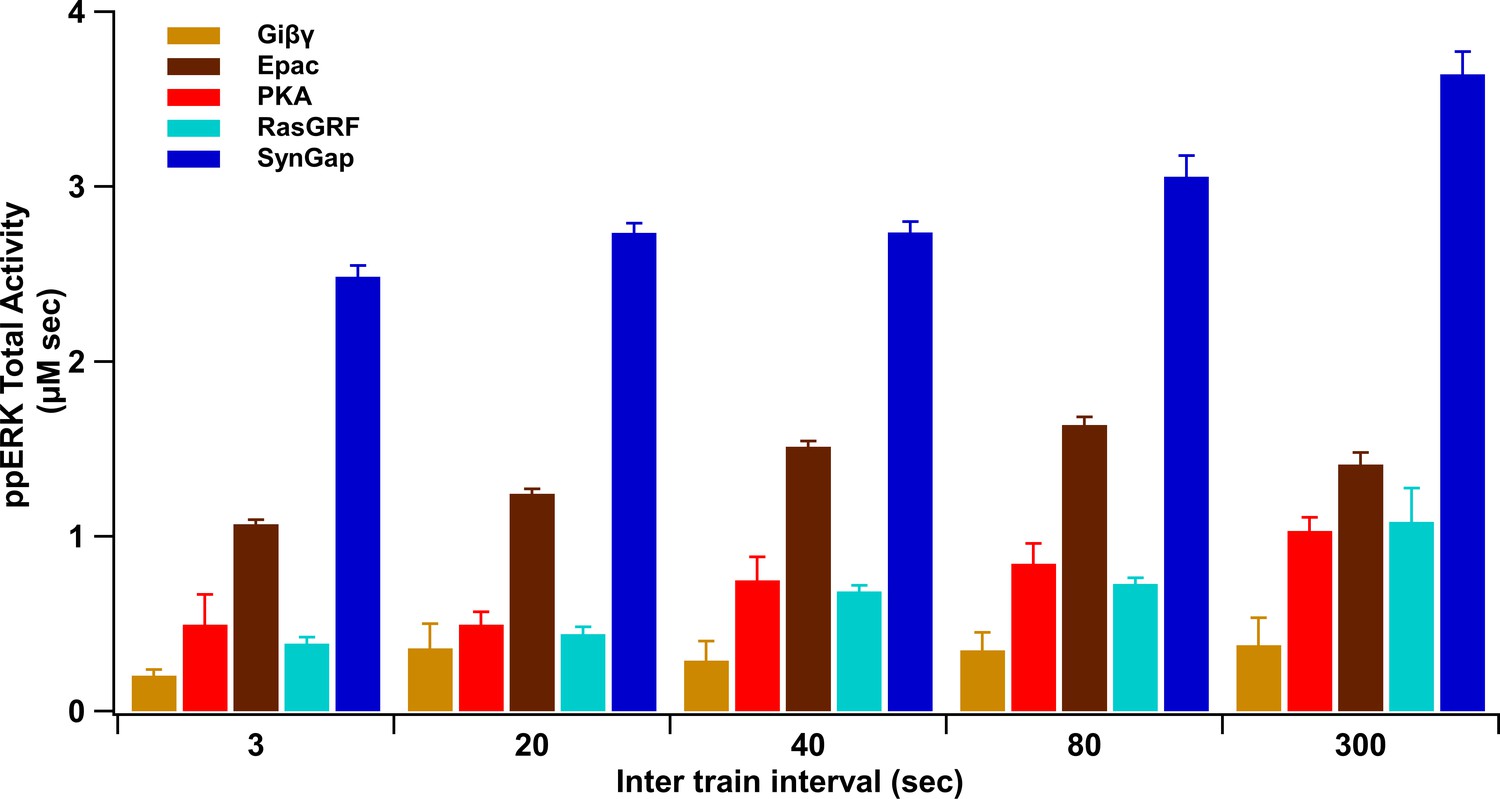
Summary of ppERK total activity in response to each pathway.
ppERK increases with ITI for all pathways, though SynGap does not increase as sharply, reducing its relative contribution.
Figure 8—figure supplement 3
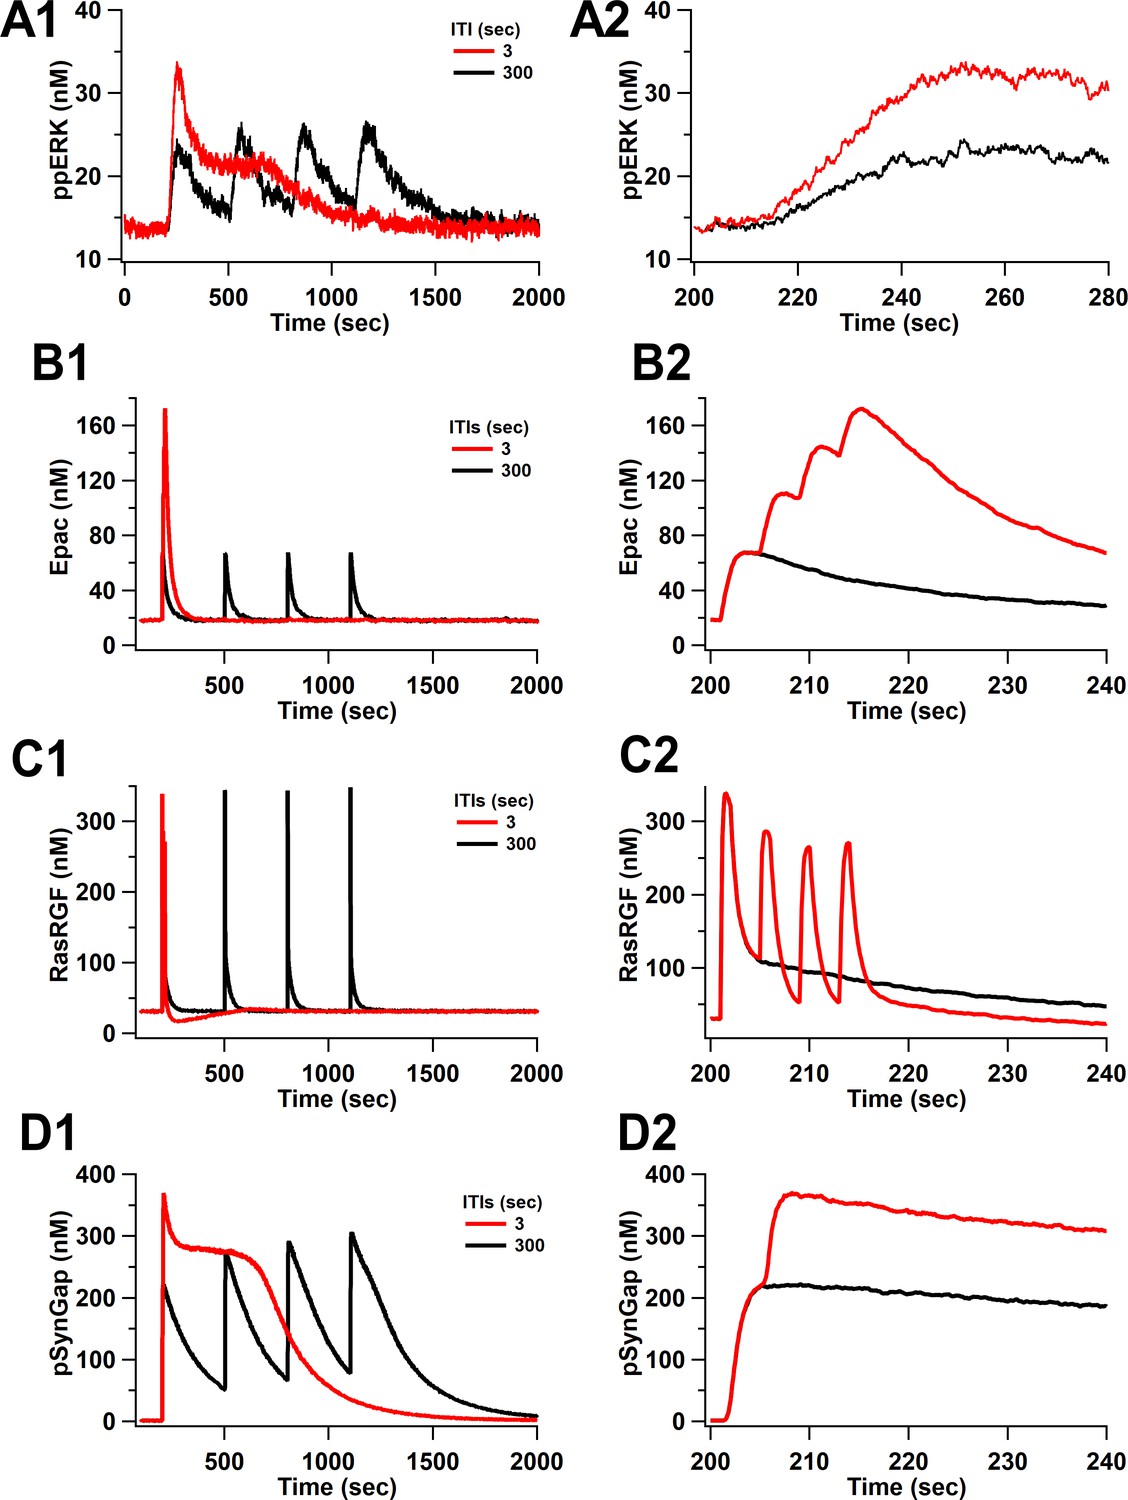
Time courses of ppERK and key molecules upstream of ERK in response to four trains of 100 Hz separated by 3 and 300 s.
Time course of (A) ppERK, (B) active Epac, (C) active RasGRF, and (D) phosphorylated SynGap . (A2–D2) represent the first 140 s after stimulation of (A1–D1), respectively.
Figure 8—figure supplement 4
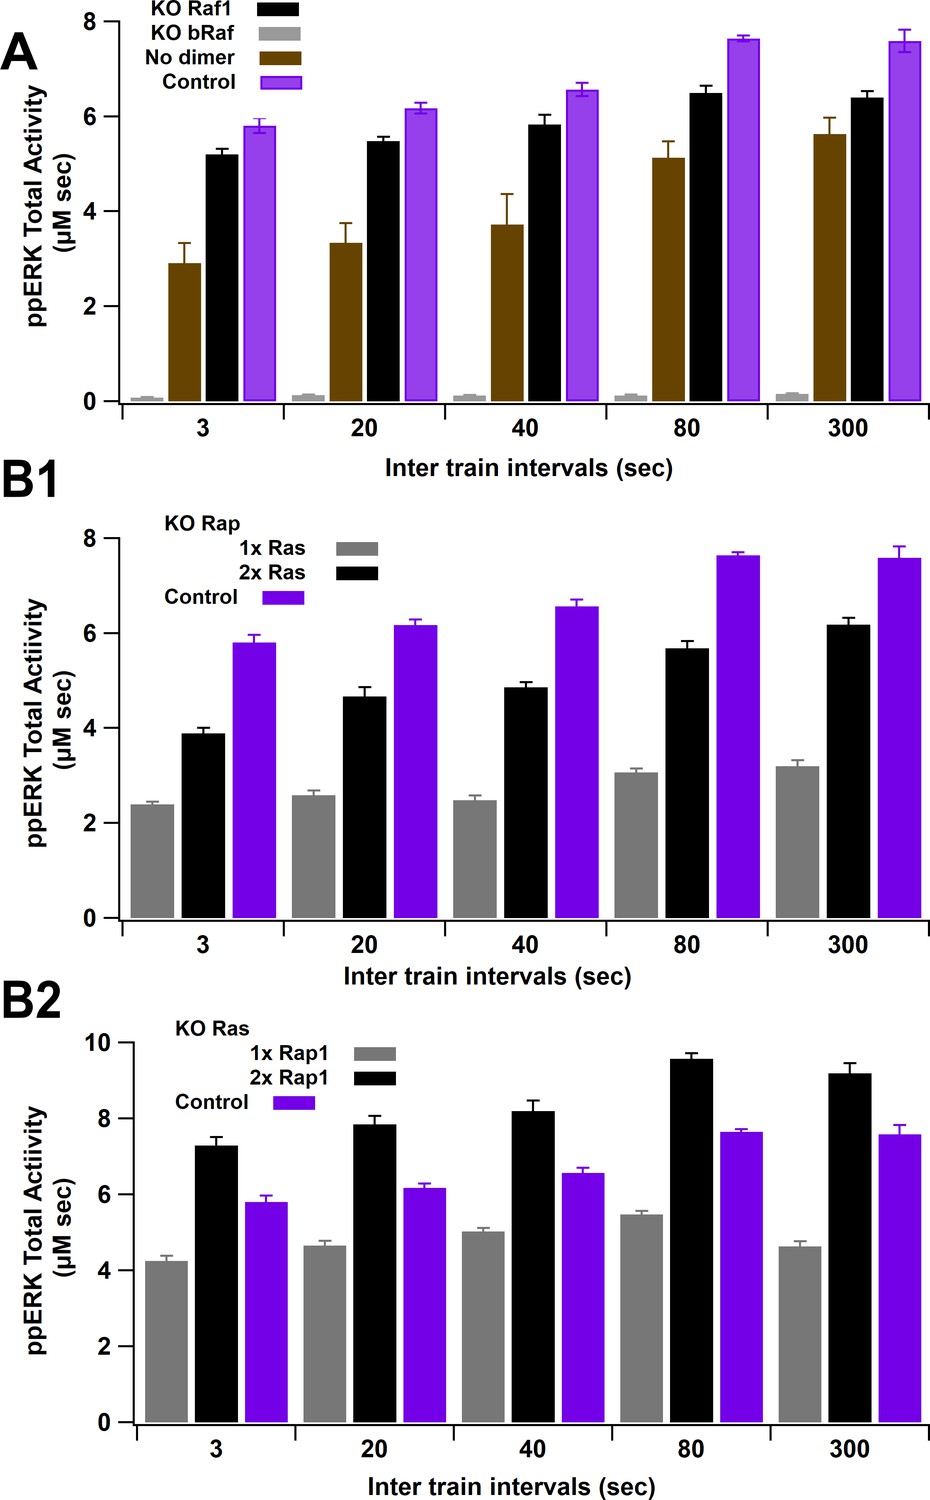
ERK activity versus ITI for several knockout experiments.
(A) Total ppERK activity in response to L-LTP stimuli under Raf1, bRaf, or Raf1 dimerization knockout (KO). bRaf is the greatest contributor, as observed experimentally. Eliminating dimerization enhances reduces ERK activation mostly for lower intertrain intervals; thus, the enhanced activity of Raf1 dimers reduces temporal sensitivity of ppERK. (B) Total ppERK activity in response to L-LTP stimuli under Rap1 (C1) and Ras (C2) knockout. Rap1GTP is the main contributor to ppERK, as observed experimentally.
Figure 9 with 1 supplement
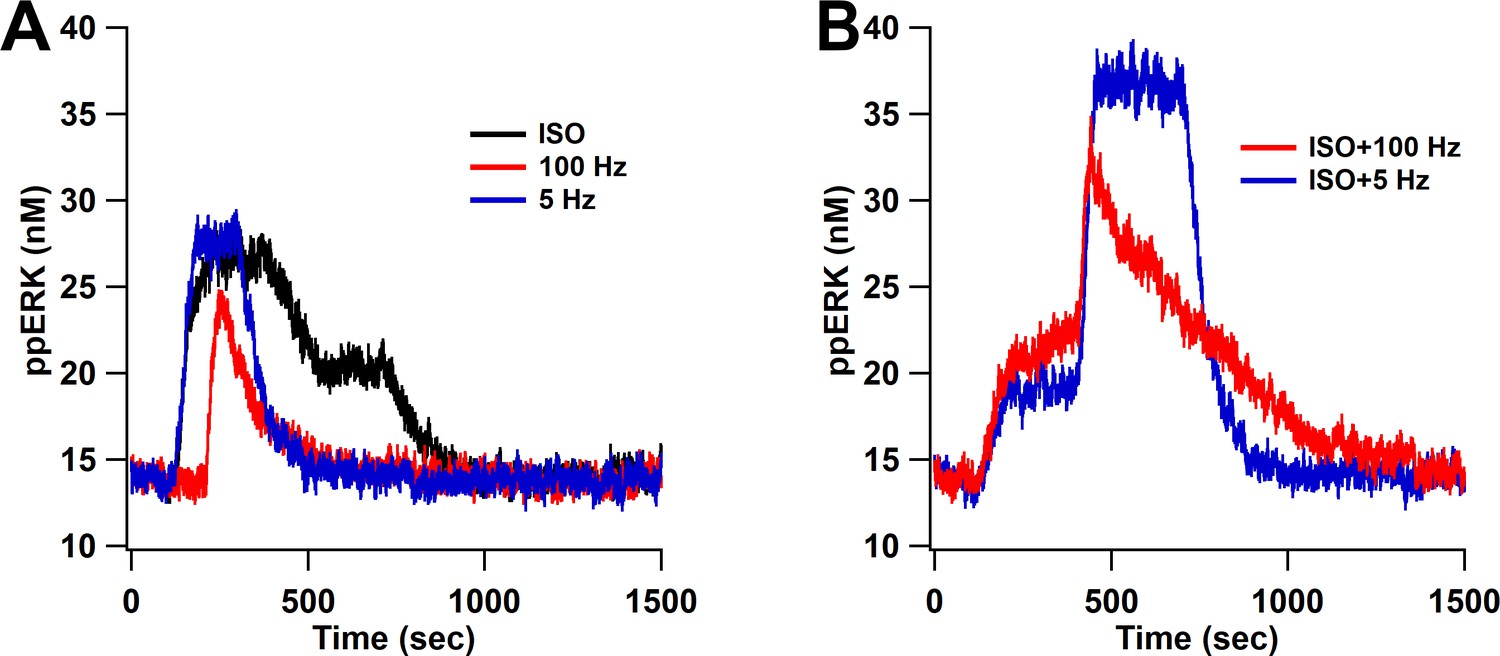
ppERK predicts the occurrence of L-LTP when bath-applied ISO is followed by either 1 s of 100 Hz stimulation or 180 s of 5 Hz.
ppERK in response to isoproterenol (ISO), 1 s of 100 Hz, or 180 s of 5 Hz does not exceed 30 nM (A), whereas ppERK reaches or exceeds 35 nM in response to the combination of isoproterenol and either 100 Hz or 5 Hz stimulation (B).
Figure 9—figure supplement 1
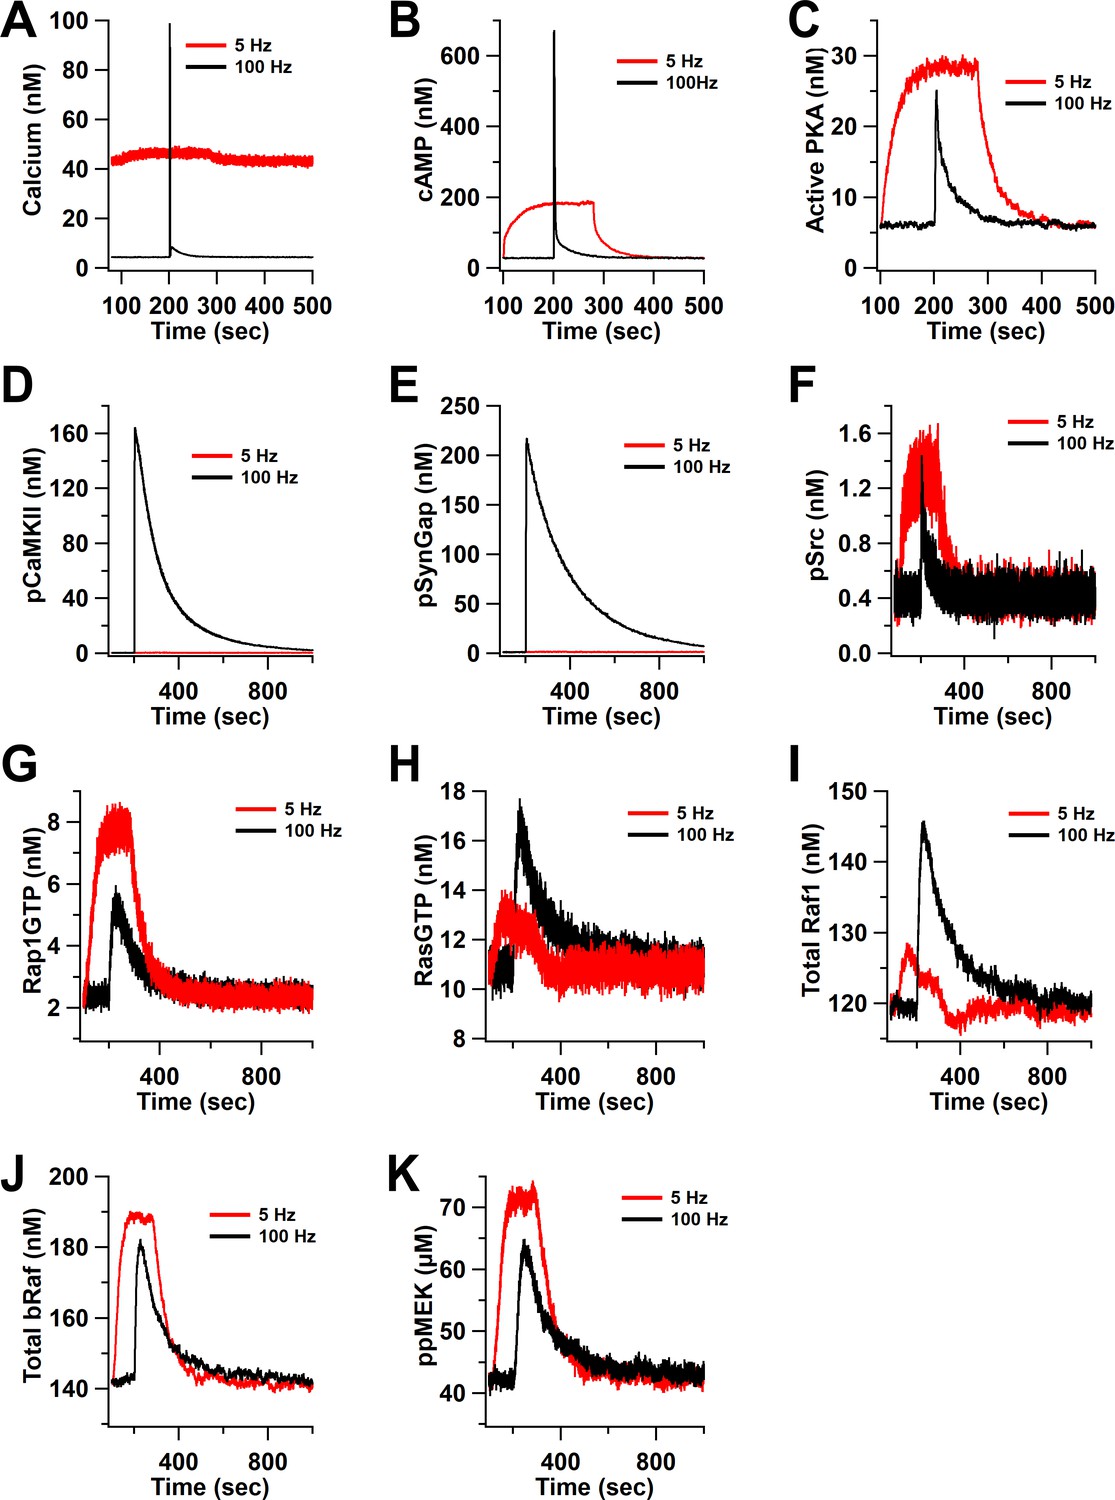
Time course of inputs and key molecules upstream of ERK in response to ISO followed by 100 Hz or 5 Hz stimulation.
(A) calcium, (B) cAMP, (C) active PKA, (D) phosphorylated CaMKII, (E) phosphorylated SynGap, (F) phosphorylated Src, (G) RasGTP, (H) Rap1GTP, (I) total active Raf1, (J) total bRaf, (K) ppMEK .
Figure 10
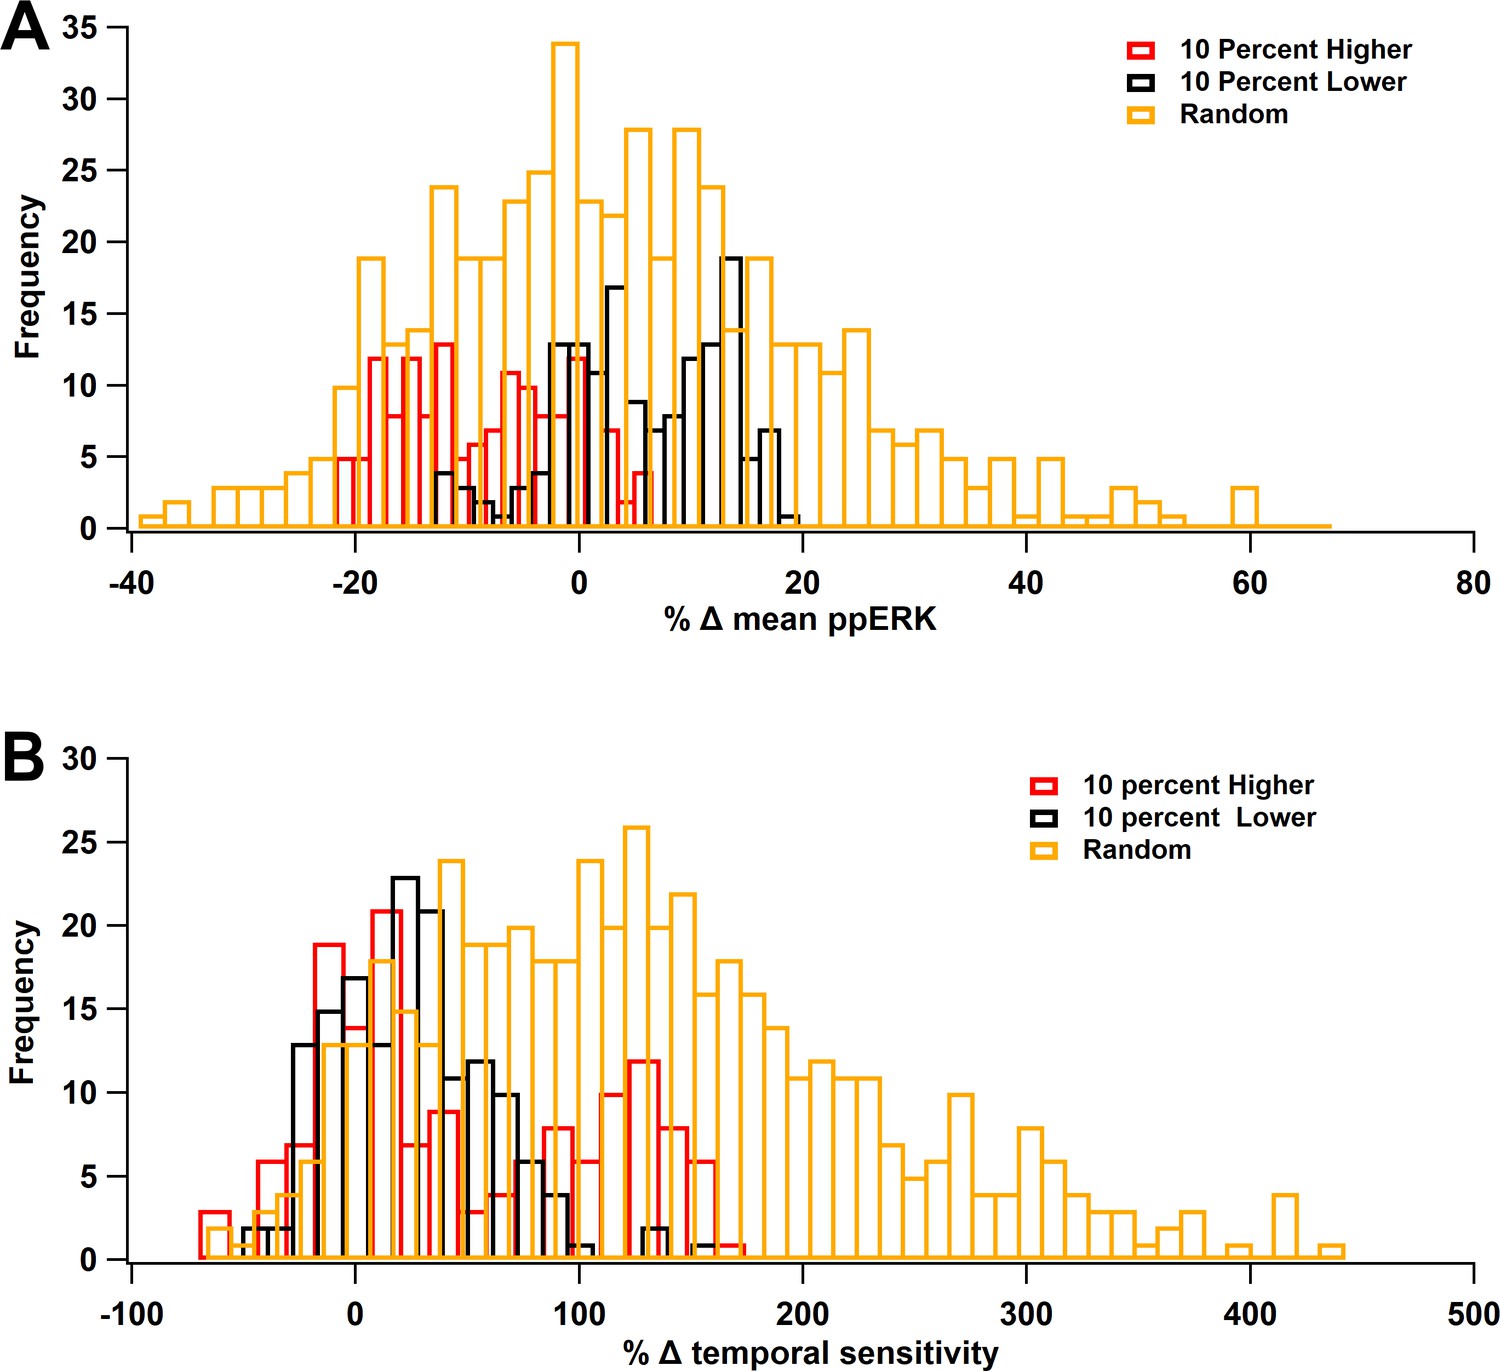
ERK Temporal sensitivity is robust to parameter variations.
Molecule concentrations were changed individually by either +10% (red) or −10% (black) or the set of concentrations was changed randomly, within ±10% (gold). (A) Percent change in mean ppERK, averaged across all 5 ITIs. (B) Percent change in temporal sensitivity. Most variations increased temporal sensitivity.
Tables
Table 1
Single pathway experiment.
| Input | Amplitude protocol (µM) | Duration protocol (s) |
|---|---|---|
| Calcium | 1 s: 0.2, 0.3, 0.5, 1, 1.5, 2, 5 | 0.5 µM: 1, 2, 4, 5, 6, 8, 10, 30, 100 1 µM: 1, 4, 100 |
| cAMP | 1 s: 0.1, 0.2, 0.5, 1, 1.5, 2 | 0.1 µM: 1, 4, 10, 30, 100 0.5 µM: 1, 4, 10, 30, 100 |
| Giβγ | 1 s: 0.005, 0.03, 0.1, 0.5 | 0.03 µM: 1, 4, 10, 30, 100 0.1 µM: 1, 4, 10, 30, 100 |
Table 2
Regression analysis results for cAMP pathway.
AIC: Akaike information criteria, lower values indicate better models. If adjusted R2 for linear is less than 0.9, then the best model is determined by AIC.
| Giβγ | cAMP | Calcium | |||||
|---|---|---|---|---|---|---|---|
| Dur | Conc | Dur | Conc | Dur | Conc | ||
| Adjusted R2 | Linear | 0.832 | 0.827 | 0.951 | 0.937 | 0.486 | 0.675 |
| log | 0.880 | 0.787 | 0.957 | 0.815 | 0.955 | 0.604 | |
| Hill | 0.922 | 0.913 | 0.969 | 0.964 | 0.970 | 0.989 | |
| AIC | Linear | −1.112 | −8.266 | −10.181 | −52.828 | 166.225 | 99.958 |
| log | 10.196 | 24.022 | 13.458 | 13.710 | 107.598 | 127.772 | |
| Hill | −28.406 | −38.033 | −48.562 | −48.911 | −86.367 | −101.415 | |
| Conclusion | Non-linear | Non-linear | Linear | Linear | Non-linear | Non-linear | |
Table 3
Knockout experiment.
Rate constant names are shown in Figure 1A,B. Block lists the rate constant whose value is set to zero.
| Input | Block | Effect/molecular dependence |
|---|---|---|
| Calcium 2000 nM for 1 s | KCK | CaMKII is activated but cannot autophosphorylate itself, thus RasGRF is the only contributor |
| KSyn1 | pCaMKII is unable to bind to SynGap | |
| KSyn2 | pCaMKII binds to SynGap but is unable to phosphorylate SynGap | |
| KSyn3 | SynGap is phosphorylated but is unable to disperse to the dendrite | |
| cAMP 500 nM for 30 s | KEpac | Epac binds cAMP but cannot activate Rap1GDP, thus PKA is the only contributor |
| KPKA | Final step of PKA pathway activation of Rap1GDP is blocked, thus Epac is the only contributor |
Table 4
PP1 concentration influences ppERK quantity and ultrasensitivity.
The calcium duration producing half-maximal ppERK AUC and the sensitivity to duration were estimated by fitting a hill equation to ppERK AUC vs calcium duration. Values shown are parameter estimates ± standard deviation of the estimate. Width at half max: the calcium duration at half-maximal ppERK.
| Pp1 (%) | Width at half max | Hill coefficient |
|---|---|---|
| 10 | 6.0 ± 1.07 | 4.1 ± 1.5 |
| 18 | 6.7 ± 1.53 | 2.5 ± 1.1 |
| 50 | 9.9 ± 5.28 | 1.4 ± 1.1 |
Table 5
Two-way ANCOVA (analysis of covariance) results for ppERK AUC versus stimulation characteristics (ITI) and type (combination versus summation) as factors (N = 5 in each group).
| cAMP+Giβγ+calcium | |||
|---|---|---|---|
| 0.5 µM ca | 18% PP1 | 50% PP1 | |
| F (2,47) | 43.56 | 28.28 | 3.99 |
| P (ITI) | <0.0001 | <0.0001 | 0.023 |
| T (ITI) | 9.11 | 6.43 | 2.36 |
| P (type) | 0.05 | <0.0001 | 0.13 |
| T (type) | −2.04 | −3.90 | −1.56 |
| Conclusion | Significant for stim only | Significant for both type and stim | Significant for stim only |
Table 6
Count of best ITIs.
Count of preferred ITIs in robustness simulations, using either single-molecule changes of ±10% or random changes (between +10% and −10%) to all molecules. 80% of the parameter variations yield optimal ppERK in response to spaced stimulation (ITI = 80 or 300 s).
| ITIs | Random | 10% lower | 10% higher | Total percent |
|---|---|---|---|---|
| 3 | 38 | 0 | 0 | 4.69 |
| 20 | 46 | 0 | 1 | 5.80 |
| 40 | 81 | 3 | 1 | 10.49 |
| 80 | 154 | 112 | 51 | 39.14 |
| 300 | 181 | 40 | 102 | 39.88 |
Table 7
Random forest analysis.
One hundred random perturbations of all molecule concentrations (between +10% and −10%) were simulated. Features are ranked from most important to least important in predicting the temporal sensitivity. The sum of features’ importance equals 1.
| Molecules abbreviation | Weights | Molecules full name |
|---|---|---|
| RasGRF | 0.084 | Ras guanine nucleotide–releasing factor |
| Sos | 0.074 | Son of sevenless |
| Cam | 0.068 | Calmodulin |
| MEK | 0.050 | Mitogen-activated protein kinase kinase |
| PDE2 | 0.050 | Phosphodiesterase 2 |
| pmca | 0.048 | Plasma membrane calcium pump |
| Epac | 0.046 | Exchange protein directly activated by cAMP |
| Calbin | 0.046 | Calbindin |
| CRKC3G | 0.044 | v-CRK Proto-Oncogene/Rap guanine nucleotide exchange factor 1 |
| rasGap | 0.043 | Ras GTPase-activating protein |
| SynGap | 0.042 | Synaptic rasGap |
| PP1 | 0.038 | Protein phosphatase 1 |
| Shc | 0.035 | Src homology collagen-like |
| Grb2 | 0.034 | Growth factor receptor-bound protein 2 |
| PP2A | 0.033 | Protein phosphatase 2 |
| MKP1 | 0.033 | Mitogen-activated protein kinase phosphatase 1 |
| Ng | 0.033 | Neurogranin |
| Src | 0.032 | Non-receptor tyrosine kinase |
| Cbl | 0.030 | Casitas B-lineage lymphoma |
| ERK | 0.027 | Mitogen-activated protein kinase |
| PDE4 | 0.025 | Phosphodiesterase 4 |
| PKA | 0.025 | Protein kinase A |
| NCX | 0.022 | Sodium calcium exchanger |
Additional files
Download links
A two-part list of links to download the article, or parts of the article, in various formats.
Downloads (link to download the article as PDF)
Open citations (links to open the citations from this article in various online reference manager services)
Cite this article (links to download the citations from this article in formats compatible with various reference manager tools)
Temporal pattern and synergy influence activity of ERK signaling pathways during L-LTP induction
eLife 10:e64644.
https://doi.org/10.7554/eLife.64644


