Unsupervised machine learning reveals key immune cell subsets in COVID-19, rhinovirus infection, and cancer therapy
- Department of Cell and Developmental Biology, Vanderbilt University, United States
- Vanderbilt-Ingram Cancer Center, Vanderbilt University Medical Center, United States
- Allergy Division, Department of Medicine, University of Virginia School of Medicine, United States
- Department of Microbiology, Immunology, and Cancer Biology, University of Virginia School of Medicine, United States
- Benaroya Research Institute at Virginia Mason, United States
- Department of Pediatrics, University of Virginia School of Medicine, United States
- Department of Pathology, Microbiology and Immunology, Vanderbilt University Medical Center, United States
Figures
Figure 1

Tracking Responders EXpanding (T-REX) algorithm identifies rare cells based on significant expansion or contraction during infection or treatment.
Graphic of the T-REX workflow. Data from paired samples of blood from a subject are collected over the course of infection and analyzed by high-dimensional, high-cellularity cytometry approaches (e.g., Aurora or CyTOF instrument, as with datasets here). Cells from the sample pair are then equally subsampled for Uniform Manifold Approximation (UMAP) analysis. A k-nearest neighbors (KNN) search is then performed within the UMAP manifold for every cell. For every cell, the percent change between the sample pairs is calculated for the cells within its KNN region. Regions of marked expansion or contraction during infection are then analyzed to identify cell types and key features using Marker Enrichment Modeling. For some datasets, additional information not used in the analysis could be assessed to determine whether identified cells were virus-specific. Finally, the average direction and magnitude of change for cells in the sample was calculated as an overall summary of how the analyzed cells changed between samples.
Figure 2 with 4 supplements

Tracking Responders EXpanding (T-REX) identifies molecular signatures of CD4+ T cells that are expanded during acute rhinovirus infection and enriched for virus-specific cells.
A subject (RV001) was experimentally infected with rhinovirus (RV-A16) and CD4+ T cell signatures monitored by spectral flow cytometry in conjunction with tetramer staining during the course of infection. (A) Fold change in the number of tetramer+ cells (log2) after rhinovirus challenge on day 0. (B) Data showing the percentage of tetramer+ cells in each cell’s k-nearest neighbors (KNN) region (where k = 60) plotted against the percentage change in its KNN region on day 7 vs. day 0. A statistical threshold of 80% or higher for the percentage change in KNN region corresponded to marked enrichment of tetramer+ cells at day 7. (C) Uniform Manifold Approximation (UMAP) plots with T-REX analysis of CD4+ T cells for day 7 vs. day 0 based on statistical thresholds of 90–95% change (left column) and ≥95% change (right column) in cell phenotypes. Pink and red colors denote regions of phenotypic change identified by T-REX. Numbers of tetramer+ cells within the cell’s KNN region captured in these areas of phenotypic change are denoted. Cells containing >5% tetramer+ virus-specific cells in the corresponding KNN region are labeled pink. Red cells denote a KNN region that was not enriched for tetramer+ cells, and purple cells denote a tetramer enriched region not captured by T-REX. Values in black indicate the actual number of tetramer+ cells in each circled hotspot of phenotypic change. Marker Enrichment Modeling (MEM) labels on the right indicate cell phenotypes of each hotspot.
Figure 2—figure supplement 1
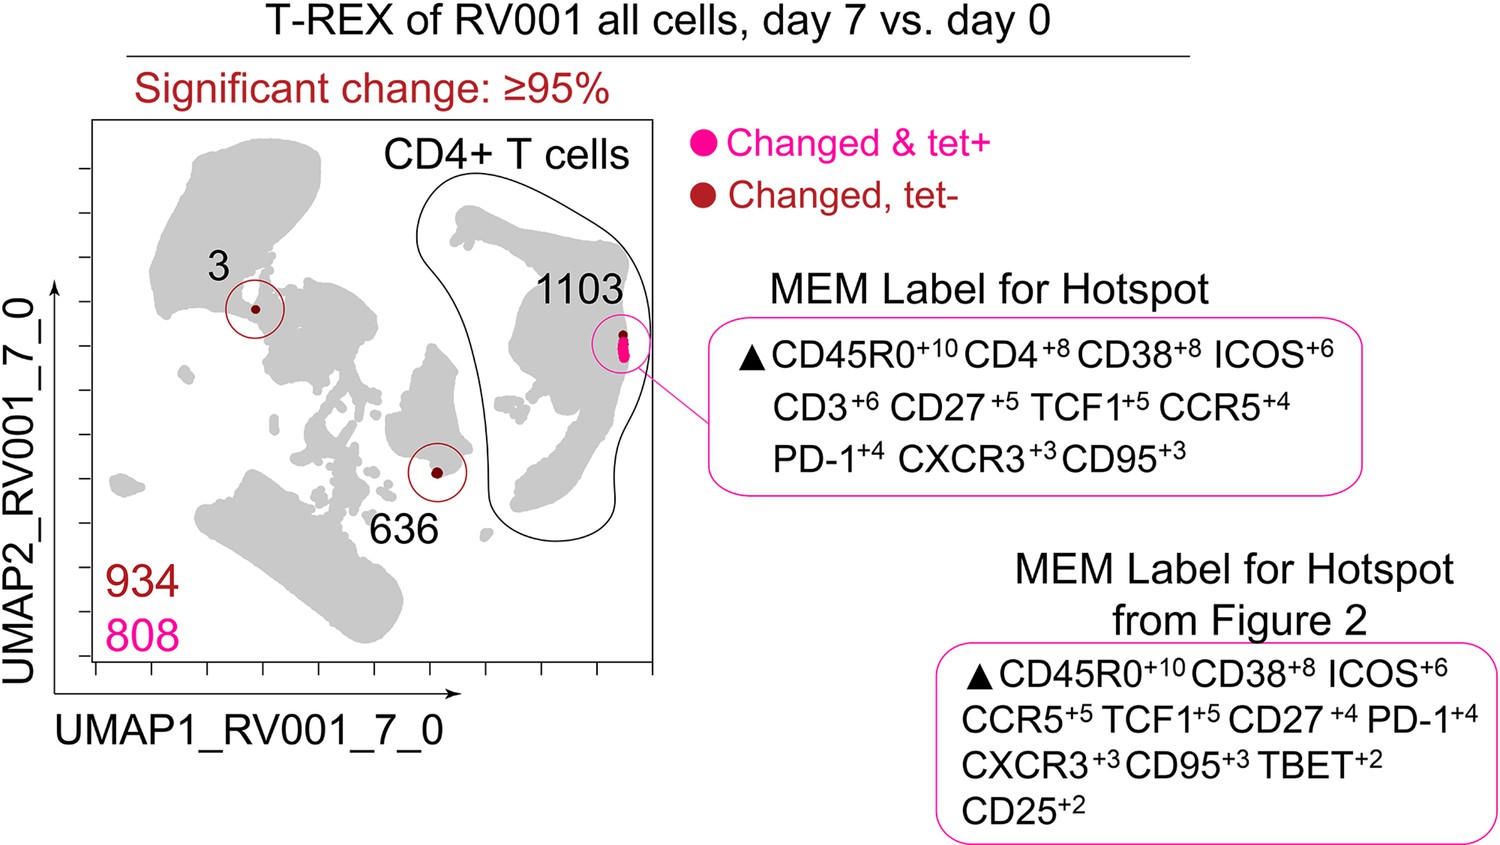
Tracking Responders EXpanding (T-REX) identifies CD4+ T cell tetramer+ hotspot using all cells from RV001.
Uniform Manifold Approximation (UMAP) plot with T-REX analysis of all cells with day 7 vs. day 0 for ≥95% change in cell phenotypes. Numbers of tetramer+ cells and cells in hotspots denoted. Cells in regions of change and containing >5% tetramer+ virus-specific cells in the corresponding k-nearest neighbors (KNN) region are pink. Red cells denote a KNN region that was not enriched for tetramer+ cells, but were regions of great change. Marker Enrichment Modeling (MEM) labels on the right indicate cell phenotypes the hotspot found and the hotspot from Figure 2.
Figure 2—figure supplement 2
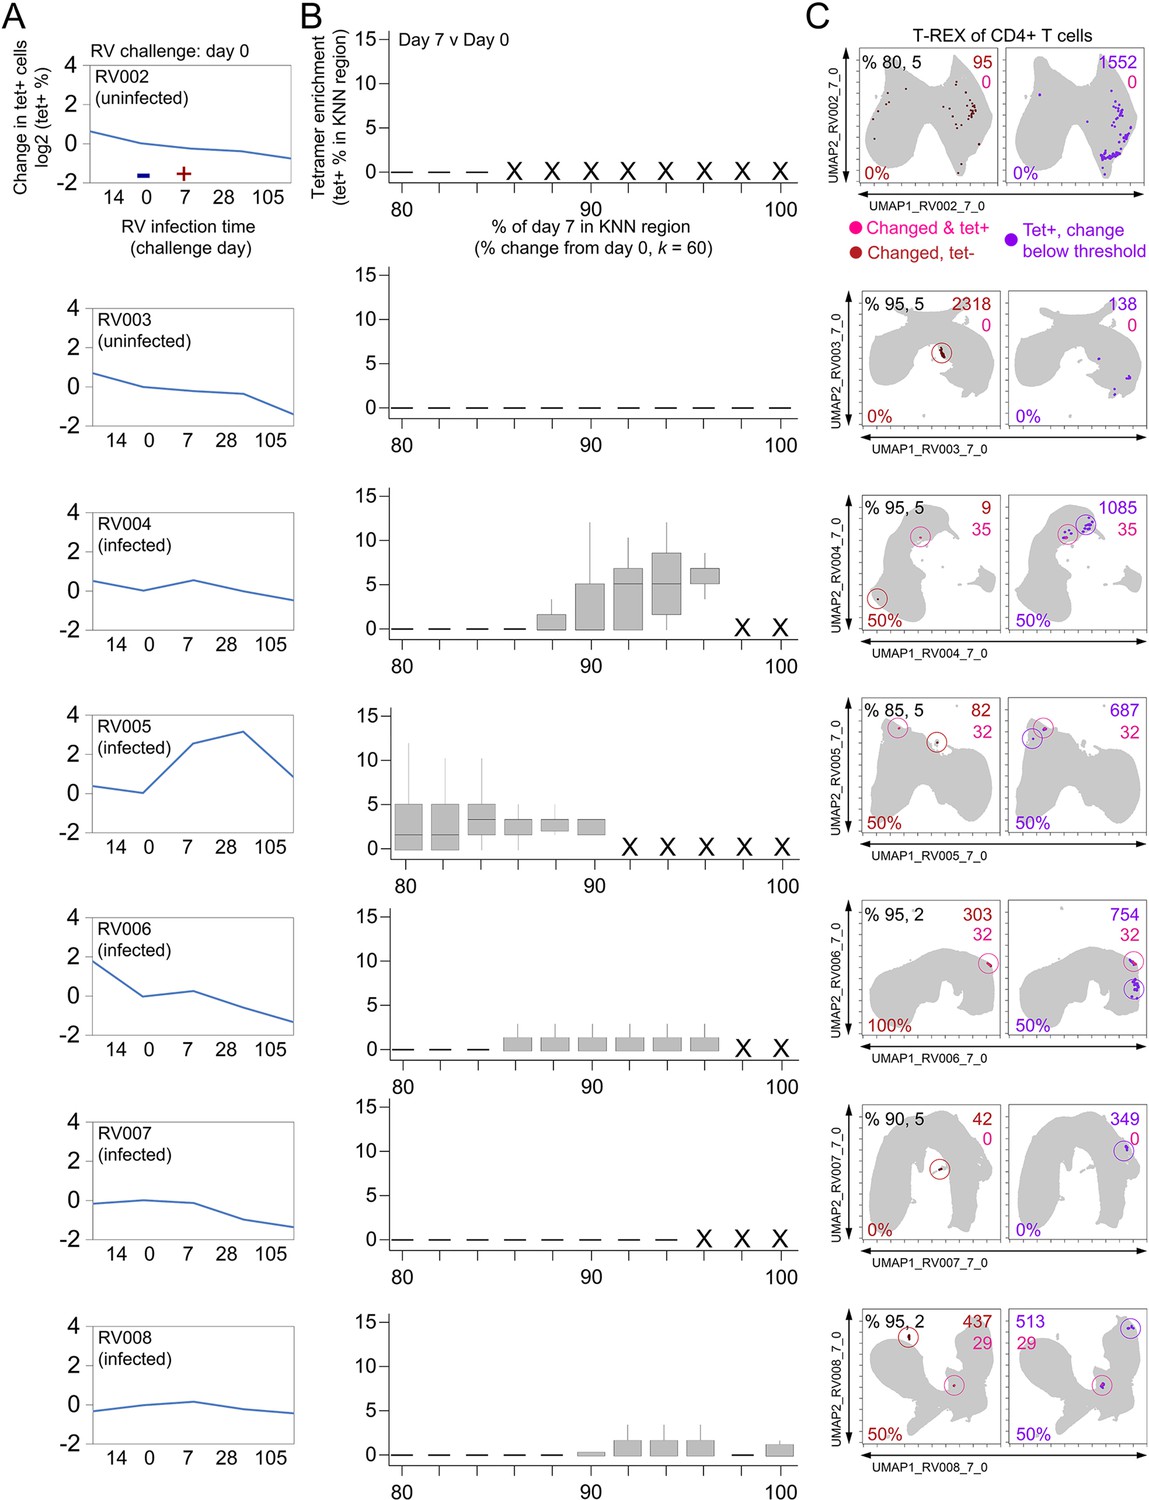
Tracking Responders EXpanding (T-REX) identifies regions of great change enriched for tetramers in infected individuals.
Subjects RV002 through RV008 were experimentally infected with rhinovirus and CD4+ T cell signatures monitored by spectral flow cytometry in conjunction with tetramer staining during the course of infection. (A) Fold change in the number of tetramer+ cells (log2) after rhinovirus challenge on day 0. (B) Box and whisker plots show k-nearest neighbors (KNN) regions in terms of expansion during infection represented by percent change as well as percent of tetramer-+ cells for day 0 and day 7. (C) Uniform Manifold Approximation (UMAP) plots for percent change and tetramer percent cutoff denoted in upper-left corner in the left UMAP plot. Cell count in each region is in black as well as in the upper right of each UMAP plot for tetramer+ regions changing (red), tetramer– regions changing (pink), and tetramer+ regions with change below the expansion cutoff (purple). Marker Enrichment Modeling (MEM) labels are given for highly expanded and tetramer-enriched regions.
Figure 2—figure supplement 3
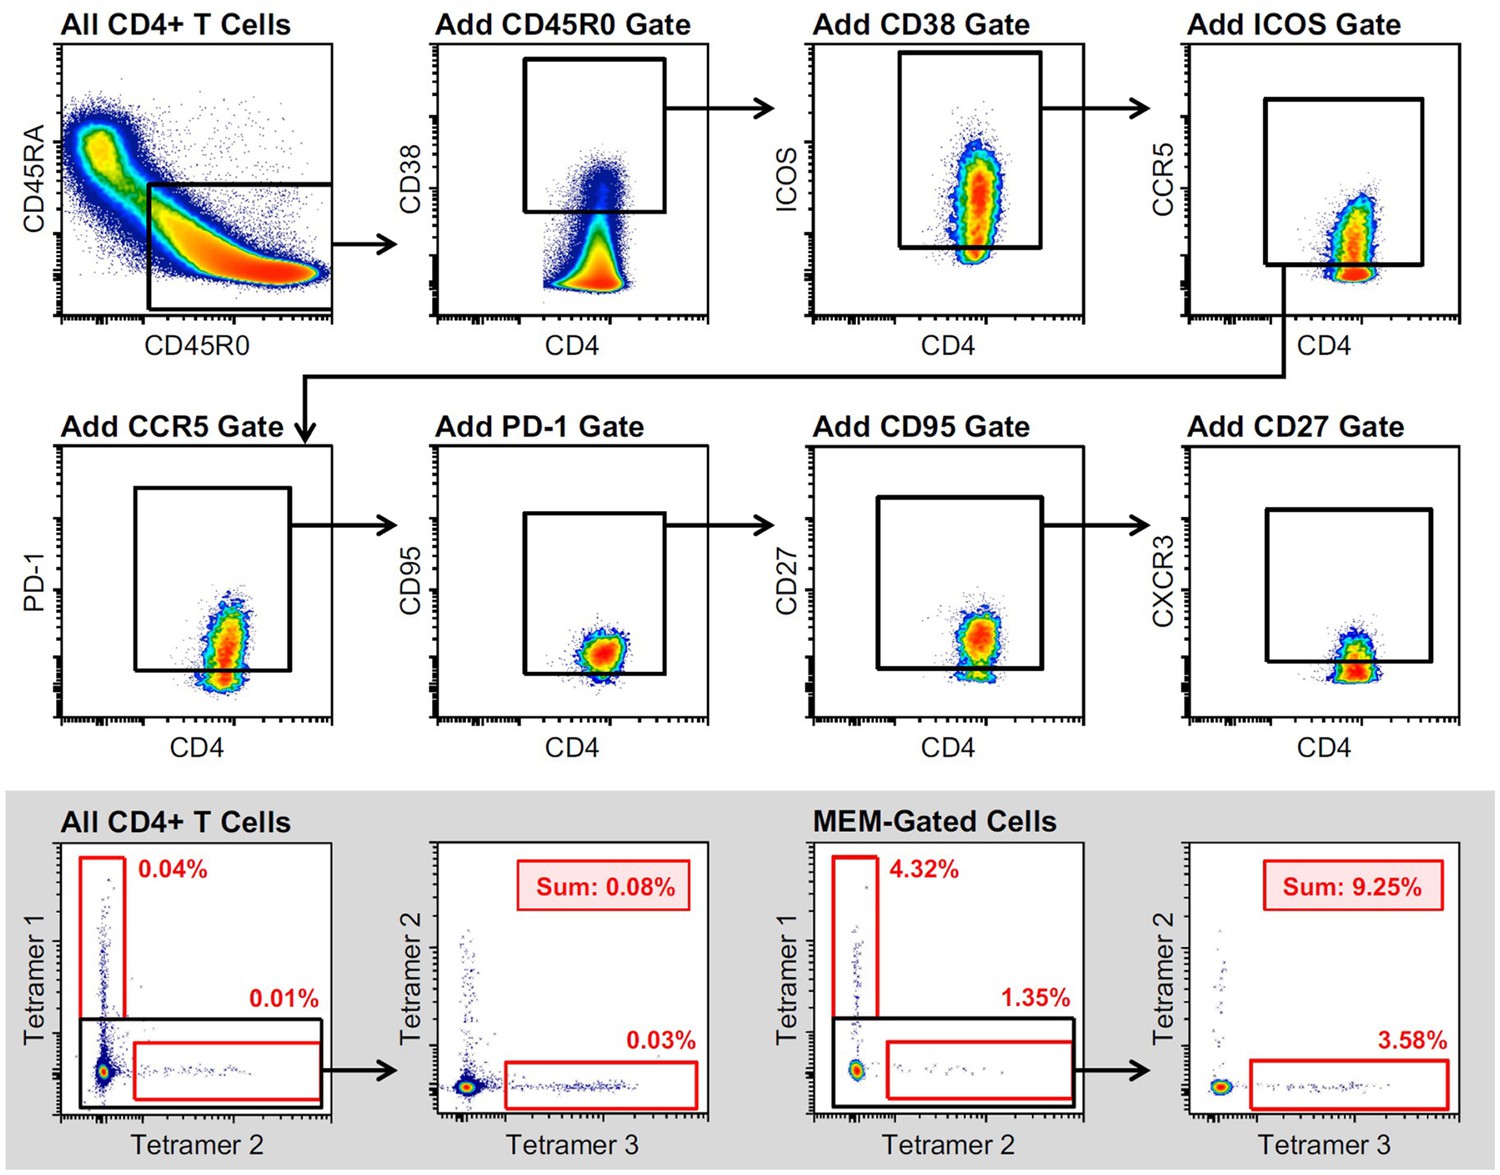
Marker Enrichment Modeling (MEM)-derived gating strategy for the enrichment of rhinovirus-specific CD4+ T cells.
MEM-gated cells are derived from the combination of all depicted gates (CD45R0+ CD38+ ICOS + CCR5+ PD-1+ CD95+ CD27+ CXCR3+). (Inset) Comparison of RV tetramer+ cell enrichment in ungated and MEM-gated cell populations.
Figure 2—figure supplement 4
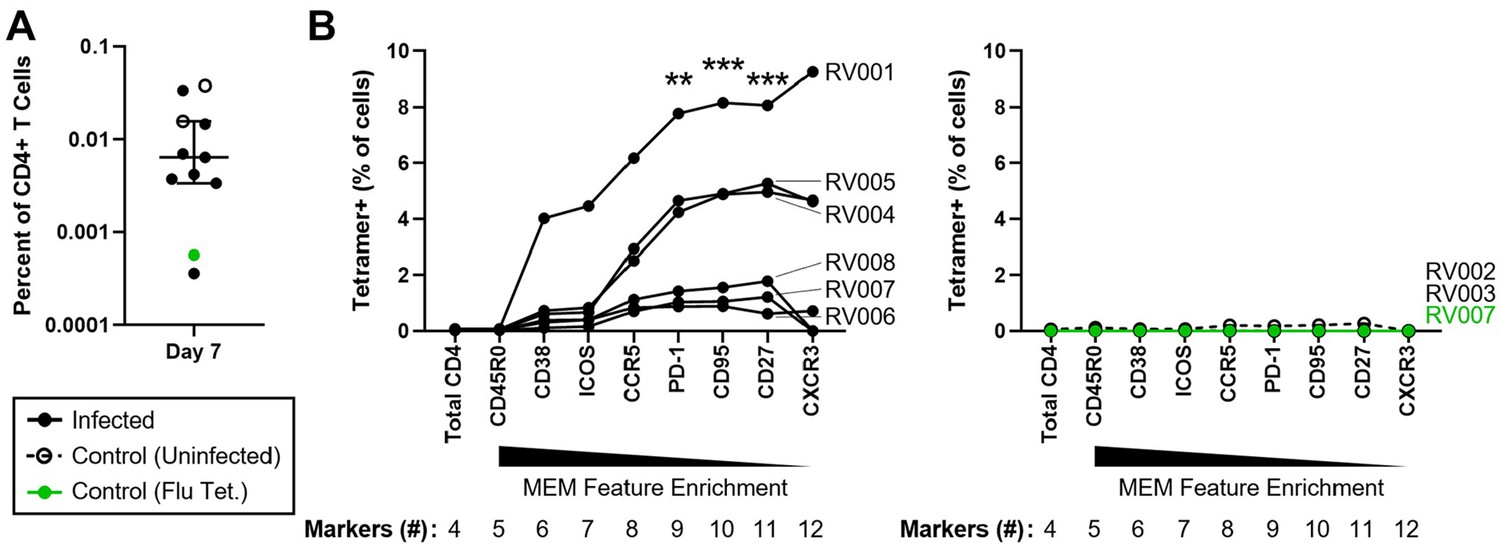
T cell sorting strategy derived using Tracking Responders EXpanding (T-REX) effectively enriches for rhinovirus-specific cells in infected subjects.
(A) Precursor frequencies of total RV tetramer+ CD4+ T cells from all subjects on study day 7 (n = 8 subjects). Median ± interquartile range. (B) Artificial sorting was performed using unenriched day 7 samples. Consensus Marker Enrichment Modeling (MEM) markers were individually added to the sorting strategy according to MEM feature enrichment, and corresponding total tetramer+ cell frequencies assessed. All cells were pre-gated for total CD4+ T cells (Live, Dump [CD14, CD19, CD8a]–, CD3+, CD4+). Two controls were utilized: rhinovirus tetramer staining was performed in subjects who remained uninfected following challenge as an infection control (n = 2), and an unrelated influenza hemagglutinin tetramer was utilized in a rhinovirus-infected subject to confirm antigen specificity (n = 1) (right). Tetramer enrichment with the addition of each marker was compared to the total CD4+ T cell population using Friedman’s test with Dunn’s multiple comparisons correction. **p≤0.01; ***p≤0.001.
Figure 3
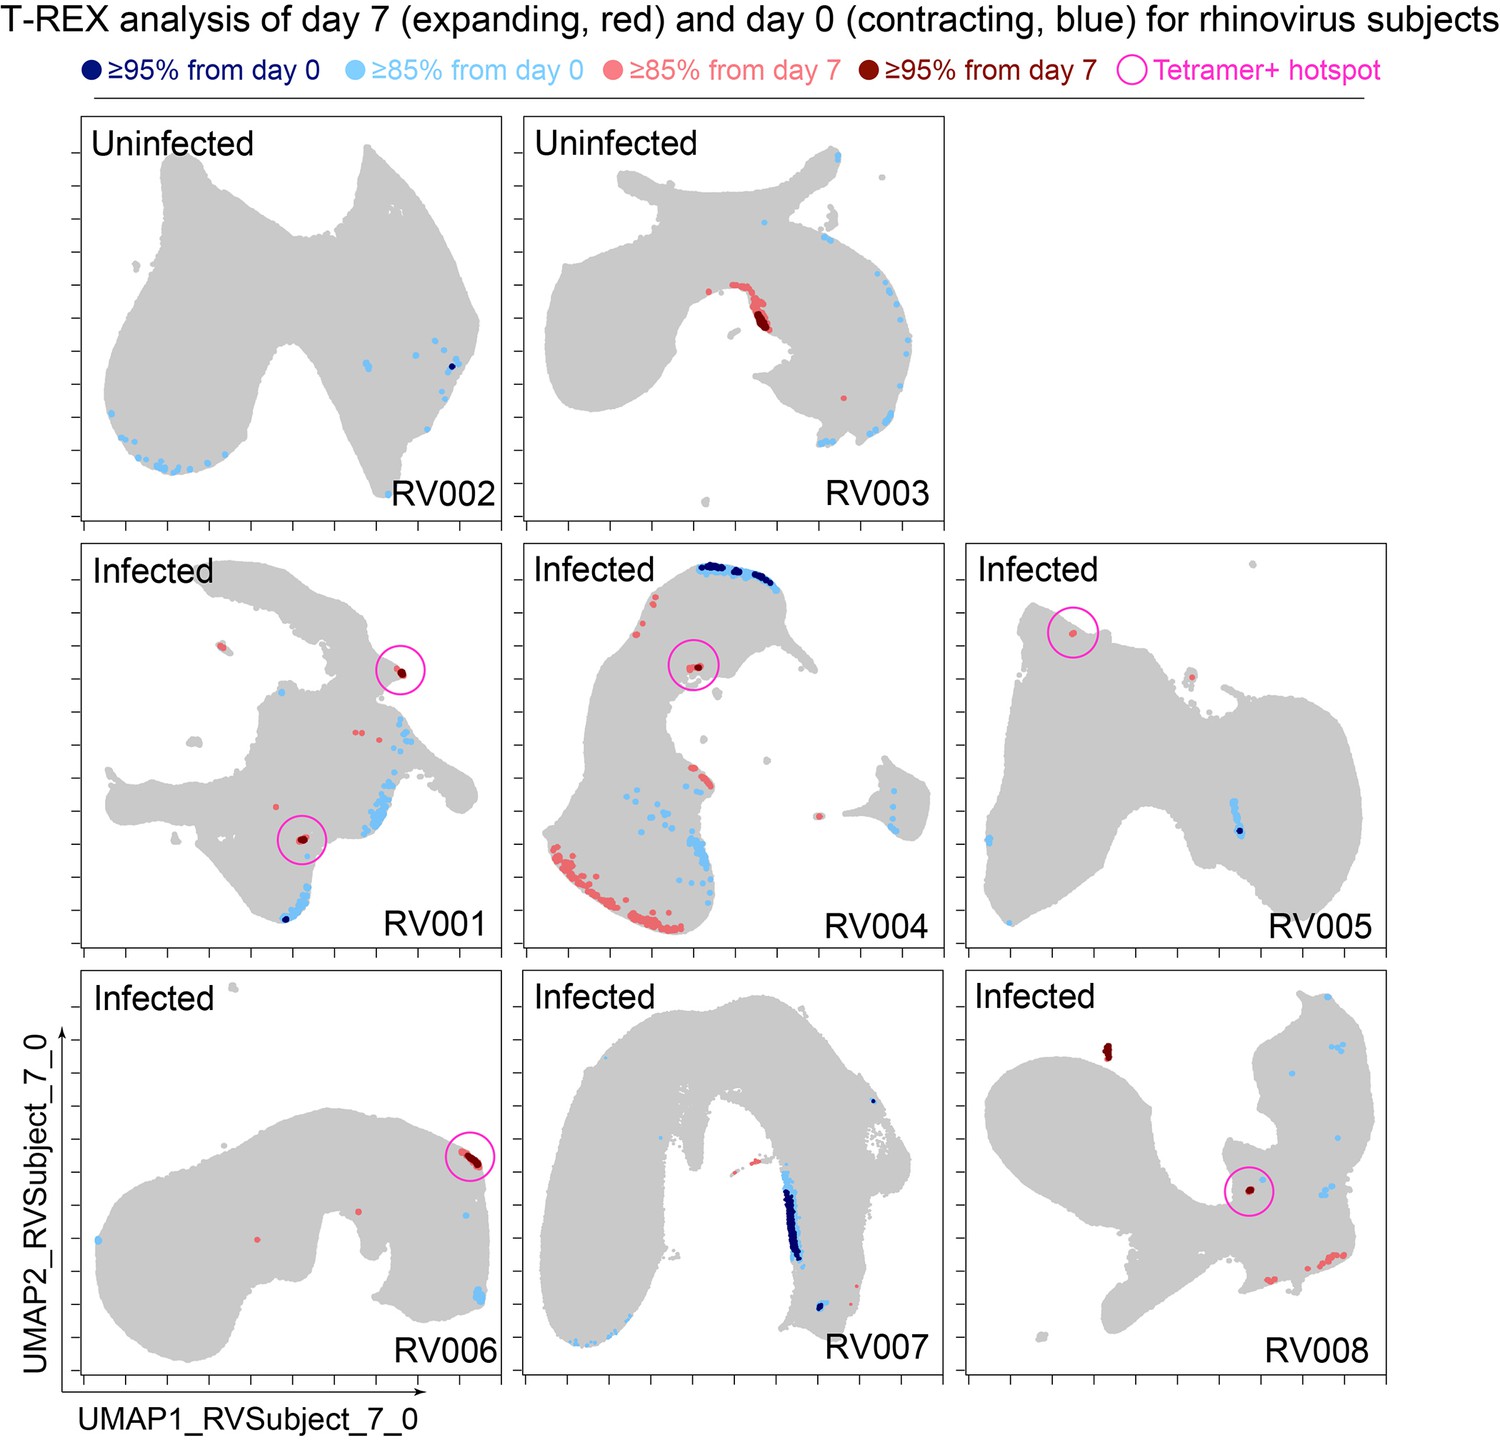
Cells in regions of significant change between day 0 and day 7 were typically in tetramer+ hotspots.
Tracking Responders EXpanding (T-REX) plots of regions of significant change (blue and red) are shown on Uniform Manifold Approximation (UMAP) axes for CD4+ T cells from eight rhinovirus challenge study individuals. Solid pink circles indicate tetramer+ hotspots that also contained cells that were in regions of marked expansion ≥85%.
Figure 4
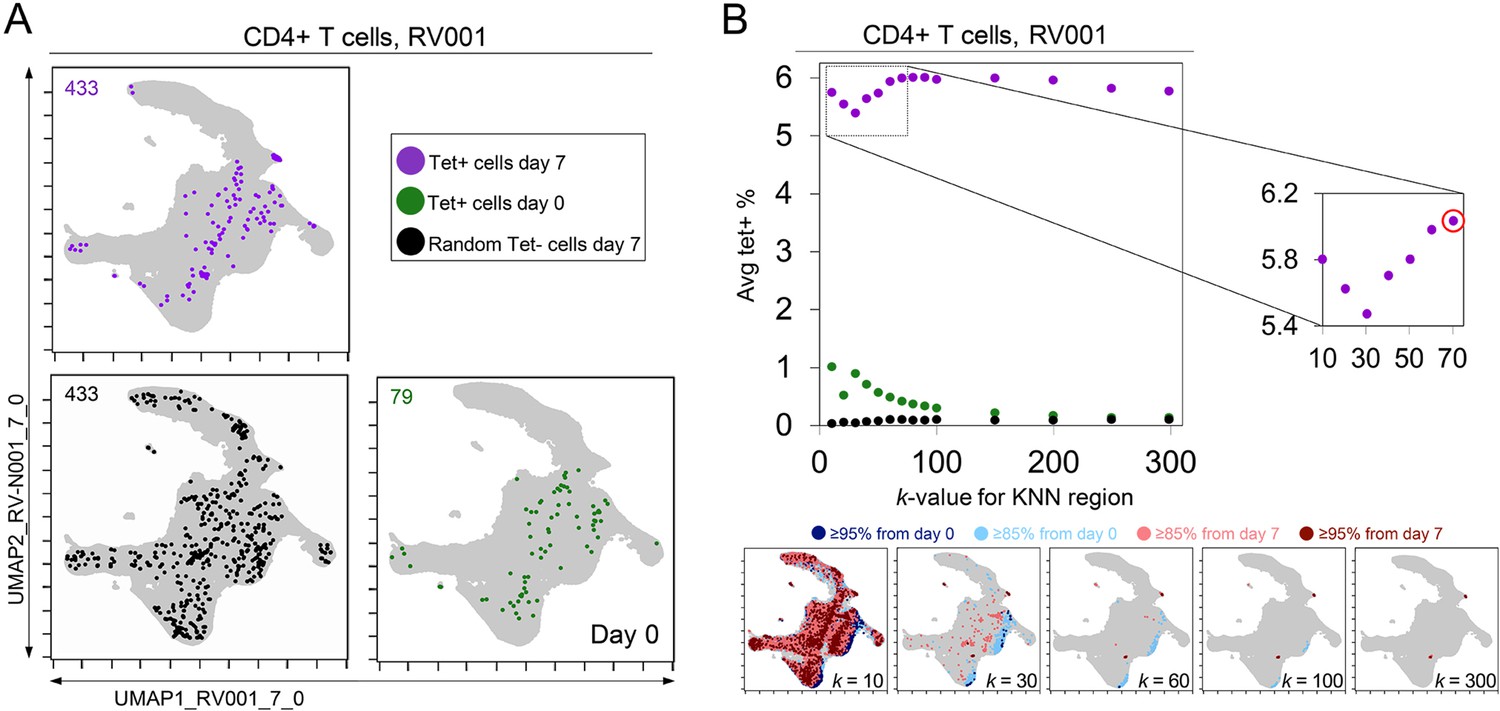
k-nearest neighbors (KNN) analysis around tetramer+ cells reveals an optimized k-value at the inflection point of the tetramer density curve.
(A) Tetramer+ cells from day 7 (dark purple) or from day 0 (light purple) and random tetramer- cells from day 7 (black) are shown overlaid on a common Uniform Manifold Approximation (UMAP) plot. The number of cells for each group is shown in the upper left of each plot. (B) Average tetramer enrichment is shown for increasing k-values in repeated KNN analysis of the cells. The inflection point of the resulting curve is circled in red at k = 70, which was the optimized k-value for KNN implemented as in Tracking Responders EXpanding (T-REX) for subject RV001. The T-REX plots on the UMAP axes are shown for various k-values.
Figure 5
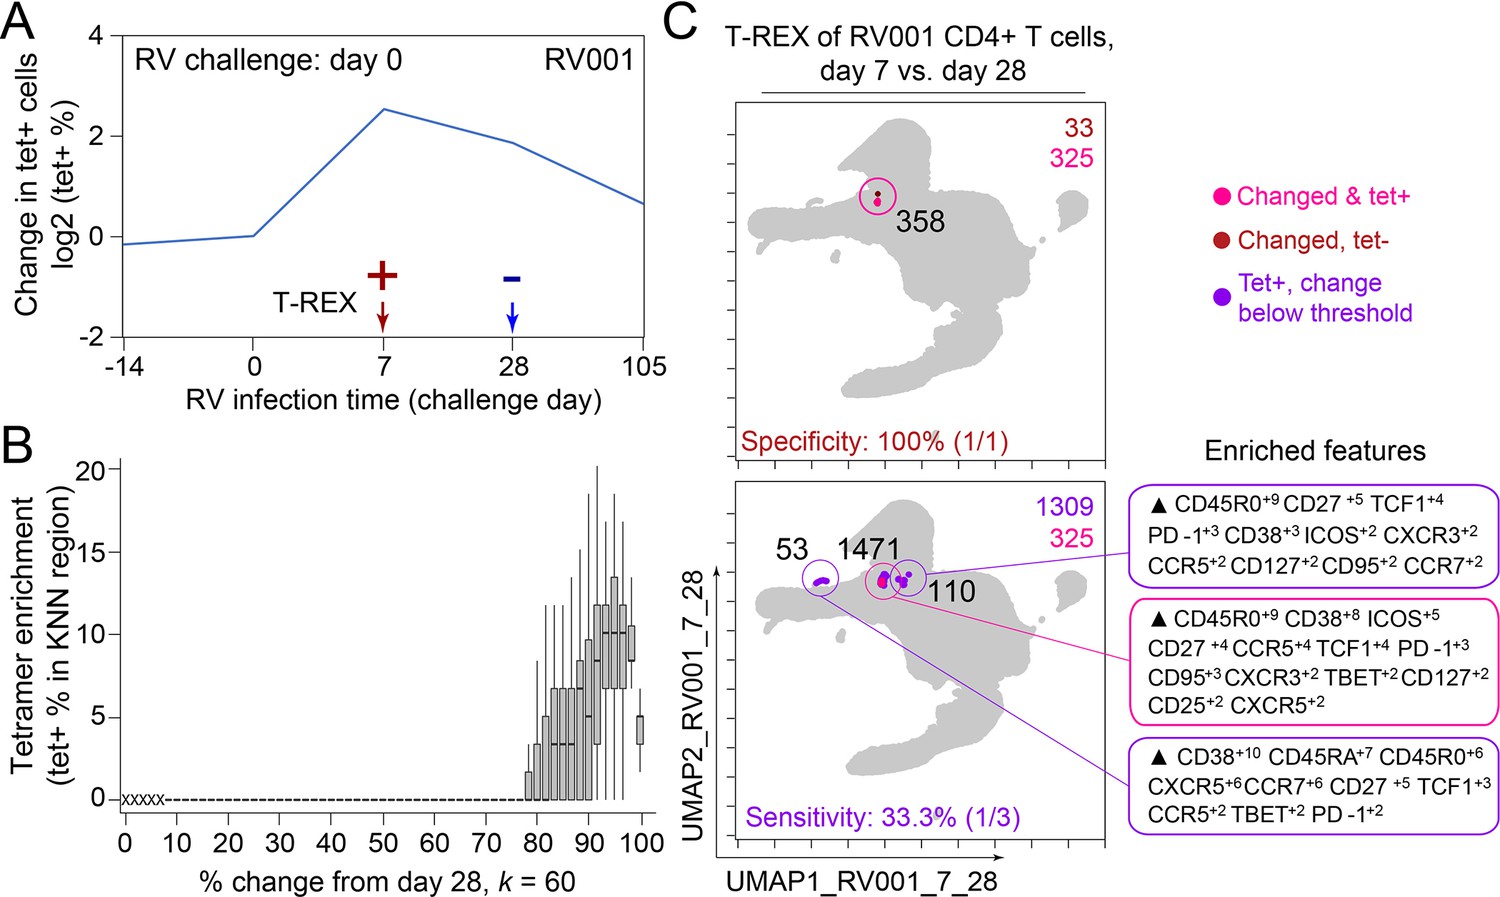
Infected cell phenotypes can be compared to cells taken after infection to reveal regions of expansion.
(A) Fold change in the number of tetramer+ cells (log2) after rhinovirus challenge on day 0. (B) Box and whisker plot show k-nearest neighbors (KNN) regions in terms of expansion during infection represented by percent change as well as percent of tetramer+ cells for post-infection (day 28) and during infection (day 7). (C) Uniform Manifold Approximation (UMAP) plots for 95% change and 5% tetramer cutoffs. Cell count is in black as well as in the upper right of each UMAP plot. Marker Enrichment Modeling (MEM) labels are given for highly expanded and tetramer-enriched regions.
Figure 6 with 2 supplements
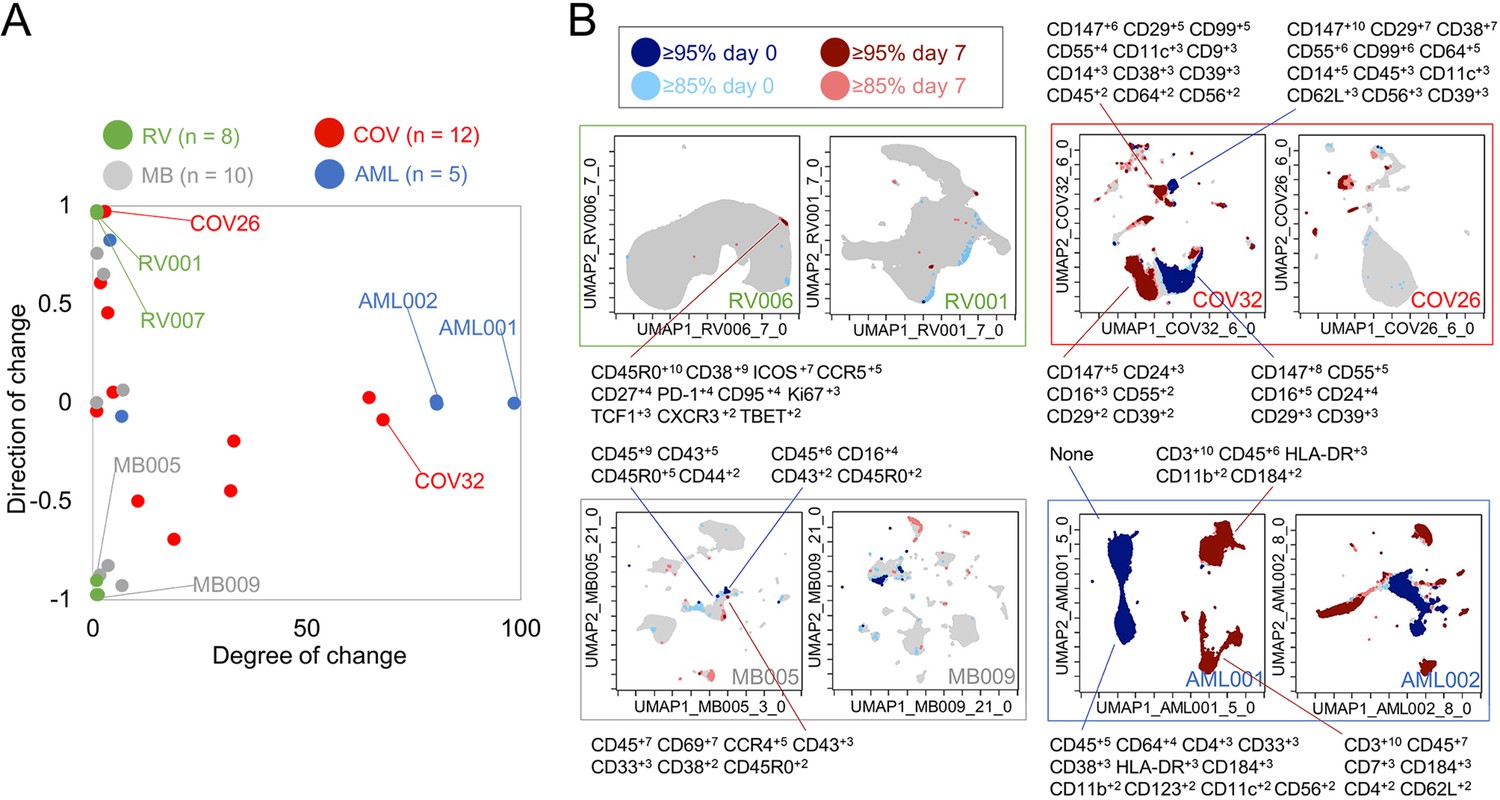
Mapping degree and direction of change for 5th and 95th hotspots reveals disease-specific patterns.
(A) Degree of change and direction of change from Tracking Responders EXpanding (T-REX) analysis in a timepoint comparison shown for acute myeloid leukemia (AML, day 5/8 vs. day 0), COVID (COV, day 1/3/4/5/6/7 vs. day 0), melanoma (MB, day 21/35 vs. day 0), and rhinovirus (RV, day 7 vs. day 0) samples. (B) Example T-REX plots are shown for each disease type analyzed. Degree of change shown in red and blue with red showing regions of expansion over time compared to the blue representing regions of contraction over time. Marker Enrichment Modeling (MEM) label given for change hotspots in the left example in each sample type.
Figure 6—figure supplement 1
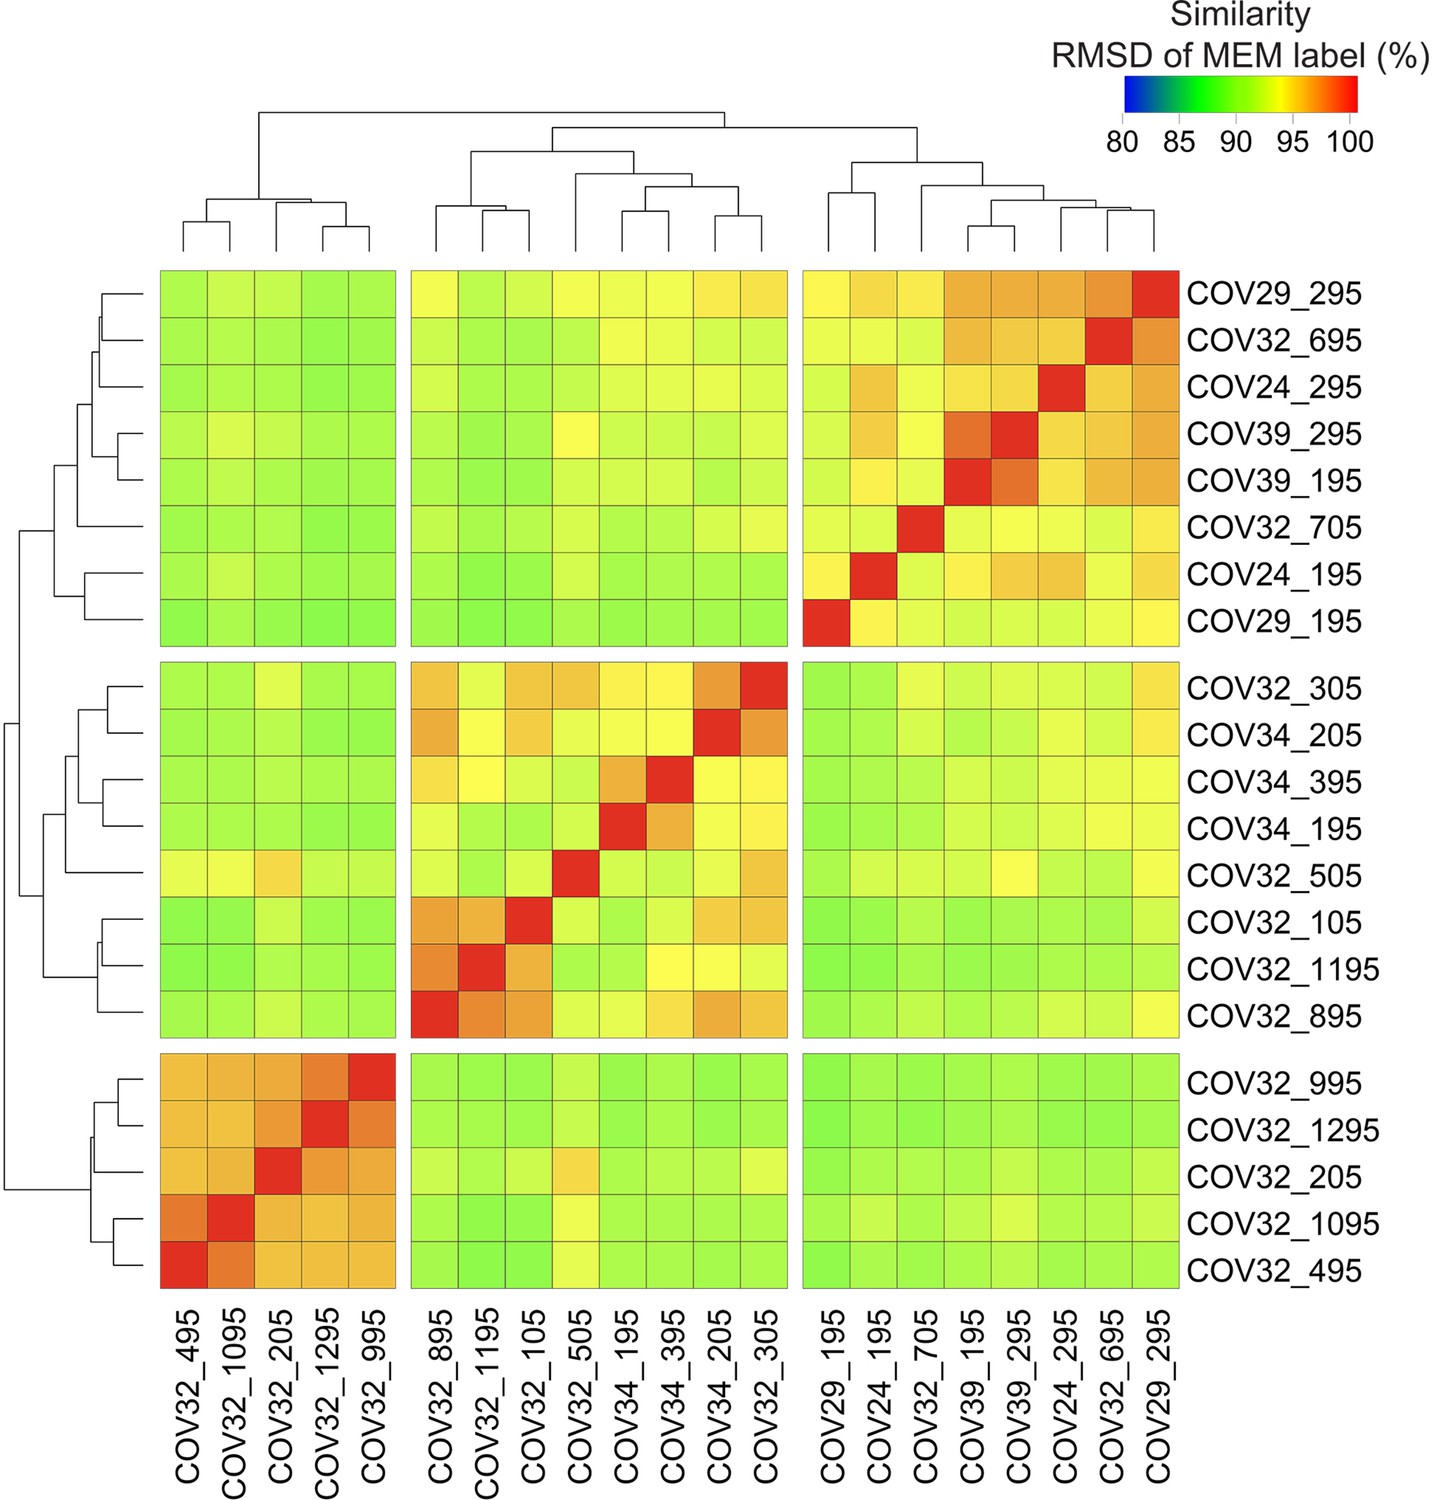
Root mean square deviation (RMSD) on Tracking Responders EXpanding (T-REX) hotspot phenotypes from analysis of the COVID-19 CD4+ T cells identified three, distinct phenotypic groups.
RMSD heatmap comparing Marker Enrichment Modeling (MEM) values for hotspots found by T-REX analysis on CD4+ T cells in COVID-19 samples.
Figure 6—figure supplement 2
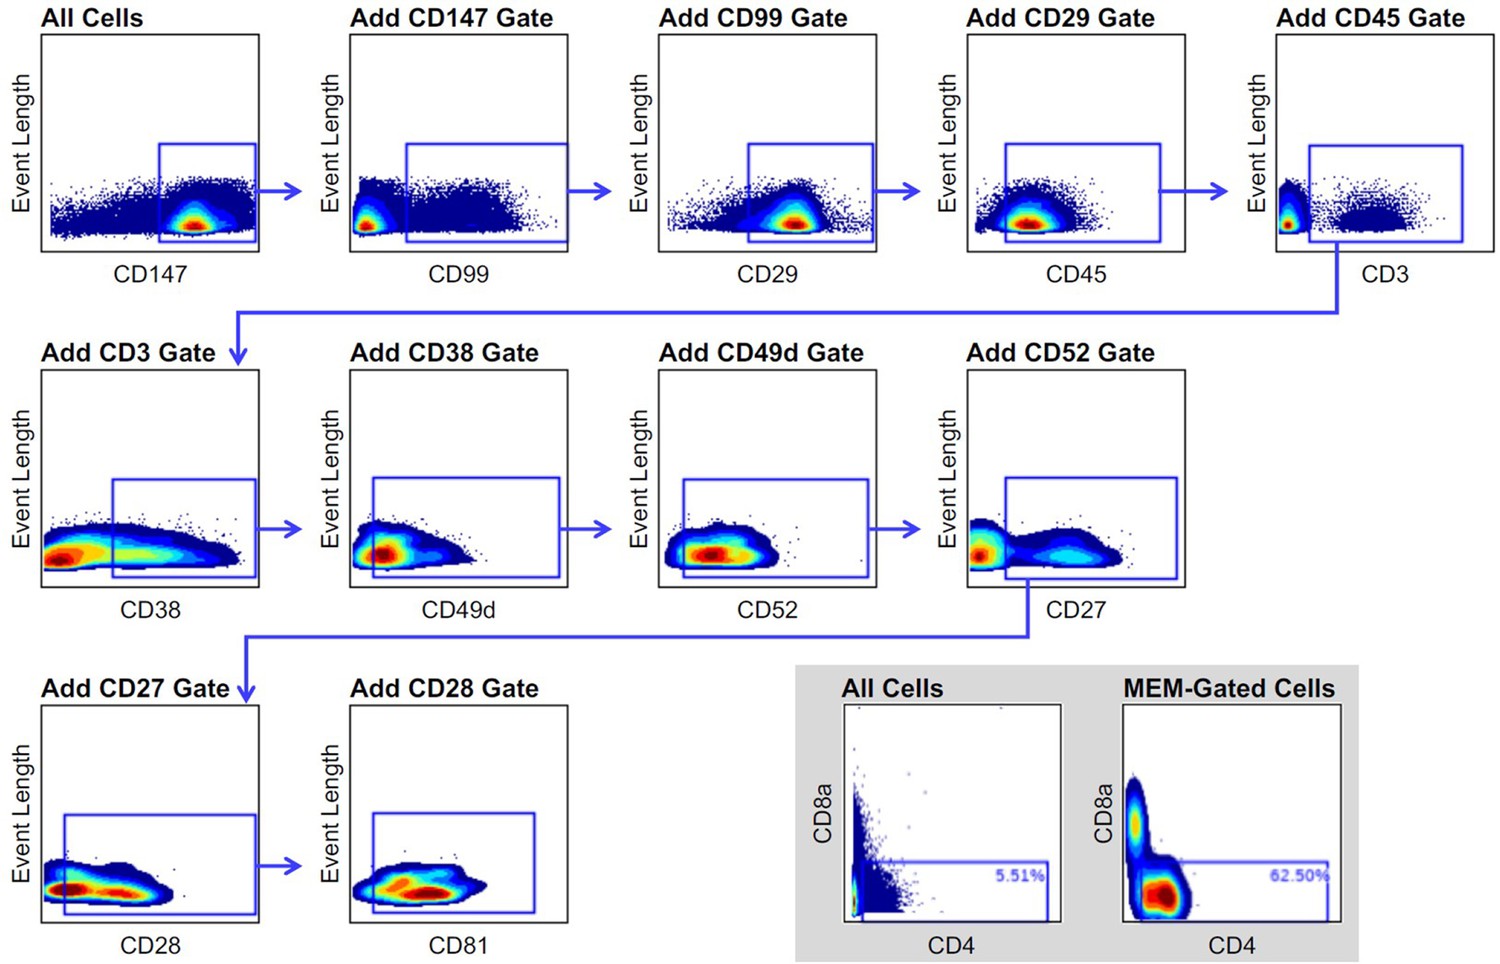
Marker Enrichment Modeling (MEM)-derived gating strategy for the enrichment of CD4+ T cells in COVID-19-infected individuals.
MEM-gated cells are derived from the combination of all depicted gates (CD147+ CD99+ CD29+ CD45+ CD3+ CD38+ CD49d + CD52+ CD27+ CD28+ CD81+). (Inset) Comparison of CD4+ T cell enrichment in ungated and MEM-gated cell populations.
Figure 7 with 1 supplement
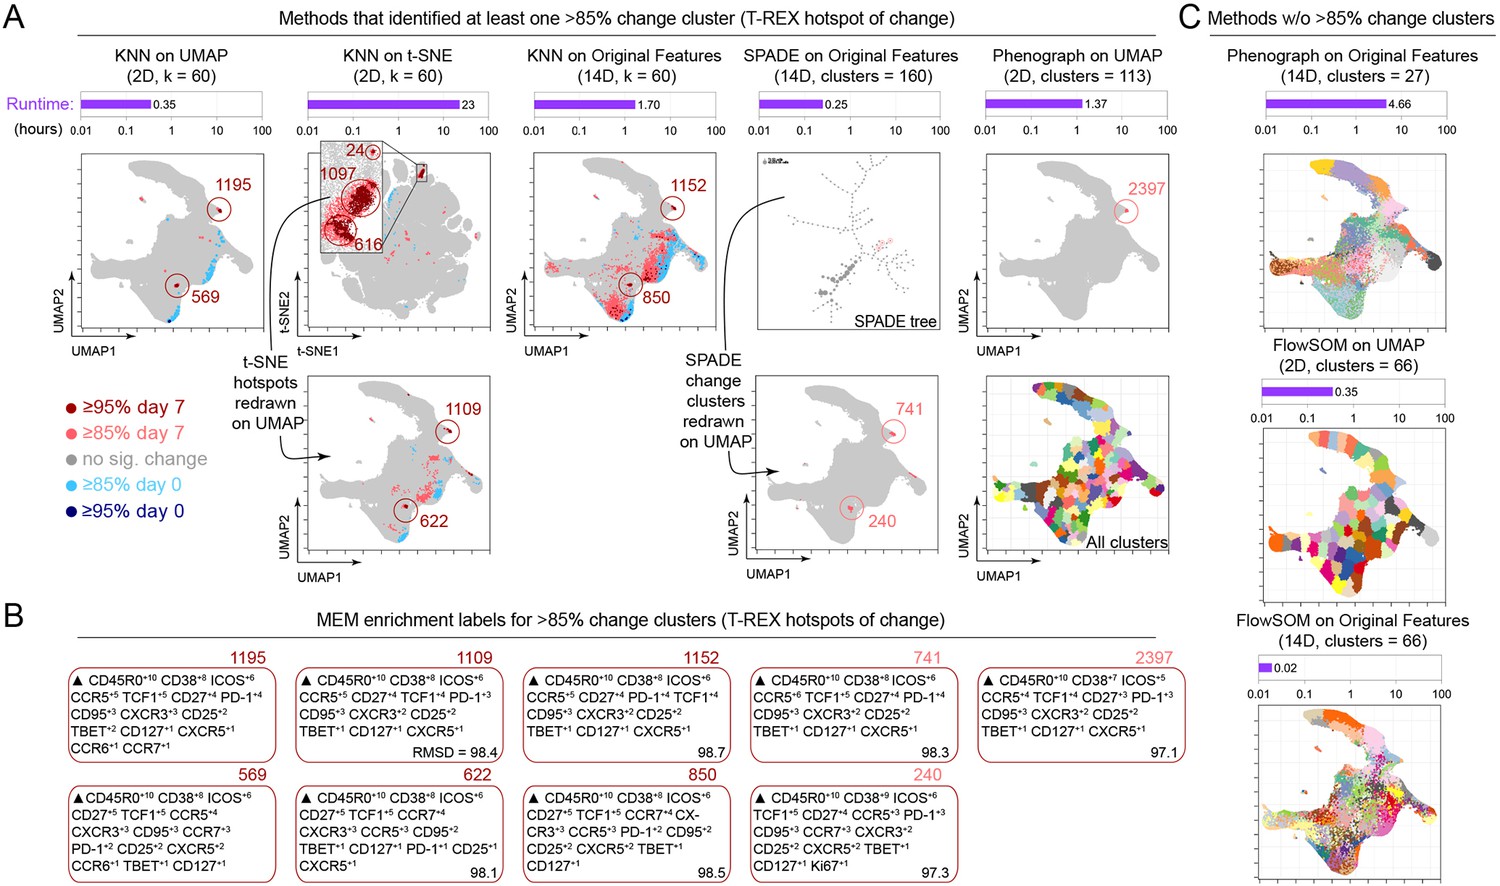
Tracking Responders EXpanding (T-REX) using Uniform Manifold Approximation (UMAP) rapidly identified regions of change and tetramer+ hotspots and contrasted with other algorithms.
(A) Data analysis methods were compared using on RV001 day 0 and day 7 data. Methods identifying at least one cluster with >85% change from day 0 to day 7 are shown. Cells are plotted on UMAP or t-SNE axes (red for expanding cells from day 7, blue for contracting from day 0). Time per method is shown in the purple bar above each UMAP/t-SNE plot. For methods not using UMAP, clusters and hotspots have been redrawn on the UMAP axes to compare to the original T-REX method. Numbers of tetramer+ cells within the cell’s k-nearest neighbors (KNN) region captured in these areas of phenotypic change are denoted. (B) Marker Enrichment Modeling (MEM) labels are shown per method for clusters with significant change. A root mean square deviation (RMSD) score is included in the lower right of each MEM label box for comparison to the original T-REX method MEM labels. (C) All clusters on the UMAP axes are shown for methods that did not identify regions of significant change. Runtimes for these are included above each plot in purple.
Figure 7—figure supplement 1
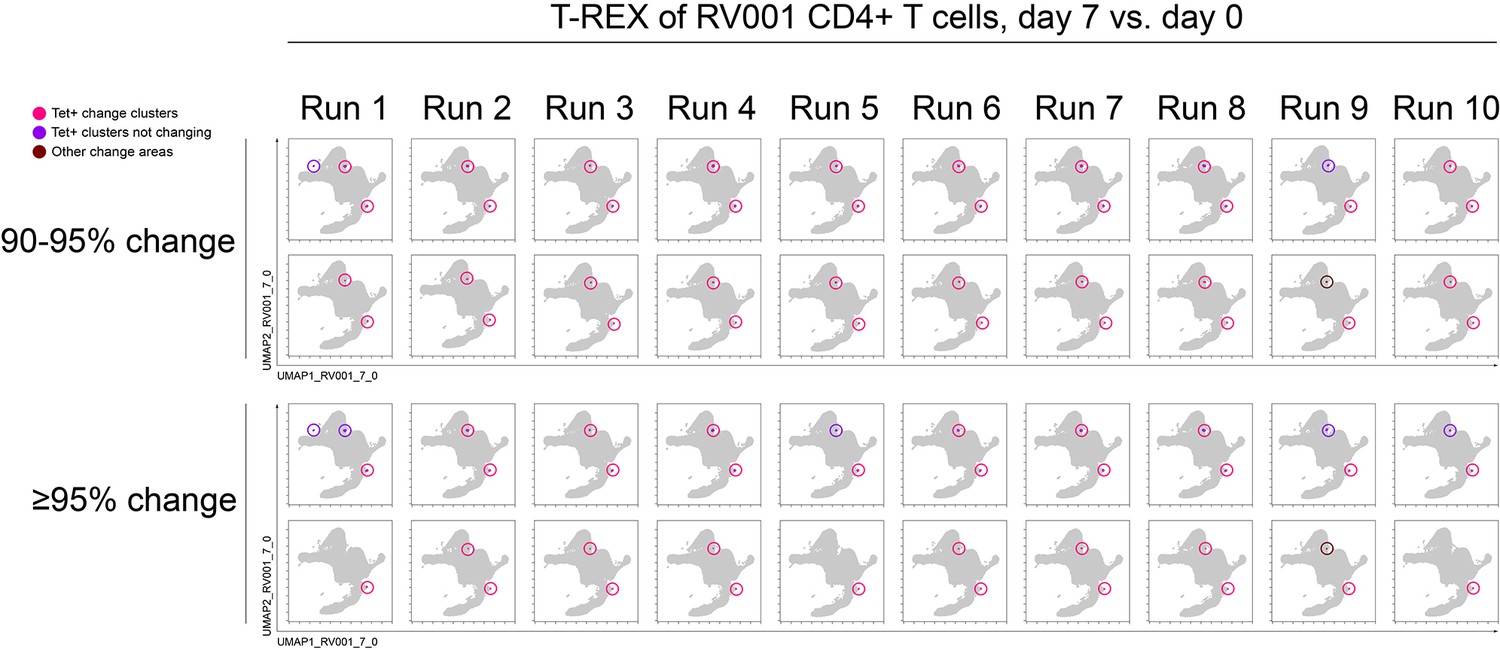
Tracking Responders EXpanding (T-REX) consistently identified tetramer+ hotspots based on ≥90% or ≥95% change across 10 × 10% subsamples on a single common Uniform Manifold Approximation (UMAP).
Each run is a subsample of 10% of the total cells from RV001. UMAP plots with T-REX analysis of CD4+ T cells for day 7 vs. day 0 based on statistical thresholds of 90–95% change (top row) and ≥95% change (bottom row) in cell phenotypes. Pink and red colors denote regions of phenotypic change identified by T-REX. Cells containing >5% tetramer+ virus-specific cells in the corresponding k-nearest neighbors (KNN) region are labeled pink. Red cells denote a KNN region that was not enriched for tetramer+ cells, and purple cells denote a tetramer enriched region not captured by T-REX.
Additional files
-
Supplementary file 1
Direction and degree of change for all samples as in Barone et al. Figure 6.
Day compared indicates the actual day a sample was taken relative to a day 0 comparison in all cases. # cells indicates the number of cells in each percentile grouping (e.g., [0,5] indicates the number of cells whose k-nearest neighbors [KNN] area had ≤5% change in Tracking Responders EXpanding [T-REX] analysis). Change magnitude and direction are as in Figure 6A.
- https://cdn.elifesciences.org/articles/64653/elife-64653-supp1-v2.xlsx
-
Supplementary file 2
Tetramer+ cell frequency in CD4+ T cells in RV subjects.
CD4+ T cell and tetramer+ cell counts per subject per day in the RV study. Frequency given as a percentage.
- https://cdn.elifesciences.org/articles/64653/elife-64653-supp2-v2.xlsx
-
Supplementary file 3
Marker Enrichment Modeling (MEM) labels for enriched features in all cell hotspots and in CD4+ T cell hotspots from COVID-19 patients in Dataset 2.
Red MEM labels denote that the hotspot is a region with ≥95% expansion, and blue MEM labels denote that the hotspot is a region with ≥95% contraction after Tracking Responders EXpanding (T-REX) analysis when comparing day 0 to day 4 (±3 days). Labels given for all cell hotspots and CD4+ T cell hotspots.
- https://cdn.elifesciences.org/articles/64653/elife-64653-supp3-v2.xlsx
-
Supplementary file 4
Fluorescent antibody panel and tetramer selection for the analysis of RV-specific CD4+ T cells.
- https://cdn.elifesciences.org/articles/64653/elife-64653-supp4-v2.xlsx
-
Transparent reporting form
- https://cdn.elifesciences.org/articles/64653/elife-64653-transrepform1-v2.pdf
Download links
A two-part list of links to download the article, or parts of the article, in various formats.
Downloads (link to download the article as PDF)
Open citations (links to open the citations from this article in various online reference manager services)
Cite this article (links to download the citations from this article in formats compatible with various reference manager tools)
Unsupervised machine learning reveals key immune cell subsets in COVID-19, rhinovirus infection, and cancer therapy
eLife 10:e64653.
https://doi.org/10.7554/eLife.64653


