Evolution of the complex transcription network controlling biofilm formation in Candida species
- Departamento de Ingeniería Genética, Centro de Investigación y de Estudios Avanzados del Instituto Politécnico Nacional, Unidad Irapuato, Mexico
- Department of Microbiology and Immunology, University of California, San Francisco, United States
- School of Biomolecular and Biomedical Science, Conway Institute, University College Dublin, Ireland
- Department of Molecular and Cell Biology, University of California, Merced, United States
- Department of Medical Microbiology and Immunology, University of Wisconsin, United States
- Microbiome Initiative, Chan Zuckerberg Biohub, United States
Figures
Figure 1
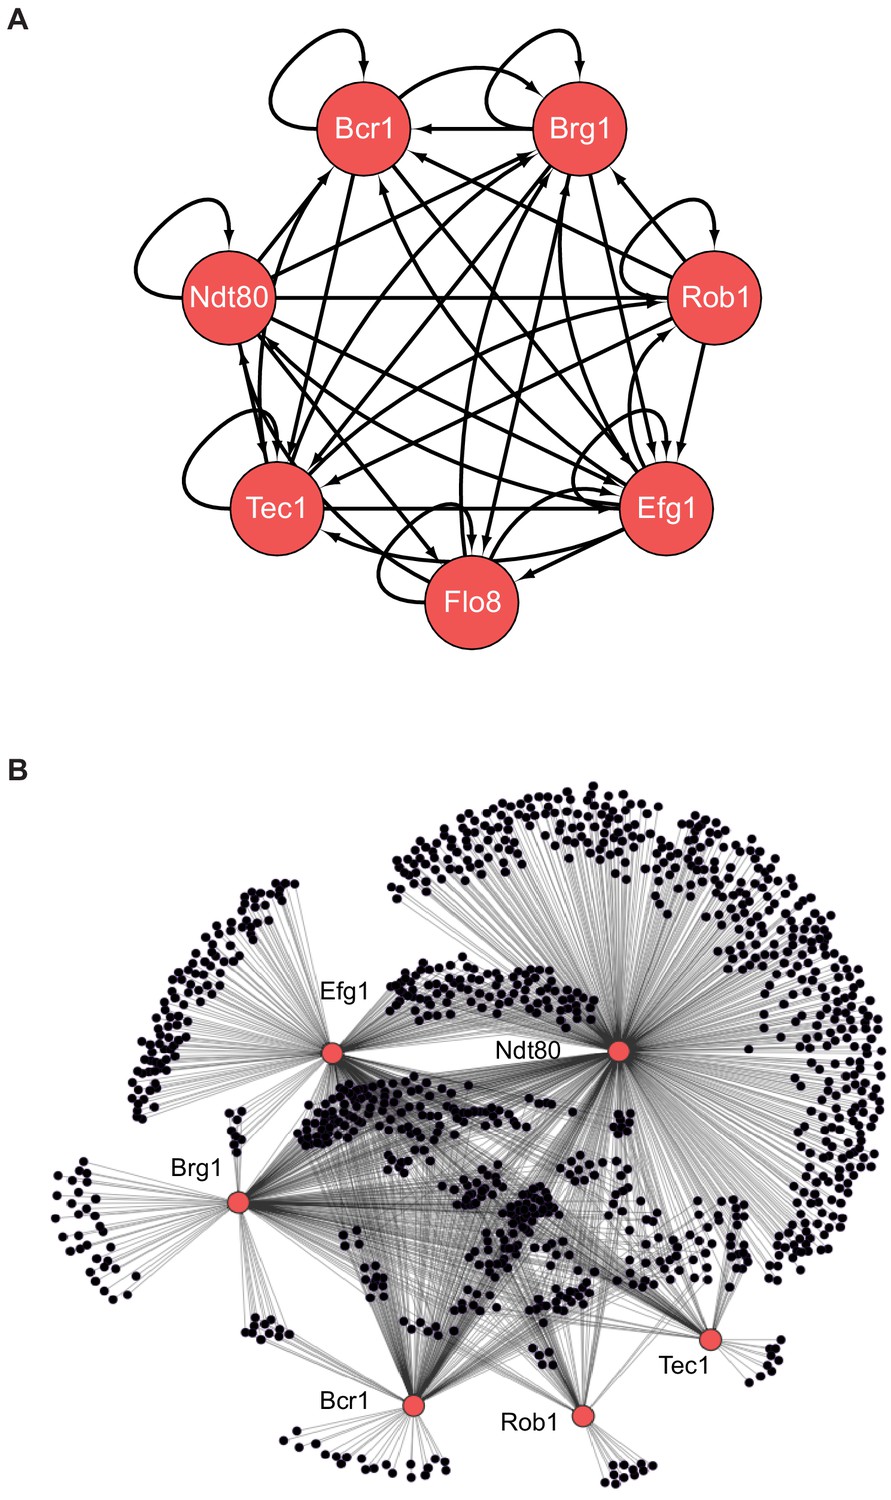
The biofilm transcription network in Candida albicans.
(A) The seven master transcription regulators identified in genetic screens and the interactions among them as determined by ChIP-chip and ChIP-qPCR (Nobile et al., 2012; Fox et al., 2015). (B) Binding interactions (determined by ChIP-chip) between the master regulators (red) and their target genes (black). Figure adapted from Nobile et al., 2012. Many target genes are bound by more than one regulator. Note that genome-wide binding data is not available for Flo8, and thus it is missing from the larger network diagram in (B).
Figure 2 with 3 supplements
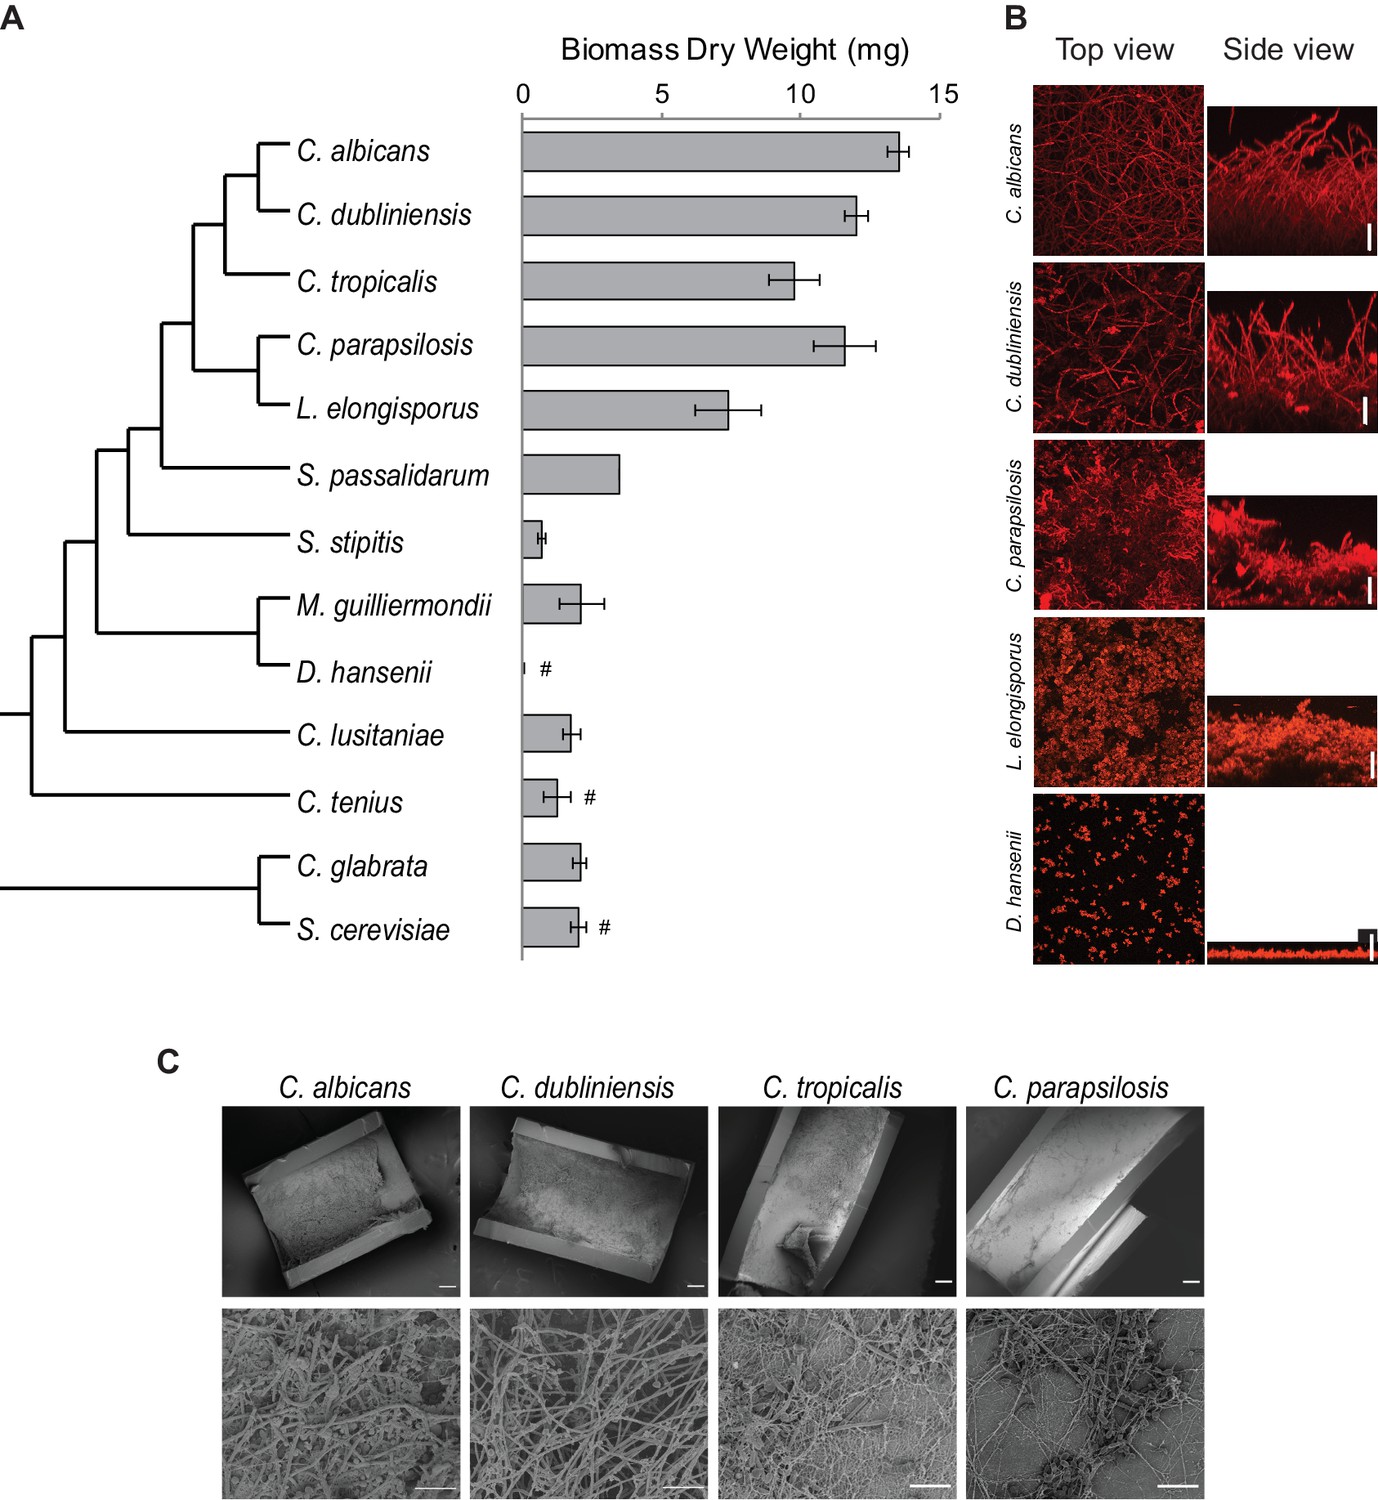
Diversity in biofilm formation across fungal species.
(A) Biofilm biomass dry weight was determined for different fungal species grown on the bottoms of polystyrene 6-well plates in Spider 1% glucose medium at 37°C for 48 hr. The mean and standard deviation were calculated from five replicates. Hashtags denote species that do not grow well at 37°C and for which biofilms were grown at 30°C. The cladogram to the left shows the phylogenetic relationship of the species (Byrne and Wolfe, 2005; Maguire et al., 2013). All species analyzed belong to the CTG-Ser1 clade apart from C. glabrata and S. cerevisiae. (B) Morphology of biofilms formed by five representative CTG clade species visualized by confocal scanning laser microscopy. C. tropicalis biofilm morphology is similar to that of C. albicans and C. dubliniensis as shown in Figure 2—figure supplement 2 and Figure 3—figure supplement 1. Biofilms were grown as described above, but on the surfaces of silicone squares. Scale bars represent 50 μm. (C) Biofilm formation by Candida species in an in vivo rat catheter model (Andes et al., 2004). Biofilms were grown for 24 hr and were visualized by scanning electron microscopy. Two magnifications are shown in the lower and upper panels for each species, and the scale bars represent 20 and 100 μm, respectively. Micrographs of C. albicans were adapted from Dalal et al., 2016, but were obtained as part of the same set of experiments performed in parallel.
Figure 2—figure supplement 1
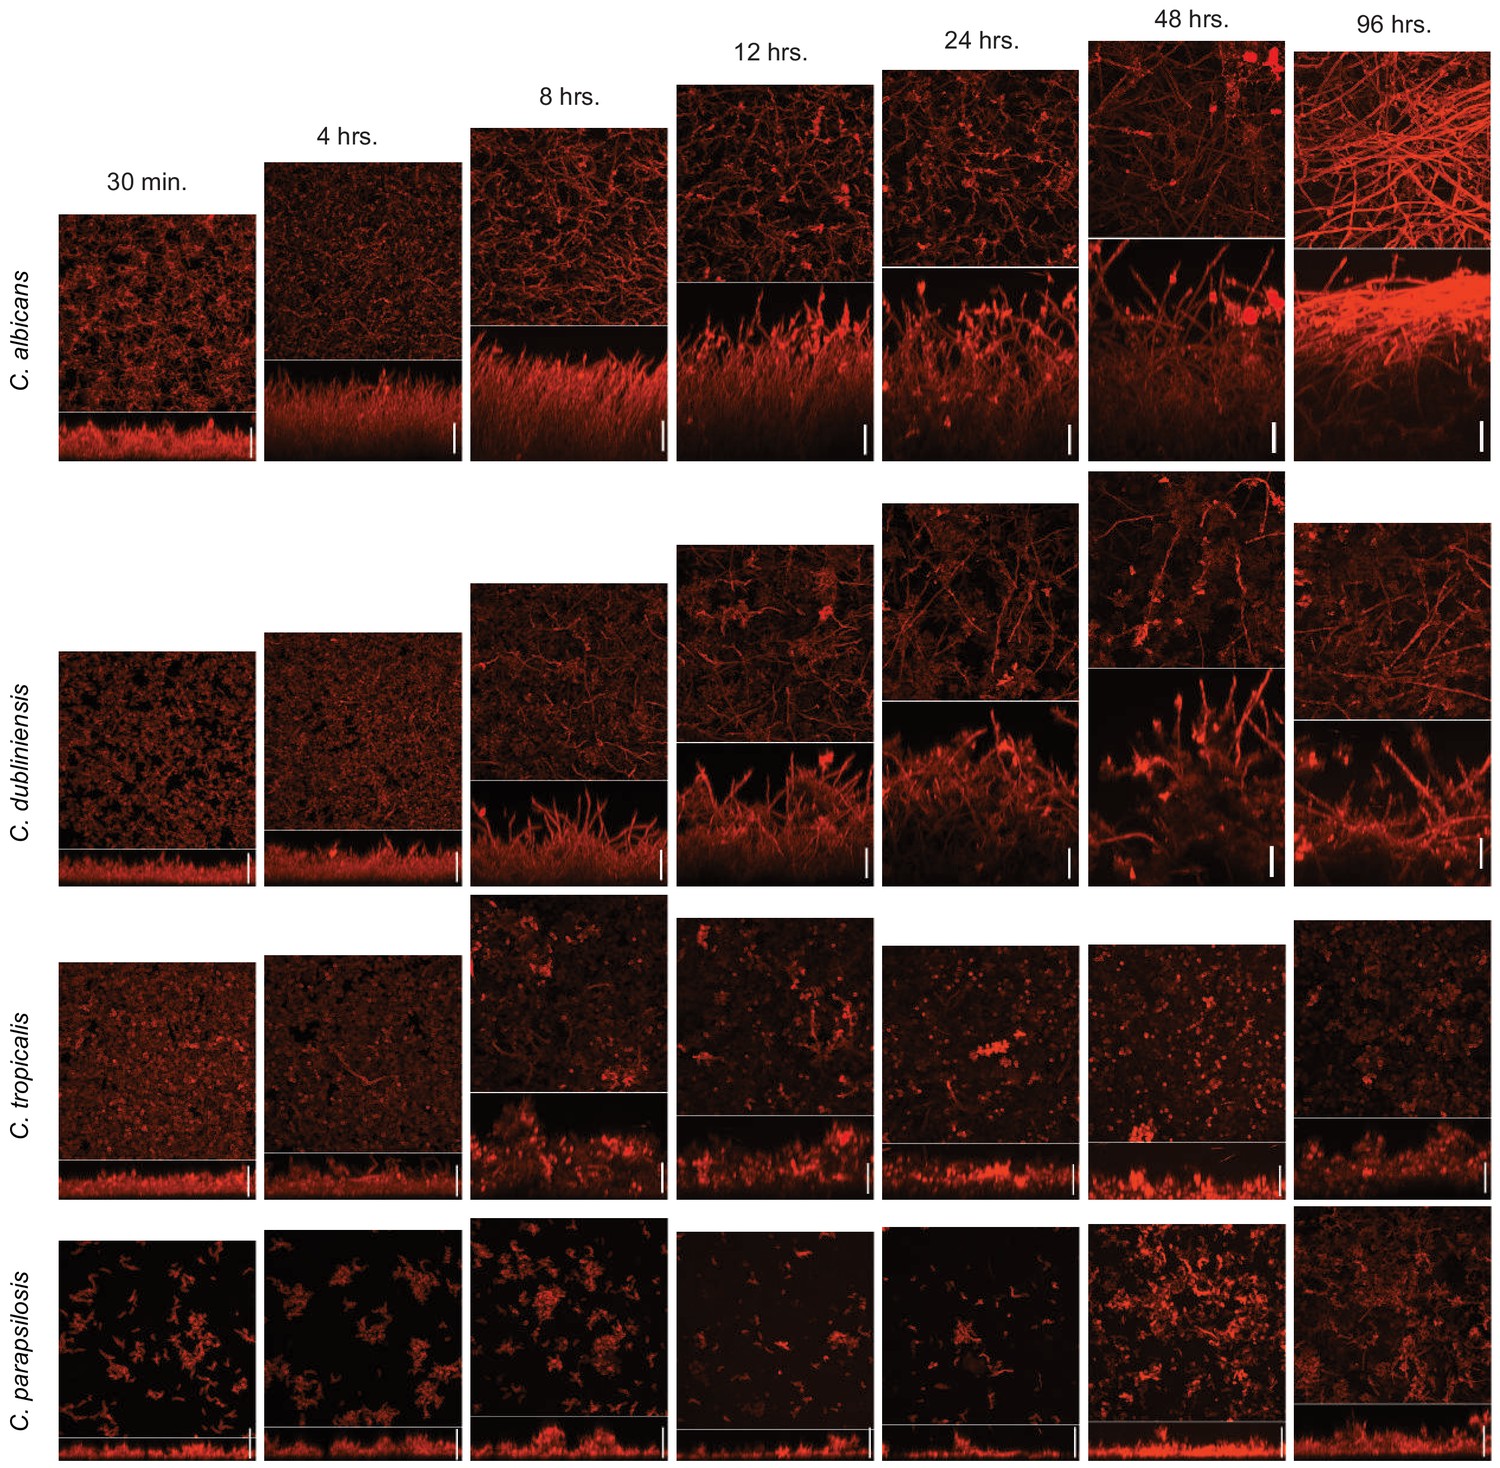
Time course of biofilm formation of C. albicans and its three most closely related Candida species.
Biofilms were grown in Spider medium on silicone squares at 37°C with shaking at 200 rpm. Biofilm formation was assessed by confocal scanning laser microscopy after 30 min, 4, 8, 12, 24, 48, and 96 hr of biofilm growth. In each micrograph, the lower panel shows the lateral maximal intensity projection while the upper panel shows the top maximal intensity projection. Scale bars represent 50 μm.
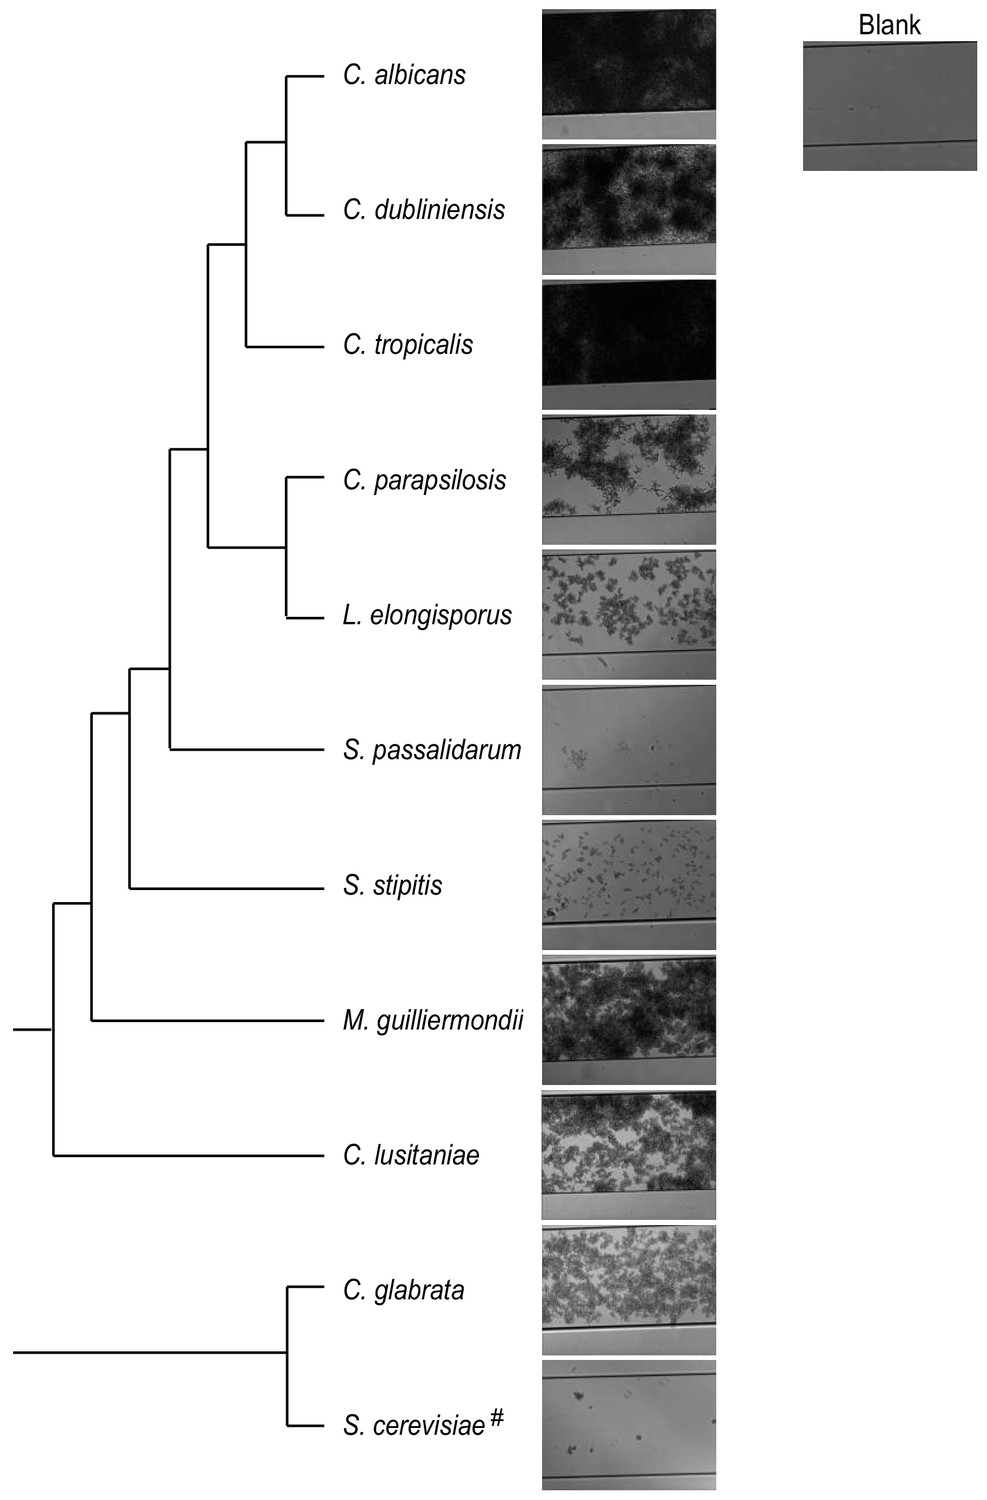
Figure 2—figure supplement 2
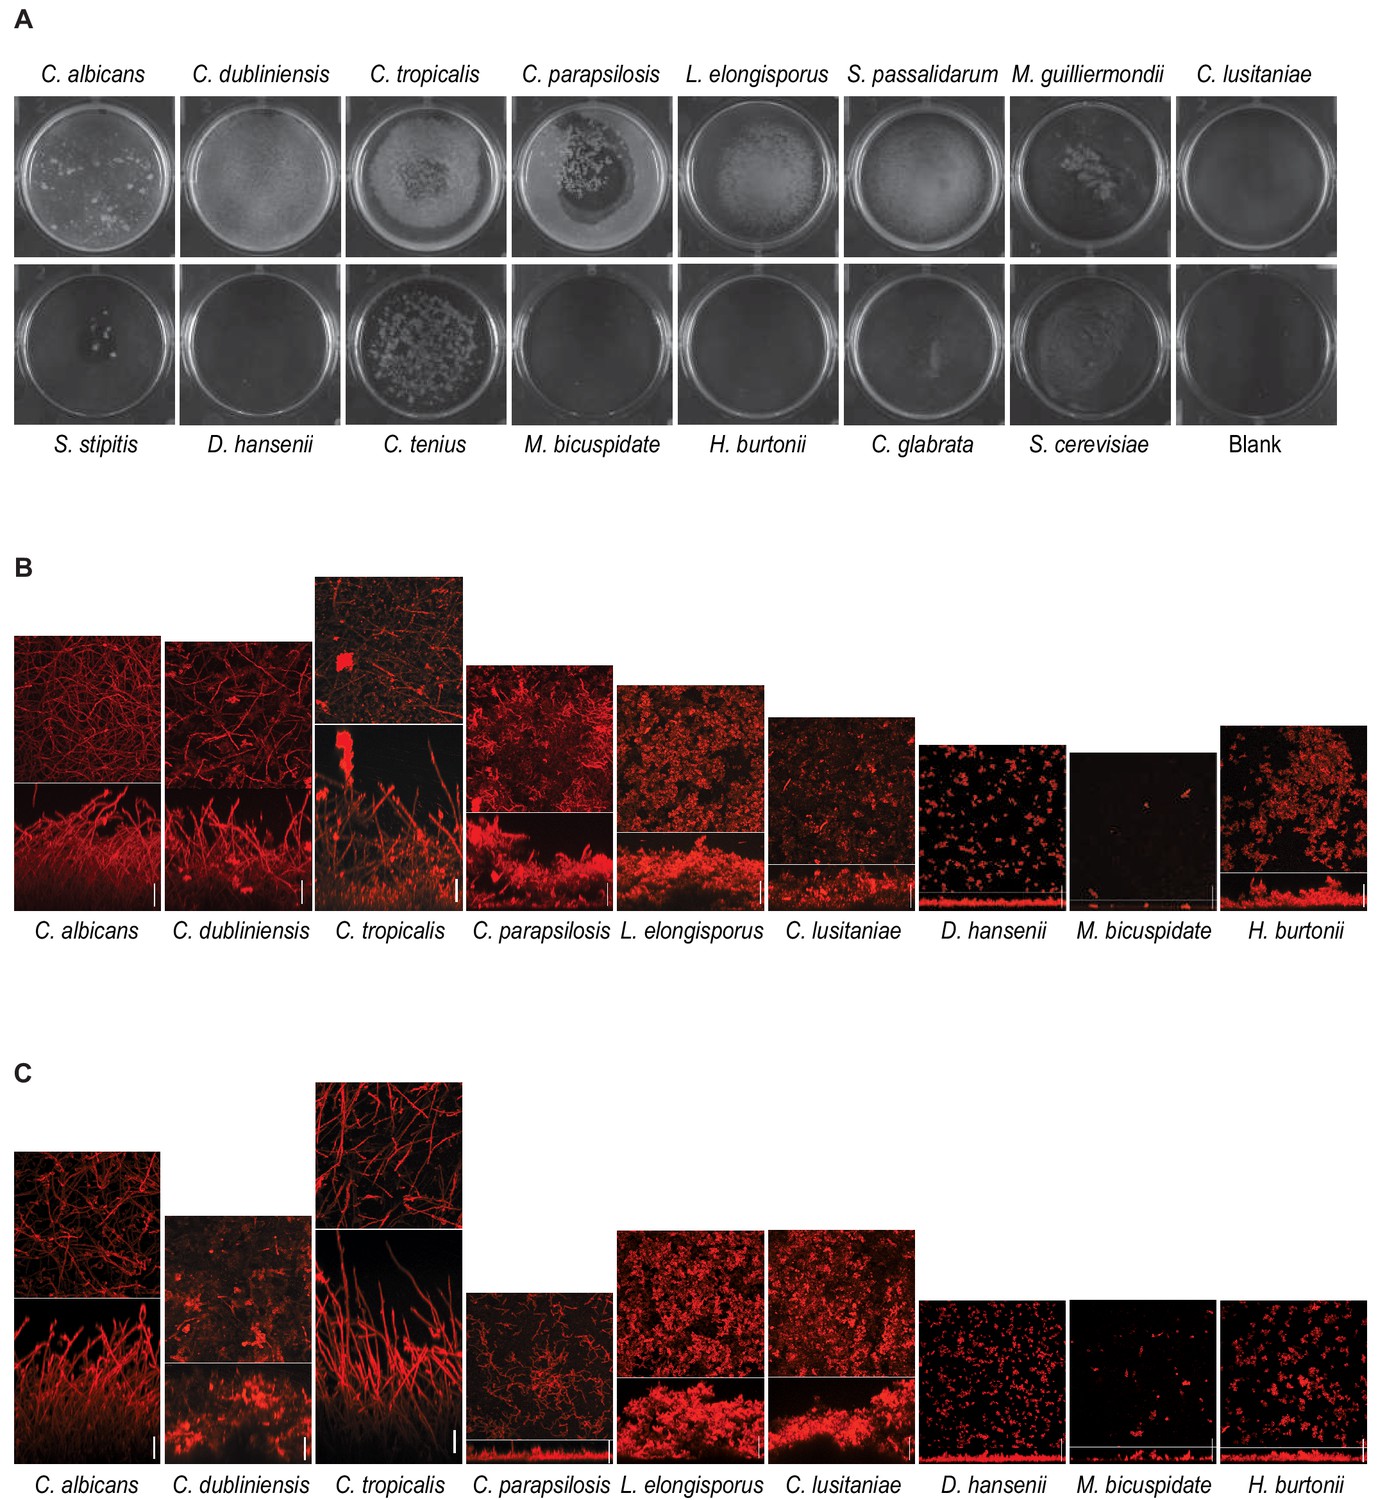
Biofilm formation by CTG species.
(A) Biofilms grown on the bottoms of polystyrene 6-well plates in Spider 1% glucose medium for 48 hr by the 13 CTG species analyzed. As a comparison, biofilms formed by C. glabrata and S. cerevisiae are also included. Assays were performed at 30°C for D. hansenii, C. tenuis, M. bicuspidate, H. burtonii, and S. cerevisiae and at 37°C for the rest. Blank indicates a well in which the assay was performed identically, but no cells were inoculated. (B) Confocal scanning laser microscopy micrographs of biofilms formed by different CTG species when grown on silicone squares in Spider 1% glucose medium for 48 hr as described in Materials and methods. The micrographs for C. albicans, C. dubliniensis, C. parapsilosis, L. elongisporus and D. hansenii are the same as in Figure 2B for comparison reasons. (C) same as in (B) but biofilms were grown in RPMI medium supplemented with 2% glucose. In the micrographs of each species in (C) and (B), the upper panels show top views and the lower panels e side views of the biofilms; scale bars represent 50 μm.
Figure 2—figure supplement 3
Biofilm formation in a microfluidic device by different CTG clade species was assayed as previously described (Gulati et al., 2017).
The medium used was Spider with 1% glucose and without mannitol. Assays were performed at 37 and 30°C for 24 hr. The hashtag indicates the species that does not grow well at 37°C and for which biofilms were grown at 30°C.
Figure 3 with 1 supplement
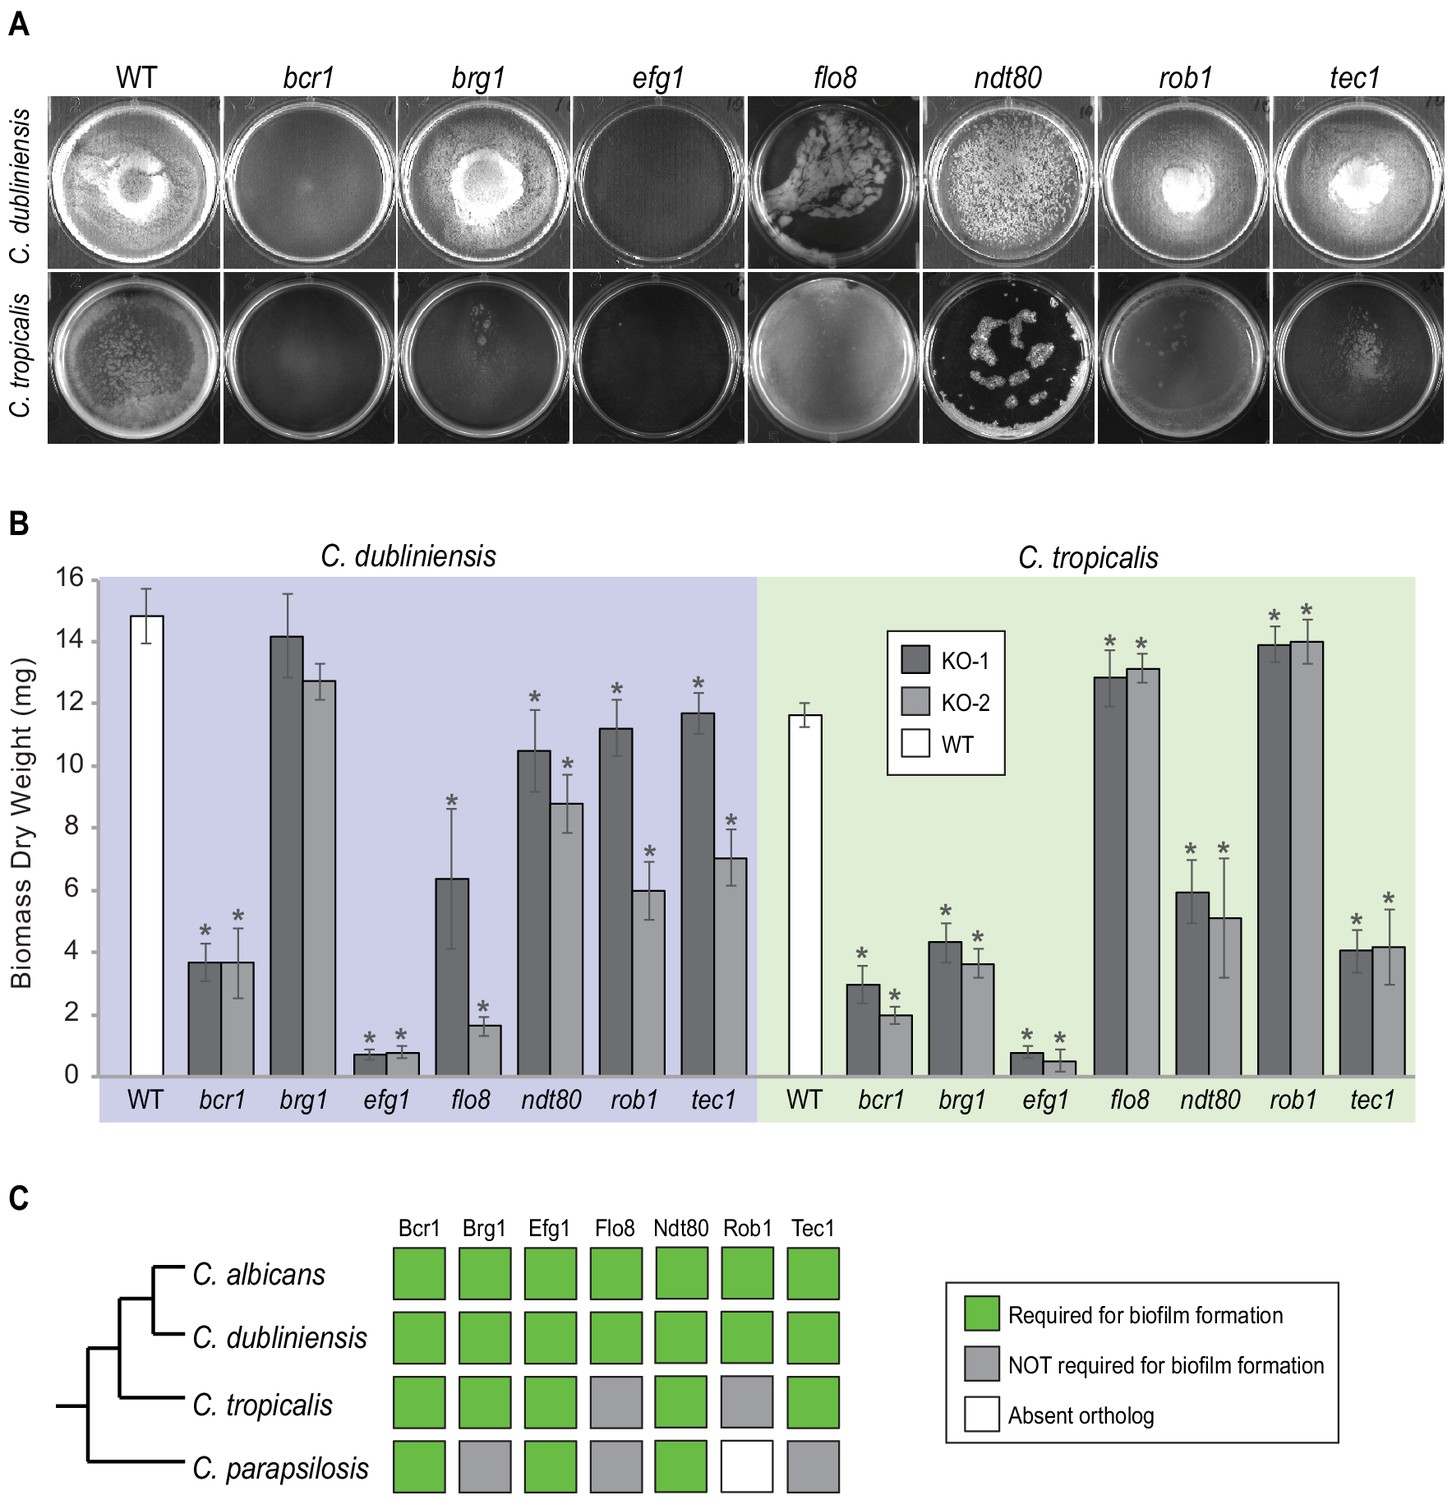
Roles of orthologs of the seven C. albicans master regulators in biofilm formation.
(A) Phenotypic characterization of biofilms formed by the gene deletion knockouts of orthologs of the seven master C. albicans biofilm regulators. Images show biofilms grown on the bottoms of polystyrene 6-well plates in Spider 1% glucose medium at 37°C for 48 hr. (B) Dry weights of biofilms formed by the gene deletion mutants grown as described in (A). The means and standard deviations were calculated from five replicates for two independent gene deletion knockout isolates (KO-1 and KO-2). Asterisks denote statistically significant different weights when compared to the corresponding parental strain using a Student’s two-tailed paired t test (p<0.05). Although the dry weight of the C. dubliniensis brg1 mutant is not statistically different from that of the wildtype, detailed analysis of this mutant by confocal scanning laser microscopy showed a clear biofilm formation defect (Figure 3—figure supplement 1). (C) Summary diagram showing the conservation of the seven master regulators in biofilm formation across the three most closely related species to C. albicans. The data for C. albicans was obtained from Nobile et al., 2012; Fox et al., 2015, and that for C. parapsilosis from Holland et al., 2014.
Figure 3—figure supplement 1
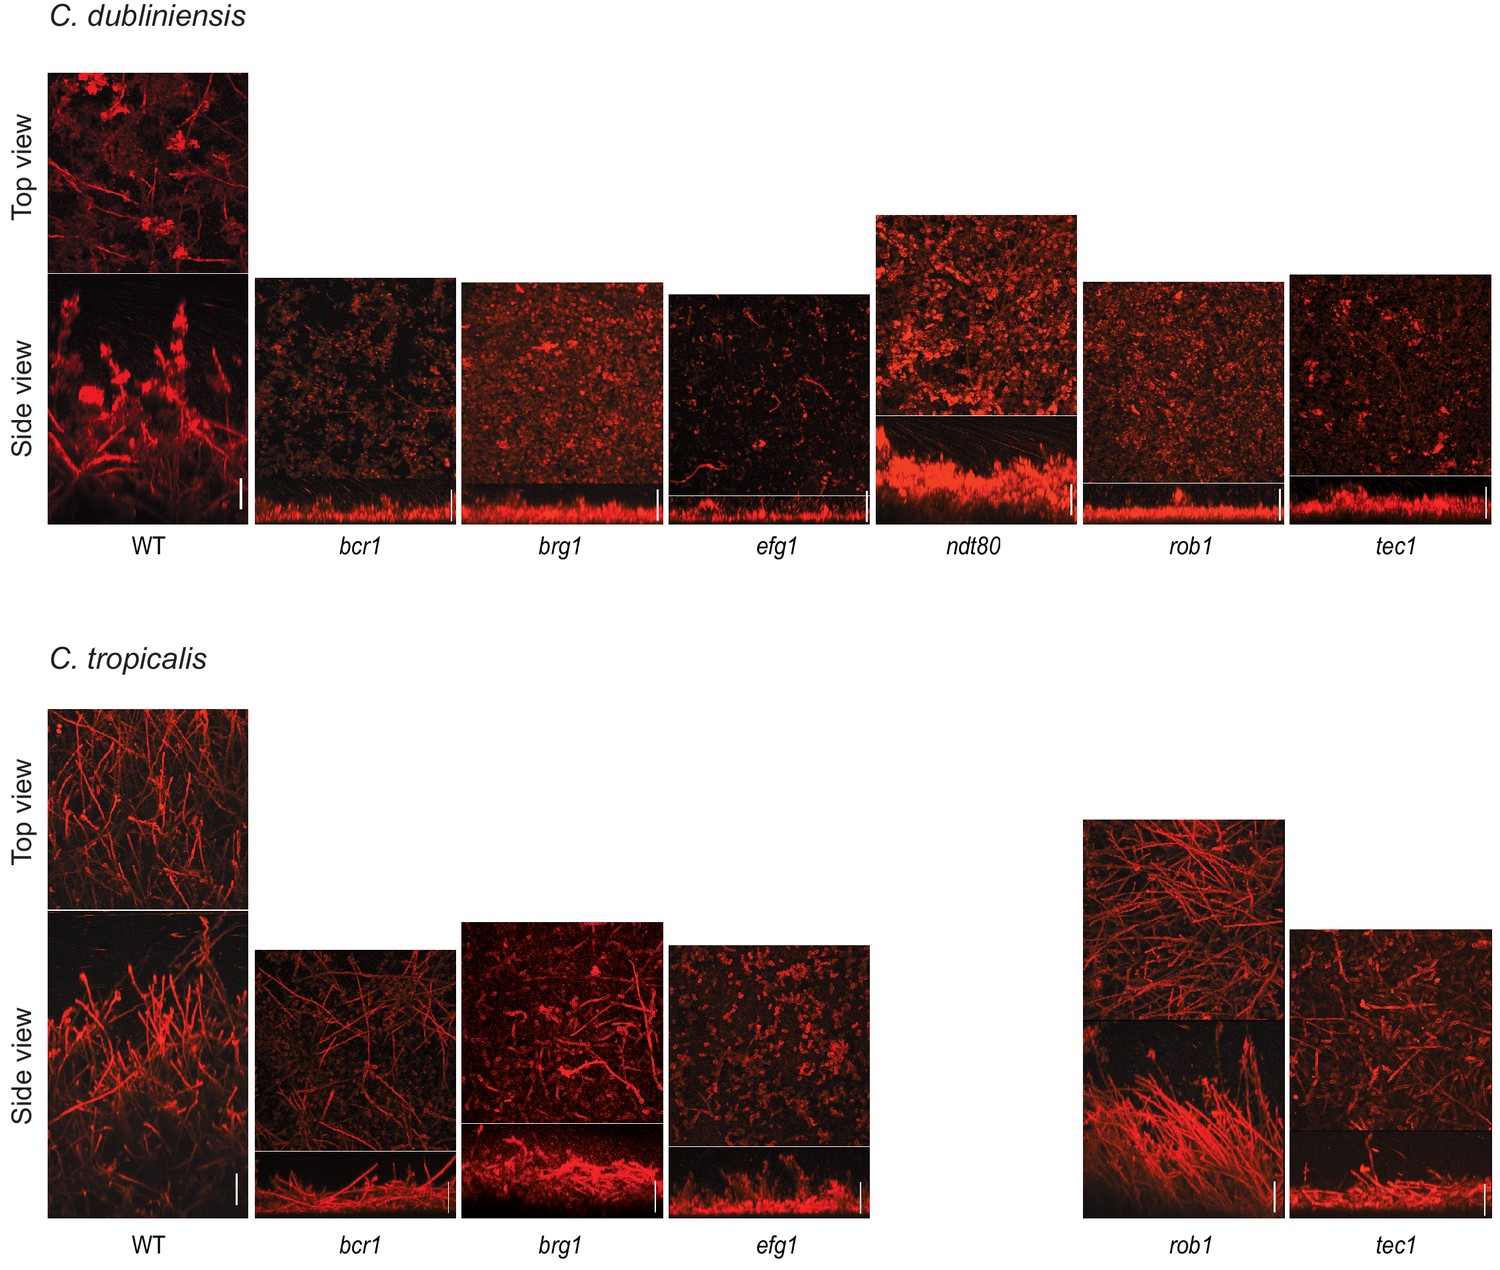
Morphology of biofilms formed by the gene deletion mutants of the biofilm regulators in C. dubliniensis and C. tropicalis visualized by confocal scanning laser microscopy .
Biofilms were grown as described in Materials and methods on the surfaces of silicone squares in Spider medium for C. dubliniensis and RPMI medium for C. tropicalis for 48 hr at 37°C. Scale bars represent 50 μm. The C. tropicalis ndt80 mutant as well as the flo8 mutants for both species were not analyzed by CSLM.
Figure 4 with 2 supplements
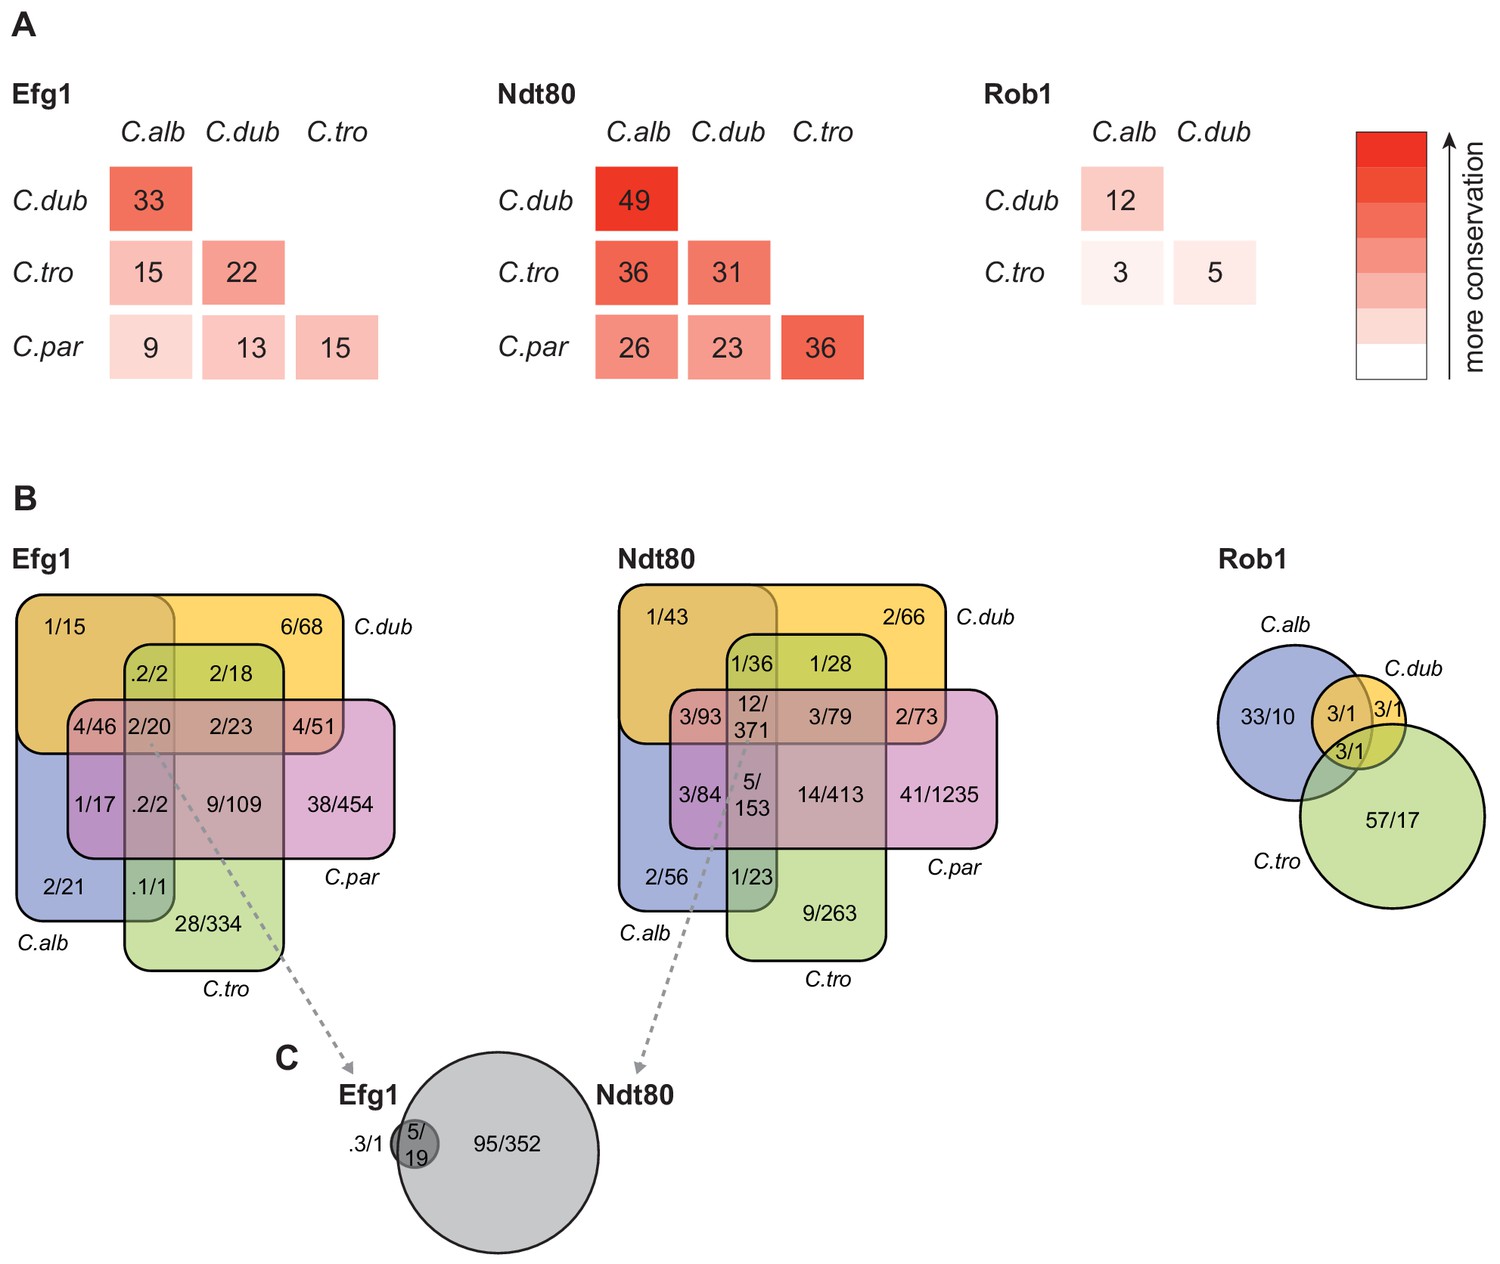
Connections between master regulators and target genes are highly divergent across species.
(A) Pairwise comparison of shared target genes for Ndt80, Efg1, and Rob1 between species. Target genes were determined by ChIP-seq as detailed in Materials and methods. The numbers represent the percentage of overall target genes conserved between each pair of species considering only genes that have orthologs in the two species. Note that Rob1 is absent in C. parapsilosis (Maguire et al., 2013). (B) Venn diagrams depicting the overlap of regulator-target gene connections across species, considering only genes that have orthologs in all four species for Efg1 and Ndt80 and considering genes that have orthologs in C. albicans, C. dubliniensis, and C. tropicalis for Rob1. Numbers in each section of the diagrams represent the percentage of master regulator-target gene connections, with the total number of connections for each regulator set at 100%, and the gross number of target genes. Note that for Efg1 and Ndt80 the size of the color sections does not correspond to the percentage. (C) Venn diagram depicting the overlap between target genes of Efg1 and Ndt80, considering only target gene orthologs that are present in all four species. As in (B), numbers represent the percentage of master regulator-target gene connections and gross number of target genes. The diagram indicates that, for genes that are targets of Efg1 and Ndt80 in all species, most Efg1-target gene connections are also Ndt80-target gene connections, even though the target genes themselves are different across species.
Figure 4—figure supplement 1
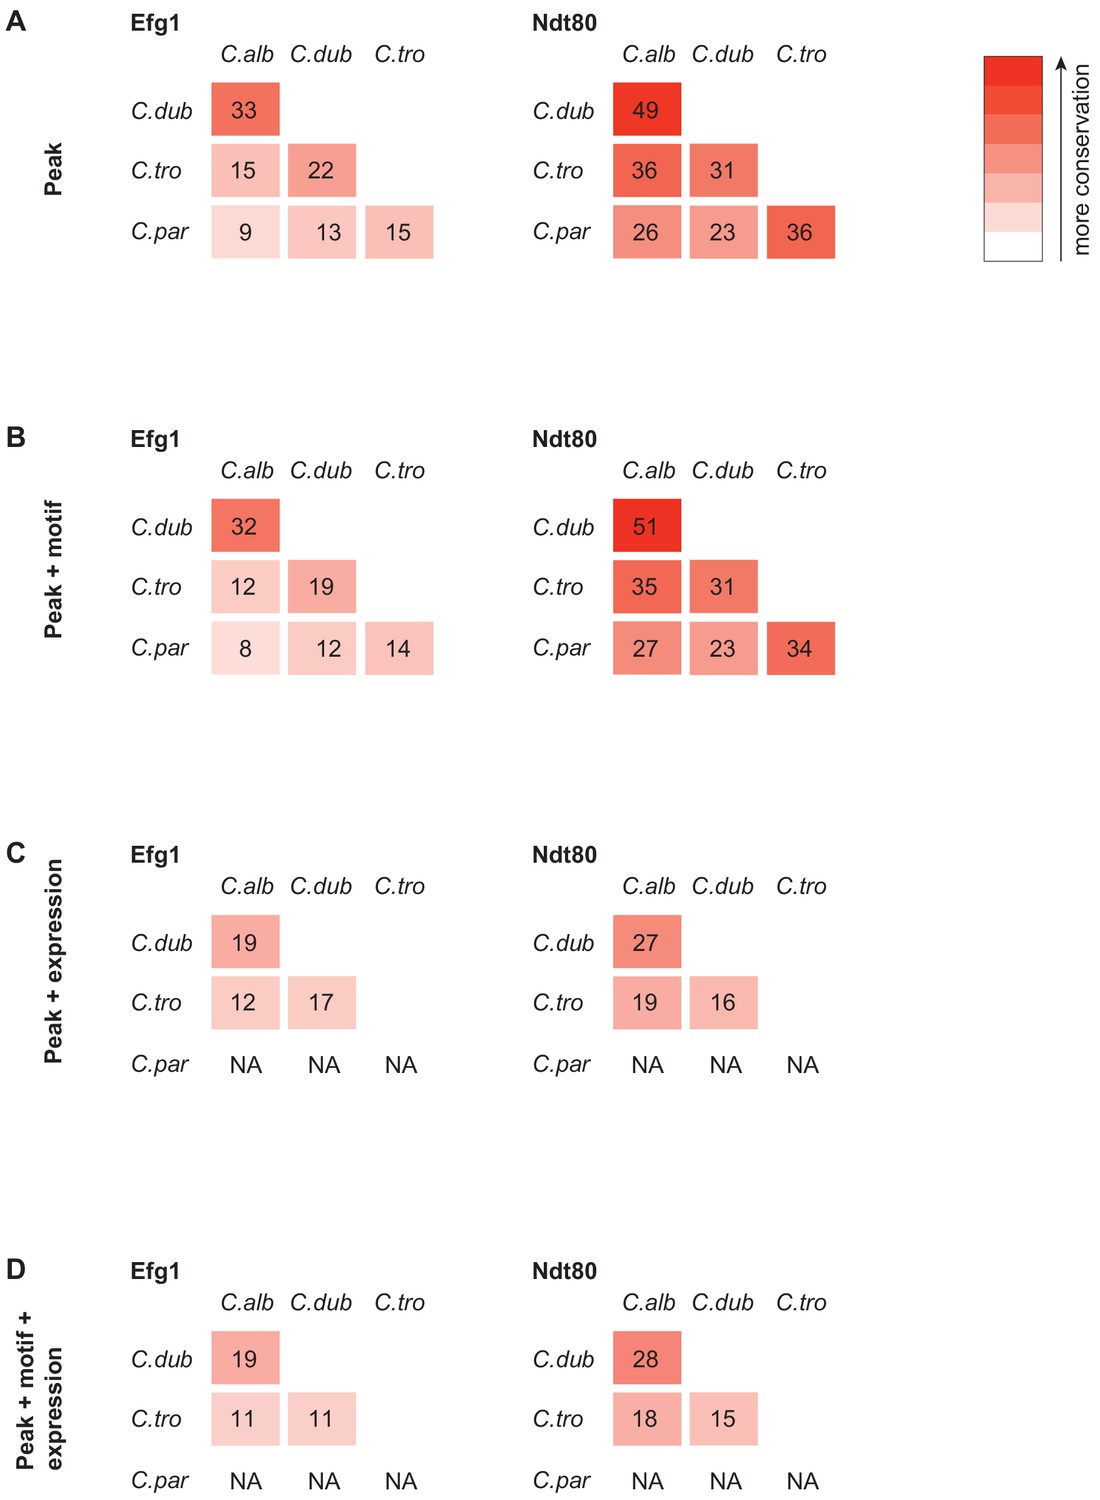
Efg1 and Ndt80 target gene conservation between species when using different criteria to identify targets.
This was performed similar to what was described previously (Nocedal et al., 2017). (A) Regulator gene target conservation when only using significant ChIP-seq signal over control in the upstream intergenic region as a criterion to identify gene targets. (B) Regulator gene target conservation when using ChIP-seq signal as in (A), but also filtering to include only those regions that also had a regulator binding motif in the upstream intergenic region. (C) Regulator gene target conservation when using ChIP-seq signal as in (A), but also twofold gene expression change during biofilm growth conditions to identify target genes. (D) Regulator gene target conservation when using ChIP-seq signal, regulator binding motif presence, and gene expression change during biofilm growth conditions to identify target genes. We did not perform gene expression profiling in C. parapsilosis, and therefore, gene expression changes could not be used as a criterion for comparison with C. parapsilosis.
Figure 4—figure supplement 2
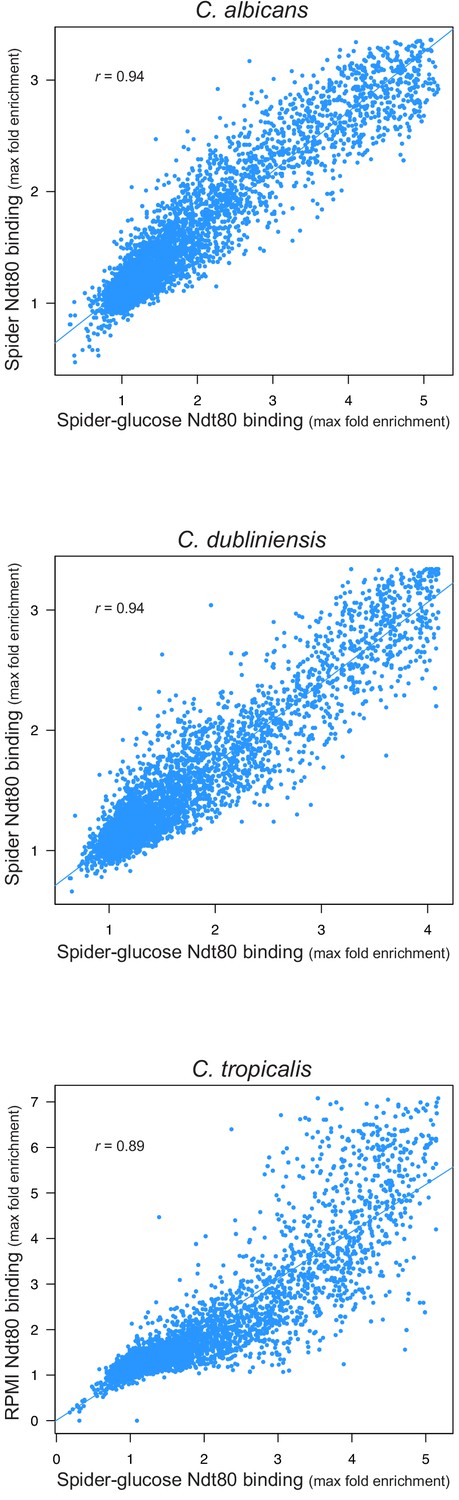
Ndt80 binding throughout the genome in biofilms grown using different media.
Biofilms were grown on the bottoms of 6-well polystyrene plates for 48 hr as described in Materials and methods. Binding was determined by ChIP-seq for biofilms grown in Spider 1% glucose medium for the three species and compared to binding for biofilms grown in Spider medium for C. albicans and C. dubliniensis, and RPMI medium for C. tropicalis. The maximum fold enrichment of each upstream intergenic region in the genome is plotted as well as the linear regression for each comparison. All correlations are highly significant (Pearson's correlation p-value<<0.001).
Figure 5
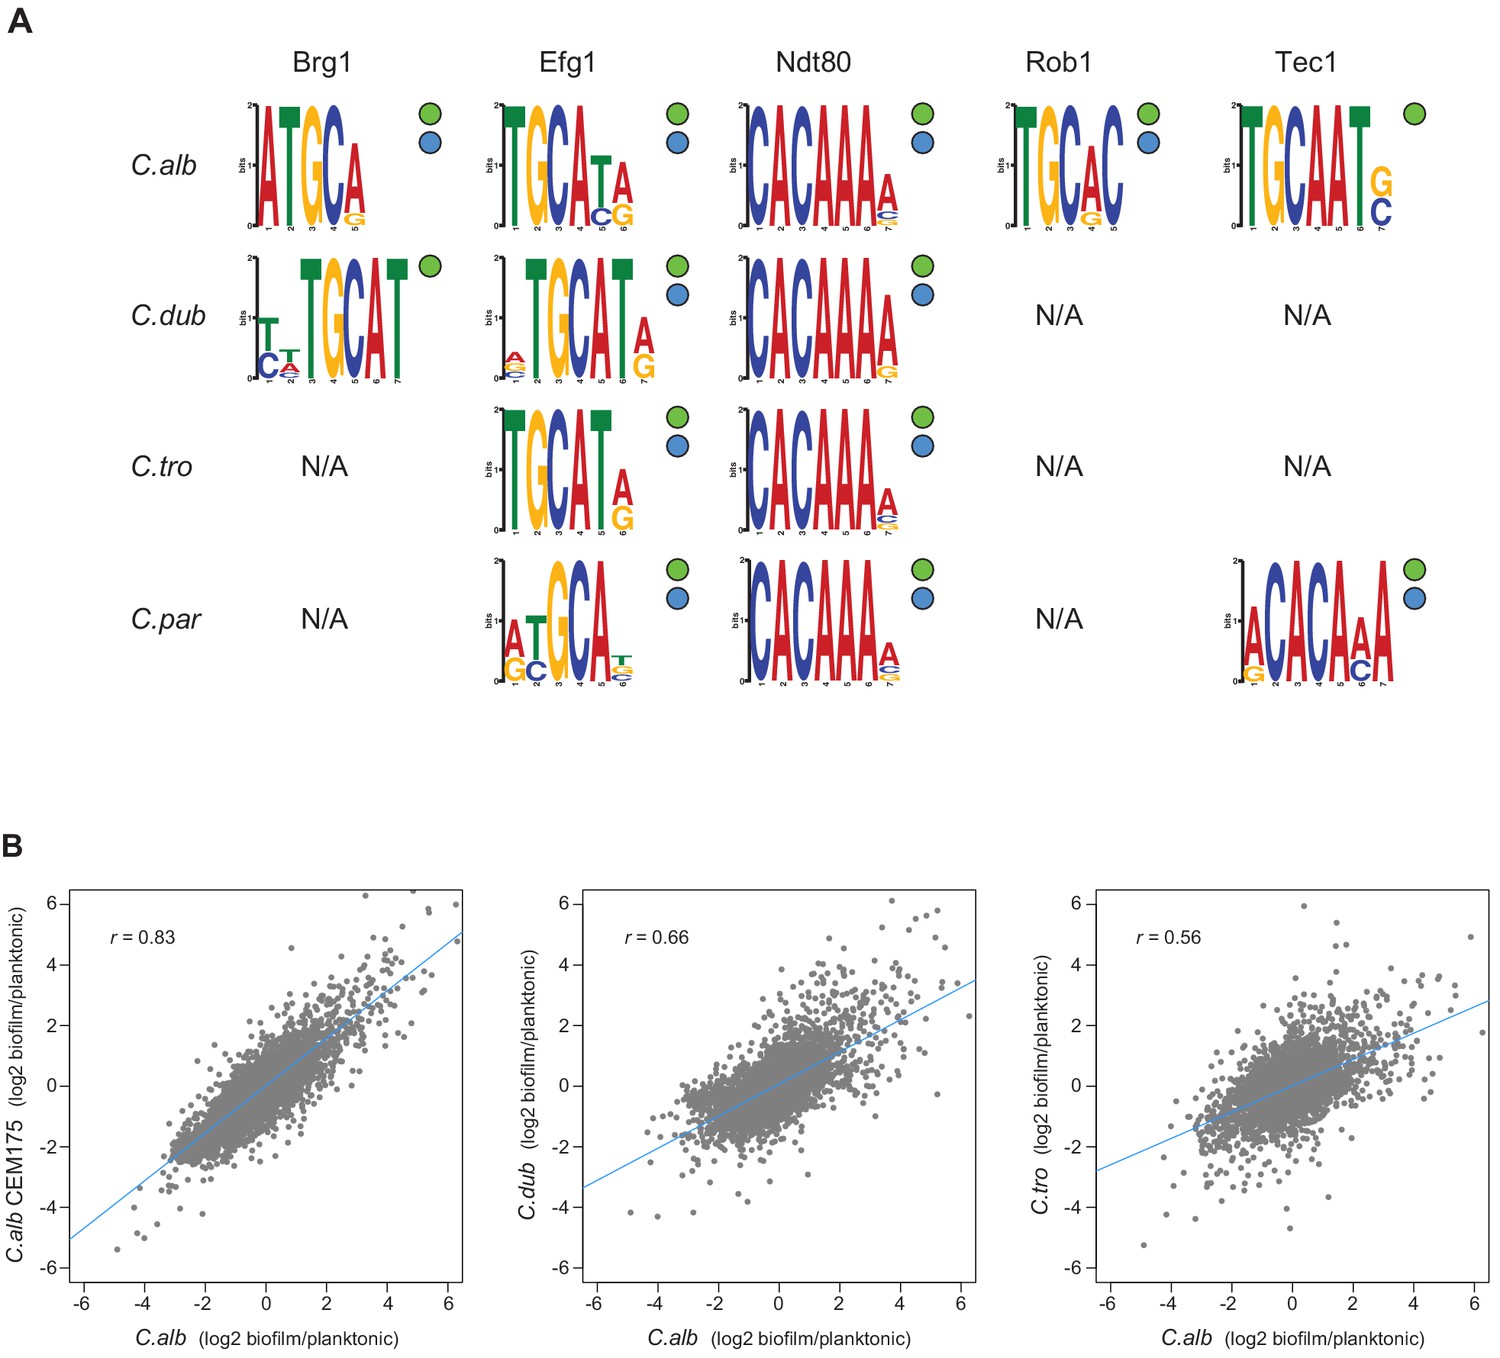
Master regulators retain their DNA-binding specificity while there is considerable variation in gene expression across species.
(A) Logos of the most enriched motif in the binding locations of the different master regulators, determined by ChIP-seq across species. The two circles to the right of each logo show whether the Efg1 (green circle) or Ndt80 (blue circle) previously known motifs are enriched in each set of regulator binding locations. (B) Pairwise comparison of transcription profiles under biofilm-forming conditions (a time point of 48 hr) of C. albicans against C. dubliniensis and C. tropicalis. As a reference, the comparison between two isolates of C. albicans is shown in the left panel. Biofilm-specific expression changes were calculated comparing gene expression between biofilm and planktonic growth conditions in the same media. Linear regressions are shown in blue for each comparison.
Figure 6 with 1 supplement

Ndt80 ChIP-seq in a hybrid and rate of conservation change of the different network components.
(A) Genome-wide comparison of C. albicans and C. dubliniensis Ndt80 binding in the hybrid strain. Binding to both the C. albicans (dark blue filled dots) and the C. dubliniensis (light blue empty dots) genomes is depicted. The maximal fold enrichment for each upstream intergenic region in the genome is plotted as well as the linear regression for each comparison. The left panel shows the C. albicans Ndt80–C. dubliniensis Ndt80 comparison while the right panel shows, as a reference, the comparison of the two experimental replicates that are most dissimilar. (B) Comparison between the master regulators required for biofilm formation, the Efg1 and Ndt80 binding targets, and biofilm gene expression, as a function of evolutionary distance. Master regulator conservation is depicted as the percentage of C. albicans regulators required for biofilm formation. Efg1 and Ndt80 target conservation reflect the percentage of targets shared by the different species pairs. Gene expression conservation represents the number of genes whose expression changes at least 1.5 log2 fold under biofilm-forming conditions between each species pair. The C. parapsilosis gene expression data is from Holland et al., 2014, and 1.5 log2 fold was chosen as a cutoff because this was the cutoff used in this prior study. There are three estimates of master regulator conservation because comparisons were performed between C. albicans and each of the other three species, while there are six estimates of binding target and gene expression conservation since comparisons were performed in pairs between all four species. Linear regressions are shown in the corresponding color. Evolutionary distance as substitutions per site was calculated from a phylogenetic tree of these species, inferred from protein sequences of 73 highly conserved genes (Lohse et al., 2013).
Figure 6—figure supplement 1
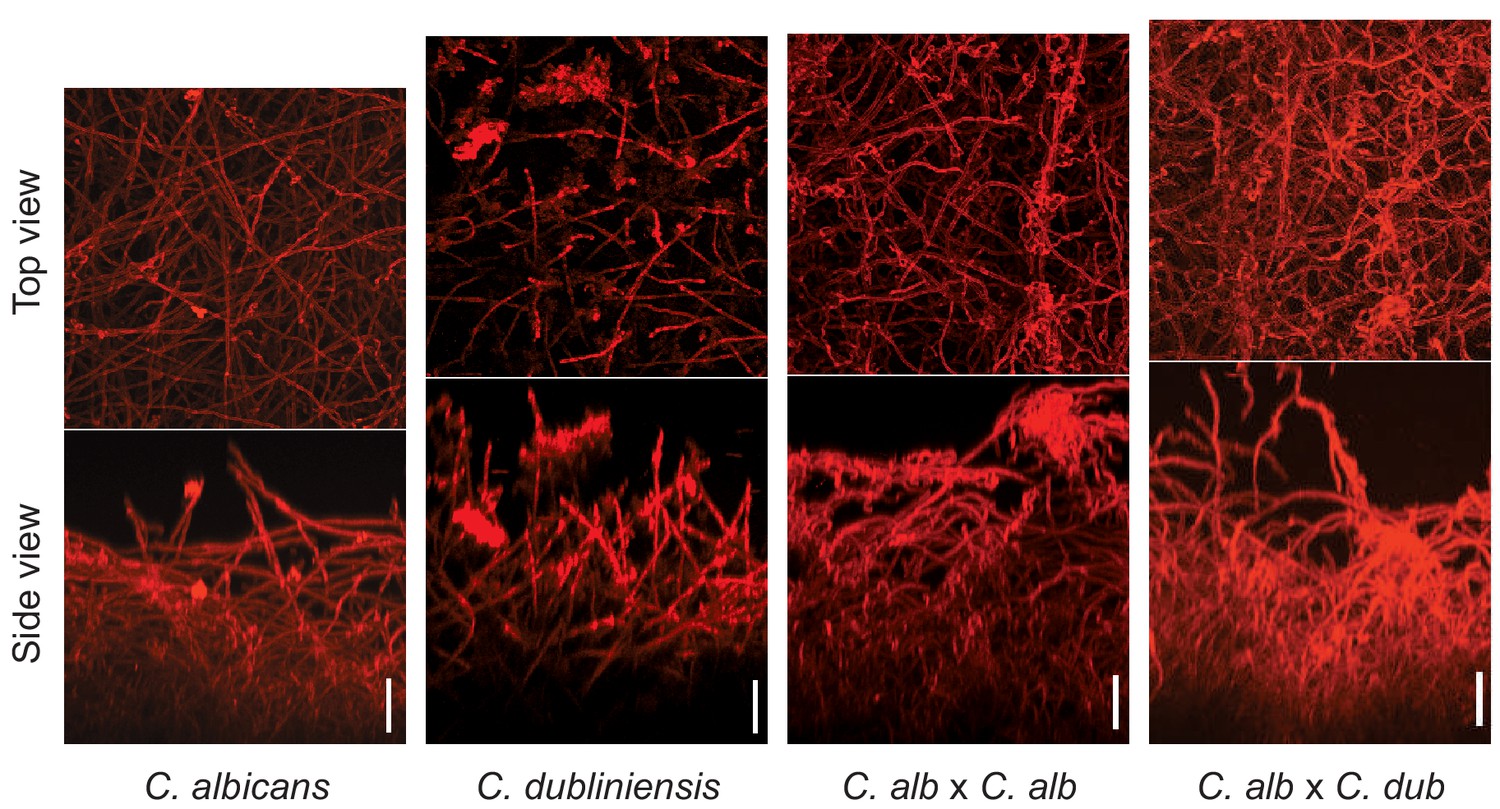
Morphology of biofilms formed by the C. albicans–C. dubliniensis tetraploid hybrid (C. albicans × C. dubliniensis) visualized by confocal scanning laser microscopy.
For comparison, the biofilms formed by C. albicans, C. dubliniensis, and a C. albicans tetraploid (C. albicans × C. albicans) are also shown. Biofilms were grown as described in Materials and methods on the surfaces of silicone squares in Spider medium for 48 hr at 37°C. Scale bars represent 50 μm.
Additional files
-
Supplementary file 1
Supplementary Tables.
(a) Biofilm formation of C. albicans and its three most closely related species in different media. Biofilms were grown on silicone squares at 37°C with shaking at 200 rpm. Biofilm formation was assessed by confocal scanning laser microscopy after 48 hr of growth. Spider medium was prepared with 1% nutrient broth, 0.4% potassium phosphate, and adjusted to pH 7.2. RPMI media used was RMPI 1640 with 165 mM MOPS and L-glutamine and without sodium bicarbonate (Lonza, 04-525F). YNB media was prepared with 0.67% yeast nitrogen base with ammonium sulfate. Question marks denote conditions where it was not possible to visualize the biofilms since the dye did not stain them. (b) Number of genes bound by each regulator in the four Candida species studied. ‘NA’ indicates experiments that were not performed because the regulator was not tagged (C. parapsilosis Bcr1 and Flo8) or due to the absence of an ortholog (C. parapsilosis Rob1). Zeros denote experiments for which the ChIP-seq was not successful. (c) Master regulator binding to each other's upstream intergenic regions. Numbers represent the number of species in which binding was observed. The maximum possible number of species for which we have data is shown in parenthesis for each master regulator. (d) Strains used in this study.
- https://cdn.elifesciences.org/articles/64682/elife-64682-supp1-v2.xlsx
-
Transparent reporting form
- https://cdn.elifesciences.org/articles/64682/elife-64682-transrepform-v2.pdf
Download links
A two-part list of links to download the article, or parts of the article, in various formats.
Downloads (link to download the article as PDF)
Open citations (links to open the citations from this article in various online reference manager services)
Cite this article (links to download the citations from this article in formats compatible with various reference manager tools)
Evolution of the complex transcription network controlling biofilm formation in Candida species
eLife 10:e64682.
https://doi.org/10.7554/eLife.64682


