Disease-related mutations in PI3Kγ disrupt regulatory C-terminal dynamics and reveal a path to selective inhibitors
- Department of Biochemistry and Microbiology, University of Victoria, Canada
- Department of Chemistry and Biochemistry, University of California San Diego, United States
- University of Basel, Department of Biomedicine, Switzerland
- Department of Biochemistry and Molecular Biology, The University of British Columbia, Canada
Figures
Figure 1 with 2 supplements

Mutations in the regulatory C-terminal motif of the kinase domain alter PI3Kγ activity.
(A) Domain architecture of p110γ (PDB ID: 6AUD) (Safina et al., 2017), with the domain schematic shown beneath. (B) Model of the C-terminal regulatory motif of the kinase domain of p110γ. The helices that make up the regulatory motif, which includes the regulatory arch (kα10, 11,12) and those that pack against them (kα7, 8, 9) are highlighted in green both in the structural model and cartoon schematic. (C) Alignment of residues around R1021 in p110γ with class IA p110 isoforms. (D) A close up of the W1080 ‘Tryptophan lock’ interaction with kα7 and the kα4-kα5 loop which maintains an inhibited conformation is shown, as well as the interaction of the R1021 residue with residues on the kα10-kα11 loop. (E) Lipid kinase activity assays testing the activity of WT, R1021C, and R1021P p110γ/p101 WT basally and in the presence of lipidated Gβγ and HRas. Experiments were carried out with 50–3000 nM kinase, 1500 nM Ras, 1500 nM Gβγ, all in the presence of 100 µM ATP and 1 mg/mL PM-mimic vesicles 5% phosphatidylinositol 4,5 bisphosphate (PIP2), 20% phosphatidylserine (PS), 10% phosphatidyl choline (PC), 50% phosphatidylethanolamine (PE), 10% Cholesterol, 5% sphingomyelin (SM). (F) Activity assays testing the intrinsic ATPase activity (ATP conversion in the absence of membrane substrate) for wild type and mutant p110γ/p101 complexes. (G) Lipid kinase activity assays testing the activity of WT and R1021C for the free p110γ catalytic subunit with and without lipidated Gβγ. Lipid kinase activity was generated by subtracting away non-specific ATPase activity, for unstimulated WT p110γ there was no detectable lipid kinase activity above basal ATPase activity (N.D.). For panels E-G every replicate is plotted, with error shown as standard deviation (n = 3–6). Two tailed p-values represented by the symbols as follows: ***<0.001; **<0.01; *<0.05; n.s. > 0.05. Refer to the Figure 1—source data 1 file for the specific activity values.
-
Figure 1—source data 1
Summary of HDX-MS data sets (see attached excel source data files).
For every HDX figure, there is one source data file with two pieces of data. In the first tab, the charge state (Z), residue start (S), maximum deuterium incorporation (Max D), residue end number (E), and retention time (RT) are displayed for every peptide. Data listed is the mean of 3 independent experiments, with SDs presented. Time points are labelled, and the relative level % deuterium incorporation is coloured according to the legend. Peptides with significant changes in % D between conditions are highlighted according to the legend. The second tab contains the HDExaminer output data which displays the S, E, Z, Max D, RT, #D incorporation, %D incorporation, and confidence score for every peptide in each time point and condition.
- https://cdn.elifesciences.org/articles/64691/elife-64691-fig1-data1-v2.xlsx
Figure 1—figure supplement 1

Comparing the different regulatory mechanisms that maintain the C-terminal regulatory motif in a inhibited state in the class I PI3Ks.
(A) A structural model comparing the architecture of the C-terminal regulatory motif in PIK3CG (PI3Kγ, PDB: 6AUD [Safina et al., 2017]). PIK3CA (PI3Kα, PDB: 4JPS [Furet et al., 2013]), PIK3CB (PI3Kβ, PDB: 2Y3A [Zhang et al., 2011]). The activation loop is shown in orange, with the kα12 helix shown in red (not a helix in PI3Kα). The p85 regulatory subunits interacting with the motif in PI3Kα and PI3Kβ are shown in blue, with the domains of the nSH2, iSH2, and cSH2 annotated on the structure. (B) Cartoon model shown in the same format as in Figure 1, highlighting the regulatory motif and its interaction with regulatory subunits. (C) Cartoon model highlighting putative conformational changes in the regulatory motif required for membrane binding.
Figure 1—figure supplement 2

Purification of mutated p110γ / p101 complexes.
(A) SDS-page analysis of the final complexes after size exclusion chromatography. The location of size markers are shown on the left. (B) Gel filtration elution of the wild type and mutant p110γ/p101 complexes on a Superdex 200 10/300 GL Increase column.
Figure 2 with 1 supplement
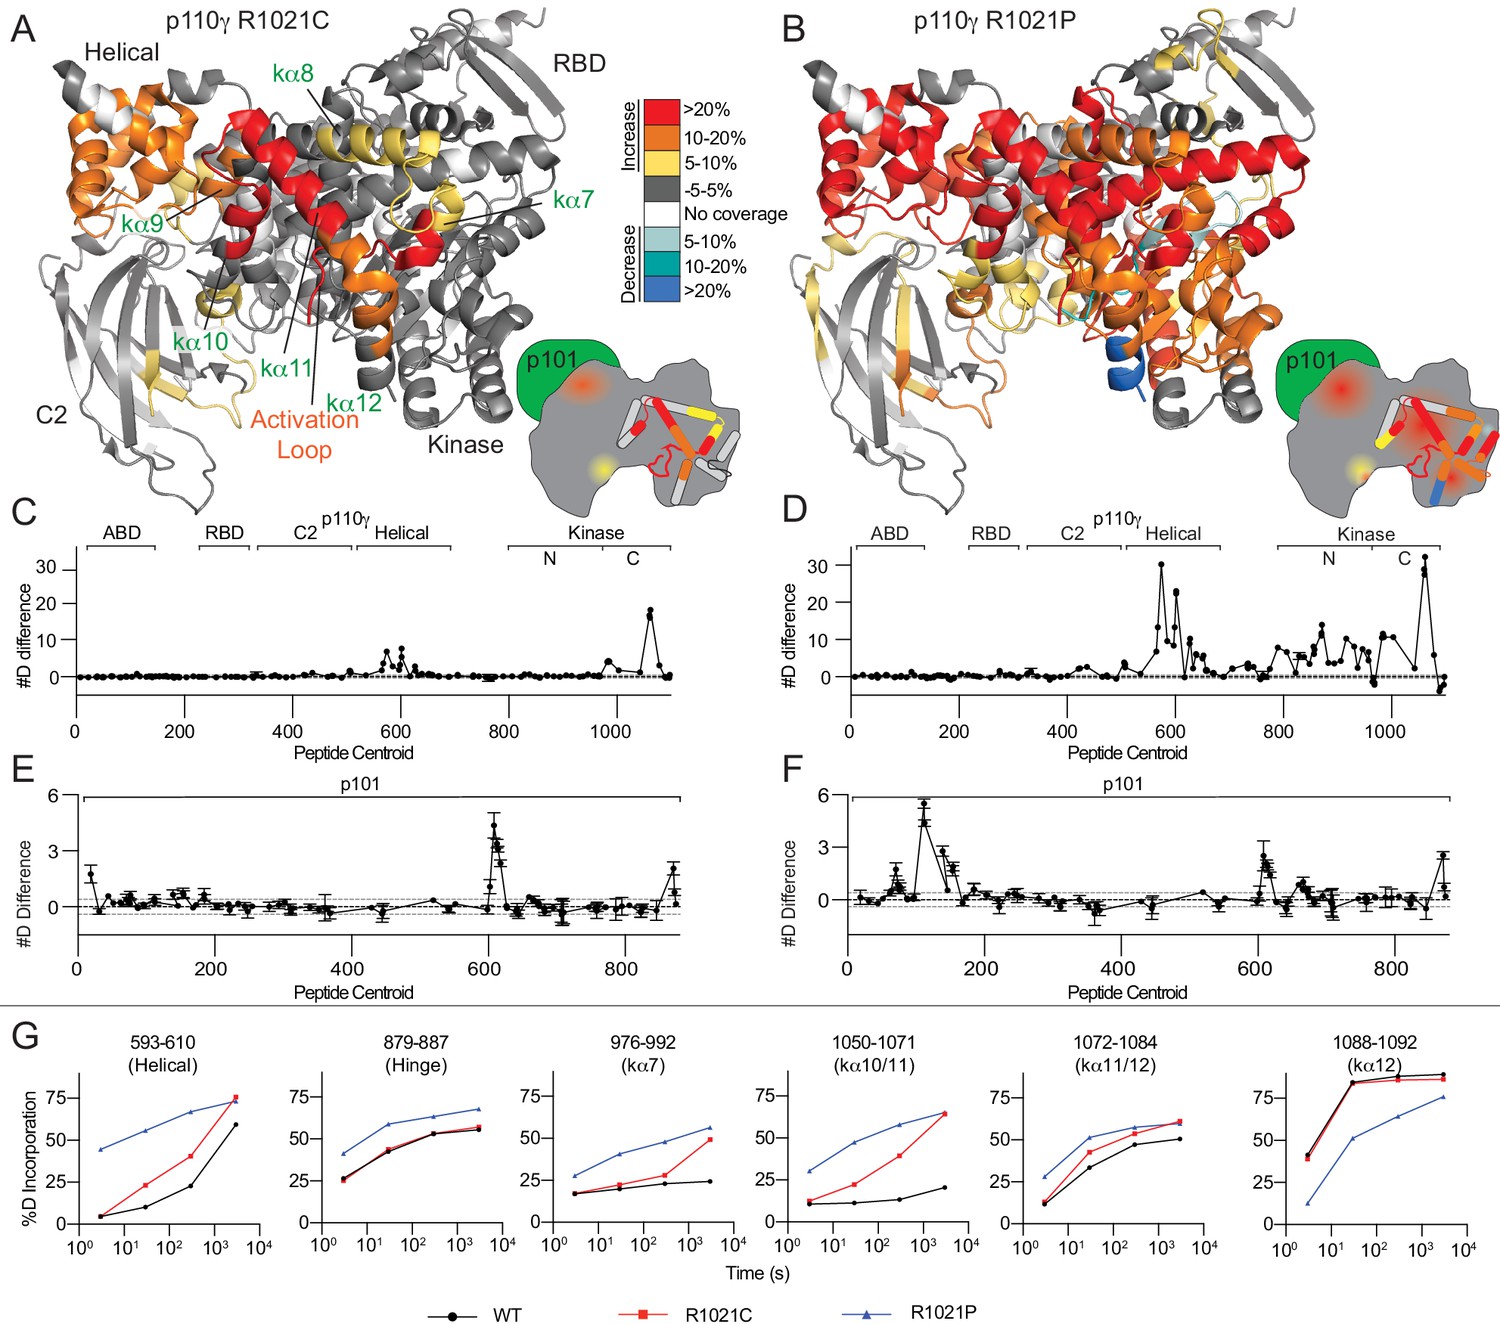
R1021C and R1021P mutations in p110γ are destabilising, with R1021P leading to global destabilisation and R1021C leading to localised disruption of the C-terminal regulatory W1080 Tryptophan ‘lock’.
(A+B) Peptides showing significant deuterium exchange differences (>5%,>0.4 kDa and p<0.01 in an unpaired two-tailed t-test) between wild-type and R1021C (A) and wild-type and R1021P (B) p110γ/p101 complexes are coloured on a model of p110γ (PDB: 6AUD)(Safina et al., 2017). Differences in exchange are coloured according to the legend. (C+D) The number of deuteron difference for the R1021C and R1021P mutants for all peptides analysed over the entire deuterium exchange time course for p110γ. Every point represents the central residue of an individual peptide. The domain location is noted above the primary sequence. A cartoon model of the p110γ structural model is shown according to the legend in panels A+B. Error is shown as standard deviation (n = 3). (E+F) The number of deuteron difference for the R1021C and R1021P mutants for all peptides analysed over the entire deuterium exchange time course for p101. Every point represents the central residue of an individual peptide. Error is shown as standard deviation (n = 3). (G) Selected p110γ peptides that showed decreases and increases in exchange are shown. The HDExaminer output data and the full list of all peptides and their deuterium incorporation is shown in the Figure 2—source data 1 file.
-
Figure 2—source data 1
Source data for HDX-MS comparing p110g/p101 and mutants.
- https://cdn.elifesciences.org/articles/64691/elife-64691-fig2-data1-v2.xlsx
Figure 2—figure supplement 1

Differences in HDX for the R1021C mutation in free p110γ.
(A) Peptides showing significant deuterium exchange differences (>5%,>0.4 kDa and p<0.01 in an unpaired two-tailed t-test) between p110γ wild-type and R1021C. Differences are coloured on a model of p110γ (PDB: 6AUD). (B) The number of deuteron difference for the R1021C mutant for all peptides analysed over the entire deuterium exchange time course for p110γ. (C) Selected p110γ peptides that showed significant decreases and increases in exchange are shown (>5%, >0.4 kDa and p<0.01 in an unpaired two-tailed t-test). (D) Selected p101 peptides that showed differences in exchange (>5%, >0.4 kDa and p<0.01 in an unpaired two-tailed t-test) are shown. (E) The number of deuteron difference between free p110γ and p110γ/p101 (black) and free p110γ R1021C and p110γ/p101 R1021C (red) for all peptides analysed over the entire deuterium time course for p110γ. The HDExaminer output data and the full list of all peptides and their deuterium incorporation is shown in the Figure 2—figure supplement 1—source data 1 file. (F) Selected p110γ peptides from experiments comparing wild-type p110γ and p110γ R1021C, and wild-type p110γ/p101 and p110γ/p101 R1021C. The full list of all peptides and their deuterium incorporation is shown in Source Data.
-
Figure 2—figure supplement 1—source data 1
Source data for HDX-MS comparing free p110g and free p110g R1021C.
- https://cdn.elifesciences.org/articles/64691/elife-64691-fig2-figsupp1-data1-v2.xlsx
Figure 3 with 1 supplement
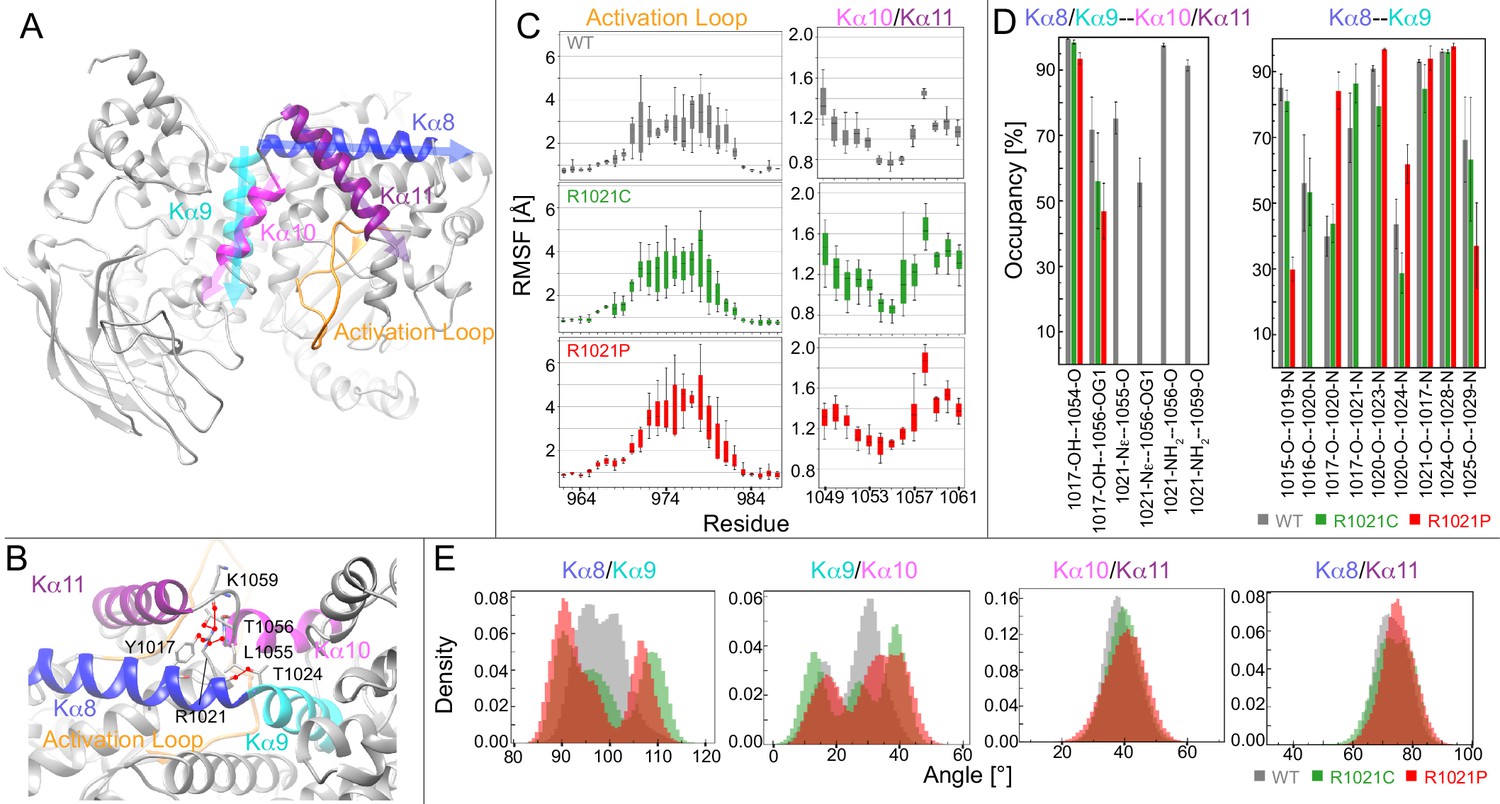
Molecular dynamic simulations reveal that the R1021C and R1021P mutations show increased instability in p110γ.
(A) Model of p110γ showcasing the regulatory domain’s kα8 (995–1023), kα9 (1024–1037), kα10 (1045–1054), and kα11 (1057–1078) helices, and the activation loop (962-988). (B) A zoomed-in snapshot of R1021 microenvironment showing residues in licorice. Hydrogen bonds with R1021 are drawn as red lines. (C) RMSF [Å] of each residue’s Cα and Cβ atoms in the activation loop and the kα10/kα11 helices, respectively. RMSF values for each atom across replicates are shown as a quantile plot, with error shown as standard deviation (n = 3). (D) The mean and standard deviation of hydrogen bond occupancies between the indicated helices/sets of helices across replicates (n = 3). (E) Inter-angle density distributions across all replicas between kα8, kα9, kα10, and kα11. In all panels, WT, R1021C, and R1021P are coloured in grey, green, and red, respectively.
Figure 3—figure supplement 1

Differences between molecular dynamic simulations of WT, R1021C, and R1021P.
(A) Principal component analysis (PCA) plots showing PC1 vs. PC2 of Kα7/8 (989–1023), Activation loop (962-988), hinge (879-887), kα9/10 (1024–1054), and kα11/12 (1057–1088) for WT (grey), R1021C (green), and R1021P (red) (B–C) The mean and standard deviation of hydrogen bonding occupancies between kα8 and kα9 (B), kα10 and kα11 (C) across replicates for WT (grey), R1021C (green), and R1021P (red). Asterisks indicate significant differences between WT and mutants. (D) Model of p110γ showing helices in the C-terminal regulatory motif and the activation loop.
Figure 4 with 2 supplements
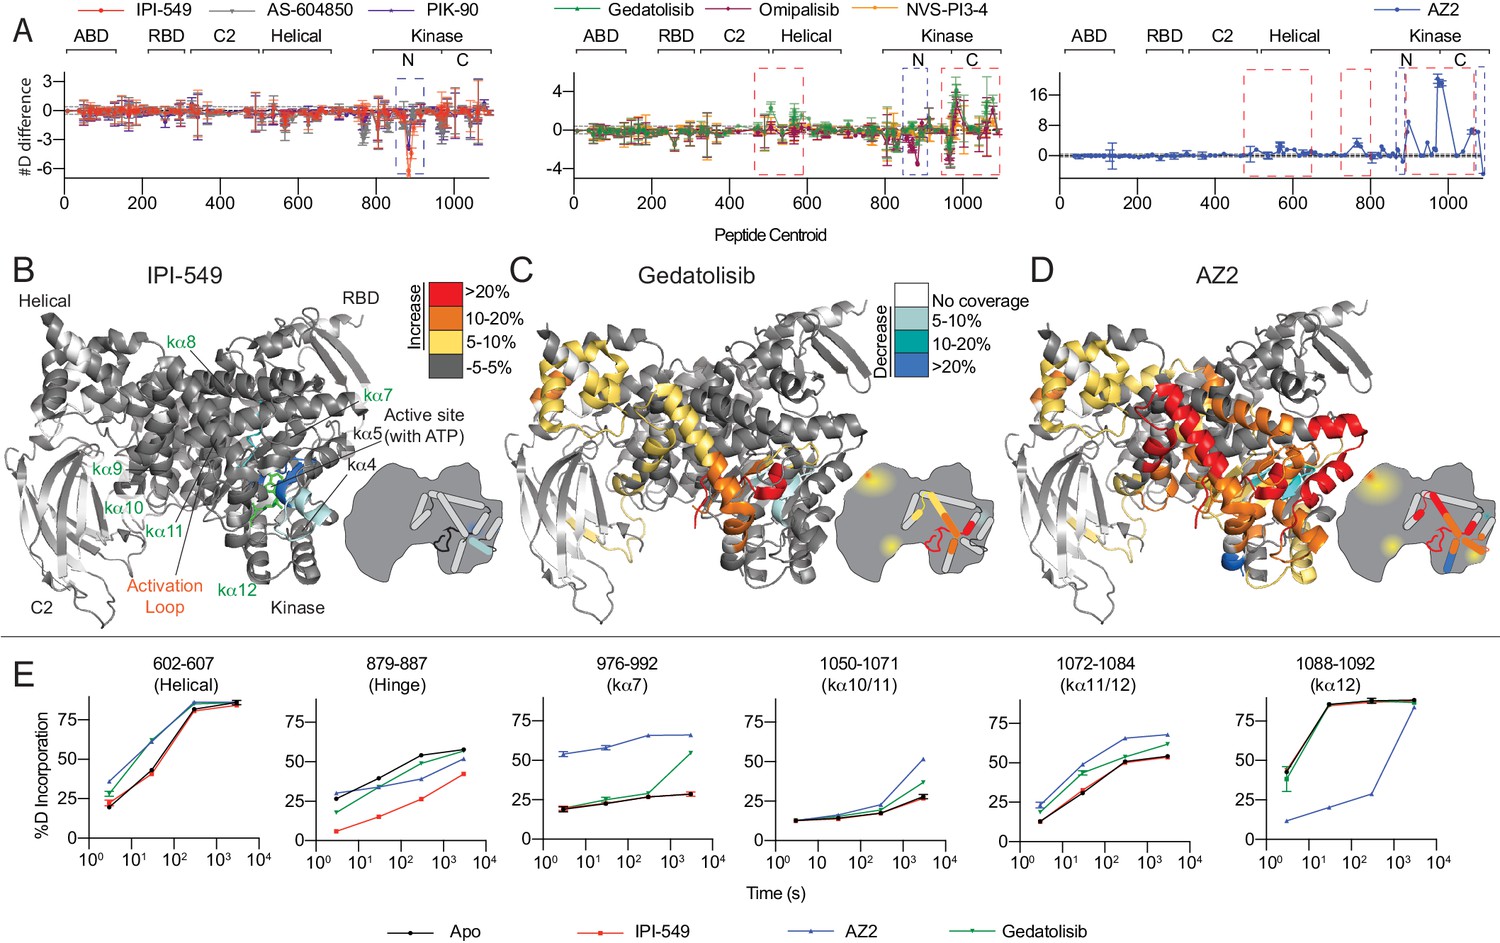
HDX-MS reveals that different classes of PI3K inhibitors lead to unique allosteric conformational changes.
(A) The number of deuteron difference for the seven different inhibitors analysed over the entire deuterium exchange time course for p110γ. Every point represents the central residue of an individual peptide. The domain location is noted above the primary sequence. Error is shown as standard deviation (n = 3). (B–D) Peptides showing significant deuterium exchange differences (>5%,>0.4 kDa and p<0.01 in an unpaired two-tailed t-test) between wild-type and IPI-549 (B), Gedatolisib (C), and AZ2 (D) are coloured on a model of p110γ (PDB: 6AUD). Differences in exchange are mapped according to the legend. A cartoon model in the same format as Figure 1 is shown as a reference. (E) Selected p110γ peptides that showed decreases and increases in exchange are shown. The HDExaminer output data and the full list of all peptides and their deuterium incorporation is shown in the Figure 4—source data 1 file.
-
Figure 4—source data 1
Source data for HDX-MS comparing free p110g with and without inhibitors.
- https://cdn.elifesciences.org/articles/64691/elife-64691-fig4-data1-v2.xlsx
Figure 4—figure supplement 1

Differences in HDX for free p110γ and p110γ/p101 with selected inhibitors.
(A) The number of deuteron difference for free p110γ with IPI-549 for all peptides analysed over the entire deuterium exchange time course for p110γ. (B) The number of deuteron difference for free p110γ with Gedatolisib for all peptides analysed over the entire deuterium exchange time course for p110γ. (C) Peptides showing significant deuterium exchange differences (>5%, >0.4 kDa and p<0.01 in an unpaired two-tailed t-test) between p110γ wild-type and p110γ with IPI-549. Differences are coloured on a model of p110γ (PDB: 6AUD). (D) Peptides showing significant deuterium exchange differences (>5%,>0.4 kDa and p<0.01 in an unpaired two-tailed t-test) between p110γ wild-type and p110γ with Gedatolisib. Differences are coloured on a model of p110γ (PDB: 6AUD). (E) The number of deuteron difference for the p110γ subunit in the p110γ/p101 complex with IPI-549 for all peptides analysed over the entire deuterium exchange time course. (F) The number of deuteron difference for the p110γ subunit in the p110γ/p101 complex with Gedatolisib for all peptides analysed over the entire deuterium exchange time course. (G) Peptides showing significant deuterium exchange differences (>5%, >0.4 kDa and p<0.01 in an unpaired two-tailed t-test) between p110γ/p101 wild-type and p110γ/p101 with IPI-549. Differences are coloured on a model of p110γ (PDB: 6AUD). (H) Peptides showing significant deuterium exchange differences (>5%, >0.4 kDa and p<0.01 in an unpaired two-tailed t-test) between p110γ/p101 wild-type and p110γ/p101 with Gedatolisib. Differences are coloured on a model of p110γ (PDB: 6AUD). The HDExaminer output data and the full list of all peptides and their deuterium incorporation is shown in the Figure 4—figure supplement 1—source data 1 file.
-
Figure 4—figure supplement 1—source data 1
Source data for HDX-MS comparing p110g/p101 with and without IPI-549/Gedatolisib.
- https://cdn.elifesciences.org/articles/64691/elife-64691-fig4-figsupp1-data1-v2.xlsx
Figure 4—figure supplement 2

HDX-MS reveals that different classes of PI3K inhibitors lead to unique allosteric conformational changes.
(A–F) Peptides showing significant deuterium exchange differences (>5%,>0.4 kDa and p<0.01 in an unpaired two-tailed t-test) between wild-type and six different inhibitors are coloured on a model of p110γ (PDB: 6AUD). Differences in exchange are mapped according to the legend. (G–H) The same HDX-MS differences in exchange mapped in panel A+D are shown on the crystal structure of p110γ bound to IPI-549 (G) and Gedatolisib (H). Both IPI-549 and Gedatolisib inhibitors are shown as spheres.
Figure 5 with 2 supplements
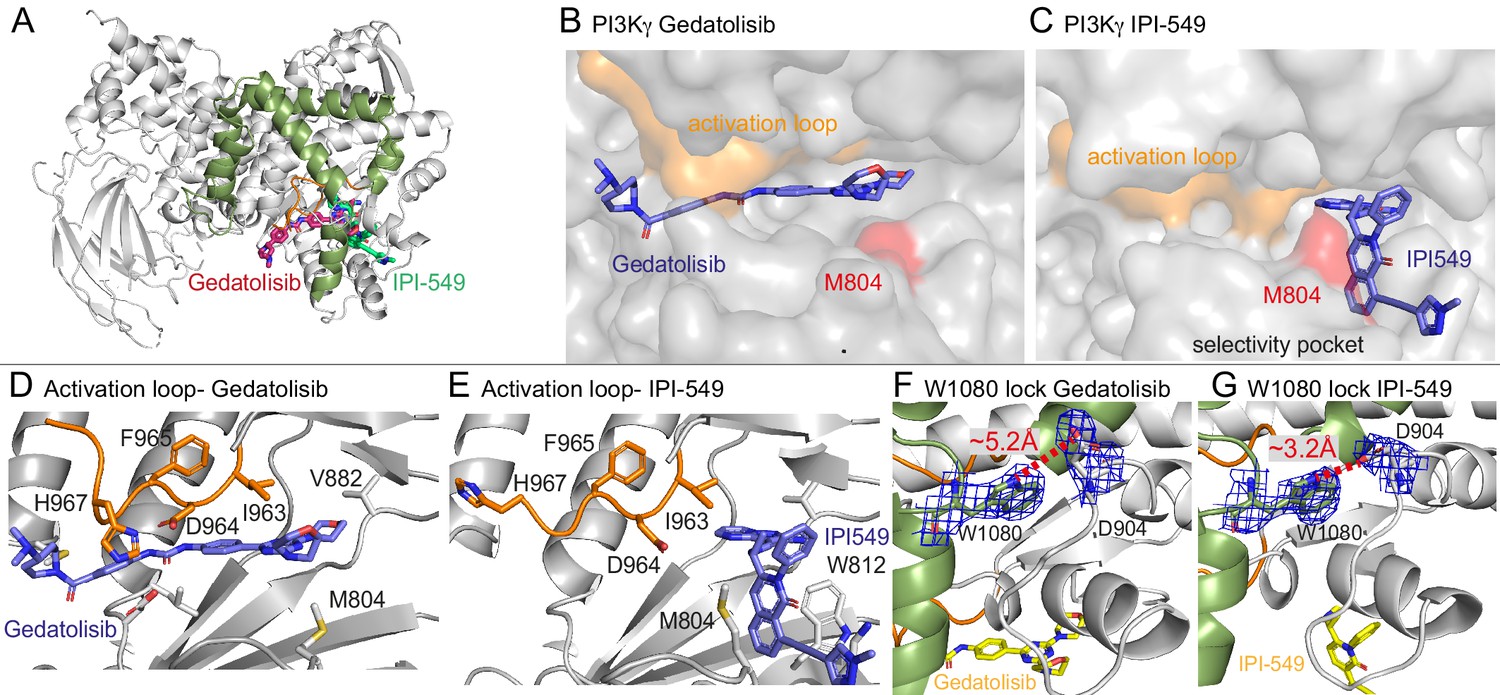
Structures of Gedatolisib and IPI-549 bound to p110γ.
(A) Overall structure of Gedatolisib (red) and IPI-549 (green) bound to p110γ. (B–C) Comparison of Gedatolisib and IPI-549 bound to p110γ with the activation loop and selectivity pocket highlighted. M804 that changes conformation upon selectivity pocket opening is coloured red. (D–E) Comparison of the conformation of the activation loop (orange) of p110γ when Gedatolisib or IPI-549 are bound, with residues in the activation loop labelled, specifically D964 and F965 of the DFG motif labelled. (F–G) The Trp lock composed of W0180 is partially disrupted in the Gedatolisib structure compared to the IPI-549 structure. The interaction between W1080 and D904 is shown, with the distance between the two shown on each structure. The electron density from a feature enhanced map (Afonine et al., 2015) around W1080 and D904 in each structure is contoured at 1.5 sigma.
Figure 5—figure supplement 1

Structures of Gedatolisib, IPI-549, and NVS-PI3-4 bound to p110γ.
(A–C) LigPlot+ (Laskowski and Swindells, 2011) representations of p110γ bound to (A) IPI-549, (B) Gedatolisib, and (C) NVS-PI3-4. Hydrogen bonds are shown in green. All inhibitors form hydrogen bonds (green) with V882 in the hinge. The activation loop is shown as an orange dotted line. (D–F) Comparison of Gedatolisib, IPI-549, and NVS-PI3-4 bound to p110γ with the activation loop and selectivity pockets highlighted. M804 and K883 that change conformation upon selectivity pocket opening are coloured in magenta and cyan, respectively. (G–J) Molecular basis for NVS-PI3-4 for p110γ over p110α/δ. The structure of p110γ bound to NVS-PI3-4 (G) compared to p110γ bound to Gedatolisib (H), revealed a conformational change in K883 leading to opening of pocket accommodating the t-butyl motif. Comparing this to a model of p110δ (PDB: 5DXU) (Heffron et al., 2016) (I) and p110α (PDB: 4JPS) (Furet et al., 2013) (J) with NVS-PI3-4 revealed that this pocket is unlikely to open with L829 in p110δ and R852 in p110α (corresponds to K883 in p110γ) unable to adopt this conformational change due to steric clashes / electrostatic repulsion with R902 in p110δ and K924 in p110α (corresponds to T955 in p110γ). (K–L) Molecular basis for IPI-549 specificity for p110γ over p110δ. The structure of p110γ bound to IPI-549 (H) compared to a model of IPI-549 bound to p110δ (I), based on the structure of p110δ bound to the specificity pocket inhibitor Idelalisib (PDB: 4XE0) (Somoza et al., 2015). K802 and W812 in p110γ are labelled, along with the corresponding residues in p110δ. The kα1-kα2 loop is green, with potential clashes in p110δ with the methylpyrazole of IPI-549 highlighted.
Figure 5—figure supplement 2

Binding of IPI-549, NVS-PI3-4, and Gedatolisib lead to different conformations of the activation loop of p110γ.
(A) The electron density from a feature enhanced map (Afonine et al., 2015) around IPI-549, NVS-PI3-4, and Gedatolisib contoured at one sigma. (B–F) Conformations of the activation loop of p110γ in the presence of annotated inhibitors. Structures of PIK90, and Omipalisib bound to p110γ were from PDB: 2CHX (Knight et al., 2006) and 3l54 (Knight et al., 2010), respectively.
Figure 6
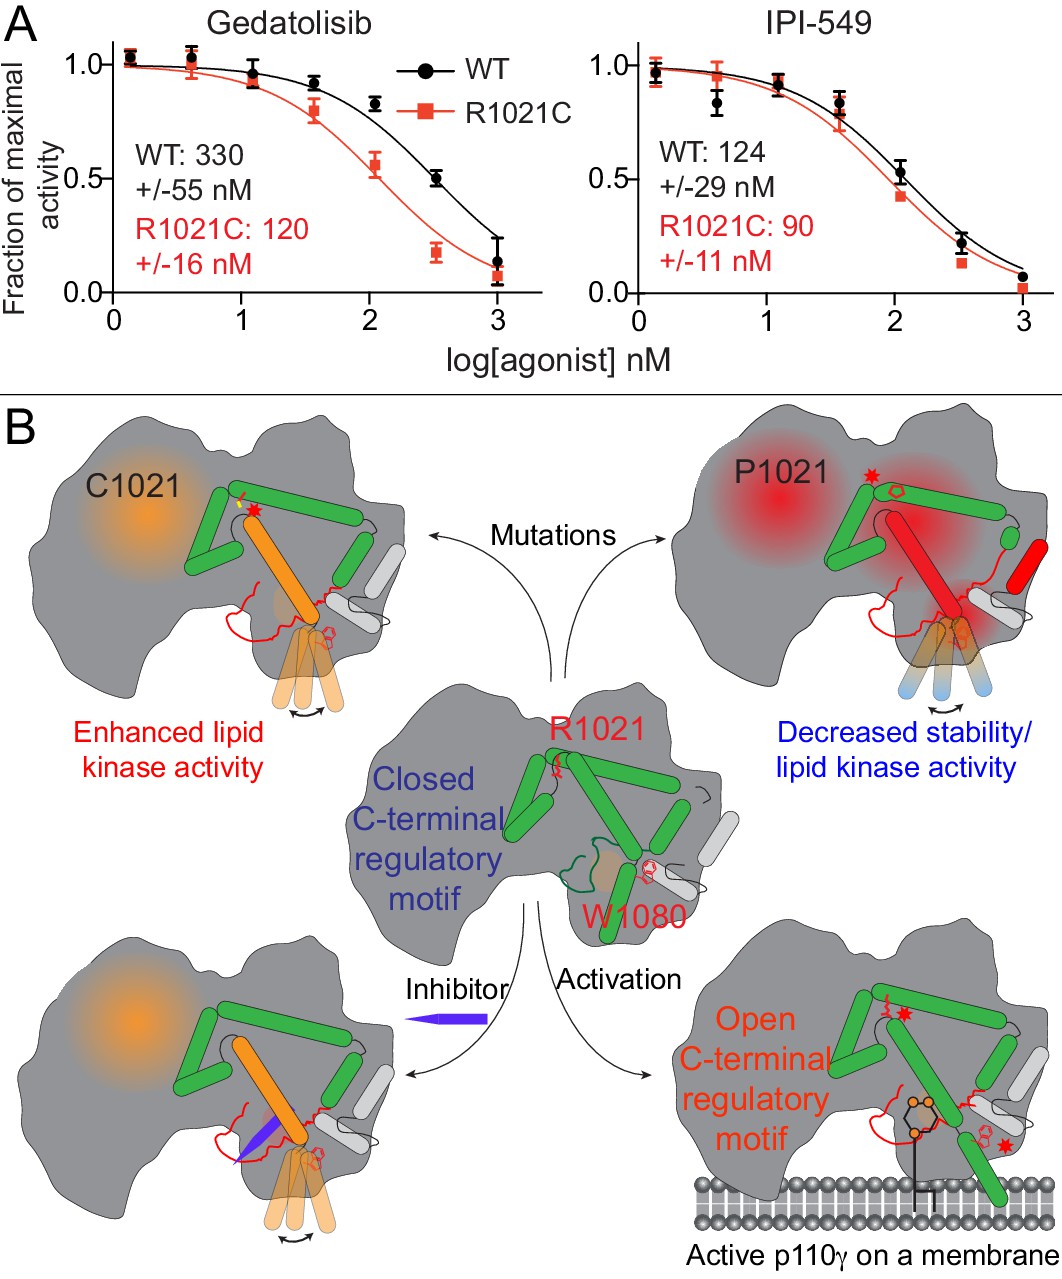
Activating mutations show slight differences in inhibition by allosteric inhibitors and model of PI3Kγ regulation.
(A) IC50 curves for wild-type and R1021C p110γ/p101 complexes. Assays were carried out with 5% C8 PIP2/95% PS vesicles at a final concentration of 1 mg/ml in the presence of 100 μM ATP and 1.5 μM lipidated Gβγ. PI3Kγ concentration was 4 nM for R1021C and 8 nM for WT. Error is shown as standard deviation (n = 3). Refer to the Figure 6—source data 1 file for IC50 curve data. (B) Model of conformational changes that occur upon mutation of the C-terminal motif and binding of activation loop interacting conformation selective inhibitors.
-
Figure 6—source data 1
Source data for IC50 curves comparing inhibition of WT and R1021C p110g/p101.
- https://cdn.elifesciences.org/articles/64691/elife-64691-fig6-data1-v2.xlsx
Author response image 1
Tables
Key resources table
| Reagent type (species) or resource | Designation | Source or reference | Identifiers | Additional information |
|---|---|---|---|---|
| Cell Line (Spodoptera frugiperda) | Sf9 | Expression Systems | 94–001S | Insect cell line for protein expression |
| Recombinant DNA reagent | pACEBac1-p110γ (plasmid) | This paper | MR30 | PIK3CG Sf9 expression vector (available from Burke lab) |
| Recombinant DNA reagent | pACEBac1-p110γ R1021C (plasmid) | This paper | MR53 | PIK3CG Sf9 expression vector (available from Burke lab) |
| Recombinant DNA reagent | pMultiBac-p110γ/p101(plasmid) | This paper | MR22 | PIK3CG/PIK3R5 Sf9 expression vector (available from Burke lab) |
| Recombinant DNA reagent | pMultiBac-p110γ R1021C /p101(plasmid) | This paper | JS39 | PIK3CG/PIK3R5 Sf9 expression vector (available from Burke lab) |
| Recombinant DNA reagent | pbiGBac-p110γ R1021P /p101(plasmid) | This paper | MR92 | PIK3CG/PIK3R5 Sf9 expression vector (available from Burke lab) |
| Recombinant DNA reagent | pFastBac-HRas G12V (plasmid) | This paper | BS9 | HRAS Sf9 expression vector (available from Burke lab) |
| Recombinant DNA reagent | pMultiBac-Gβ1/Gγ2 (plasmid) | Oscar Vadas | pOP737 | GBB1/GG2 Sf9 expression vector (available from Burke lab) |
| Recombinant DNA reagent | pACEBac1-p110γ (144–1102) (plasmid) | This paper | MR7 | PIK3CG Sf9 expression vector (available from Burke lab) |
| Sequence-based reagent | Fwd primer for R1021C mutation | Sigma Aldrich | PCR primers | GGCTTATCTAGCCCTTTGTCATCACACAAACCTACTGATCATCCTGTTC |
| Sequence-based reagent | Rev primer for R1021C mutation | Sigma Aldrich | PCR primers | AAGGGCTAGATAAGCCTTAACACAGATG |
| Sequence-based reagent | Fwd primer for R1021P mutation | Sigma Aldrich | PCR primers | CCTTCCTCATCACACAAACCTACTGATCATCCTGTTCTCC |
| Sequence-based reagent | Rev primer for R1021P mutation | Sigma Aldrich | PCR primers | GATGAGGAAGGGCTAGATAAGCCTTAACACAGATGTCCTG |
| Commercial assay or kit | Transcreener ADP2 FI assay (1,000 Assay, 384 Well) | BellBrook Labs | 3013–1K | Lipid Kinase activity assay kit |
| Chemical compound, drug | GTPγS | Sigma Aldrich | G8634 | GTPγS for HRas loading |
| Chemical compound, drug | D2O | Sigma Aldrich | 151882 | Heavy water for HDX |
| Chemical compound, drug | L-α-Phosphatdiylcholine | Avanti | 840051C | |
| Chemical compound, drug | L-α-Phosphatidylethanolamine | Sigma Aldrich | P6386 | |
| Chemical compound, drug | L-α-Phosphatidylserine | Avanti | 840032C | |
| Chemical compound, drug | L-α-phosphatidylinositol-4,5-bisphosphate | Avanti | 840046X | |
| Chemical compound, drug | diC8 phosphatidylinositol-4,5-bisphosphate | Echelon Biosciences | P-4508 | |
| Chemical compound, drug | Cholesterol | Sigma Aldrich | 47127 U | |
| Chemical compound, drug | Sphingomyelin | Sigma Aldrich | S0756 | |
| Chemical compound, drug | IPI-549 | Chemie Tex | CT-IPI549 | PMID:27660692 |
| Chemical compound, drug | PIK-90 | Axon Medchem | Axon1362 | PMID:19318683 |
| Chemical compound, drug | AS-604850 | Sigma Aldrich | 528108 | PMID:16127437 |
| Chemical compound, drug | Gedatolisib PF-05212384 PKI587 | Bionet | FE-0013 | PMID:20166697 |
| Chemical compound, drug | Omipalisib (GSK2126458, GSK458) | LuBio Science | S2658 | PMID:24900173 |
| Chemical compound, drug | NVS-PI3-4 | Haouyan Chemexpress | HY-133907 | PMID:22863202 |
| Chemical compound, drug | AZ2 | Haouyan Chemexpress | HY-111570 | PMID:30718815 |
| Software, algorithm | HDExaminer | Sierra Analytics | http://massspec.com/hdexaminer | |
| Software, algorithm | GraphPad Prism 7 | GraphPad | https://www.graphpad.com/scientific-software/prism/ | |
| Software, algorithm | PyMOL | Schroedinger | http://pymol.org |
Additional files
-
Supplementary file 1
HDX-MS experimental conditions and data analysis parameters for Figure 2 from the guidelines of the IC-HDX-MS community (Masson et al., 2019).
- https://cdn.elifesciences.org/articles/64691/elife-64691-supp1-v2.docx
-
Supplementary file 2
HDX-MS experimental conditions and data analysis parameters for Figure 4 from the guidelines of the IC-HDX-MS community (Masson et al., 2019).
- https://cdn.elifesciences.org/articles/64691/elife-64691-supp2-v2.docx
-
Supplementary file 3
HDX-MS experimental conditions and data analysis parameters for Figure 2—figure supplement 1 from the guidelines of the IC-HDX-MS community (Masson et al., 2019).
- https://cdn.elifesciences.org/articles/64691/elife-64691-supp3-v2.docx
-
Supplementary file 4
HDX-MS experimental conditions and data analysis parameters for Figure 4—figure supplement 1 from the guidelines of the IC-HDX-MS community (Masson et al., 2019).
- https://cdn.elifesciences.org/articles/64691/elife-64691-supp4-v2.docx
-
Supplementary file 5
List of all PI3K inhibitors analysed in this manuscript.
IC50s for class IA and IB are listed from the reference attached. N.D. is not determined.
- https://cdn.elifesciences.org/articles/64691/elife-64691-supp5-v2.docx
-
Supplementary file 6
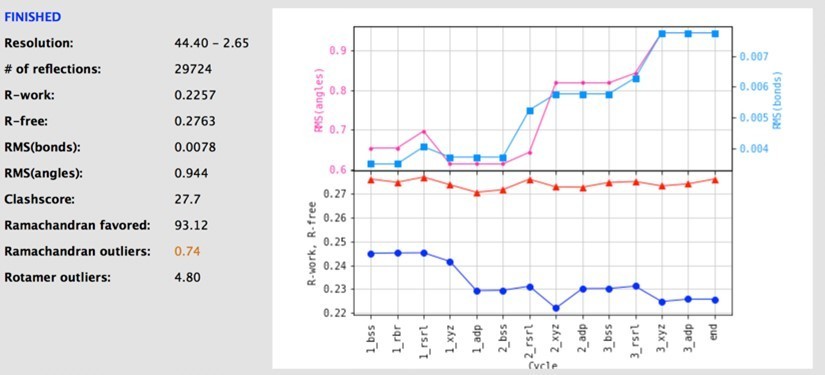
X-ray crystallography collection and refinement statistics.
- https://cdn.elifesciences.org/articles/64691/elife-64691-supp6-v2.docx
-
Transparent reporting form
- https://cdn.elifesciences.org/articles/64691/elife-64691-transrepform-v2.docx
Download links
A two-part list of links to download the article, or parts of the article, in various formats.
Downloads (link to download the article as PDF)
Open citations (links to open the citations from this article in various online reference manager services)
Cite this article (links to download the citations from this article in formats compatible with various reference manager tools)
Disease-related mutations in PI3Kγ disrupt regulatory C-terminal dynamics and reveal a path to selective inhibitors
eLife 10:e64691.
https://doi.org/10.7554/eLife.64691


