Rapid recycling of glutamate transporters on the astroglial surface
- UCL Queen Square Institute of Neurology, University College London, United Kingdom
- BRAINCITY, Laboratory of Neurobiology, Nencki Institute of Experimental Biology PAS, Poland
- School of Biotechnology and National Institute for Cellular Biotechnology (NICB), Dublin City University, Ireland
Figures
Figure 1 with 3 supplements
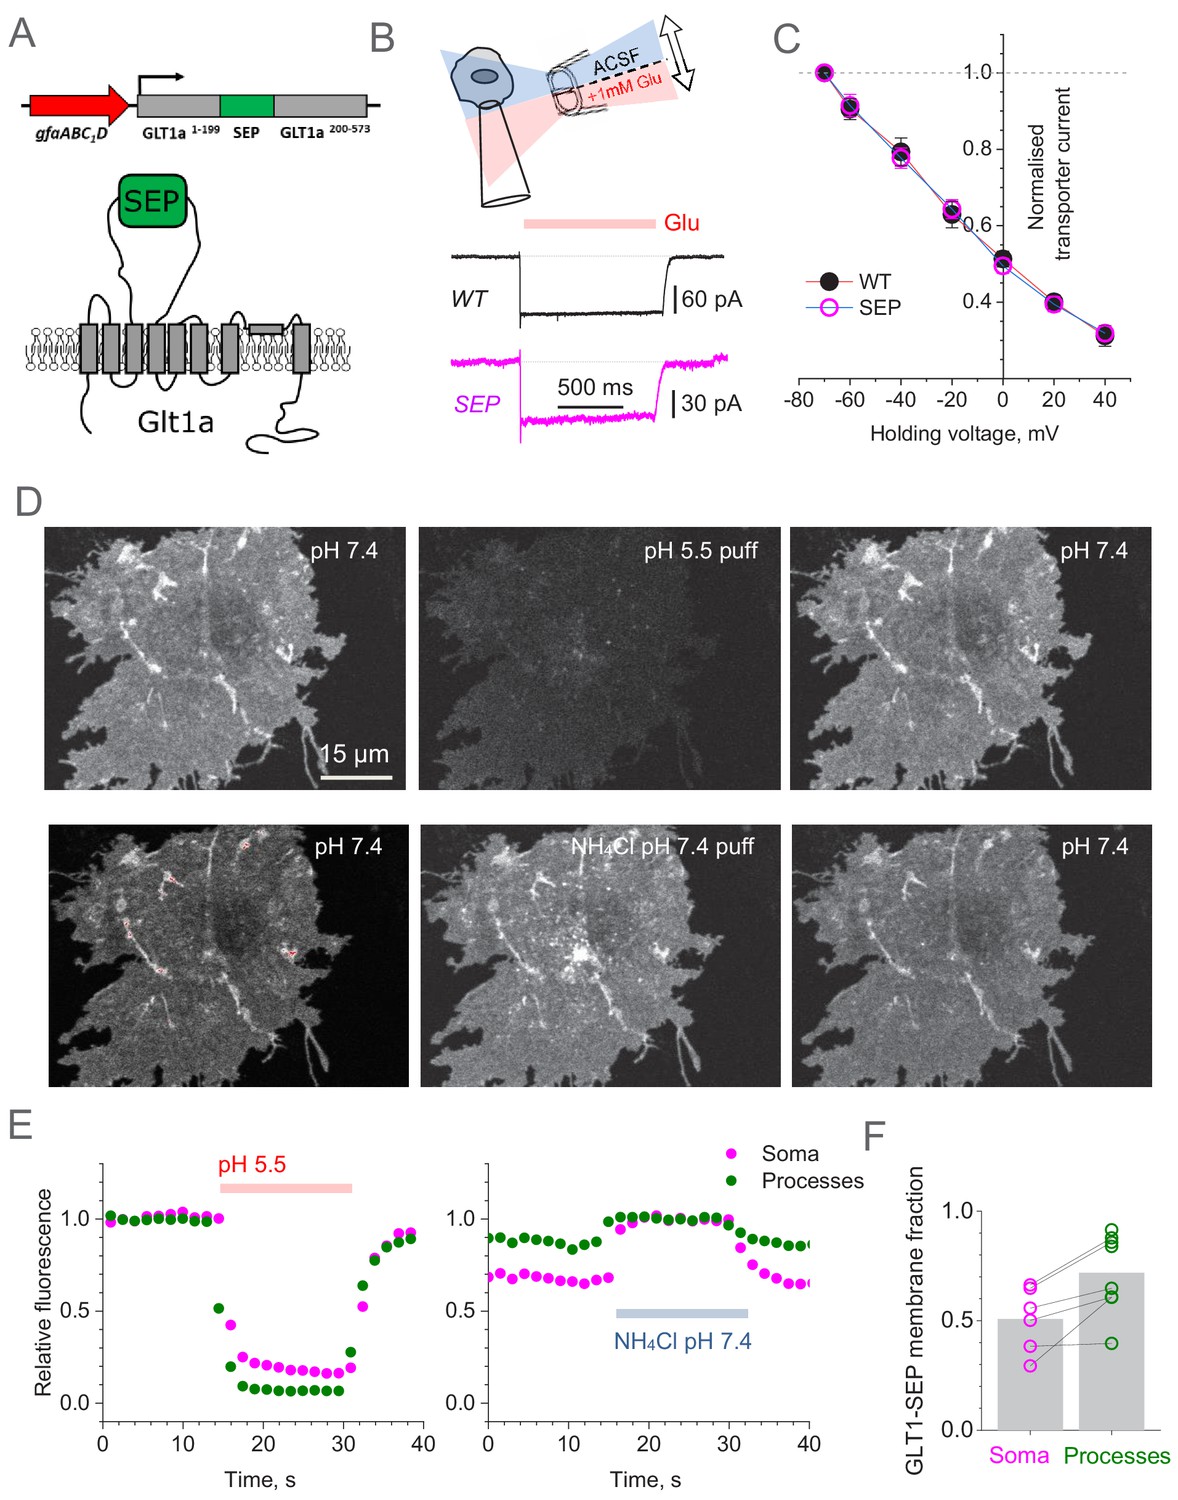
Super-Ecliptic pHluorin-tagged GLT1 (GLT1-SEP) enables monitoring of cell membrane and cytosolic fractions of glial glutamate transporters.
(A) Diagram illustrating molecular composition of GLT1-SEP. (B) Functional probing of GLT1-SEP expressed in HEK cells shows a prominent current response to glutamate application, similar to that wild-type GLT1 (WT); top diagram, theta-glass pressure pipette application; traces, one-cell examples (Vh = −70 mV). (C) Summary of tests shown in (A): normalised current-voltage dependencies of GLT1 (mean ± SEM; n = 8) and GLT1-SEP (n = 4) are indistinguishable; current values normalised at Vh = −70 mV (absolute values 194 ± 29 pA and 81 ± 10 pA for GLT1 and GLT1-SEP, respectively). (D) Transient acidification (~10 s pH 5.5 puff, upper row) supresses cell-surface GLT1-SEP fluorescence whereas transient membrane NH4+ permeation (~10 s NH4Cl puff, lower row) reveals the cytosolic fraction of GLT1-SEP; one-cell example. (E) Time course of fluorescence intensity averaged over the cell soma (magenta) or all processes (green) in the test shown in (C). (F) Average cell-surface fraction R of GLT1-SEP (summary of experiments shown in D and E); dots, individual cells (connecting lines indicate the same cell); grey bars, average values (R mean ± SEM: 0.51 ± 0.15, n = 6 for somata; 0.72 ± 0.18, n = 8 for processes; soma boundaries in two cells were poorly defined).
-
Figure 1—source data 1
Original data readout for Figure 1D–F, Figure 1—figure supplement 2B,D and Figure 1—figure supplement 3B,C.
- https://cdn.elifesciences.org/articles/64714/elife-64714-fig1-data1-v2.xlsx
Figure 1—figure supplement 1
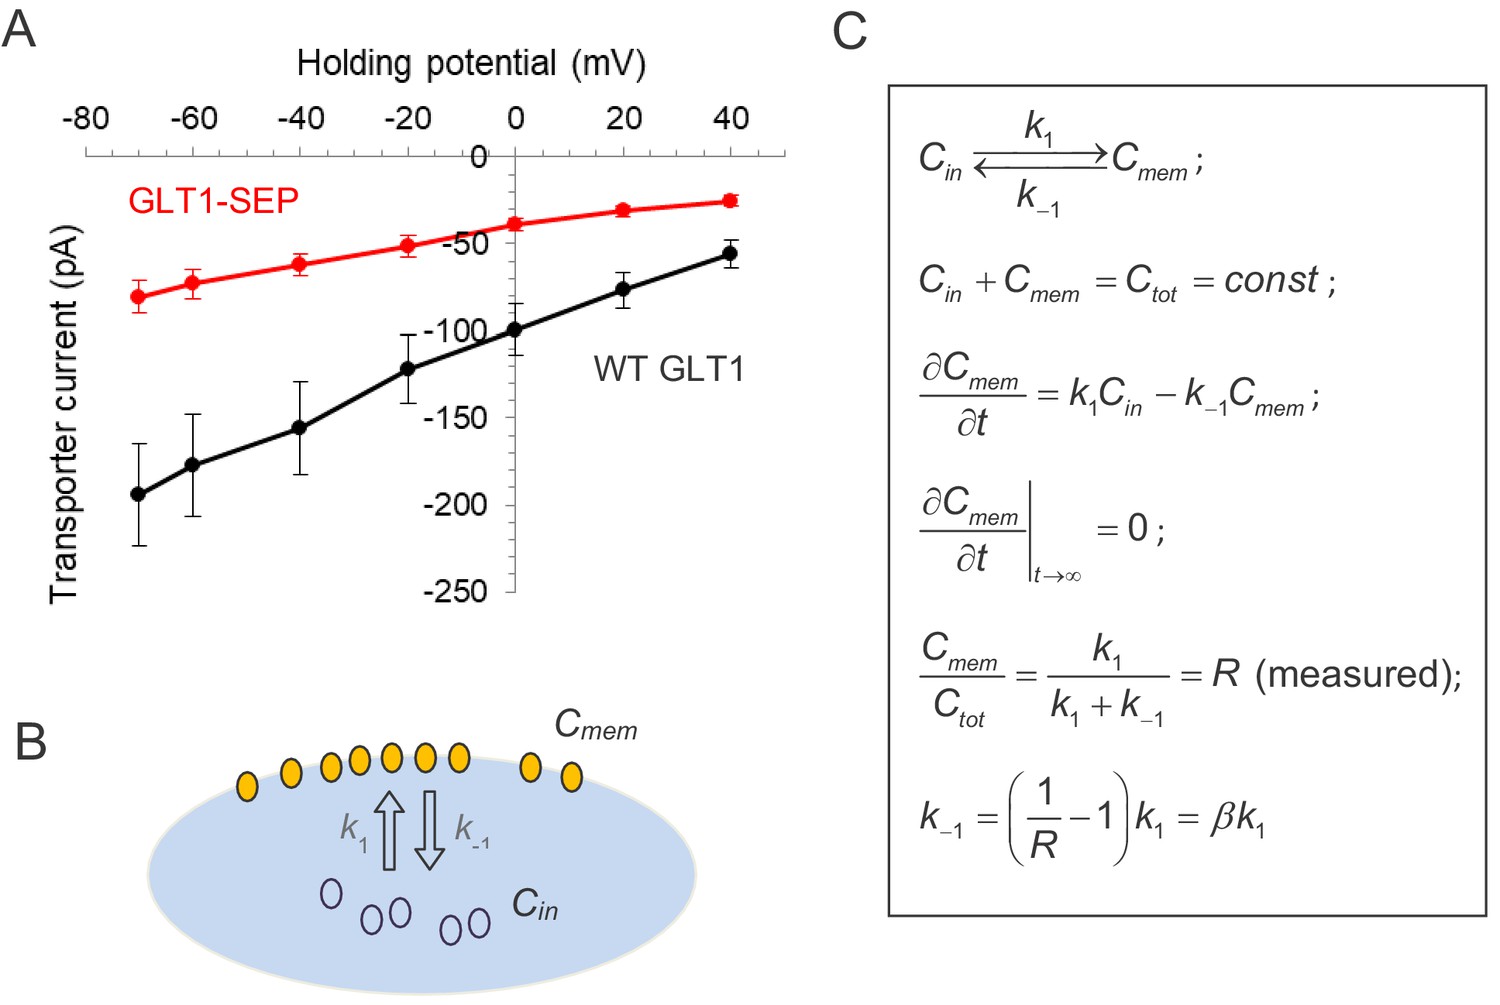
Testing glutamate transport function and the membrane/cytosol fraction ratio for GLT1-SEP.
(A) Summary of transporter current recordings in wild-type GLT1 (black) and GLT1-SEP (red) expressing HEK cells, as indicated; absolute current values are shown. (B) Diagram illustrating the kinetics of exchange between the plasma membrane fraction (concentration Cm) and the cytosol fraction (concentration Cin) of GLT1-SEP; k1 and k-1, kinetic constants, as shown. (C) Right, kinetic equations describing membrane-intracellular compartment exchange for GLT1-SEP; Ctot, total concentration of GLT1-SEP; R, the (equilibrated) membrane fraction of GLT1-SEP, measured experimentally (Figure 1).
Figure 1—figure supplement 2
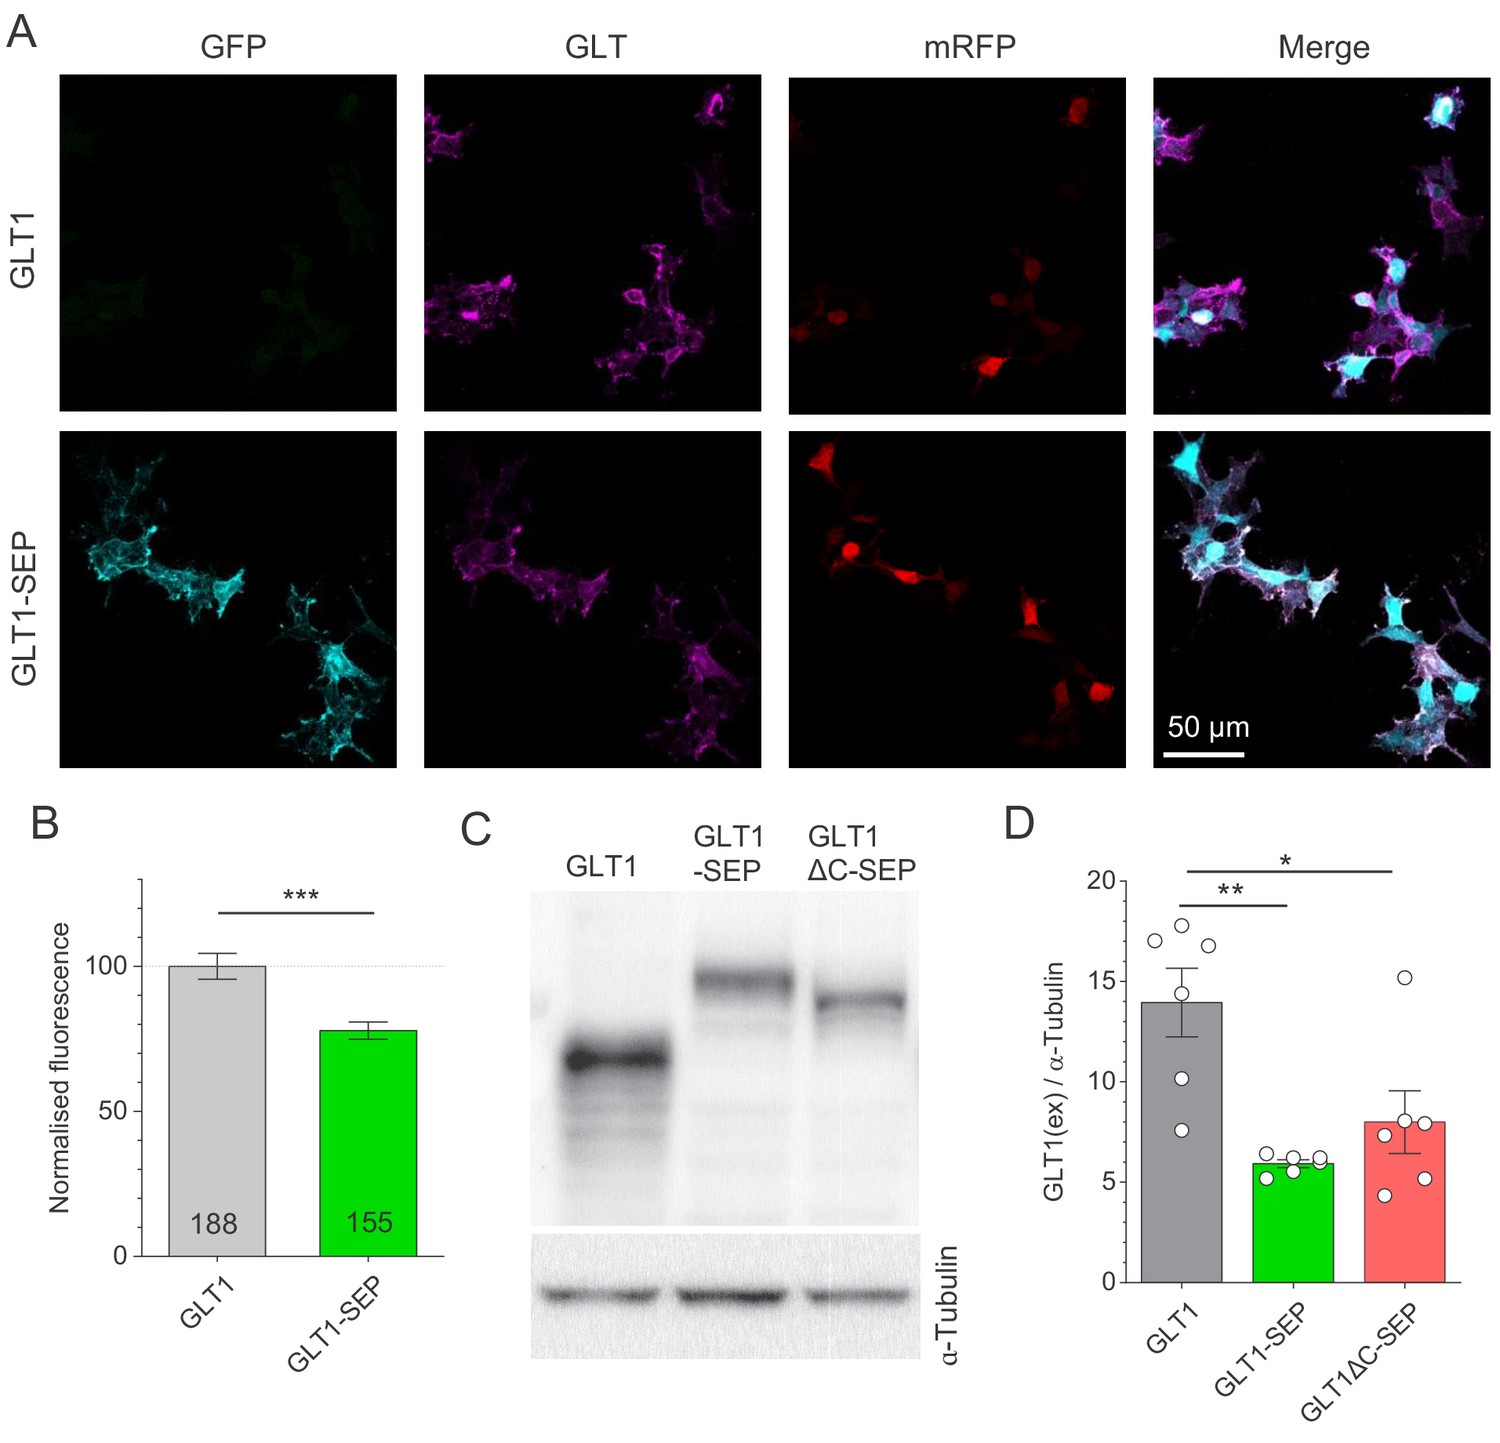
Expression of GLT1, GLT1-SEP, and GLT1ΔC-SEP in HEK cells.
(A) Examples of immunostaining of GLT1 in HEK 293 T cells co-transfected with plasmids coding GLT1 or GLT1-SEP under CMV promoter together with mRFP1 under β-actin promoter (control reference) in a 2:1 ratio. Total GLT1 was immunolabelled using an antibody which recognises the C-terminus of GLT1 or GLT1-SEP. (B) Expression levels of GLT1 and GLT1-SEP (mean ± SEM, data normalised against average GLT1 level in HEK293T cells expressing GLT1a as 100%); numbers of cells shown; ***p<0.001 (two-sample t-test; three cultures per condition). (C) Western blot of HEK 293 T cells co-transfected with plasmids coding GLT1, GLT1-SEP, or GLT1ΔC-SEP under CMV promoter together with mRFP1 under β-actin promoter in a 2:1 ratio. Cell lysates were analysed using western blotting with anti-GLT1 antibody directed against the extracellular loop, thus recognising GLT1 and GLT1-SEP and GLT1ΔC-SEP. Total protein loading was checked using anti-ɑ-tubulin antibody. (D) Summary of western blot (mean ± SEM): GLT1 signal shown normalised to the ɑ-tubulin signal; open circles, individual cultures.
Figure 1—figure supplement 3
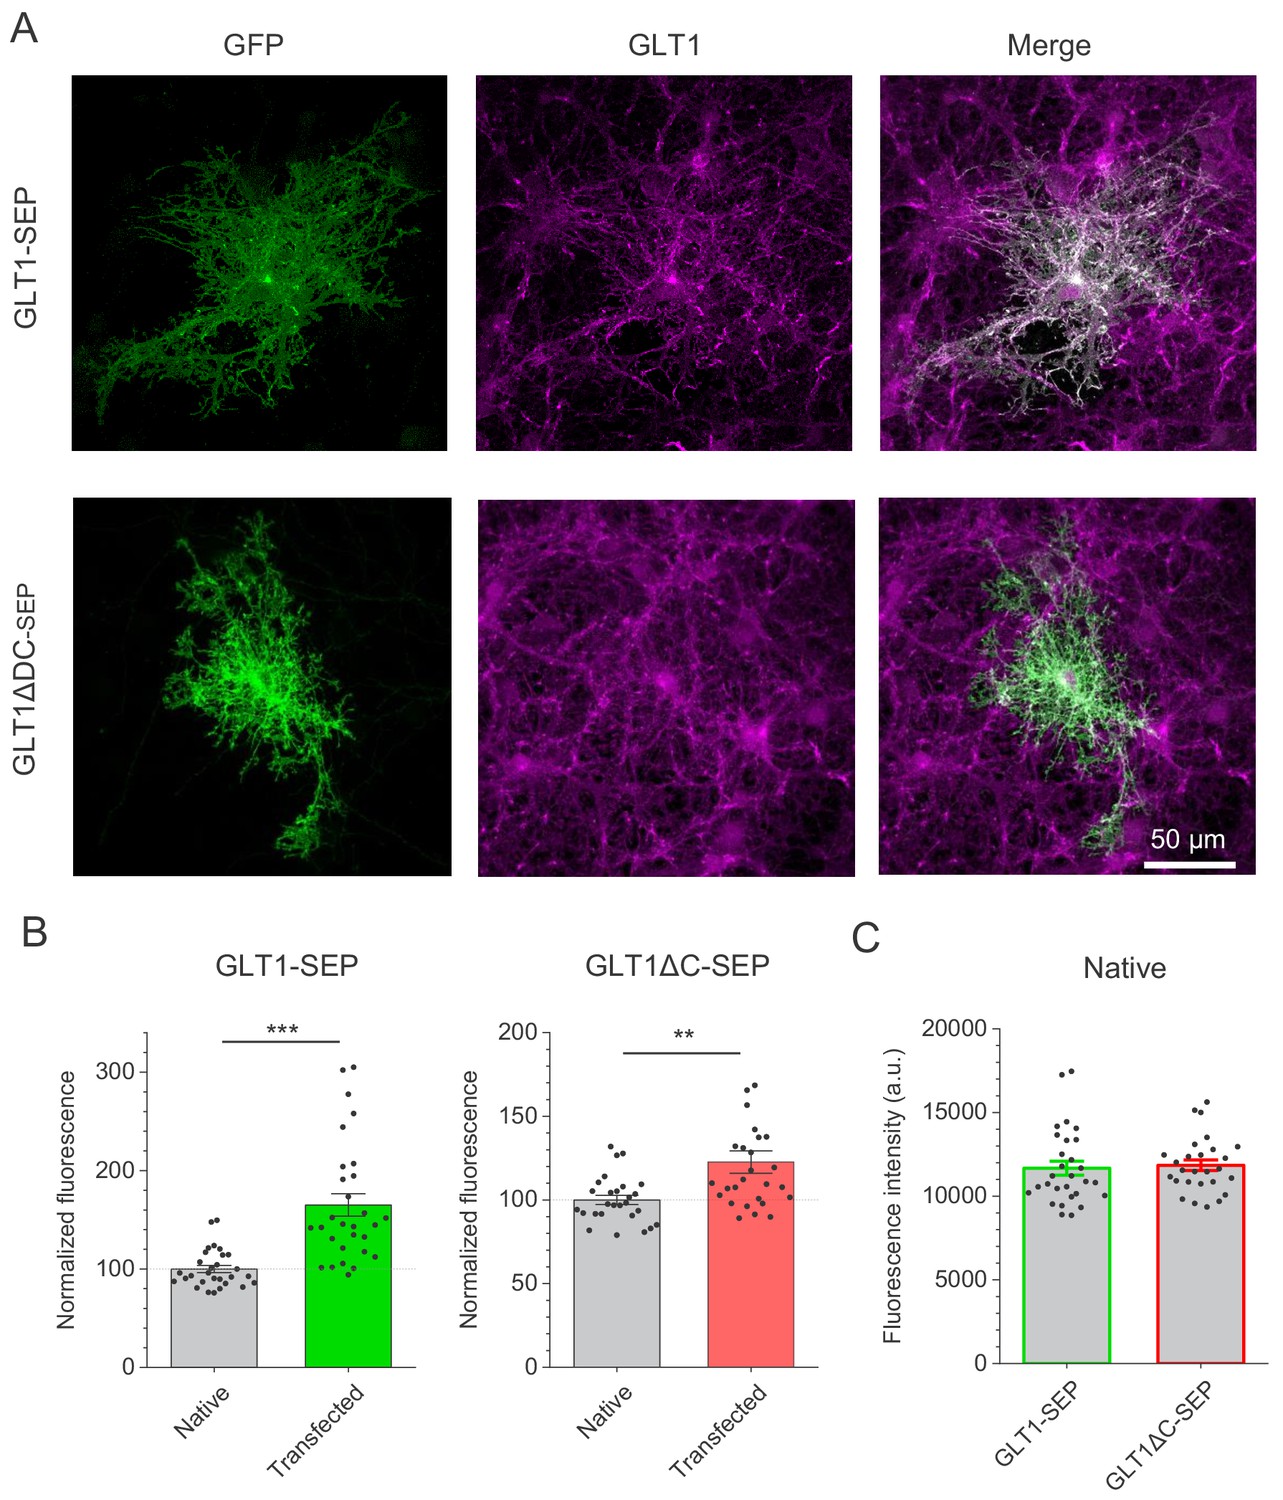
Relative expression GLT1, GLT1-SEP, and GLT1ΔC-SEP astrocytes.
(A) Examples of immunostaining for GFP in astroglia transfected with GLT1-SEP or GLT1ΔC-SEP, and total GLT1 (using an antibody which recognises C-terminus of both endogenous GLT1 and transfected GLT1-SEP, but not GLT1ΔC-SEP), as indicated. (B) Quantitative summary of immunostaining (mean ± SEM, data normalised against the average GLT1 staining of non-transfected cells as 100%; dots, individual astrocytes), for GLT1-SEP and GLT1ΔC-SEP transfected cells (three separate cultures), as indicated; ***p<0.005; **p<0.01 (two-sample t-test). (C) Control measurement of fluorescence intensity (mean ± SEM) indicating a stable expression level of endogenous GLT1 in non-transfected cells for cultures transfected either with GLT1-SEP or with GLT1ΔC-SEP (three cultures each; dots, individual astrocytes).
Figure 2 with 1 supplement
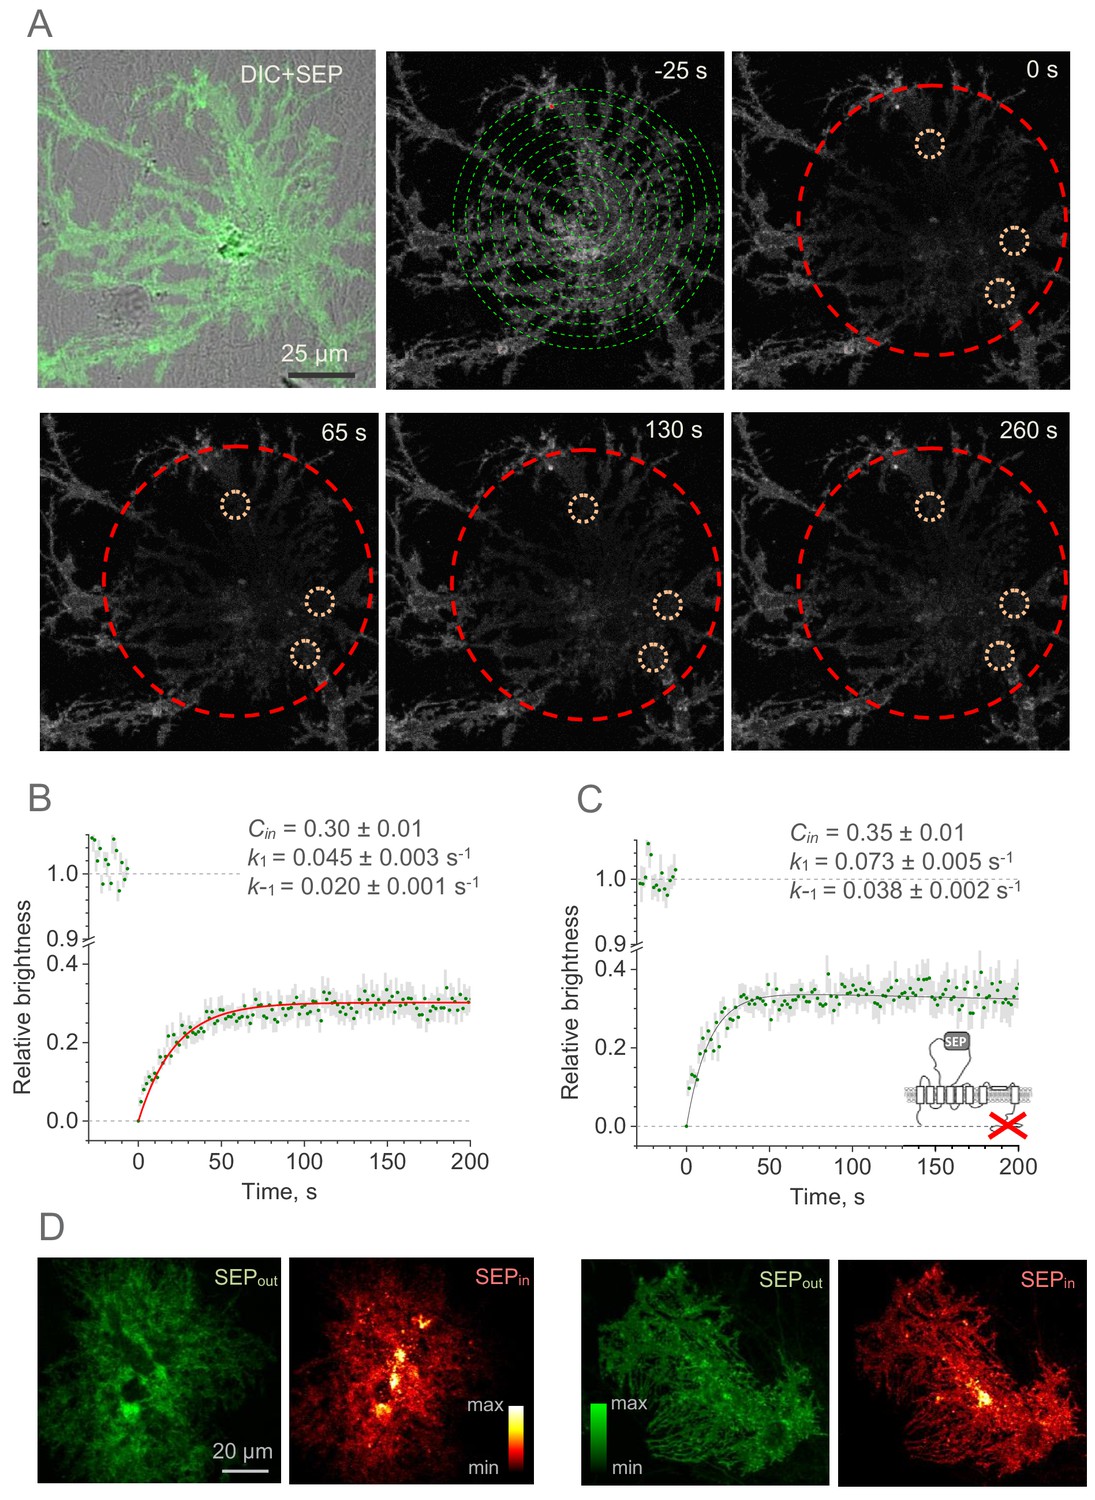
Whole-cell FRAP reveals the kinetics of the GLT1-SEP membrane surface turnover.
(A) One-cell example illustrating FRAP protocol; upper left, DIC + SEP channel image; serial images, GLT1-SEP channel at different time points (indicated) after a photobleaching pulse (t = 0 s); dashed green spiral illustrates application of the tornado laser linescan mode; dashed red circle, laser-photobleached region; dotted orange circles, example of ROIs. (B) Time course (mean ± SEM, n = 27 ROIs in N = 9 cells) of the GLT1-SEP fluorescence intensity within the photobleached region (as in A), normalised against the baseline value. Red line, best-fit GLT1-SEP FRAP kinetics incorporating cytosolic protein fraction (Cin), membrane-surface turnover constants (k1 and k-1) and the residual photobleaching constant (kb; not shown); see text and Figure 2—figure supplement 1 for further detail. (C) Experiment as in (B), but with the with the C-terminus deleted mutant GLT1ΔC-SEP expressed in astroglia (n = 25 ROIs in N = 8 cells); other notations as in (B). (D) Two characteristic examples illustrating cellular distribution of surface-bound fraction of GLT1-SEP (green, SEPout) and its intracellular fraction (red, SEPin) in live individual astroglia.
-
Figure 2—source data 1
Original data readout for Figure 2B,C.
- https://cdn.elifesciences.org/articles/64714/elife-64714-fig2-data1-v2.xlsx
Figure 2—figure supplement 1

Establishing the kinetics of whole-cell FRAP for GLT1-SEP molecules in astrocytes.
FRAP reactions diagram reflects exchange (turnover) between membrane cytosol fractions of non-bleached GLT1-SEP molecules, with and standing for their relative concentrations, respectively, and residual bleaching of the membrane fraction adding to the bleached membrane fraction . k1, k-1, and kb are the kinetic constants, as indicated. Kinetics equations describe the FRAP reactions in partial derivatives for and . The corresponding solution includes two unknown constants, C0 and C1, which are determined using Initial and boundary conditions, leading to the expression of Fluorescence kinetics. Other notations: where R is the total (bleached and non-bleached) membrane fraction of GLT1-SEP, as in Figure 1—figure supplement 1.
Figure 3 with 1 supplement
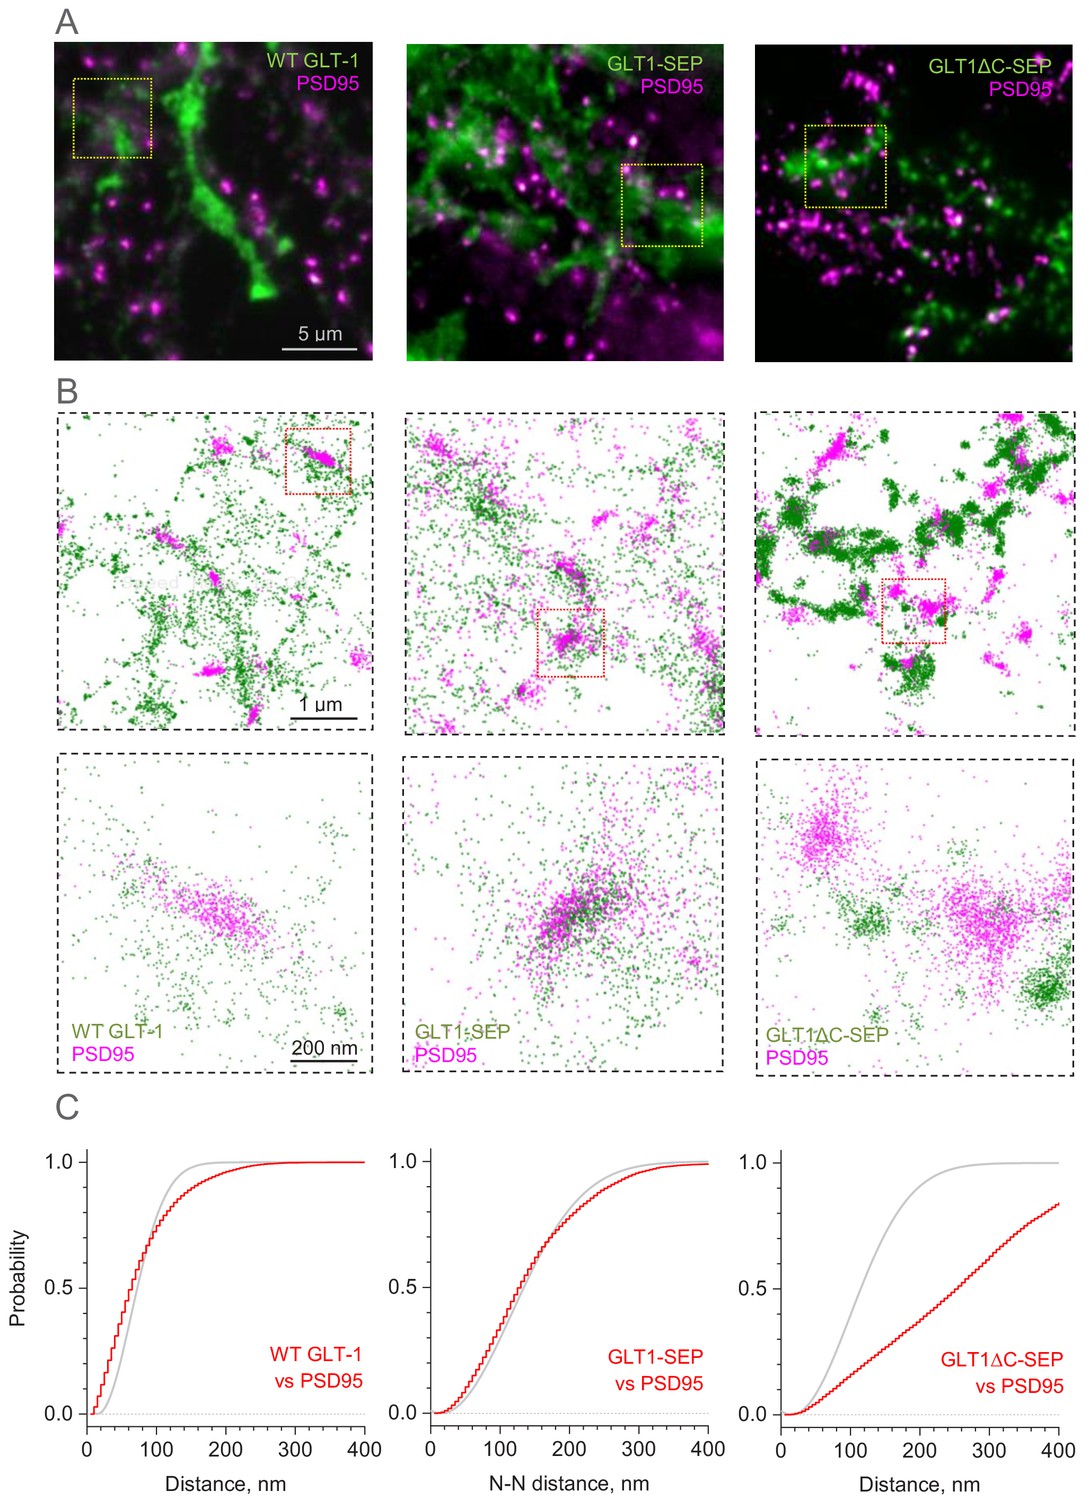
Distribution of GLT-1 species in relation to postsynaptic densities in the astroglial membrane: A super-resolution SMLM analysis.
(A) Wide-field fluorescent images (examples) illustrating antibody labelled GLT1 species (green channel) and postsynaptic density protein PSD95 (magenta), as indicated, in mixed astroglia-neuron cultures. See Figure 3—figure supplement 1A for macroscopic views. (B) SMLM nano-localisation maps (examples) depicting individual labelled GLT1 species (green), as indicated, and PSD95 (magenta) molecules. Top row, ROIs shown as the corresponding yellow squares in (A); bottom row, ROIs shown as red squares in the top row. (C) Red line (5 nm bins): distribution D(r) of nearest-neighbour (N–N) distances r between labelled GLT1 species and clusters of PSD95 molecules (PSD95 clusters represent >50 particles <100 nm apart). Grey line: theoretical distribution that corresponds to the Poisson point process (evenly random scatter) with the same surface density of PSD95 clusters λ as sampled experimentally. Experimental λ values were: 67 µm−2 (WT GLT-1), 15.5 µm−2 (GLT1-SEP), and 22.2 µm−2 (GLT1Δ-SEP); see Materials and methods for details.
-
Figure 3—source data 1
Original data readout for Figure 3C and Figure 3—figure supplement 1B.
- https://cdn.elifesciences.org/articles/64714/elife-64714-fig3-data1-v2.xlsx
Figure 3—figure supplement 1
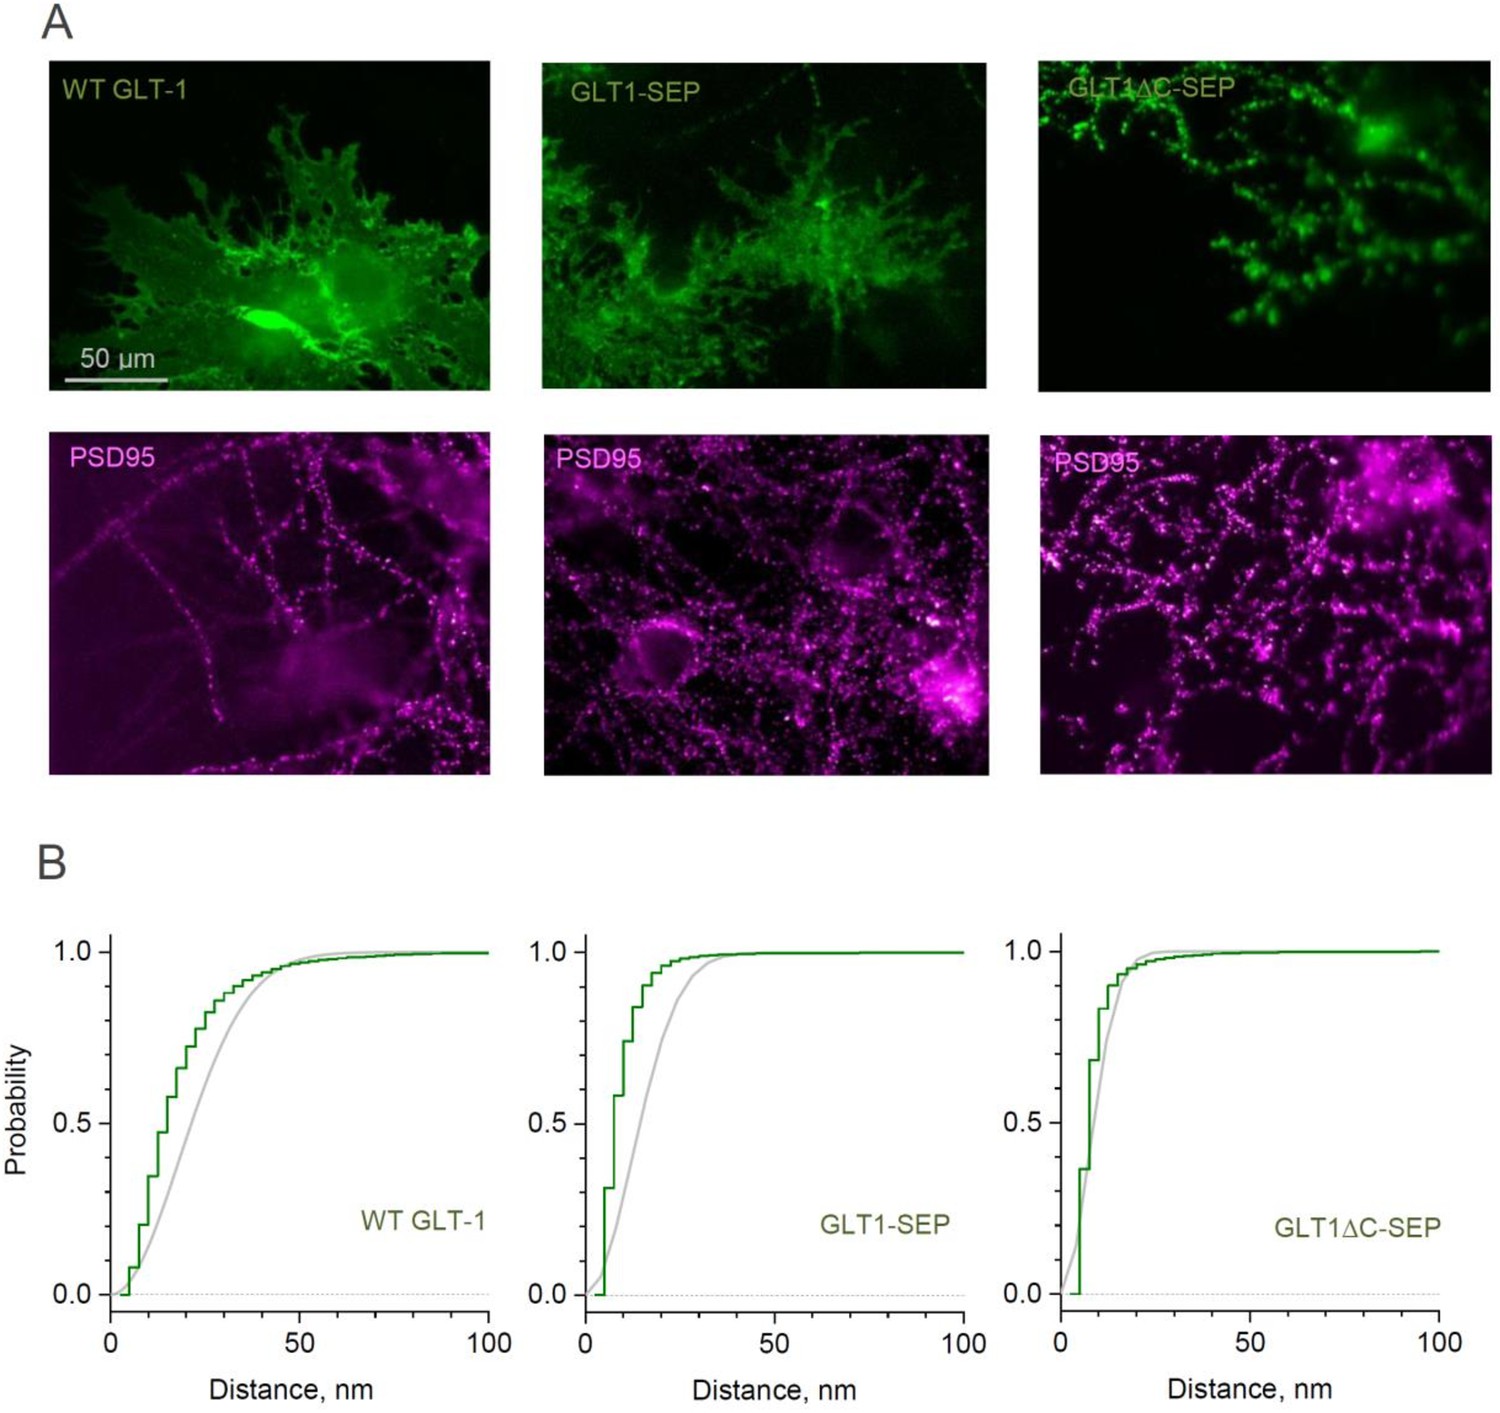
Distribution of GLT-1 species in the astroglial membrane: macroscopic wide-field view and super-resolution SMLM analysis.
(A) Wide-field fluorescent images (examples) displaying antibody labelled GLT1 species (green channel) and postsynaptic density protein PSD95 (magenta), as indicated, in mixed astroglia-neuron cultures. See Figure 3 for higher magnification. (B) SMLM analyses (see Figure 3 for single-molecule maps): Distribution D(r) of nearest-neighbour (N–N) distances r among labelled GLT1 species (green line, 5 nm bins), and the theoretical distribution for the Poisson point process (evenly random scatter, ) with the same surface density λ (grey line); experimentally sampled λ values were 324 µm−2 (WT GLT-1), 67 µm−2 (GLT1-SEP), and 2938 µm−2 (GLT1ΔC-SEP); a shift to the left for the green versus grey line indicates significant clustering. See Materials and methods for details.
Figure 4 with 1 supplement
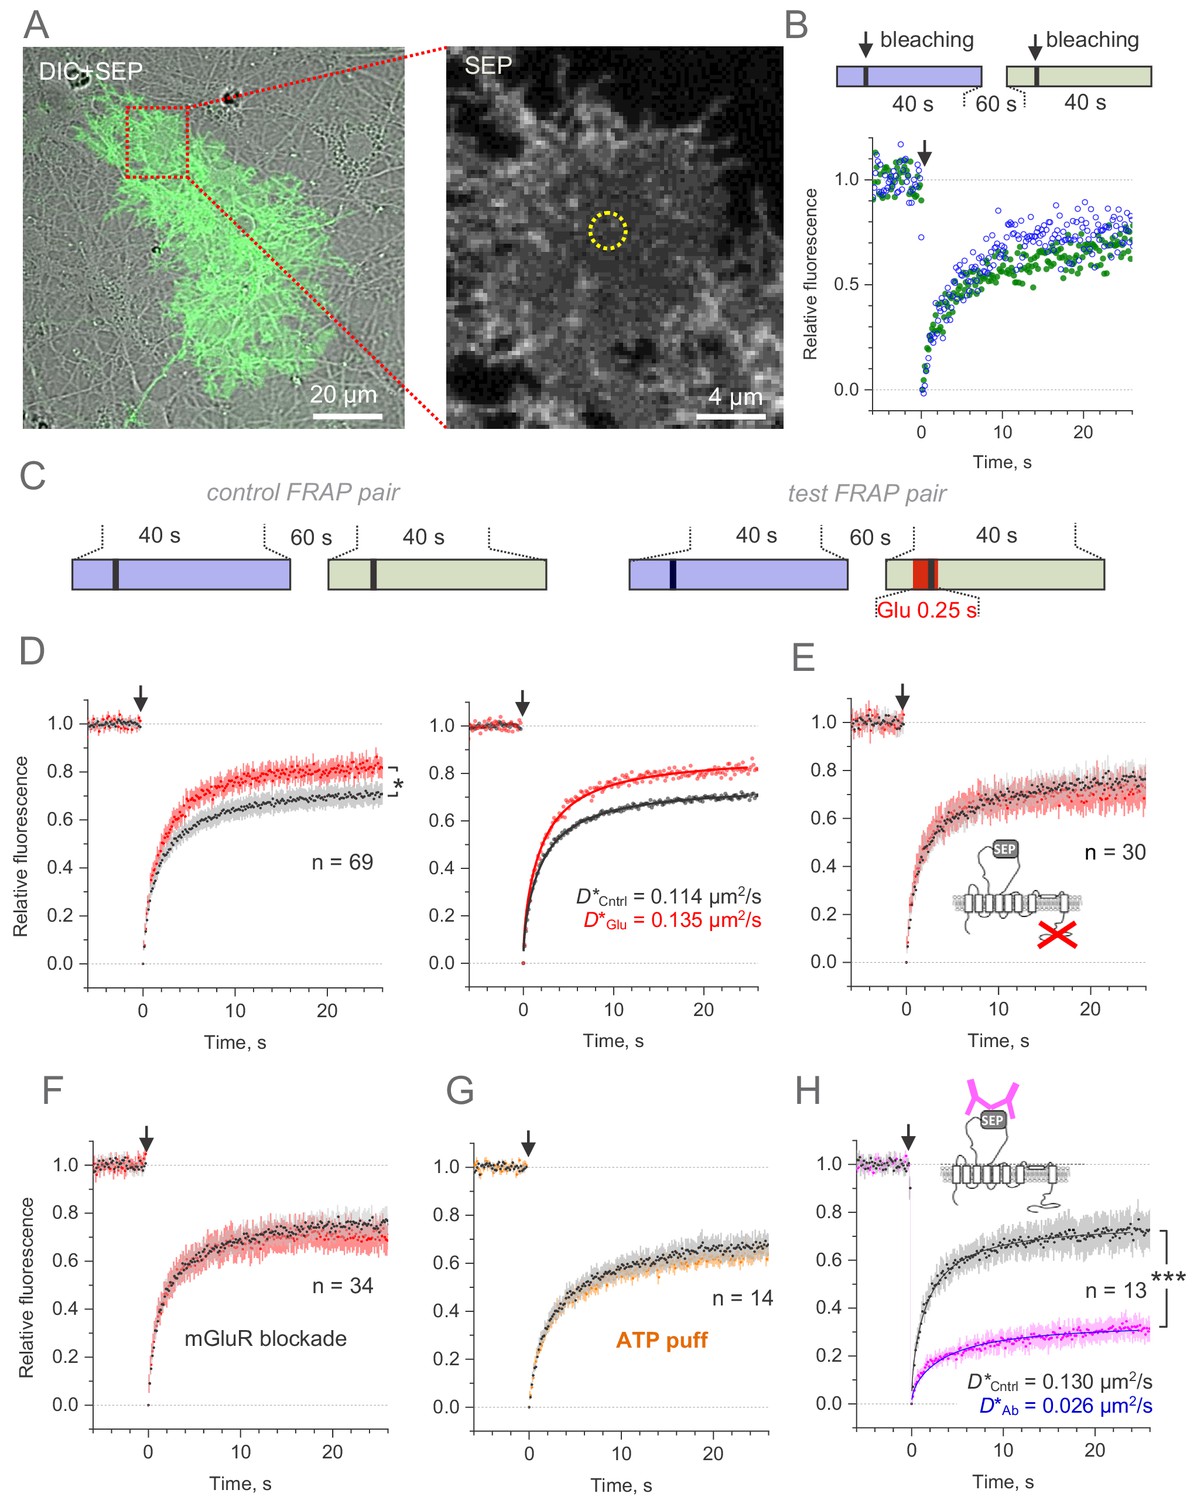
Microscopic-ROI FRAP probes lateral membrane mobility of GLT1-SEP in cultured astroglia.
(A) One-cell example as seen in GLT1-SEP + DIC channel (left), with a selected area (dotted rectangle) illustrating a circular, 2.06 µm wide FRAP spot (dotted circle, right). (B) Diagram, the paired-sample FRAP protocol, in which two trials are carried out in succession, to account for any non-specific, time-dependent drift in FRAP kinetics. Plots, one-cell example of the paired-sample FRAP test, with the first and second trial data are shown in blue and green, respectively; arrow, bleaching pulse (λx2p = 690 nm, 10–15 mW under the objective, duration 46 ms); fluorescence ROI, photobleaching spot as in (A). (C) Diagram illustrating the paired-sample FRAP protocol, which includes both control and glutamate application cycles; FRAP kinetics under glutamate application could be corrected for non-specific drift by using the control cycle data. (D) Left, average time course of the GLT1-SEP FRAP (dots and shade: mean ± 95% confidence interval, here and thereafter) in baseline conditions (black) and upon glutamate application (250 ms puff 200 ms before the photobleaching pulse lured); asterisk, p < 0.05 (n = 69 FRAP spots in N = 13 cells). Right, FRAP time course (mean values) fitted with the Soumpasis FRAP equation for (see main text) for control and glutamate tests. Best-fit GLT1-SEP diffusion coefficient D is shown for control (Cntrl) and glutamate puff (Glu) trials, as indicated. (E) Average FRAP time course in control and glutamate-puff tests carried out with the C-terminus deleted mutant CLT1ΔC-SEP, as indicated (n = 30 FRAP spots in N = 7 cells); other notation as in (D). (F) Average FRAP time course in control and glutamate-puff tests in the presence of AMPA and metabotropic glutamate receptor (mGluR) blockers (n = 34 FRAP spots in N = 7 cells): MPEP (1 mM), LY341495 (30 nM), YM298198 (0.3 µM); NBQX (10 µM) was added to suppress network hyper-excitability under LY341495; other notation as in (D). (G) Average FRAP time course in control conditions and after the ATP pressure puff (100 µM, 250 ms duration 200 ms before bleaching start, no glutamate), as indicated (n = 14 FRAP spots in N = 4 cells); other notation as in (D). (H) Control test: Average FRAP time course in control conditions and under surface cross-linkage by anti-GFP antibody, as indicated (n = 13 FRAP spots in N = 2 cells); other notation as in (D).
-
Figure 4—source data 1
Original data readout for Figure 4B,D–H.
- https://cdn.elifesciences.org/articles/64714/elife-64714-fig4-data1-v2.xlsx
Figure 4—figure supplement 1
Microscopic-ROI FRAP probes lateral membrane mobility of GLT1-SEP in cultured astroglia.
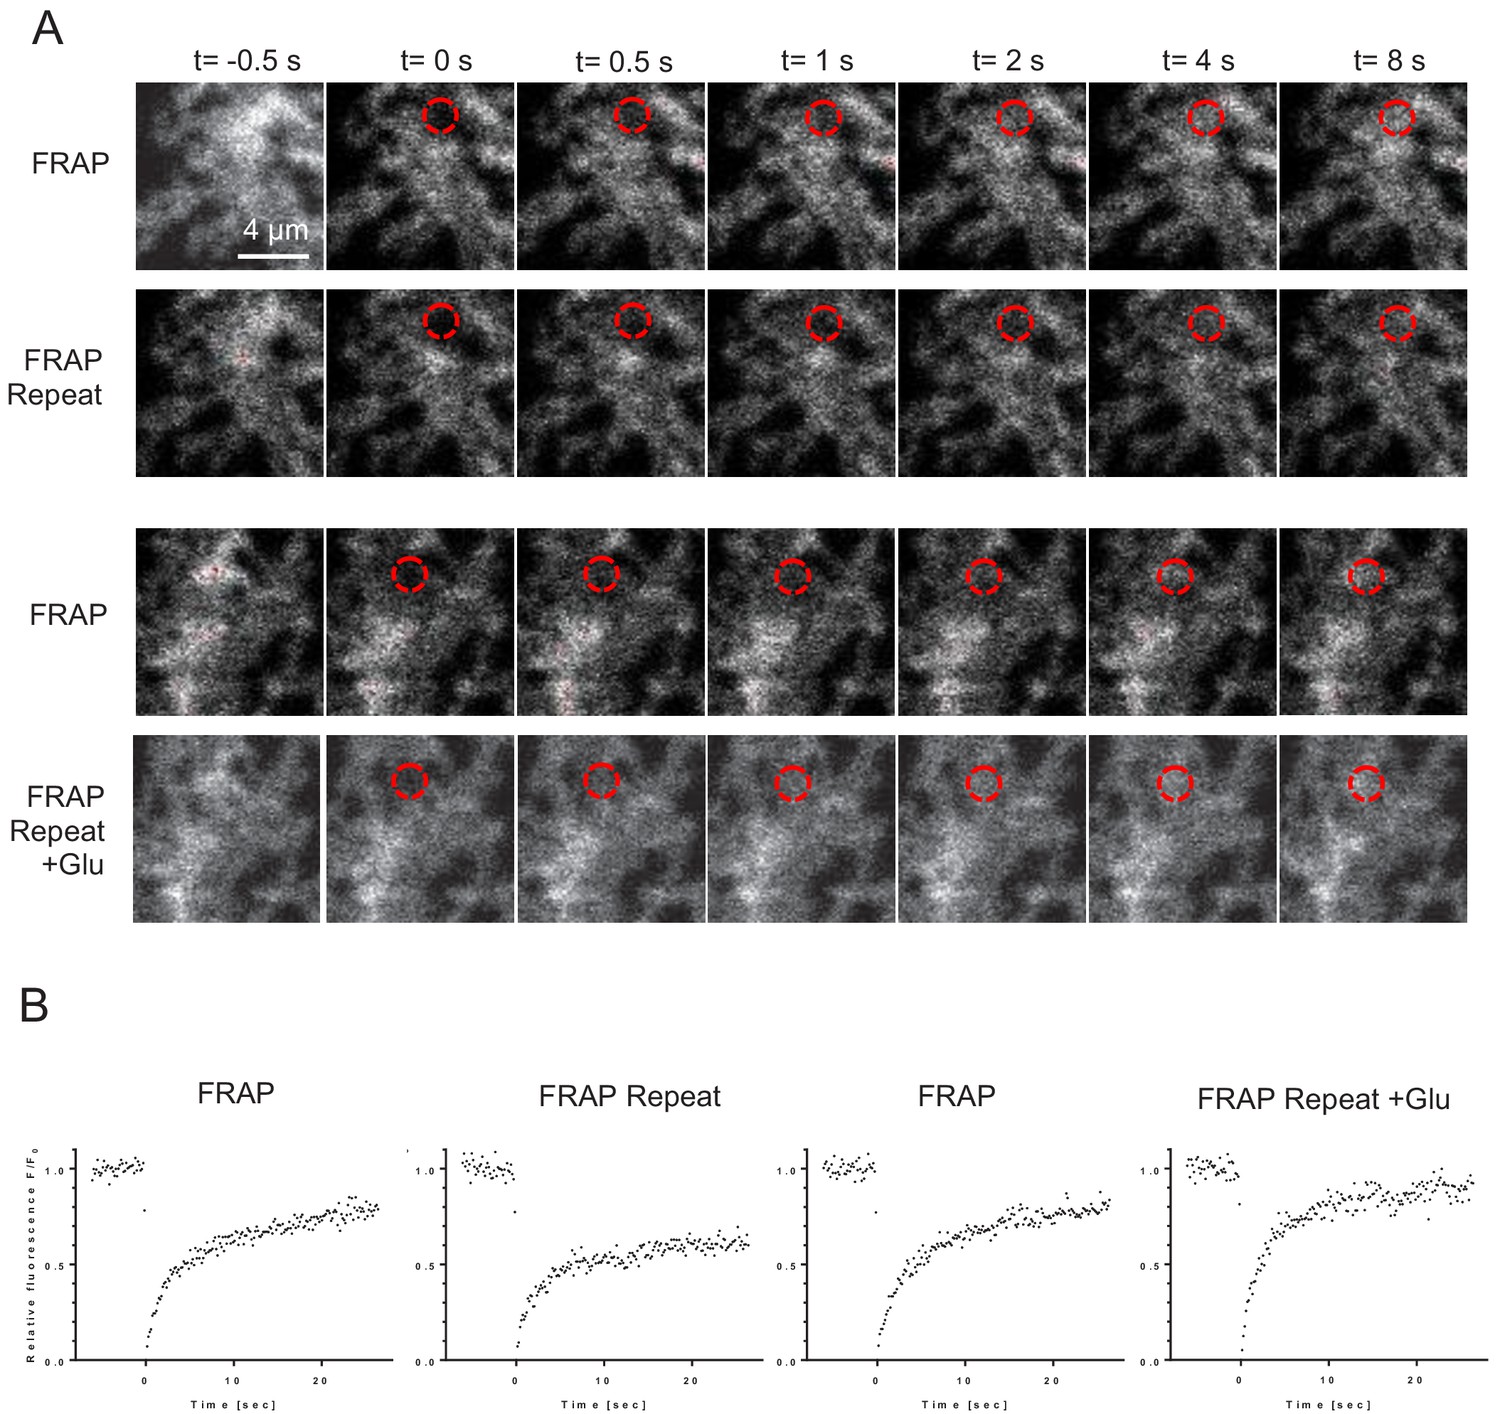
(A) One-cell example of FRAP kinetics at four trials (two paired-trial FRAP stages); time-lapse images of a cell fragment with a FRAP spot (dotted red circle), at selected time points before and after the photobleaching pules (at t = 0), as indicated. (B) Time course of FRAP for the four consecutive trials shown in (A), as indicated.
Figure 5 with 1 supplement
Microscopic-ROI FRAP probes lateral membrane mobility of astroglial GLT1-SEP in organotypic hippocampal slices.
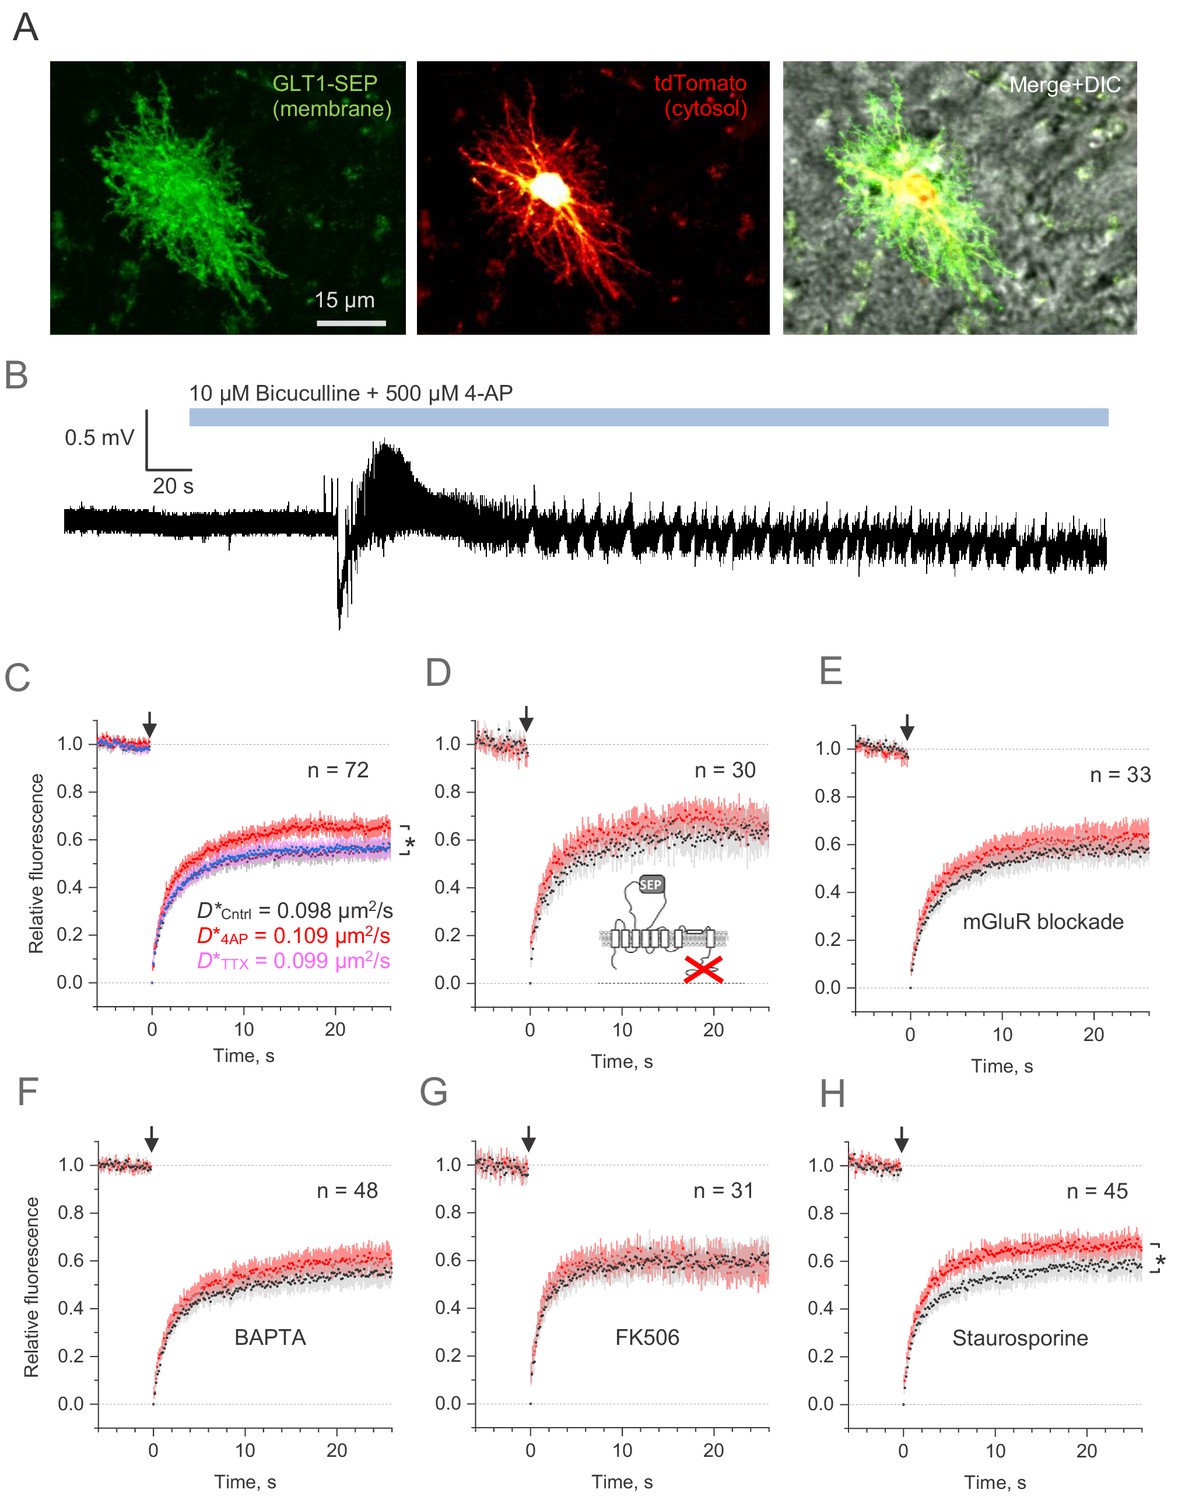
(A) Example of astroglia in an organotypic slice, seen in GLT1-SEP, tdTomato, and merge +DIC channel, as indicated. (B) One-slice example of boosted excitatory activity (field potential recording, CA1 area) induced by the application of GABAA receptor blocker Bicuculine and the potassium channel blocker 4-AP, as indicated. (C) Average time course of the GLT1-SEP FRAP (dots and shade: mean ± 95% confidence interval, here and thereafter) in baseline conditions (black), Bicuculine + 4-AP application (red), and after sodium channel blockade by TTX (magenta), as indicated; p < 0.05 (n = 72 FRAP spots in N = 15 cells). Right, FRAP time course (mean values) fitted with the Soumpasis FRAP equation for (see main text) for control and glutamate tests. Best-fit GLT1-SEP diffusion coefficient D* (Soumpasis FRAP fit) is shown for control (Cntrl), Bicuculine + 4-AP application (4AP) and TTX trials, as indicated. (D) Average FRAP time course for the C-terminus deleted mutant GLT1ΔC-SEP, as indicated; other notation as in (C). (E) Average FRAP time course in the presence of metabotropic glutamate receptor blockers (n = 33 FRAP spots in N = 8 cells): MPEP (1 μM), LY341495 (30 nM), YM298198 (0.3 µM), and NBQX (10 µM); other notation as in (C). (F) Average FRAP time course in the presence of intracellular BAPTA (n = 48 FRAP spots in N = 10 cells); other notation as in (C). (G) Average FRAP time course under the calcineurin (phosphatase) blockade by FK506 (1 µM; n = 31 FRAP spots in N = 6 cells); other notation as in (C). (H) Average FRAP time course in the presence of the broad-range kinase activity blocker Staurospotine (100 nM); *p < 0.05 (n = 45 FRAP spots in N = 8 cells) other notation as in (C).
-
Figure 5—source data 1
Original data readout for Figure 5C–H and Figure 5—figure supplement 1A,B.
- https://cdn.elifesciences.org/articles/64714/elife-64714-fig5-data1-v2.xlsx
Figure 5—figure supplement 1
Control tests for microscopic-ROI FRAP probing of lateral membrane mobility of GLT1-SEP in organotypic hippocampal slices.
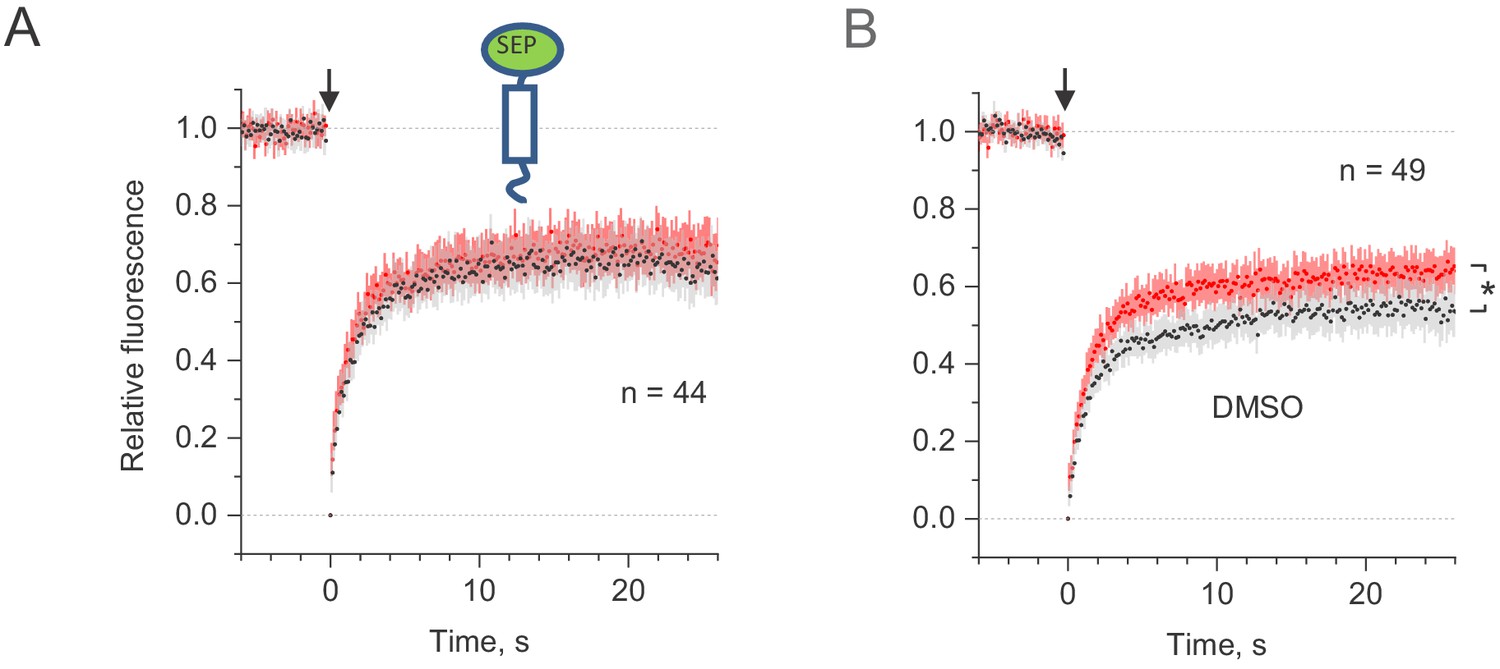
(A) Average time course of the truncated transmembrane protein (C-terminal transmembrane anchoring domain of platelet-derived growth factor receptor) in fusion with SEP (dots and shade: mean ± 95% confidence interval, here and thereafter), in baseline conditions (black) and after the Bicuculine + 4-AP application (red; n = 44 FRAP spots in N = 11 cells). (B) Average FRAP time course in the presence of drugs vehicle – 0.2% DMSO baseline conditions (black) and after the Bicuculine + 4-AP application (red); *, p < 0.05 (n = 49 FRAP spots in N = 13 cells); other notation as in (A).
Additional files
Download links
A two-part list of links to download the article, or parts of the article, in various formats.
Downloads (link to download the article as PDF)
Open citations (links to open the citations from this article in various online reference manager services)
Cite this article (links to download the citations from this article in formats compatible with various reference manager tools)
Rapid recycling of glutamate transporters on the astroglial surface
eLife 10:e64714.
https://doi.org/10.7554/eLife.64714


