Utility of polygenic embryo screening for disease depends on the selection strategy
- Departments of Psychiatry and Molecular Medicine, Zucker School of Medicine at Hofstra/Northwell, United States
- Department of Psychiatry, Division of Research, The Zucker Hillside Hospital Division of Northwell Health, United States
- Institute for Behavioral Science, The Feinstein Institutes for Medical Research, United States
- Braun School of Public Health and Community Medicine, The Hebrew University of Jerusalem, Israel
- Department of Genetics and Genomic Sciences, Icahn School of Medicine at Mount Sinai, United States
- The Charles Bronfman Institute for Personalized Medicine, Icahn School of Medicine at Mount Sinai, United States
- Department of Medicine, Icahn School of Medicine at Mount Sinai, United States
- Department of Epidemiology, Harvard T.H. Chan School of Public Health, United States
- Department of Statistics and Data Science, The Hebrew University of Jerusalem, Israel
Figures
Figure 1
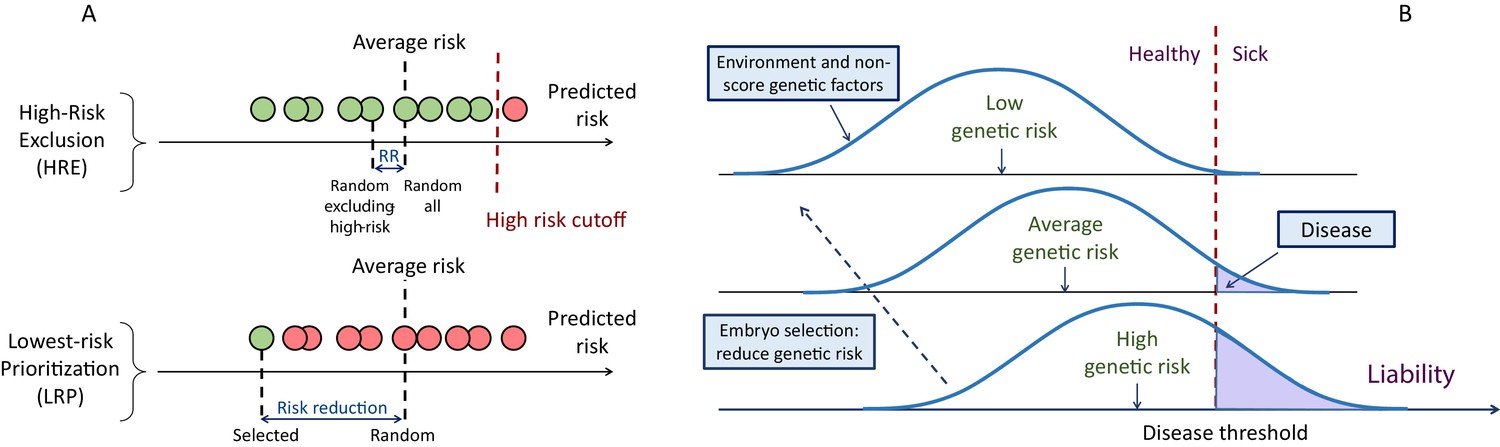
A schematic of the liability threshold model and polygenic embryo screening.
(A) An illustration of the embryo selection strategies considered in this report. In the figure, each embryo is shown as a filled circle, and embryos are sorted based on their predicted risk, that is, their polygenic risk scores. Excluded embryos are shown in pink, and embryos that can be implanted in green. The risk reduction (RR) is indicated as the difference in risk between a randomly selected embryo (if no polygenic scoring was performed) and the embryo selected based on one of two strategies. In high-risk exclusion (HRE), the embryo selected for implantation is random, as long as its PRS is under a high-risk cutoff (usually the top few PRS percentiles). If all embryos are high-risk, a random embryo is selected. In lowest-risk prioritization (LRP), the embryo with the lowest PRS is selected for implantation. As we describe below, the LRP strategy yields much larger disease risk reductions. (B) An illustration of the liability threshold model (LTM). Under the LTM, each disease has an underlying (unobserved) liability, and an individual is affected if the total liability is above a threshold. The liability is composed of a genetic component and an environmental component, both assumed to be normally distributed in the population. For a given genetic risk (represented here by the polygenic risk score), the liability is the sum of that risk, plus a normally distributed residual component (environmental + genetic factors not captured by the PRS). For an individual with high genetic risk (bottom curve), even a modestly elevated (and thus, commonly-occurring) liability-increasing environment will lead to disease. For an individual with low genetic risk (top curve), only an extreme environment will push the liability beyond the disease threshold. Thus, disease risk reduction can be achieved with embryo screening by lowering the genetic risk of the implanted embryo. (Note that for the purpose of illustration, panel (B) displays three discrete levels of genetic risk, although in reality, the PRS is continuously distributed).
Figure 2 with 3 supplements
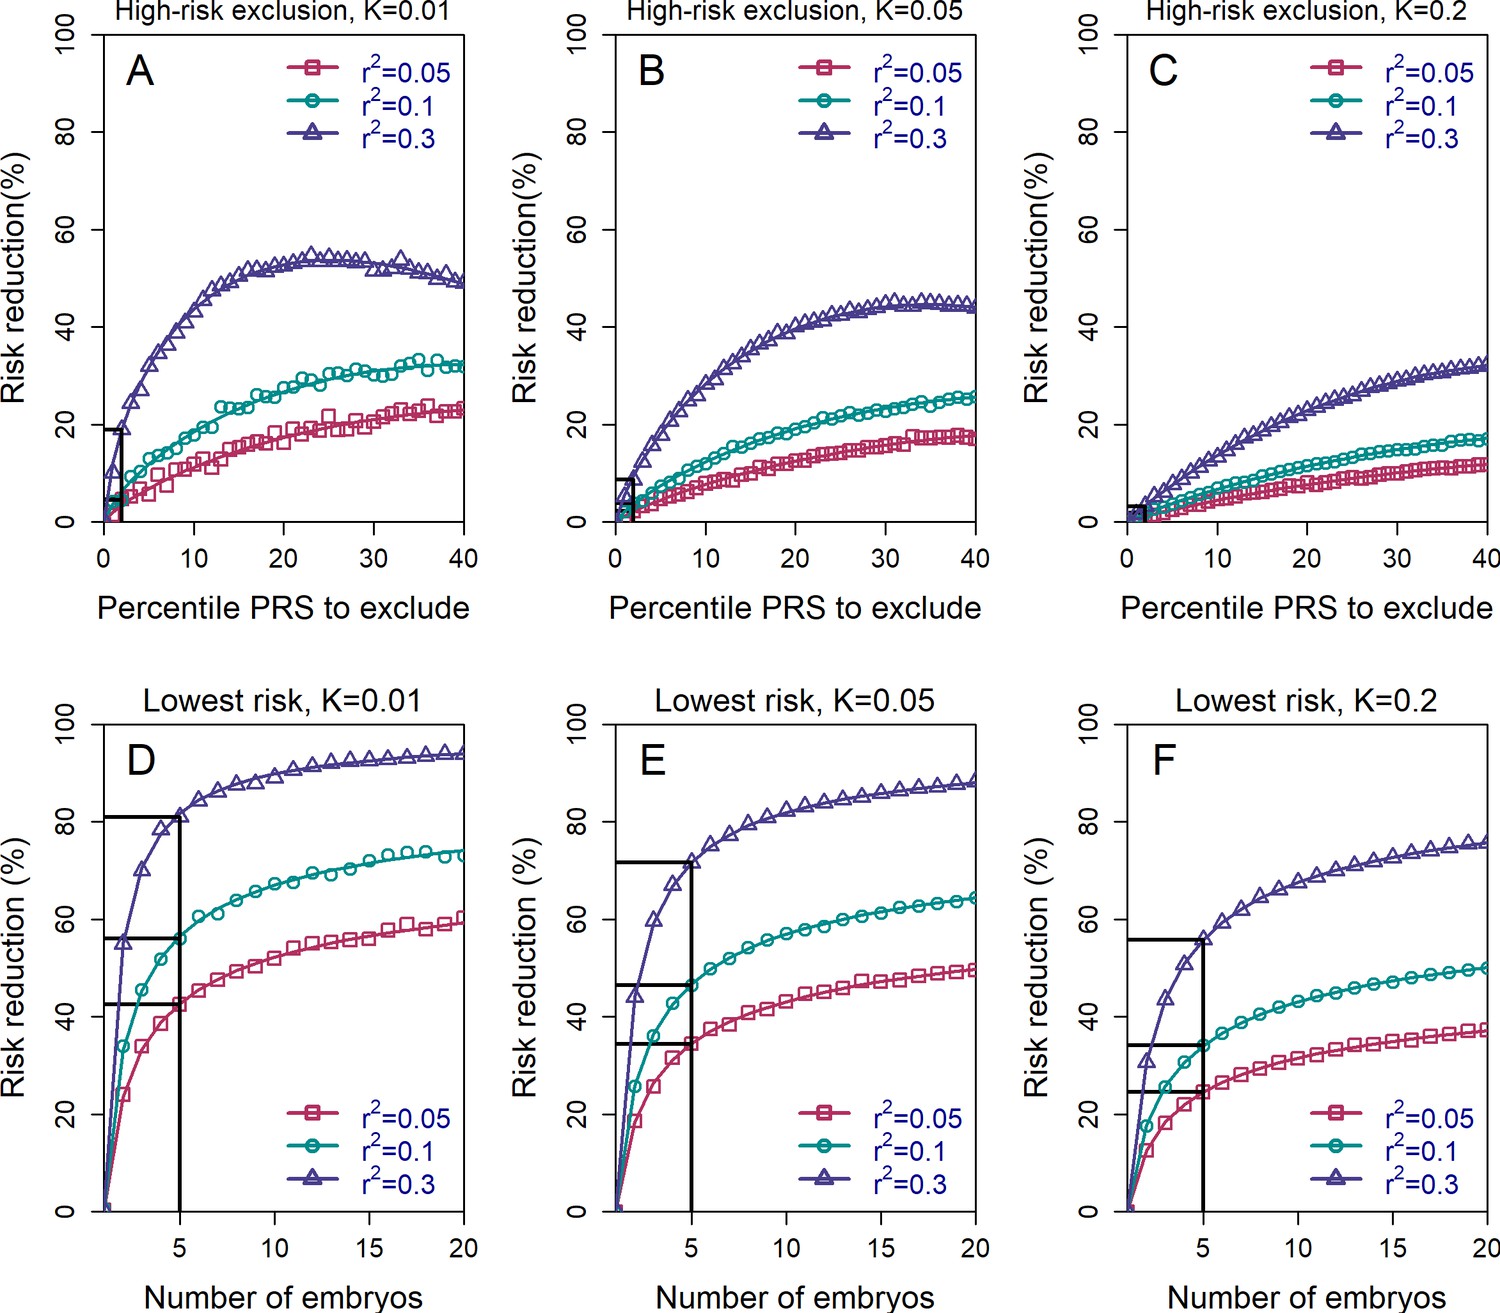
The relative risk reduction across selection strategies and disease parameters.
The relative risk reduction (RRR) is defined as , where is the disease prevalence, and is the probability of the implanted embryo to become affected. The RRR is shown for the high-risk exclusion (HRE) strategy in the upper row (panels (A–C)), and for the lowest-risk prioritization (LRP) in the lower row (panels (D–F)). See Figure 1 for the definitions of the strategies. Results are shown for values of and (panels (A–C), respectively), and within each panel, for variance explained by the PRS (on the liability scale) , and (legends). Symbols denote the results of Monte-Carlo simulations (Materials and methods), where PRSs of embryos were drawn based on a multivariate normal distribution, assuming PRSs are standardized to have zero mean and variance , and accounting for the genetic similarity between siblings (Equation 4 in the Appendix). In each simulated set of sibling embryos ( for all simulations under HRE), one embryo was selected according to the selection strategy. The liability of the selected embryo was computed by adding a residual component (drawn from a normal distribution with zero mean and variance ) to its polygenic score. The embryo was considered affected if its liability exceeded , the (upper) -quantile of the standard normal distribution. We repeated the simulations over 106 sets of embryos and computed the disease risk. In each panel, curves correspond to theory: Equation (31) in the Appendix for the HRE strategy, and Equation (20) in the Appendix for the LRP strategy. Black straight lines correspond to the RRR achieved when excluding embryos at the top 2% of the PRS (for HRE, upper panels) or for selecting the lowest risk embryo out of (for LRP, lower panels).
Figure 2—figure supplement 1
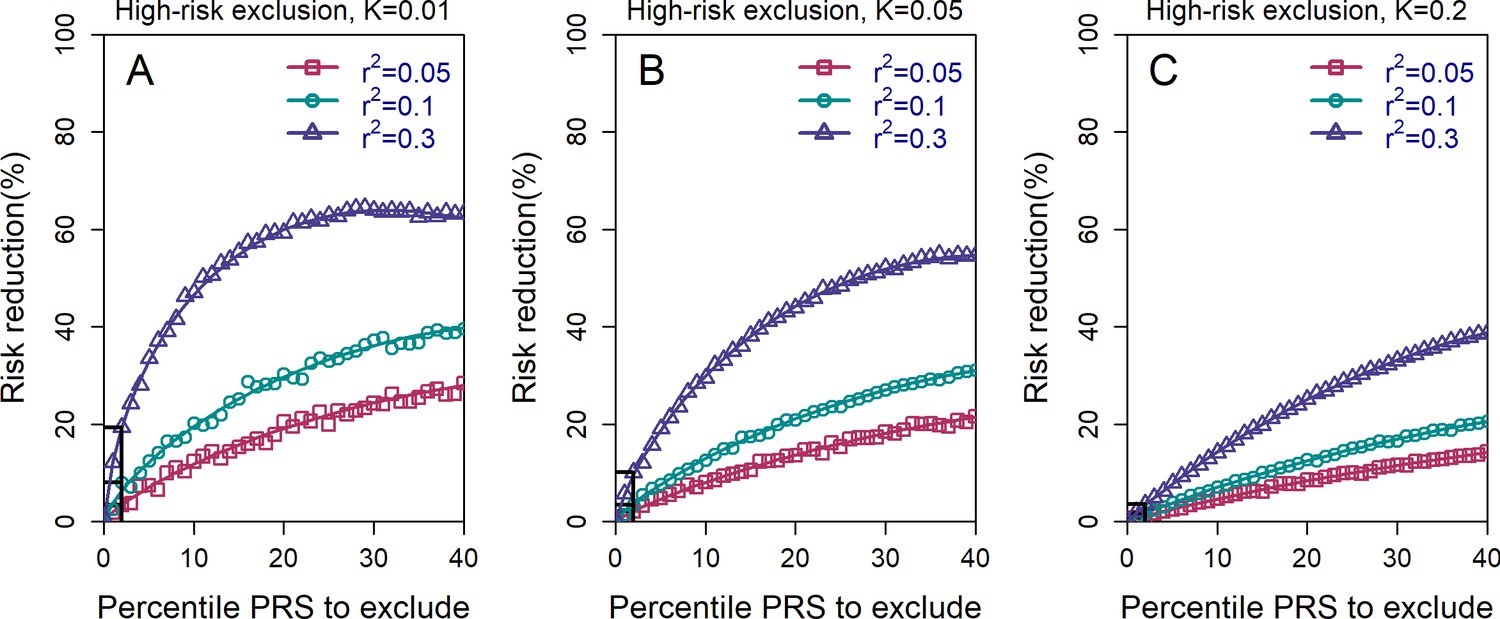
The relative risk reduction for the high-risk exclusion strategy, with available embryos.
All details are exactly as in panels (A–C) in Figure 2 of the main text, except that we simulated embryos.
Figure 2—figure supplement 2
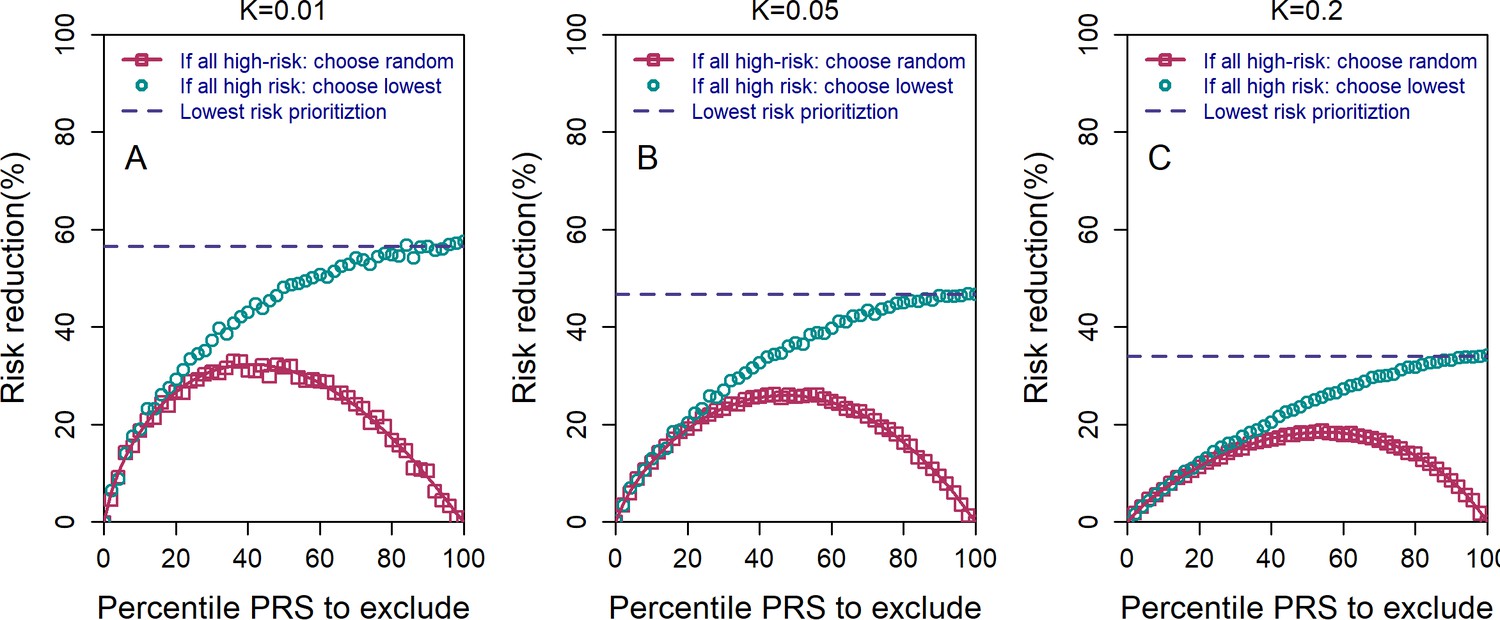
The relative risk reduction under the high-risk exclusion (HRE) strategy, using two different rules for how an embryo is selected when all embryos are high risk.
All details are similar to those of Figure 2 of the main text, except the following. We used embryos, , and and (panels (A–C), respectively). For both sub-strategies, we first determined whether there were any non-high-risk embryos. If such embryos existed, one of them was randomly selected. If all embryos were high risk, the pink symbols and lines correspond to selecting an embryo at random (symbols: simulations; line: theory; see the Appendix). The cyan symbols correspond to selecting the embryo with the lowest PRS (simulations only). The blue dashed horizontal line corresponds to the theoretical relative risk reduction for the lowest-risk prioritization (LRP) strategy. When all embryos are designated as high risk (percentile PRS to exclude is 100%), the random selection sub-strategy reduces to a completely random selection and thus yields no risk reduction, whereas the lowest PRS sub-strategy becomes equivalent to the regular LRP strategy.
Figure 2—figure supplement 3
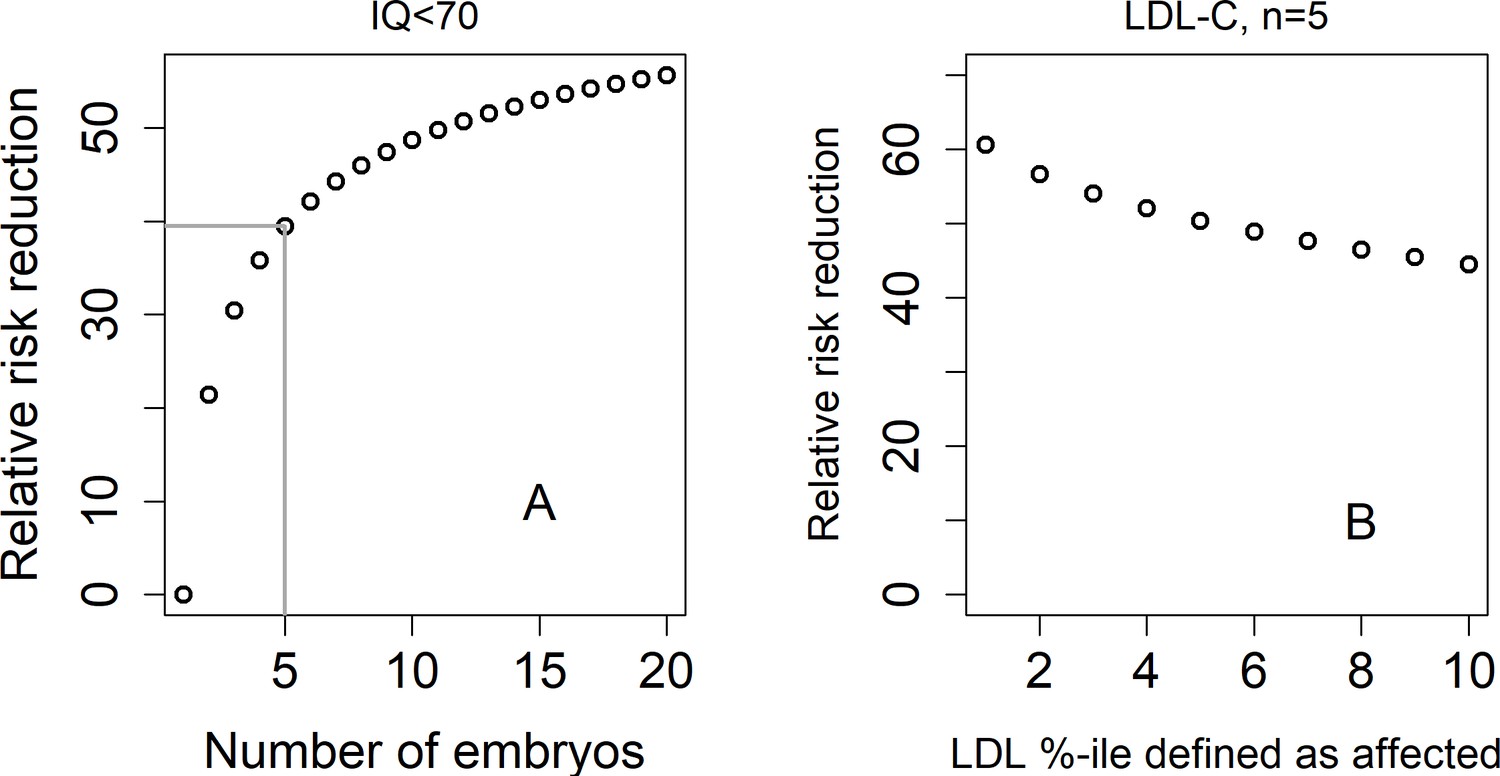
The relative risk reduction under the lowest-risk prioritization strategy for a dichotomized trait.
In panel (A), we define a hypothetical individual as 'affected' (or having an intellectual disability) if that individual has IQ<70. Assuming IQ is normally distributed with a mean of 100 and a SD of 15, this implies that the prevalence is . We plot the predicted relative risk reduction (computed as in Figure 2) vs the number of embryos under the LRP strategy (note that here, the embryo with the highest score is selected). We used (Savage et al., 2018). In panel (B), we show the predicted RRR under the LRP strategy for a 'high LDL cholesterol' binary trait. Here, we fixed and varied the prevalence of our hypothetical 'high LDL' trait. Given a prevalence , an individual is defined as having 'high LDL' if its LDL value in the top -percentiles. We used (Weissbrod et al., 2021).
Figure 3 with 2 supplements
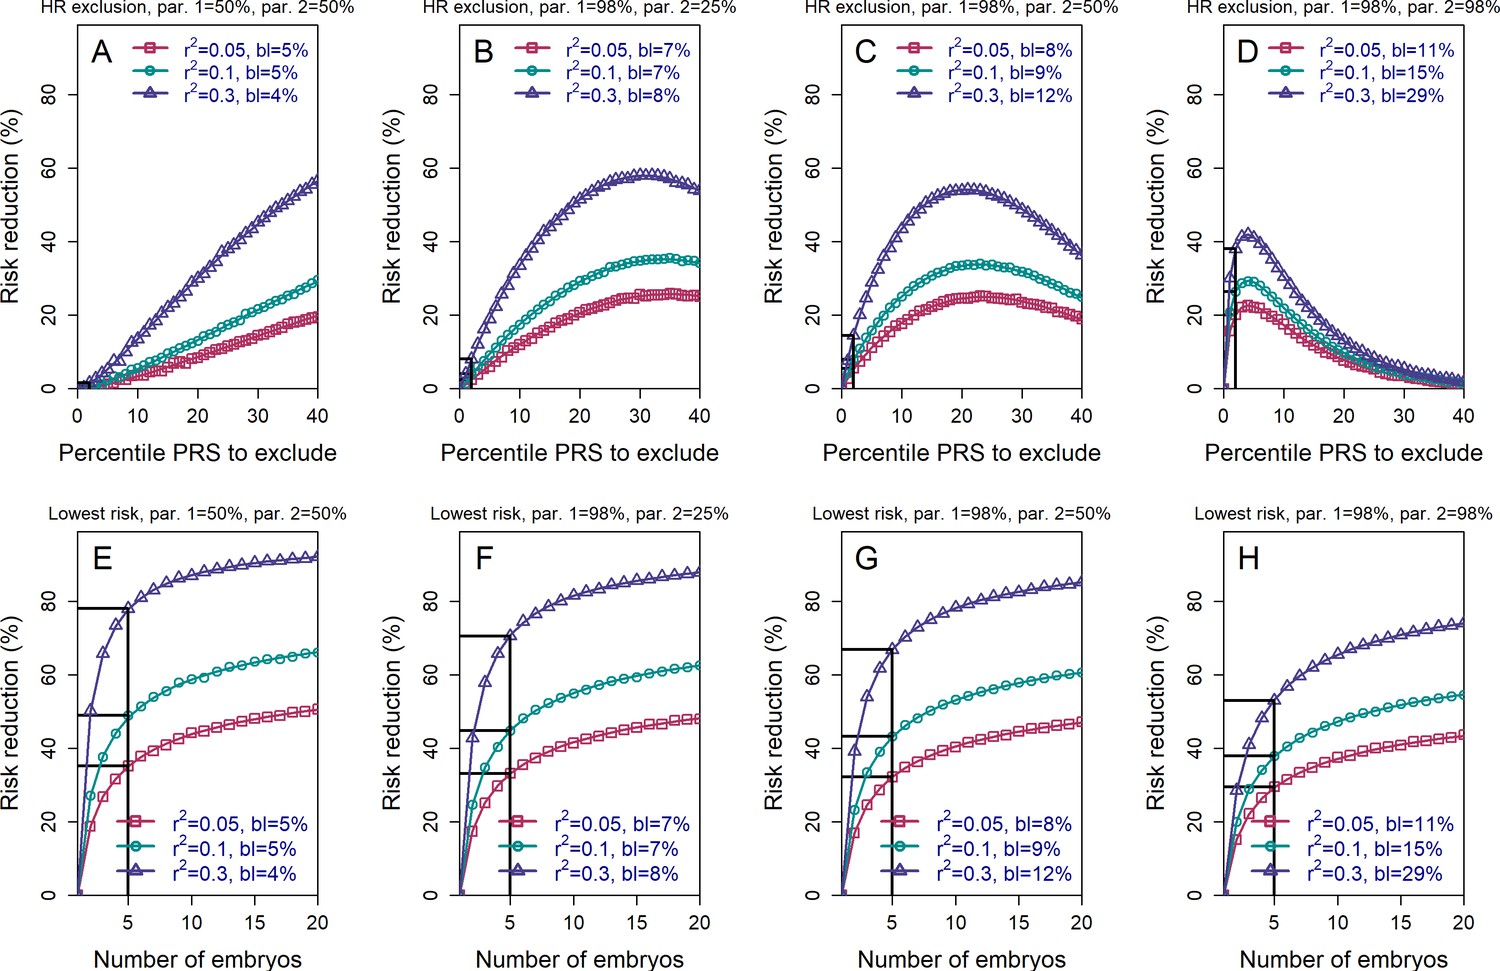
The relative risk reduction when the polygenic risk scores of the parents are known.
Panels (A)-(D) are for the high-risk exclusion (HRE) strategy, while panels (E)-(H) are for the lowest-risk prioritization (LRP) strategy. All details are as in Figure 2, except the following. First, we fixed the prevalence to . Second, in the simulations, we drew the PRS of each embryo as (), where is an embryo-specific component (independent across embryos) and is the shared component, also representing the mean parental PRS (Materials and methods). This is so far as in Figure 2; however, here we assumed that is given, equal to the average PRSs of the two parents. In each panel, we consider a different pair of PRSs for the parents. For example, in panels (A) and (E), both parents ('par. 1' and 'par. 2') have PRS equal to the 50% percentile of the PRS distribution; in panels (B) and (F), one parent has PRS equal to the 98% percentile of the PRS distribution, while the other has PRS equal to the 25% percentile; and so on. Third, in the simulations, we computed the risk reduction (according to either strategy) relative to a baseline, obtained from the same sets of simulations, when we always selected the first embryo. The baseline risk is indicated in each legend as 'bl'. Note that the baseline risk depends on the variance explained by the PRS, because the parental PRSs are determined as percentiles of the population distribution of the score, which has variance . Finally, we computed the theoretical disease risk for the HRE strategy using Equation (29) from the Appendix, the disease risk for the LRP strategy using Equation (23), and the relative risk reduction (shown in curves) for both strategies using Equation (36).
Figure 3—figure supplement 1
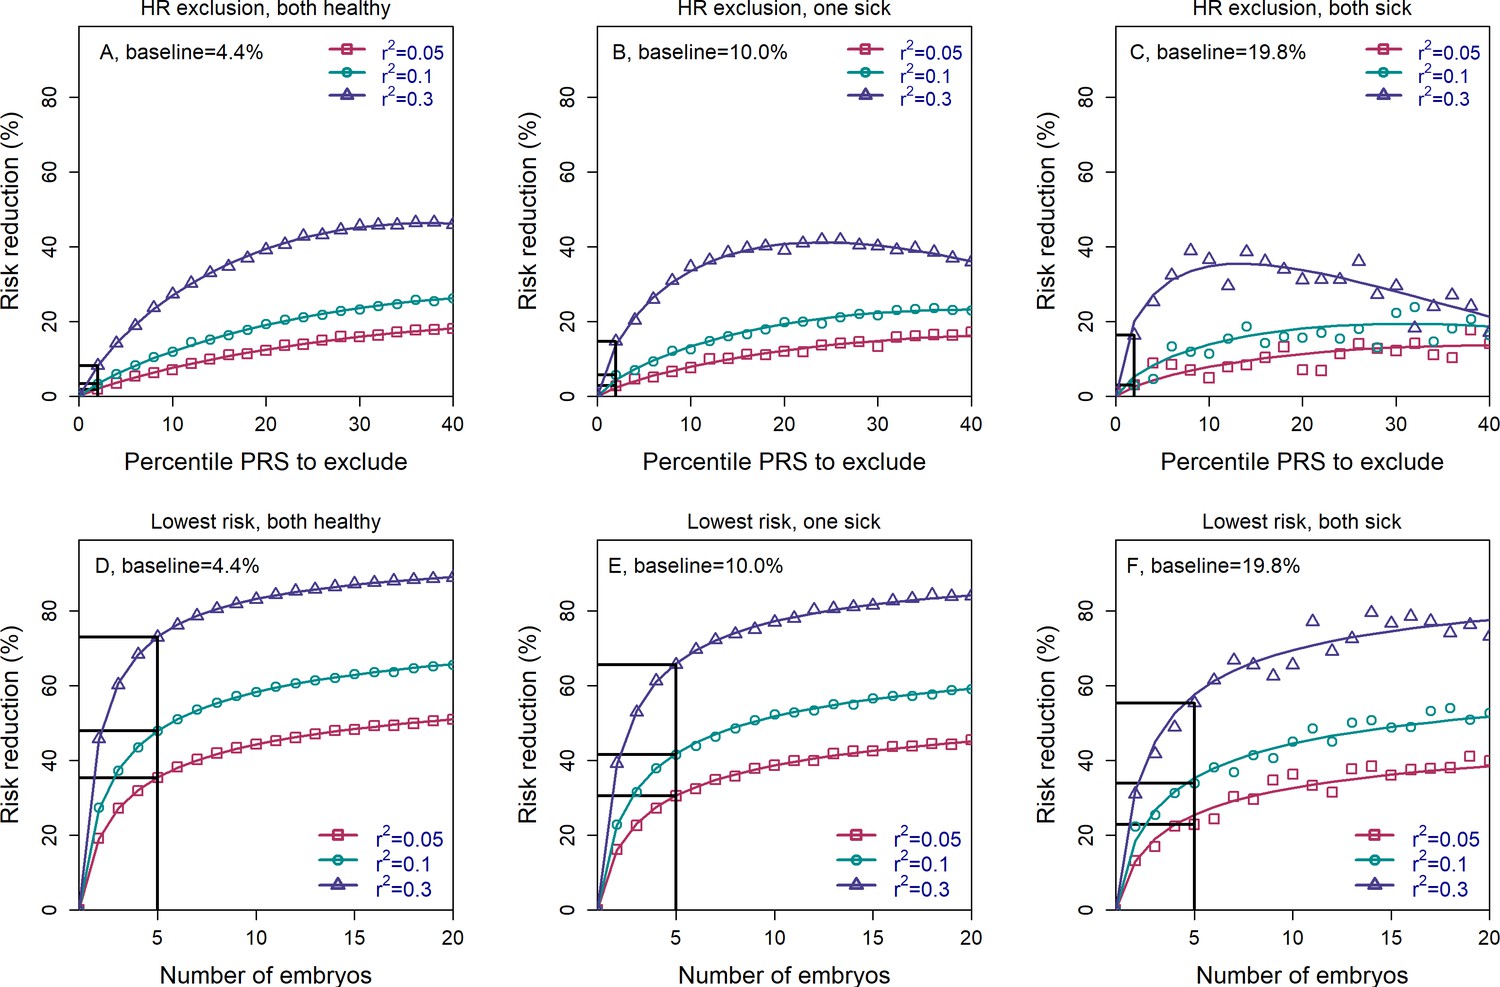
The relative risk reduction when the parental disease status is known.
Panels (A–C) are for the high-risk exclusion (HRE) strategy, while panels (D–F) are for the lowest-risk prioritization (LRP) strategy. The details are as in Figure 2, except the following. First, we fixed the prevalence to and the heritability to (note that the heritability was not needed in previous figures). Second, in the simulations, we first drew the parental genetic components: and for the mother, and and for the father, where are the polygenic scores and represent non-score genetic factors (Appendix Section 6). We drew the environmental component for each parent as and computed the liability of each parent as . If the liability of a parent exceeded (the upper -quantile of the standard normal distribution), we designated that parent as affected. We then stratified the risk reduction results based on the number of affected parents: 0 (panels (A) and (D)), 1 (panels (B) and (E)), and 2 (panels (C) and (F)). Note that as expected, the number of families in which both parents are affected is small, and thus, the results in panels (C) and (F) are noisy. For each set of parents, we drew the PRS of each embryo as (), where is an embryo-specific component of the score (independent across embryos). We then selected one embryo from each family based on either selection strategy. We computed the liability of the selected embryo as , where is the embryo-specific component of the non-score genetic factors, and is the environmental component of the embryo (Appendix Section 6). The embryo was designated as affected or unaffected as described for the parents. We computed the risk reduction (according to either strategy) relative to a baseline, obtained from the same sets of simulations when we always selected the first embryo. The baseline risk is indicated on top of each panel. We computed the theoretical relative risk reduction for the two strategies as summarized in Appendix Section 6.9.
Figure 3—figure supplement 2
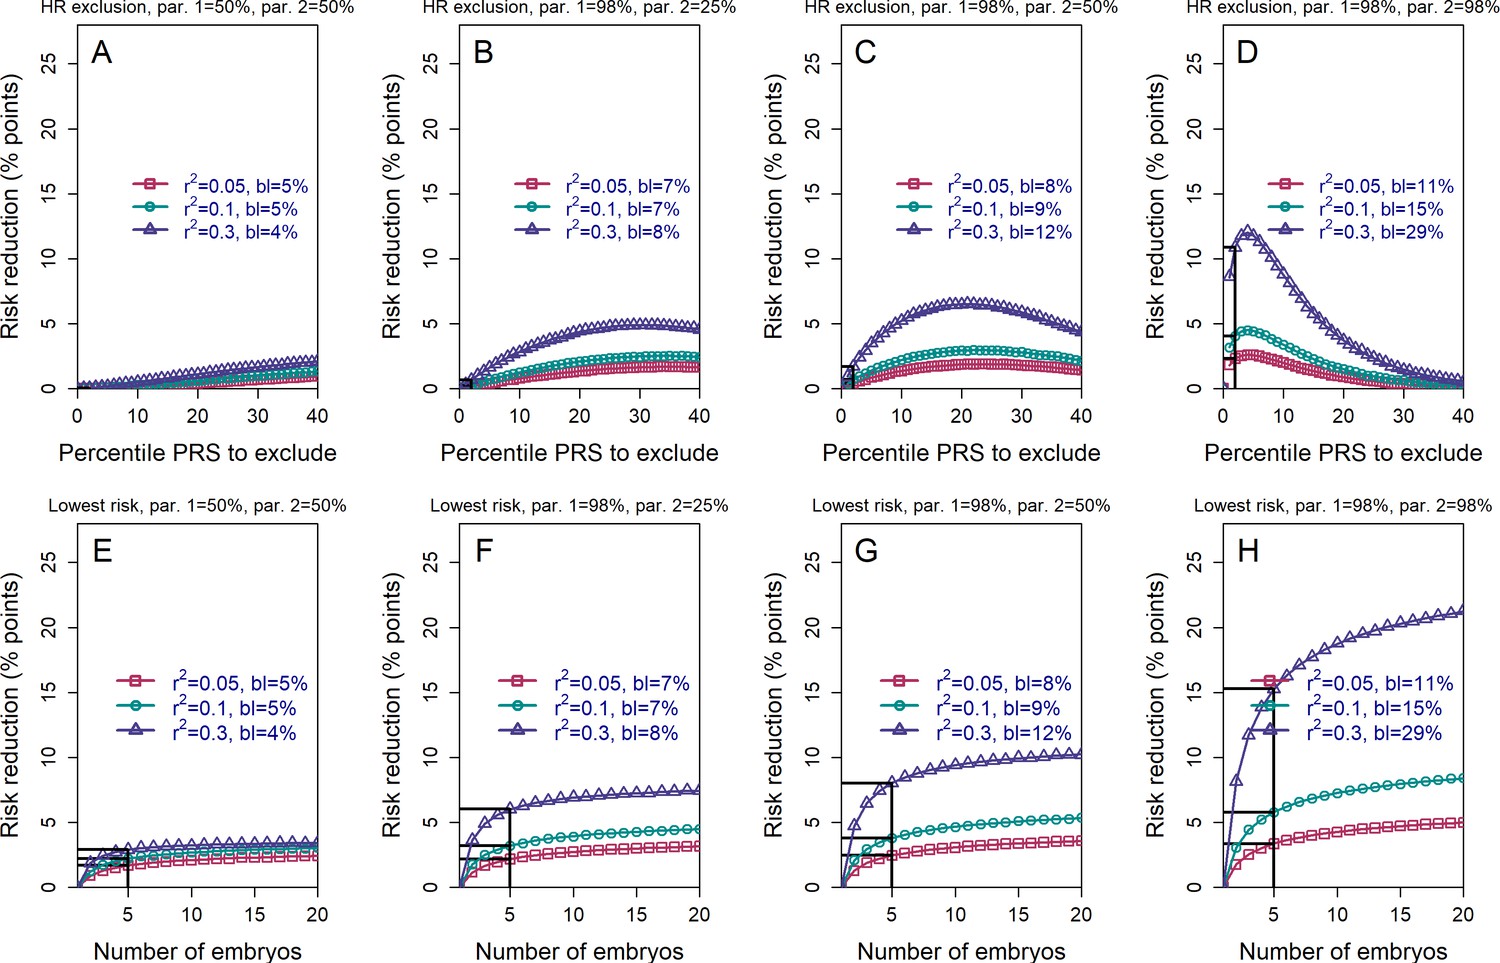
The absolute risk reduction when the polygenic risk scores of the parents are known.
All details are the same as in Figure 3, except that the absolute (rather than the relative) risk reduction is shown. The absolute risk reduction is defined as the difference between the baseline disease risk (given the parental PRSs; legends ('bl')) and the risk following either strategy of embryo selection. It is plotted as percentage points.
Figure 4
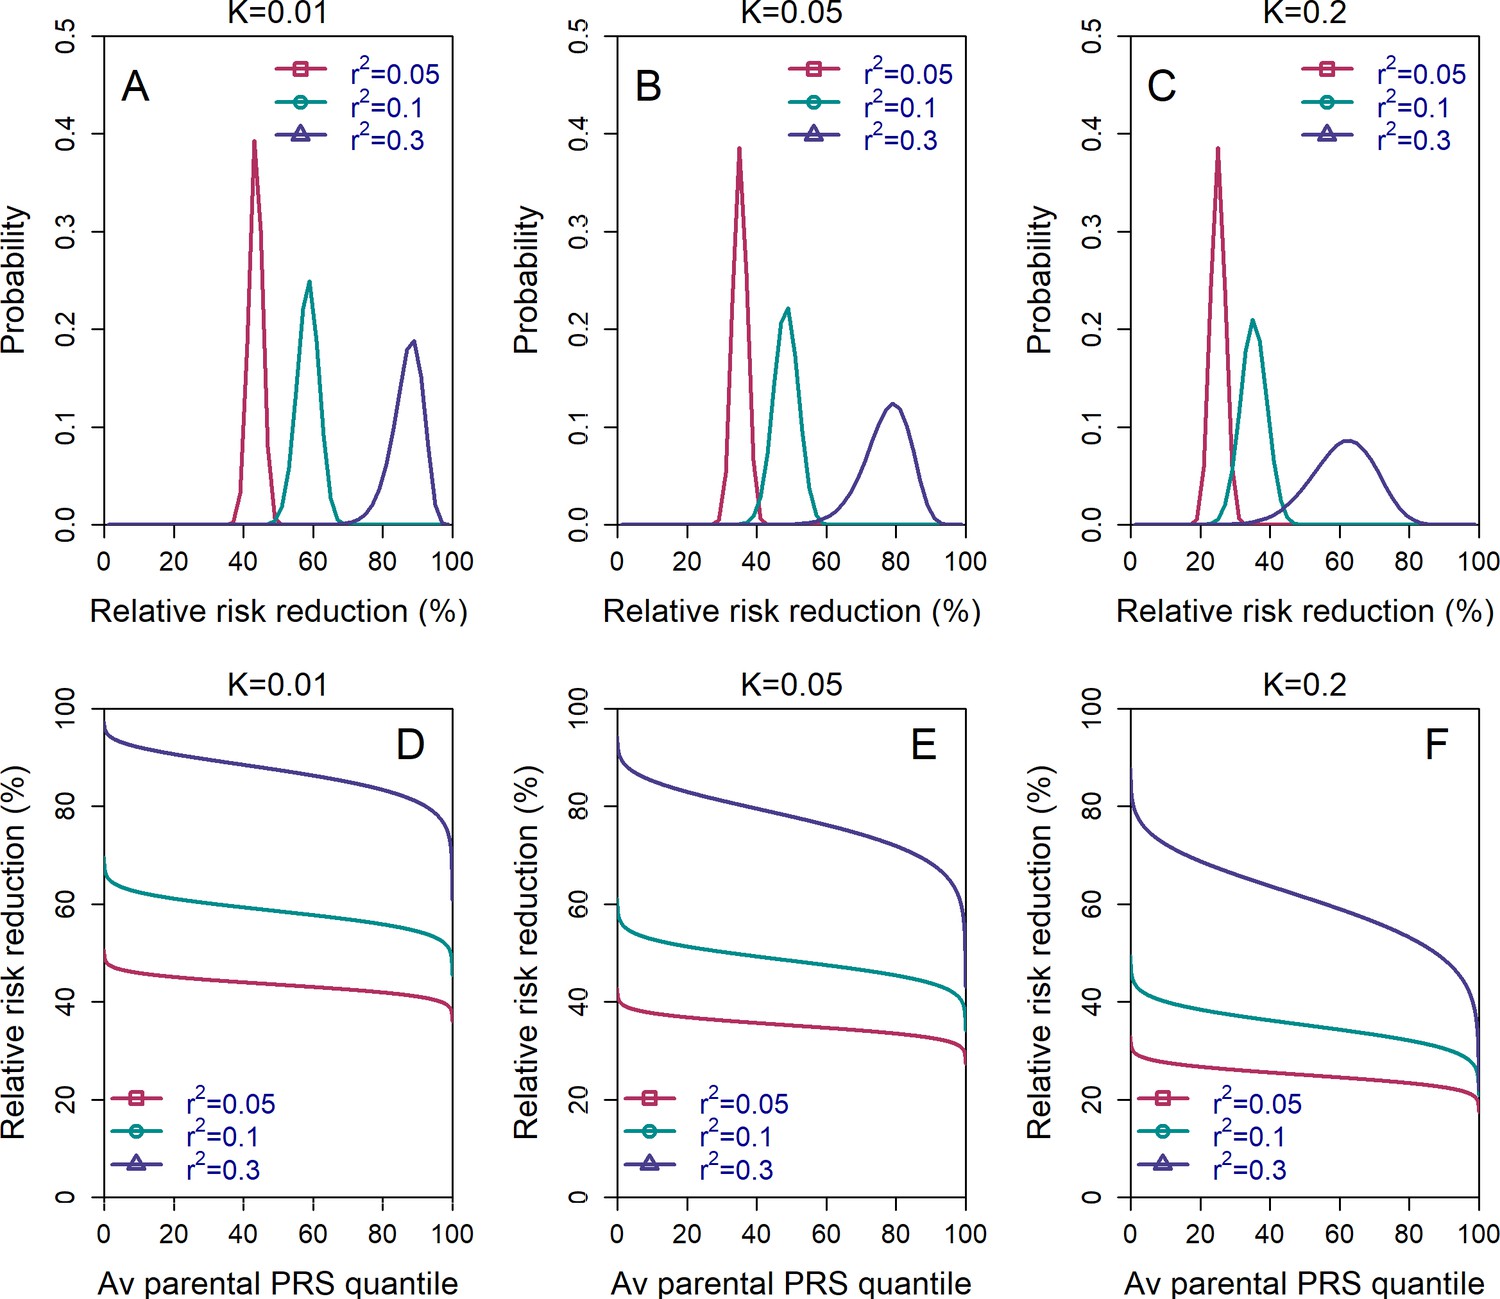
The variability in the relative risk reduction across couples.
We considered only the lowest-risk prioritization strategy. In panels (A–C), we computed the theoretical distribution of the per-couple relative risk reduction, as explained in the Appendix Section 5. Briefly, the per-couple RRR is defined as , where is the probability of an embryo selected based on its PRS to be affected and is the probability of a randomly selected embryo to be affected, both conditional on the given couple. Our modeling suggests that , which is the average of the paternal and maternal PRSs, is the only determinant of the relative risk reduction of a given couple. We computed the distribution of the per-couple RRR based on 104 quantiles of , thus covering all hypothetical couples in the population. The number of embryos was set to in all panels. Panels (A–C) correspond to prevalence of , and , respectively. In panels (D–F), we plot the theoretical RRR vs the quantile of the average parental PRS (see Appendix Section 5.1).
Figure 5
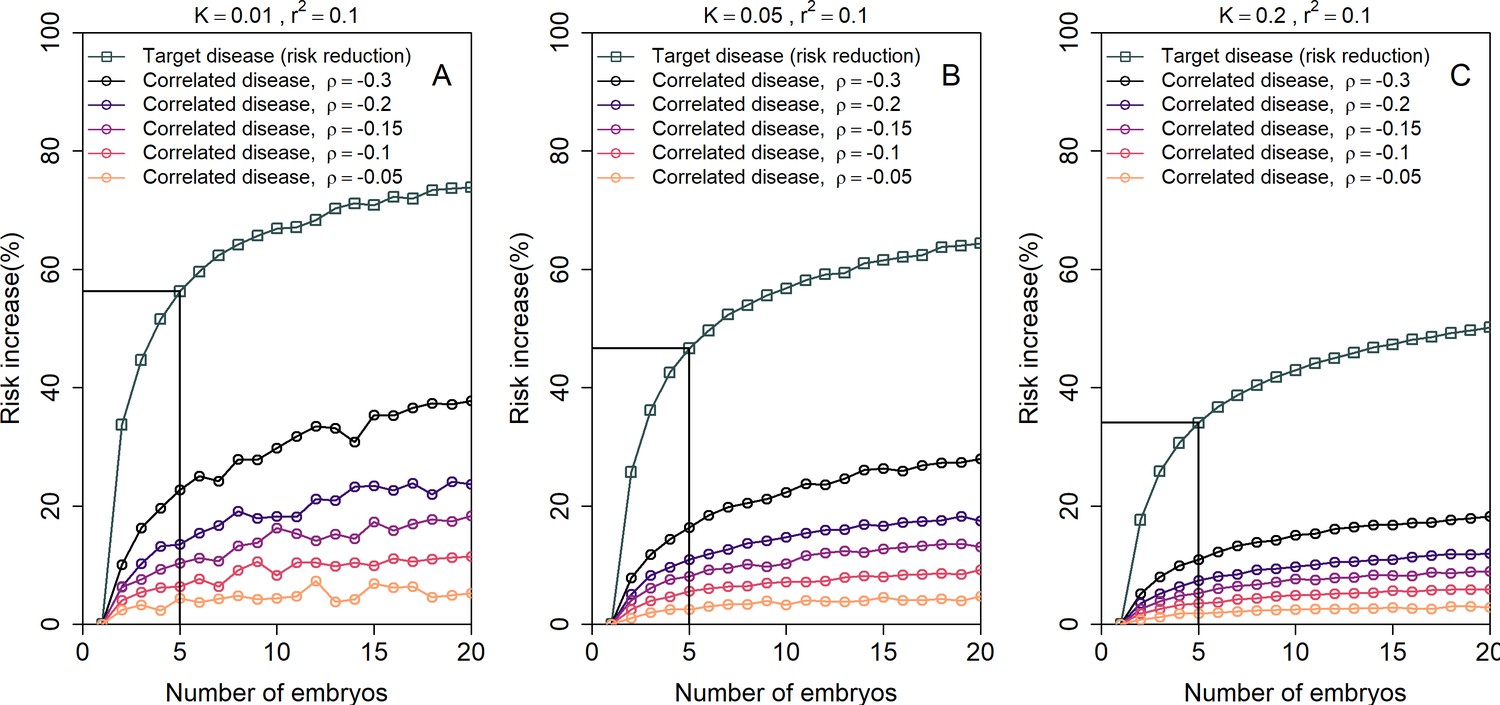
The increase in the risk of a negatively correlated disease due to polygenic embryo screening.
We simulated two diseases that have genetic correlation . We assumed that the prevalence is equal between the two diseases ( and : panels (A)-(C), respectively), and that for both diseases. We simulated polygenic scores for the two diseases in embryos in each of 106 couples. For each couple, we selected the embryo either randomly or based on having the lowest PRS for the target disease. We then computed the risk of the embryo to have each disease as in the main analyses, by drawing the residual component of the liability and designating the embryo as affected if the total liability exceeded a threshold. The relative risk reduction of the target disease is shown as gray squares (and connecting lines) at the top of each plot. The relative risk increase for the correlated disease is shown in colored circles (and connecting lines), with different colors corresponding to different values of (see legend). Note that the risk reduction for the target disease is independent of .
Figure 6 with 1 supplement
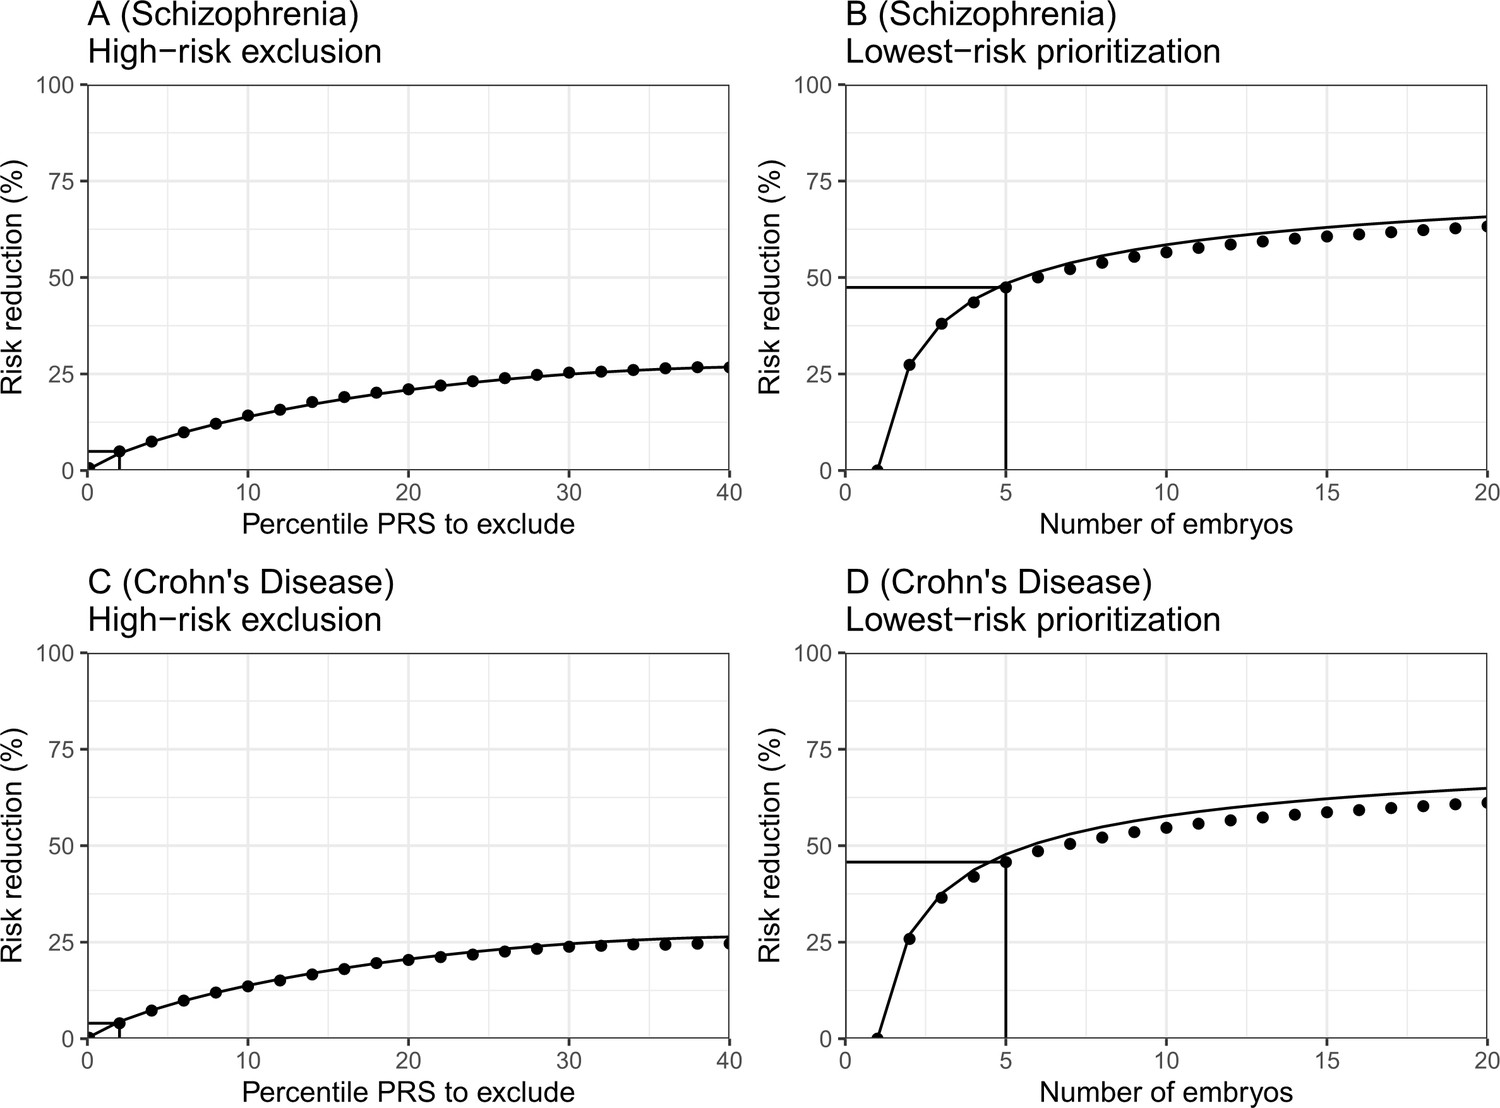
The empirical relative risk reduction in simulated embryos based on genomes from case-control studies of schizophrenia and Crohn’s disease.
We used ≈900 cases and ≈1600 controls for schizophrenia, and ≈150 cases and ≈100 controls for Crohn’s. For each disease, we drew 5000 random 'virtual couples', regardless of sex, but correcting for case/control ascertainment. For each such random couple, we simulated the genomes of up to embryos (children) based on Mendelian segregation and published recombination maps. For each embryo, we computed the PRS for the given disease (schizophrenia or Crohn’s) using the most recent summary statistics that exclude our cohort. We computed the risk of each embryo to be affected based on a logistic regression model we learned in the 'parental' cohort. Panels (A) and (B) show results for schizophrenia, while panels (C) and (D) show results for Crohn’s. In panels (A) and (C), we plot the relative risk reduction (RRR) under the high-risk exclusion (HRE) selection strategy, in which an embryo was randomly selected (out of embryos), unless its PRS was above a given percentile. The RRR was computed against a baseline strategy of selection of an embryo at random and is plotted vs the exclusion percentile. In panels (B) and (D), we show the relative risk reduction under the lowest-risk prioritization (LRP) strategy, in which the embryo with the lowest PRS was selected. We plot the RRR vs the number of embryos . In all panels, dots correspond to the results of simulations, and solid lines correspond to the theory. The theory was computed assuming prevalence of 1% for schizophrenia and 0.5% for Crohn’s, and variance explained on the liability scale of for schizophrenia for Crohn’s (calculated using the method of Lee et al., 2012). Further details are provided in Materials and methods.
Figure 6—figure supplement 1
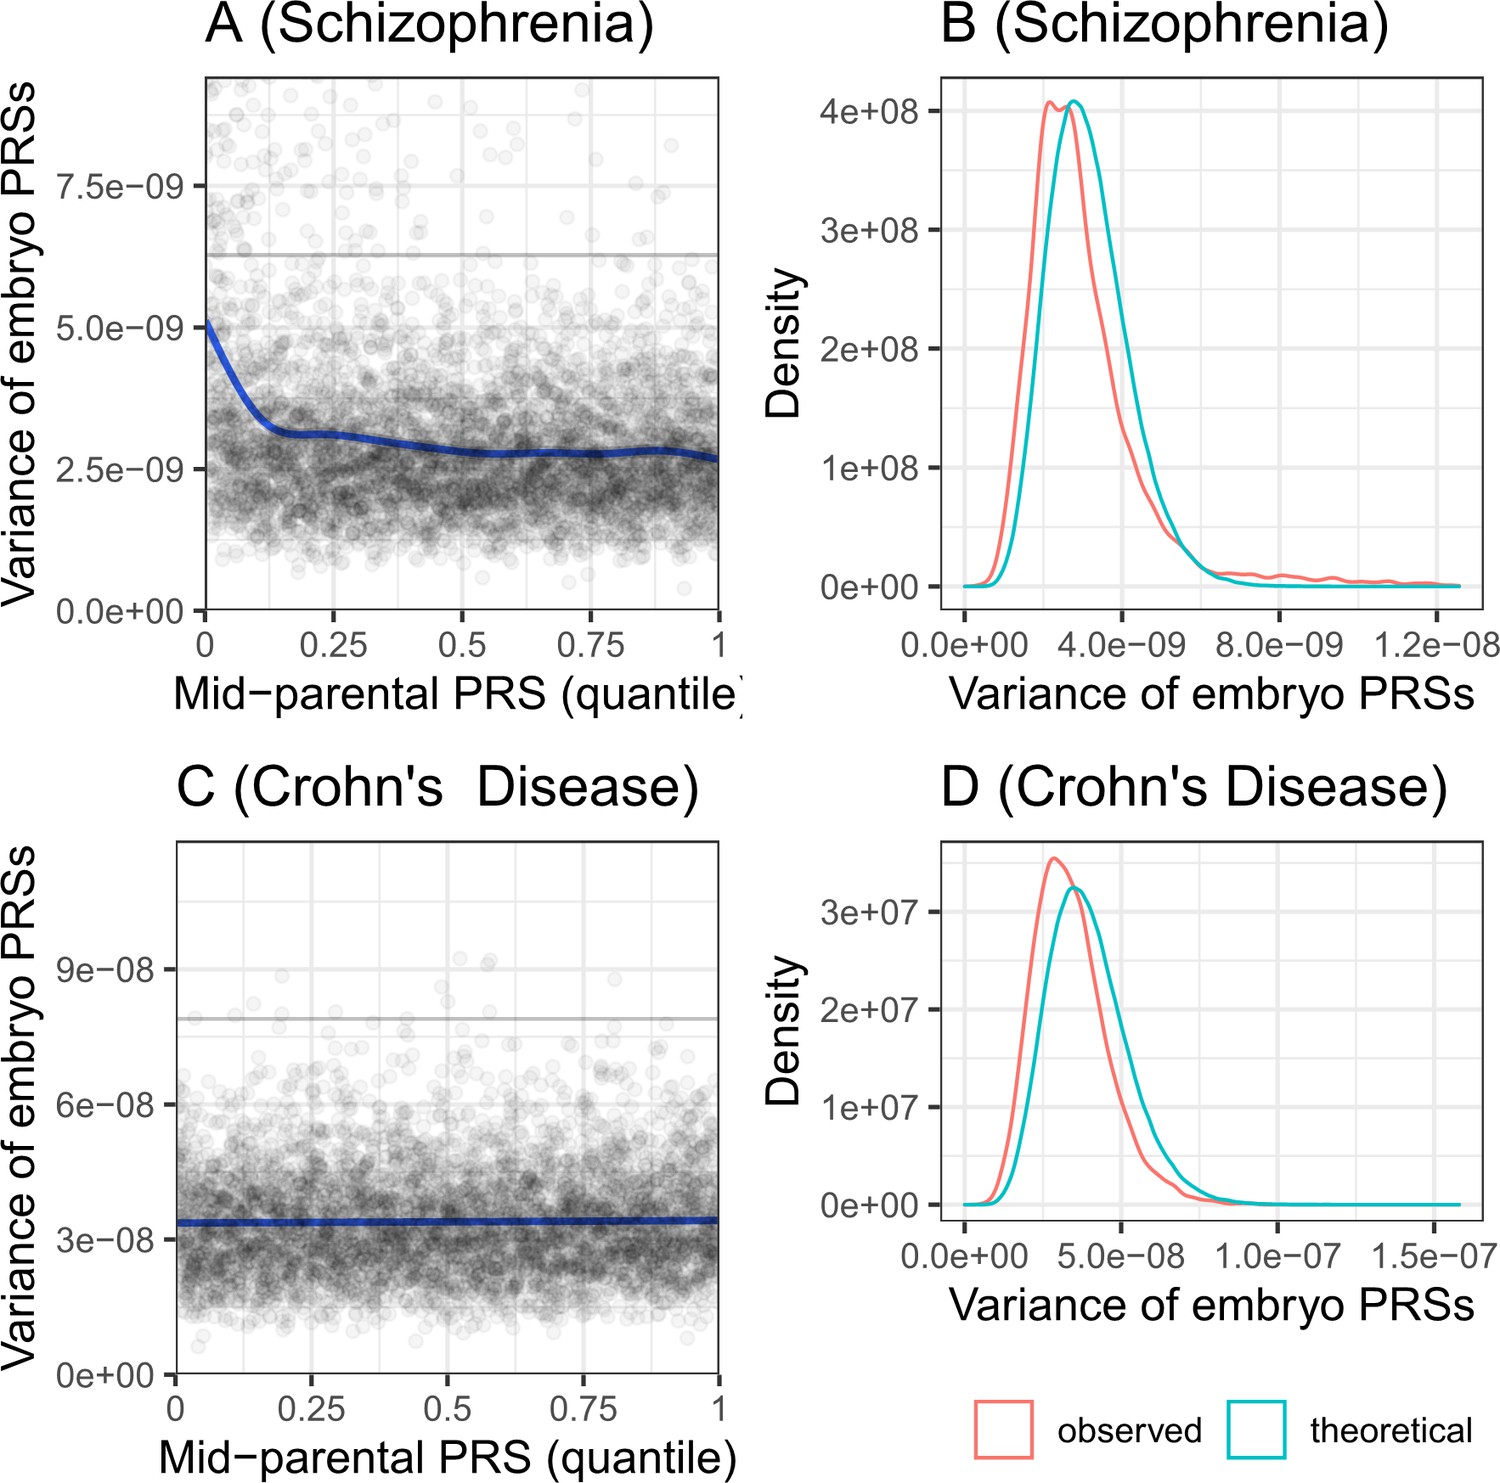
The variance of the PRS across simulated embryos.
Panels (A) and (B) are for schizophrenia, while panels (C) and (D) are for Crohn’s disease. Panels (A) and (C) show the variance of the PRS across the embryos of each simulated family, vs the quantile of the average parental PRS. The plots show results for 5000 simulated families for each disease. The solid line shows smoothing cubic splines, fitted using a generalized additive model. The horizontal gray lines in (A) and (C) show the variance of the PRS in the parental population. According to the theory, the variance should be independent of the average parental PRS. Indeed, the variance is constant across average parental PRSs for Crohn’s disease. However, the variance is slightly decreasing with the average parental PRSs for schizophrenia, although the deviation is prominent only at the lowest decile. Panels (B) and (D) show the distribution of the variances across the same simulated families. The theoretical distribution is with degrees of freedom, scaled by and multiplied by half the variance of the PRS in the 'parental' cohort. The empirical distribution (red) is very close in location and in shape to the expected distribution (cyan), although slightly shifted to lower variances.
Additional files
Download links
A two-part list of links to download the article, or parts of the article, in various formats.
Downloads (link to download the article as PDF)
Open citations (links to open the citations from this article in various online reference manager services)
Cite this article (links to download the citations from this article in formats compatible with various reference manager tools)
Utility of polygenic embryo screening for disease depends on the selection strategy
eLife 10:e64716.
https://doi.org/10.7554/eLife.64716


