Neuroanatomical abnormalities in a nonhuman primate model of congenital Zika virus infection
- California National Primate Research Center, UC Davis, United States
- Department of Psychology, UC Davis, United States
- Department of Pathology, Microbiology and Immunology, School of Veterinary Medicine, UC Davis, United States
- Department of Neurology, School of Medicine, UC Davis, United States
Figures
Figure 1
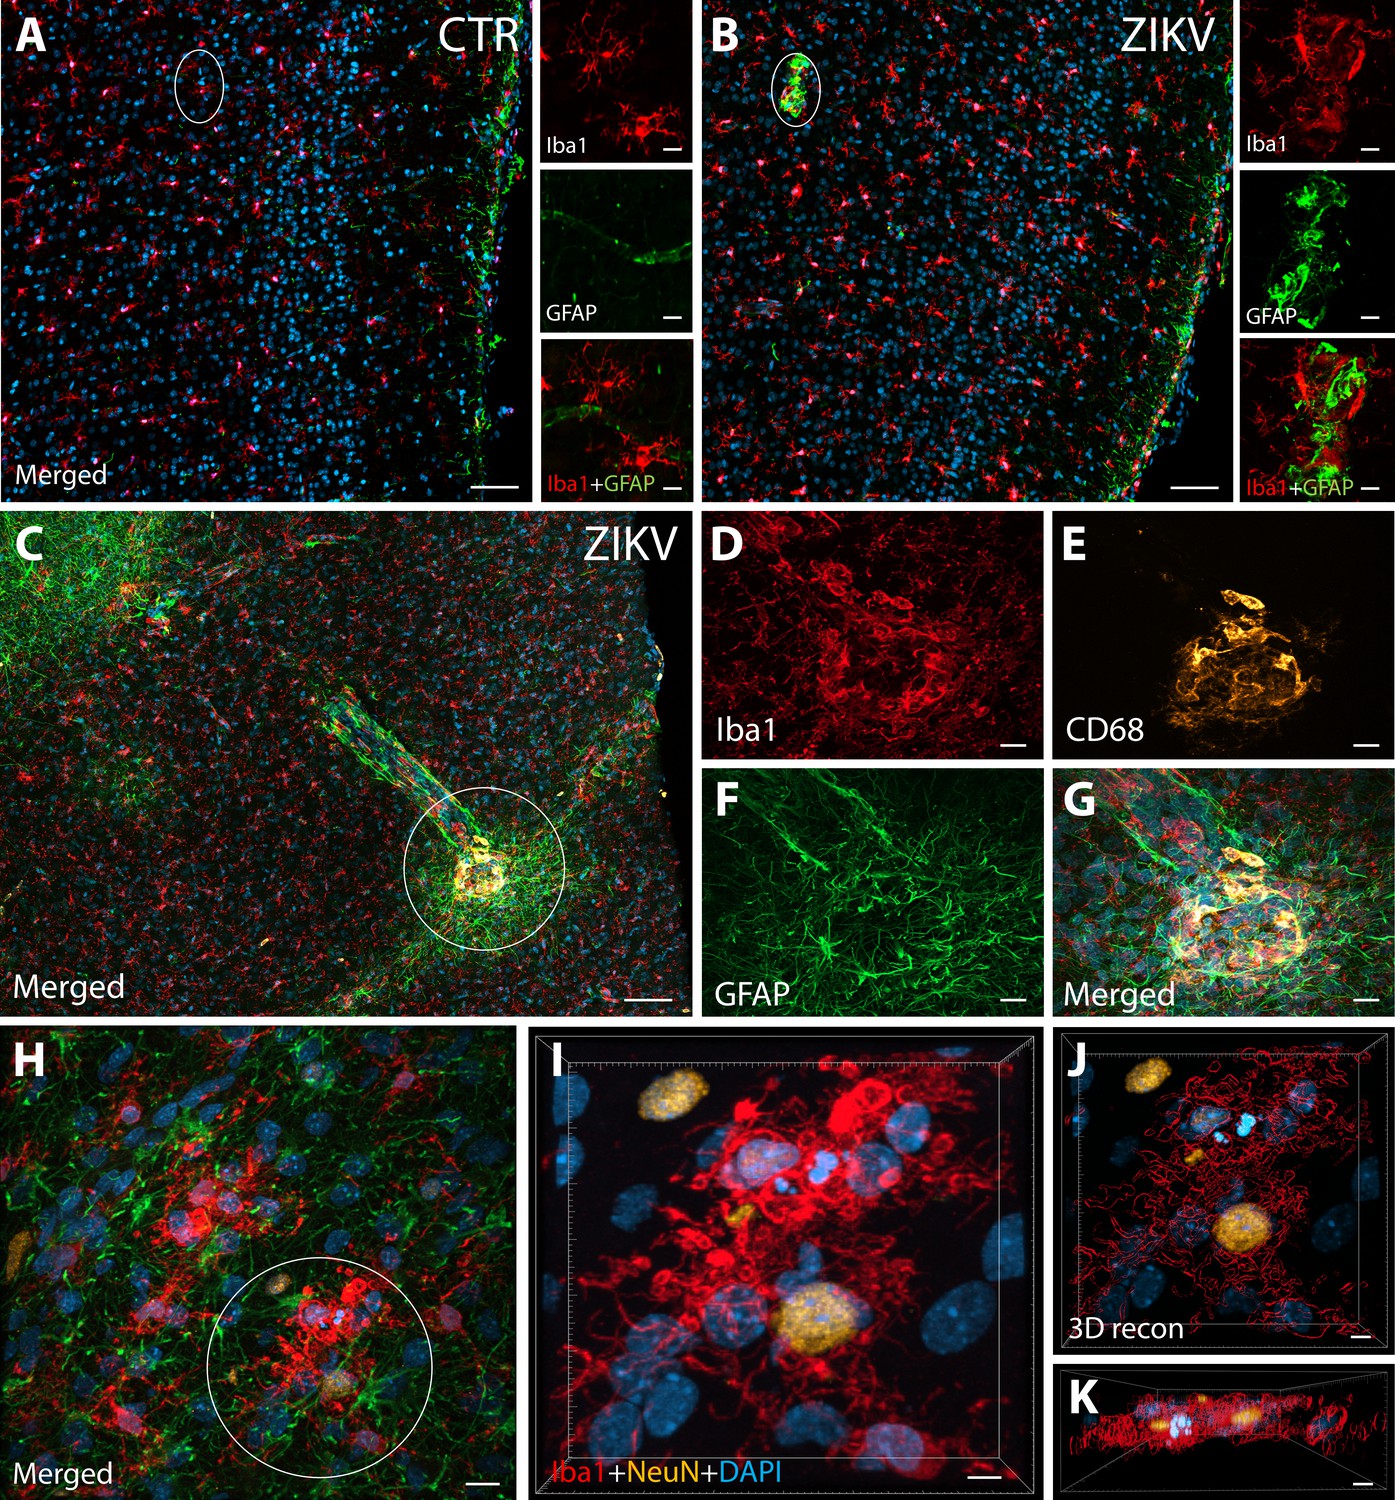
ZIKV infection induce neuroinflammatory response associated with activated microglia in immature prefrontal cortex.
Unlike control animals (A), the tissue of the ZIKV-infected animals (B) evidenced clusters of round-shaped microglia (Iba1, red) and astrocytes ( Glial fibrillary acidic protein (GFAP), green) within selective cortical areas. Scale bar: 50 µM, zoom: 10 µM. In the Area 46 of the ZIKV-infected animals, the microglia marker Iba1 (red), colocalized with lysosomal protein CD68 (orange), a marker for phagocytic activity normally observed in activated microglia (C–G). Scale bar: 100 µM, zoom: 5 µM. Activated microglia surrounding apoptotic neurons (NeuN, orange) are shown within Area 46 in ZIKV animals (H, highlighted in I). 3D analysis of the micrographs shows apoptotic material (fragmented 4′,6-diamidino-2-phenylindole (DAPI) and NeuN) inside activated microglia (J, K, scale bar: 5 µM).
Figure 2
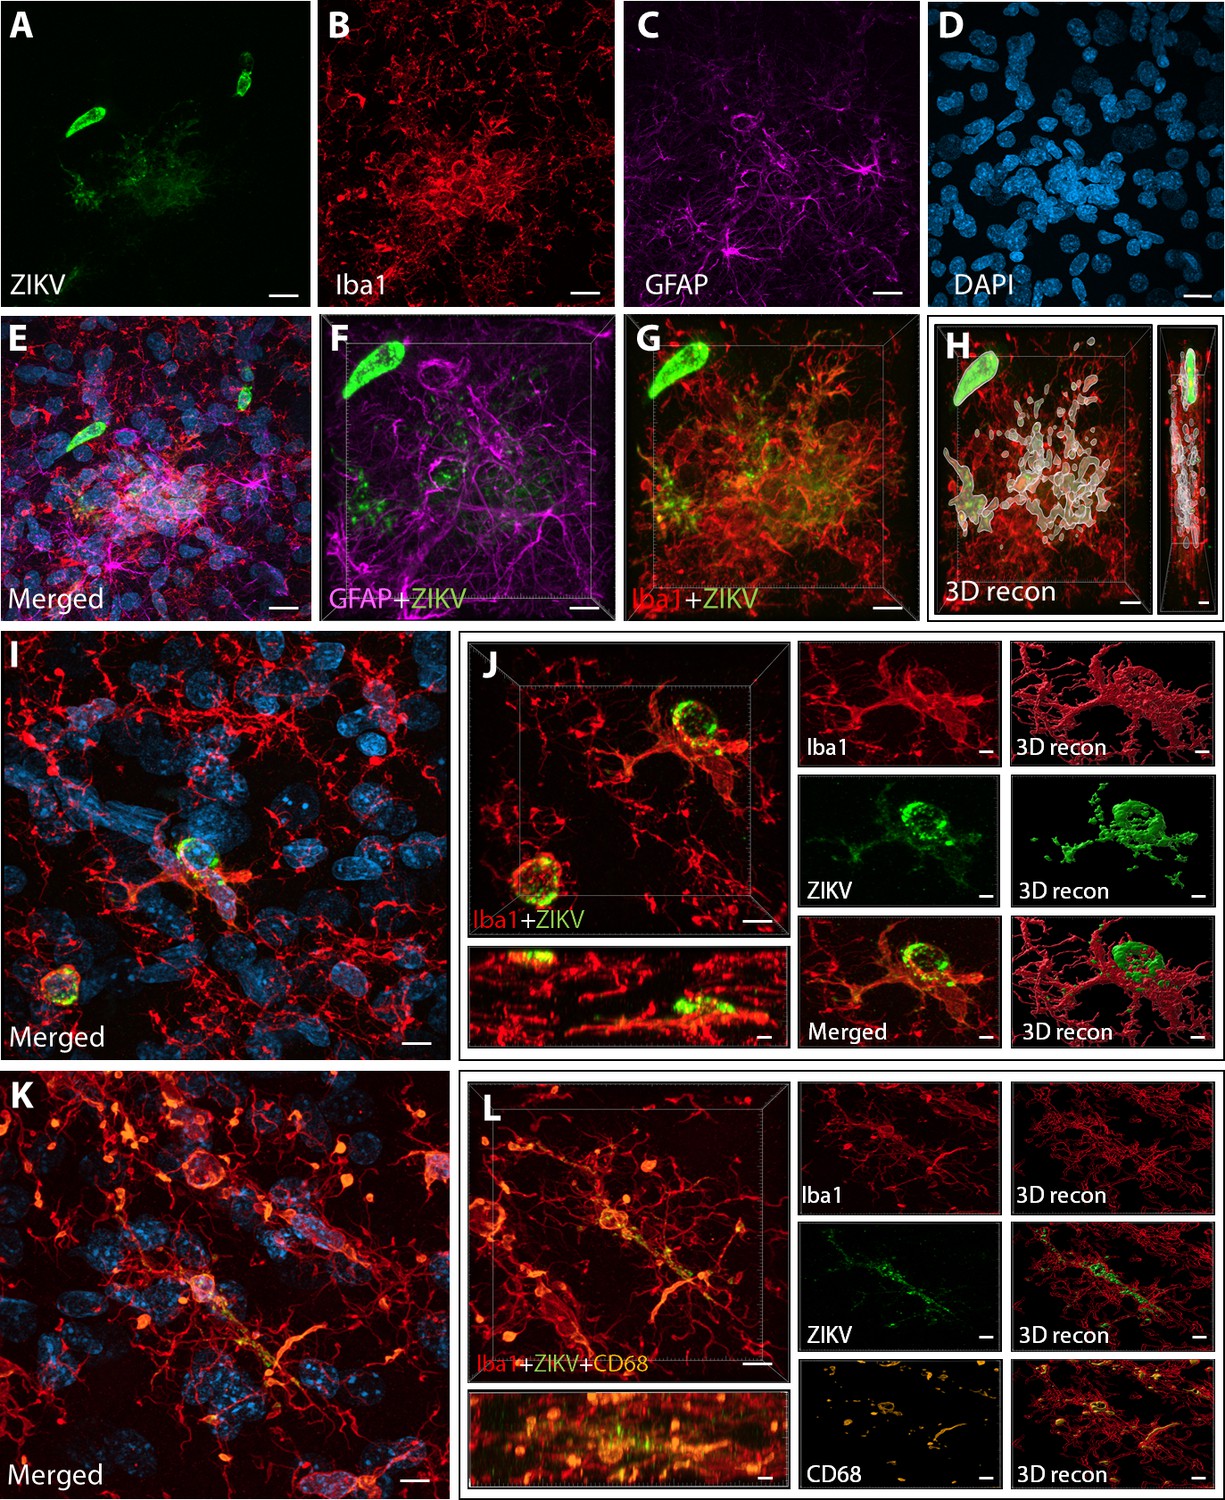
Intra-amniotic inoculation of ZIKV results in active brain infections of fetuses up to 105-day postinoculation.
ZIKV protein (antiflavivirus, green) (A) is identified within Area 46 of ZIKV inoculated animals. ZIKV+ cells are surrounded by activated microglia (Iba1, red) (B) and astrocytes (GFAP, purple) (C), with DAPI (D) staining all nuclei. Scale bar: 10 µM. 3D analysis and reconstruction of confocal micrographs obtained in Area 46, highlight the presence of viral protein within the microglia (E–H). Scale bar: 10 µM, 3D: 5 µM. ZIKV+ cells observed in the same brain region are surrounded and actively contacted by reactive microglia (I, J). Scale bar: 25 µM, zoom: 3 µM. Multiple labeling combining both microglia markers and viral protein shows the presence of viral protein inside phagocytic microglia in the prefrontal cortex (PFC) of the ZIKV-infected fetuses (K, L). Scale bar: 25 µM, zoom: 3 µM.
Figure 3
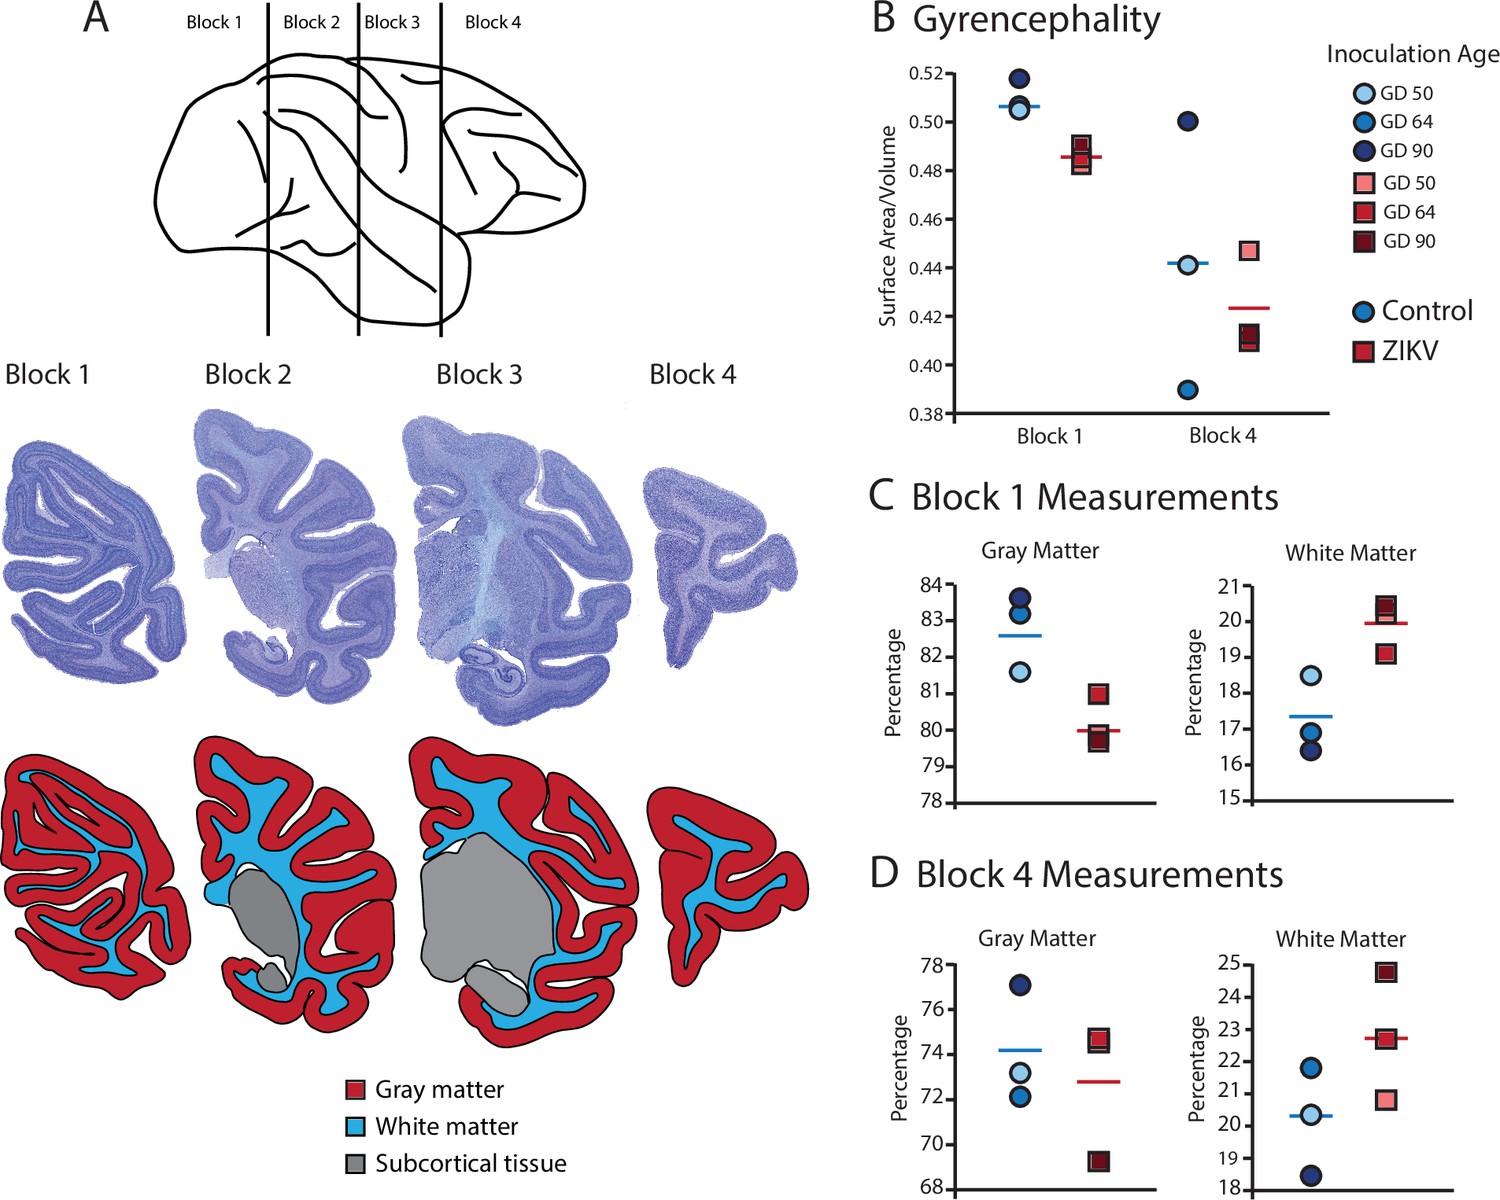
Fetal ZIKV infection results in variation in cortical development.
(A) Each fetal brain was divided into four blocks to ensure complete rapid fixation (top). Representative Nissl-stained sections from each block (middle), and the distributions of gray matter (red), white matter (blue), and subcortical tissue (gray) are shown for each section (bottom). For (B)–(D), data from control animals are depicted in blue circles and data from ZIKV-infected animals are depicted in red squares. Gestational day (GD) of infection is indicated with different intensities of blue and red. The mean value for each group is depicted with a horizontal line (blue for control, red for ZIKV). (B) The gyrencephality index of the occipital lobe (Block 1; left) and frontal lobe (Block 4; right) is shown for each individual subject. Areas 17 and 46 were analyzed from Blocks 1 and 4, respectively. (C) Proportion of gray matter (left) and white matter (right) in Block 1. (D) Proportion of gray matter (left) and white matter (right) in Block 4.
Figure 4
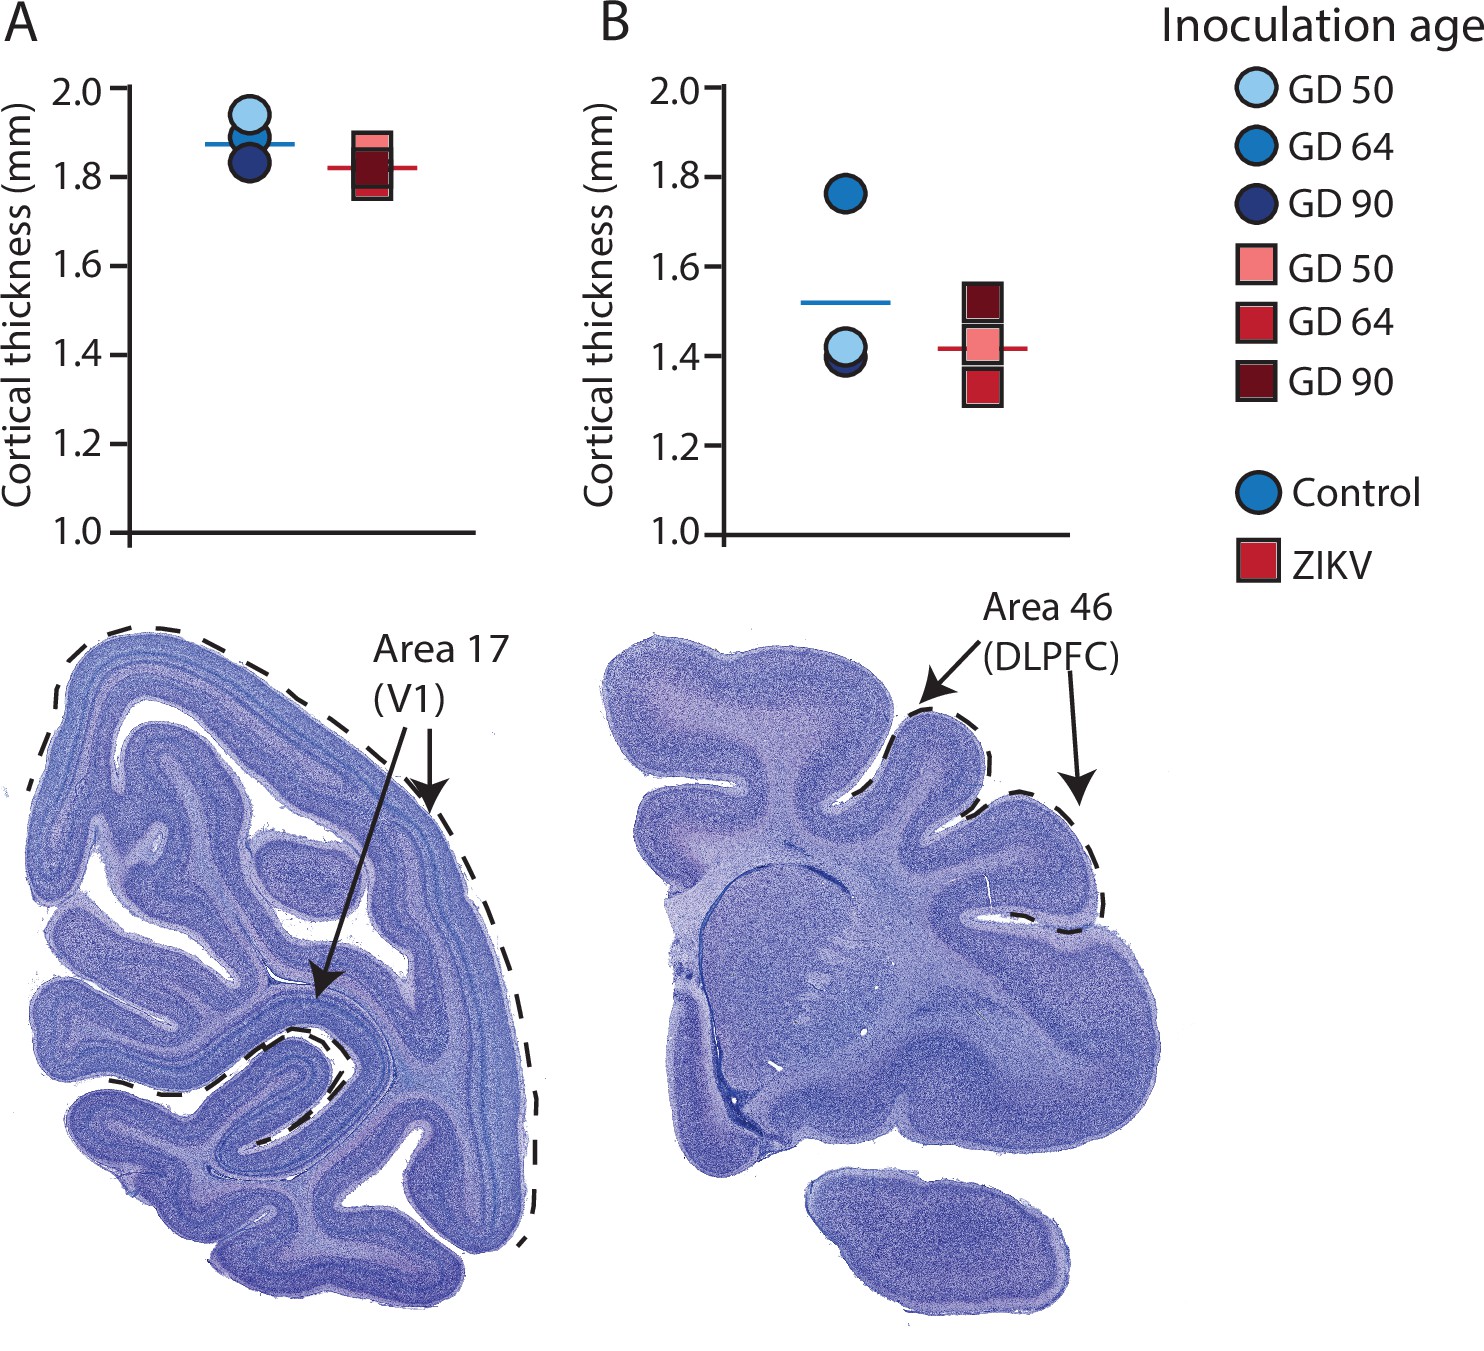
Cortical thickness does not differ across immature versus mature cortical regions of the brain in ZIKV-infected and noninfected animals.
The cortical thickness of a mature cortical region (Area 17, primary visual cortex, V1) (A) did not differ between the control (blue circles) and ZIKV-infected (red squares) animals. The anatomical localization of Area 17 is shown in a photomicrograph of a Nissl-stained section stained (dashed lines = the extent of Area 17). (B) Cortical thickness of Area 46 did not differ between the control (blue circles) and ZIKV-infected animals, although there was more individual variation than was seen in Area 17. The anatomical localization of Area 46 (dorsolateral prefrontal cortex, DLPFC) is shown in a photomicrograph of a Nissl-stained section (dashed line = the extent of Area 46). Conventions as in previous figures.
Figure 5
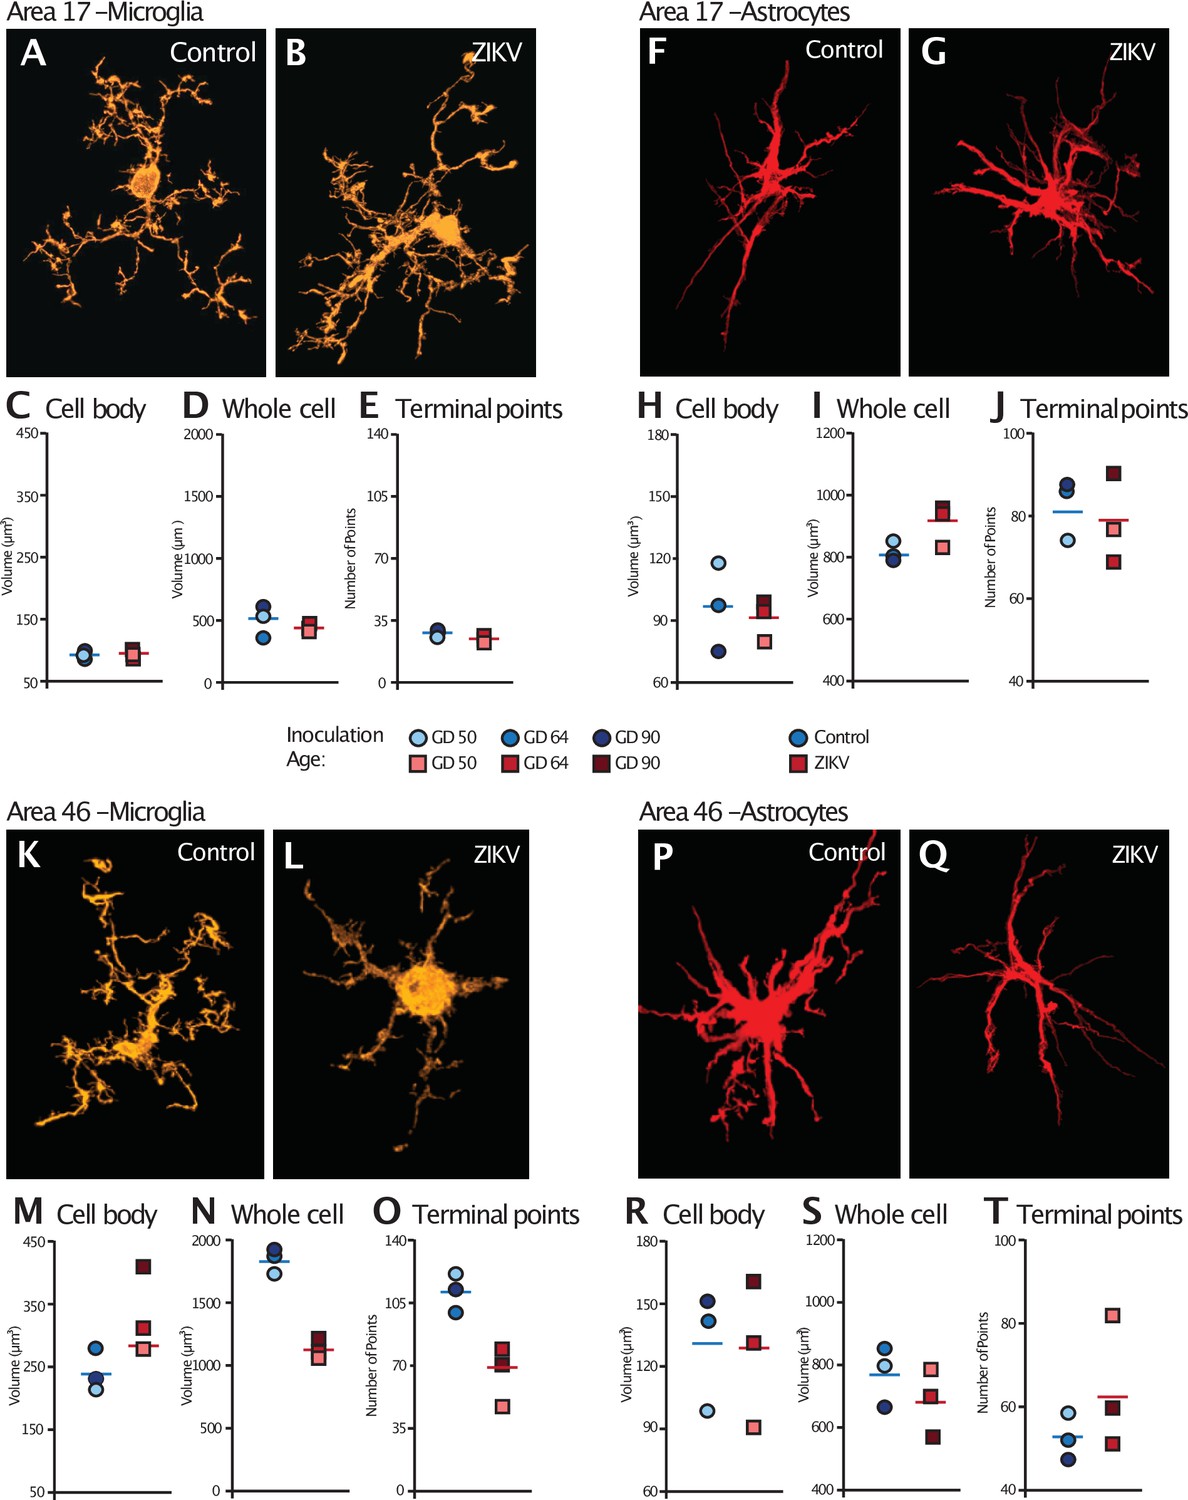
Glial cell morphological changes induced by ZIKV infection of the brain.
For each cell type (microglia and astrocytes), 28 cells were randomly selected from Area 17 and from Area 46 for each animal. 3D confocal images of each individual cell were exported to Imaris software and analyzed for cell body and whole cell volume, and total number of terminal points. Representative microglia from Area 17 in control and ZIKV-infected animals are depicted in (A) and (B). The average for each condition analyzed is represented for each animal in both groups. There were no group differences in cell body volume (C), whole cell volume (D), or number of terminal points (E), a measurement for glia complexity. Similarly, there were no group differences in astrocyte anatomy (F and G for representative anatomy, H–J for data). In contrast, there were group differences in Area 46 (representative images of Area 46 microglia, K and L; astrocytes, P and Q). The cell bodies of ZIKV-infected animals’ microglia were larger in size (M) than control animals. Compared to control animals’ microglia, ZIKV-infected animals’ microglia whole cell volumes were smaller (N) and had fewer of terminal points (O). Compared to controls animals’ astrocytes, ZIKV-infected animals astrocytes tended to have smaller cell body volumes (R), no differences in whole cell volumes (S), and a greater number of terminal points (T).
Figure 6 with 2 supplements

Increased death of immature neurons in Area 46 of ZIKV-infected animals.
Representative tissue samples from Area 17 (A–L) and Area 46 (M–Z) in control and ZIKV-infected animals. Immature neuronal marker SATB2 (A, G, M, S) colocalization with CC3 (B, H, N, T), an apoptotic marker, and DAPI (C, I, O, U) were analyzed in Areas 17 and 46 of control and ZIKV-infected animals. Merged images (D, J, P, V). 3D surface rendering reconstruction of SATB2 and CC3 are shown in E, K, Q, and X. Average total cell counting (F, R) and quantification of SATB2/CC3 colocalization (L, Z) indicated no group differences in the number of immature neurons undergoing apoptosis in Area 17 (L), but a significantly greater immature neurons undergoing apoptosis in ZIKV-infected compared to control animals in Area 46 (R). Scale bar = 25 µm.
Figure 6—figure supplement 1
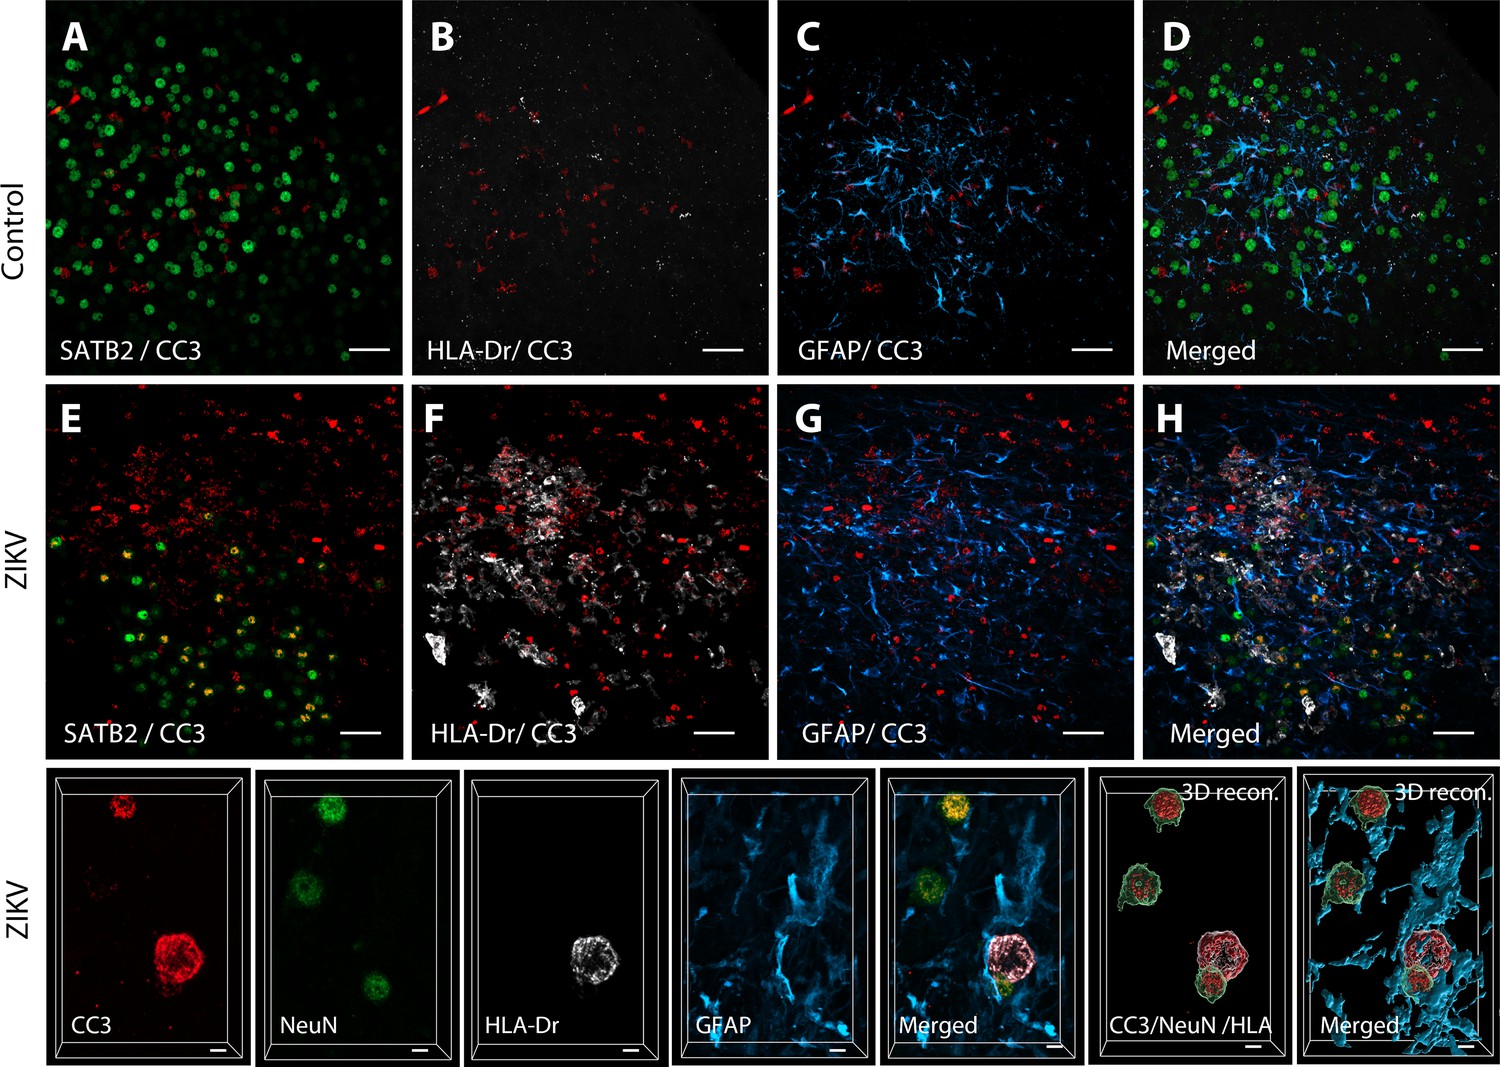
Active neuroinflammation is connected to increased apoptosis in the frontal lobe of ZIKV animals.
3D analysis of colocalization between CC3 and immature neuronal marker SATB2 in control (A) and ZIKV-infected animals. Staining with the activated microglia marker HLA-Dr (B, F) and astrocytic marker GFAP (C, G) evidenced increased inflammation and apoptosis in ZIKV-infected animals compared to controls. Merged images: D, H. High-resolution analysis in Area 46 (I) indicates that both activated microglia (HLA-Dr, gray) and neurons (NeuN, green) coexpress apoptosis marker CC3. Scale: 25 µm (A–H) and 5 µm (I).
Figure 6—figure supplement 2
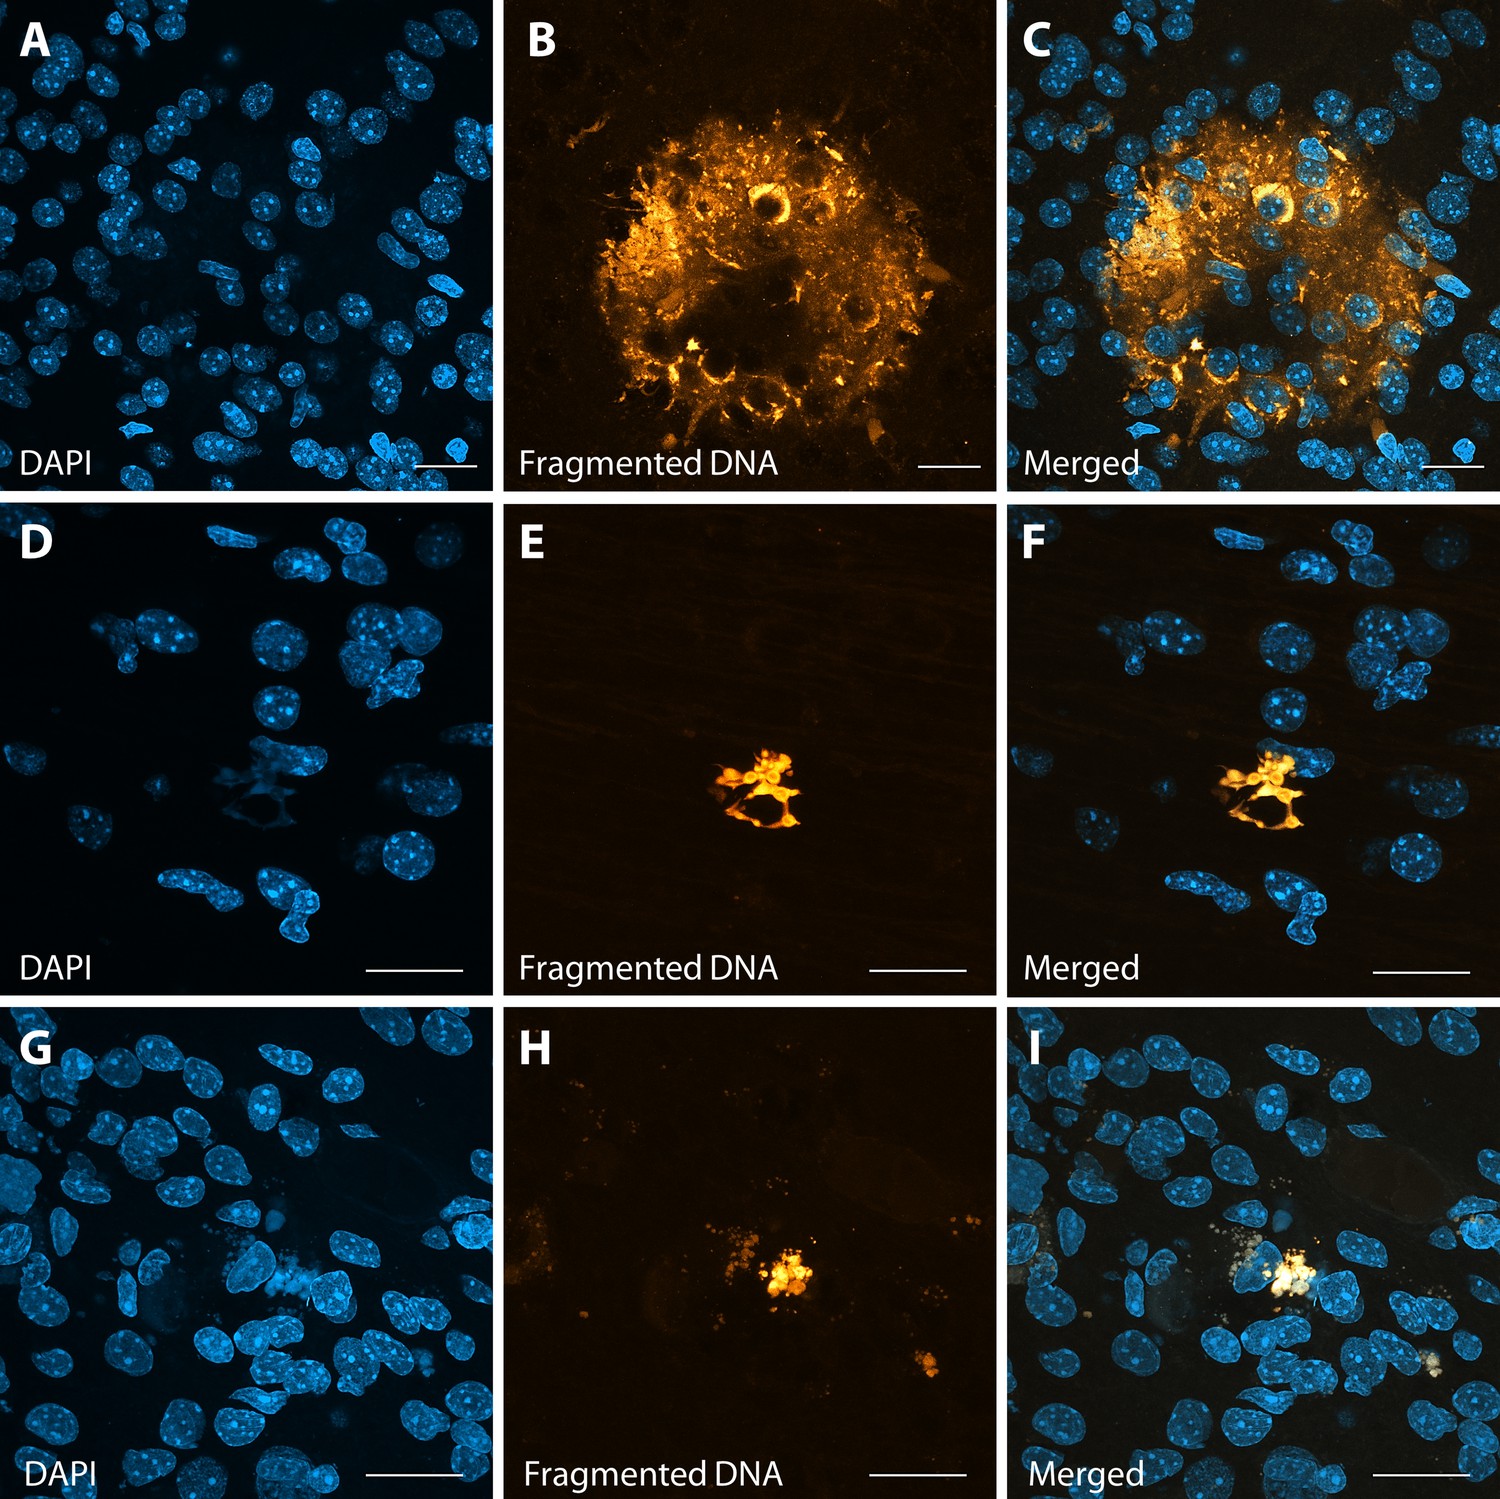
Abnormal apoptotic clusters in Area 46 of ZIKV-infected animals.
A TUNEL assay was performed in tissue slices, with fragmented DNA being detected by fluorescent dye incorporation. Representative images in Area 46 (panels A–C and D–F) and in Area 17 (panels G–I) highlight the presence of abnormal clusters of fragmented DNA in ZIKV-infected animals. Scale: 25 µm (A–C) and 40 µm (D–I).
Figure 7
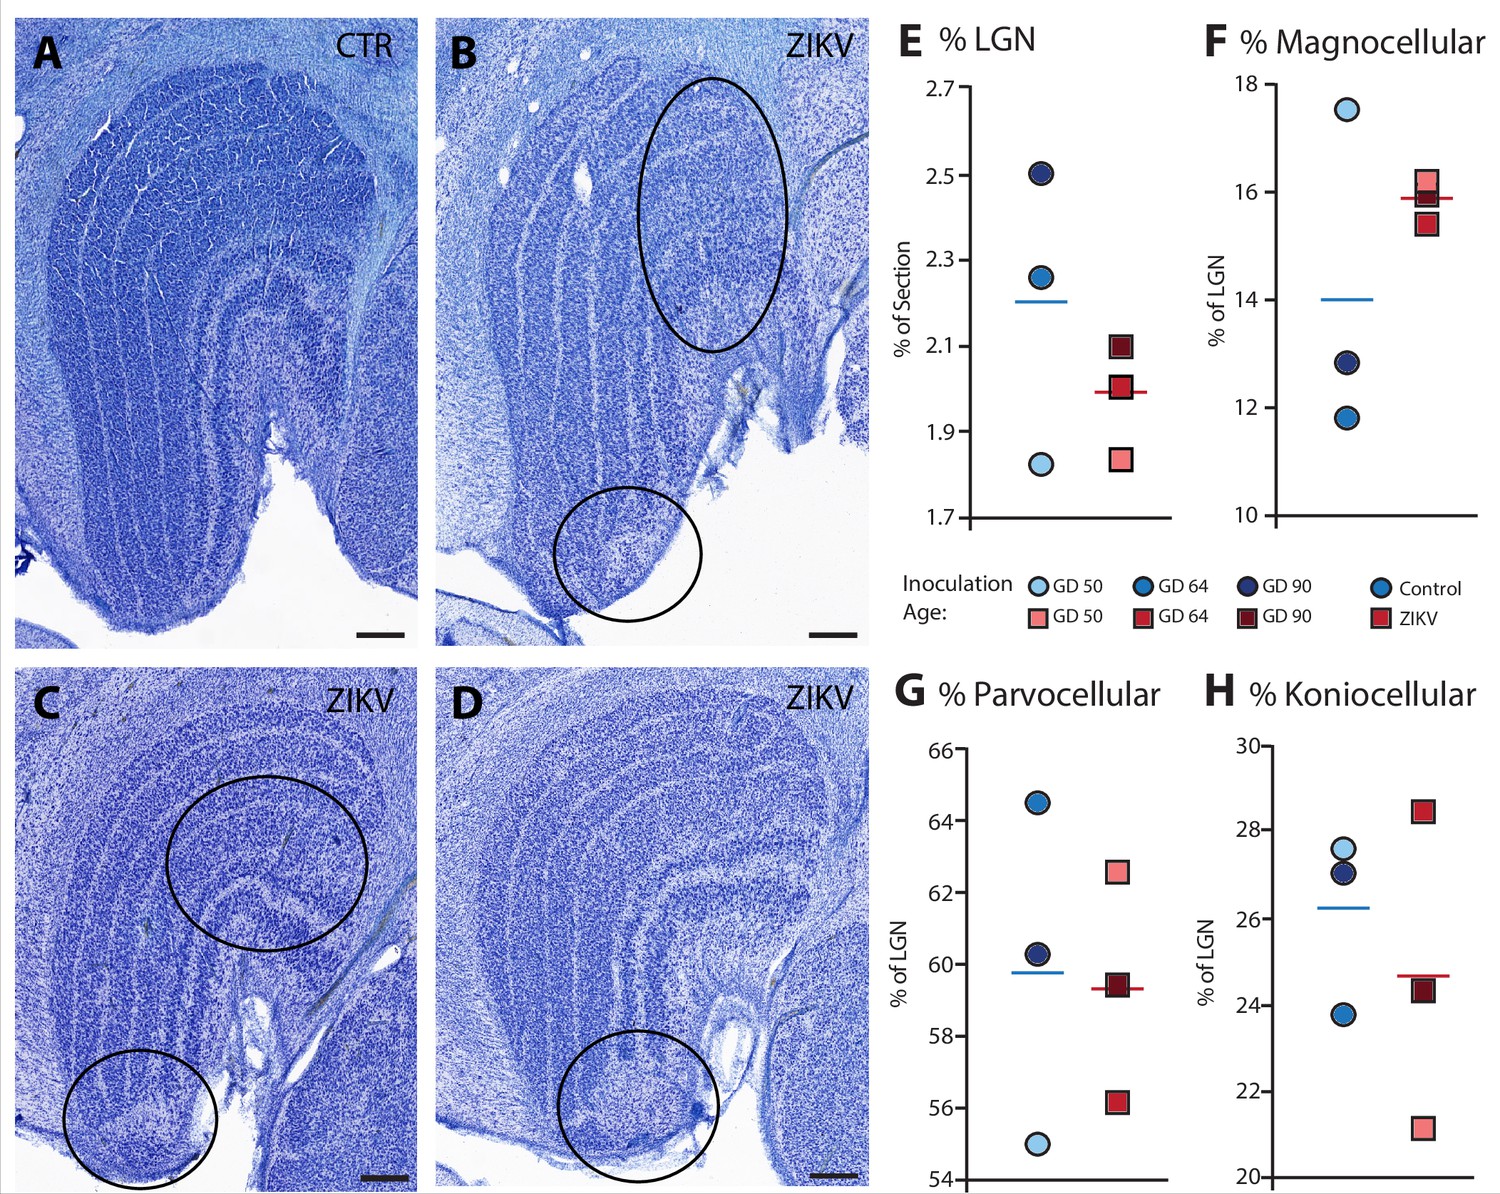
Anatomical abnormalities within the lateral geniculate nucleus (LGN) of ZIKV-infected subjects.
(A) An example of normal caudal LGN from the control animal who was sham inoculated at GD 90. Images (B–D) illustrate LGN abnormalities from each of the three subjects infected with ZIKV. Black ovals indicate areas of anatomical abnormalities within each section. (B) Two instances of anatomical abnormalities within the animal infected with ZIKV at GD 50. The top oval highlights an area of undifferentiated lamination, where layers 1 and 2, and 3 appear to blend together. The bottom oval highlights an area where the normal laminar structure is interrupted by a region of low cell density. (C) Two instances of anatomical abnormalities within the animal infected with ZIKV at GD 64. The top oval highlights an area of undifferentiated lamination, where layers 2 and 3 appear to blend together. The bottom oval highlights an area where the normal laminar structure is interrupted by a region of low cell density. (D) An instance of laminar interruption of layers 1, 2, and 3 by a region of low cell density in the third ZIKV-infected animal (infected at GD 90). (E) The proportion of the histological section occupied by the LGN did not significantly differ between control animals and the ZIKV-infected animals, t4 = 1.00, p = 0.37, d = 0.81. There were no group differences in the proportion the (F) magnocellular (t2.08 = 1.02, p = 0.36, d = 0.84), (G) parvocellular (t4 = 0.14, p = 0.90, d = 0.11), and (H) koniocellular layers (t4 = 0.57, p = 0.60, d = 0.47). Scale = 250 µm.
Figure 8
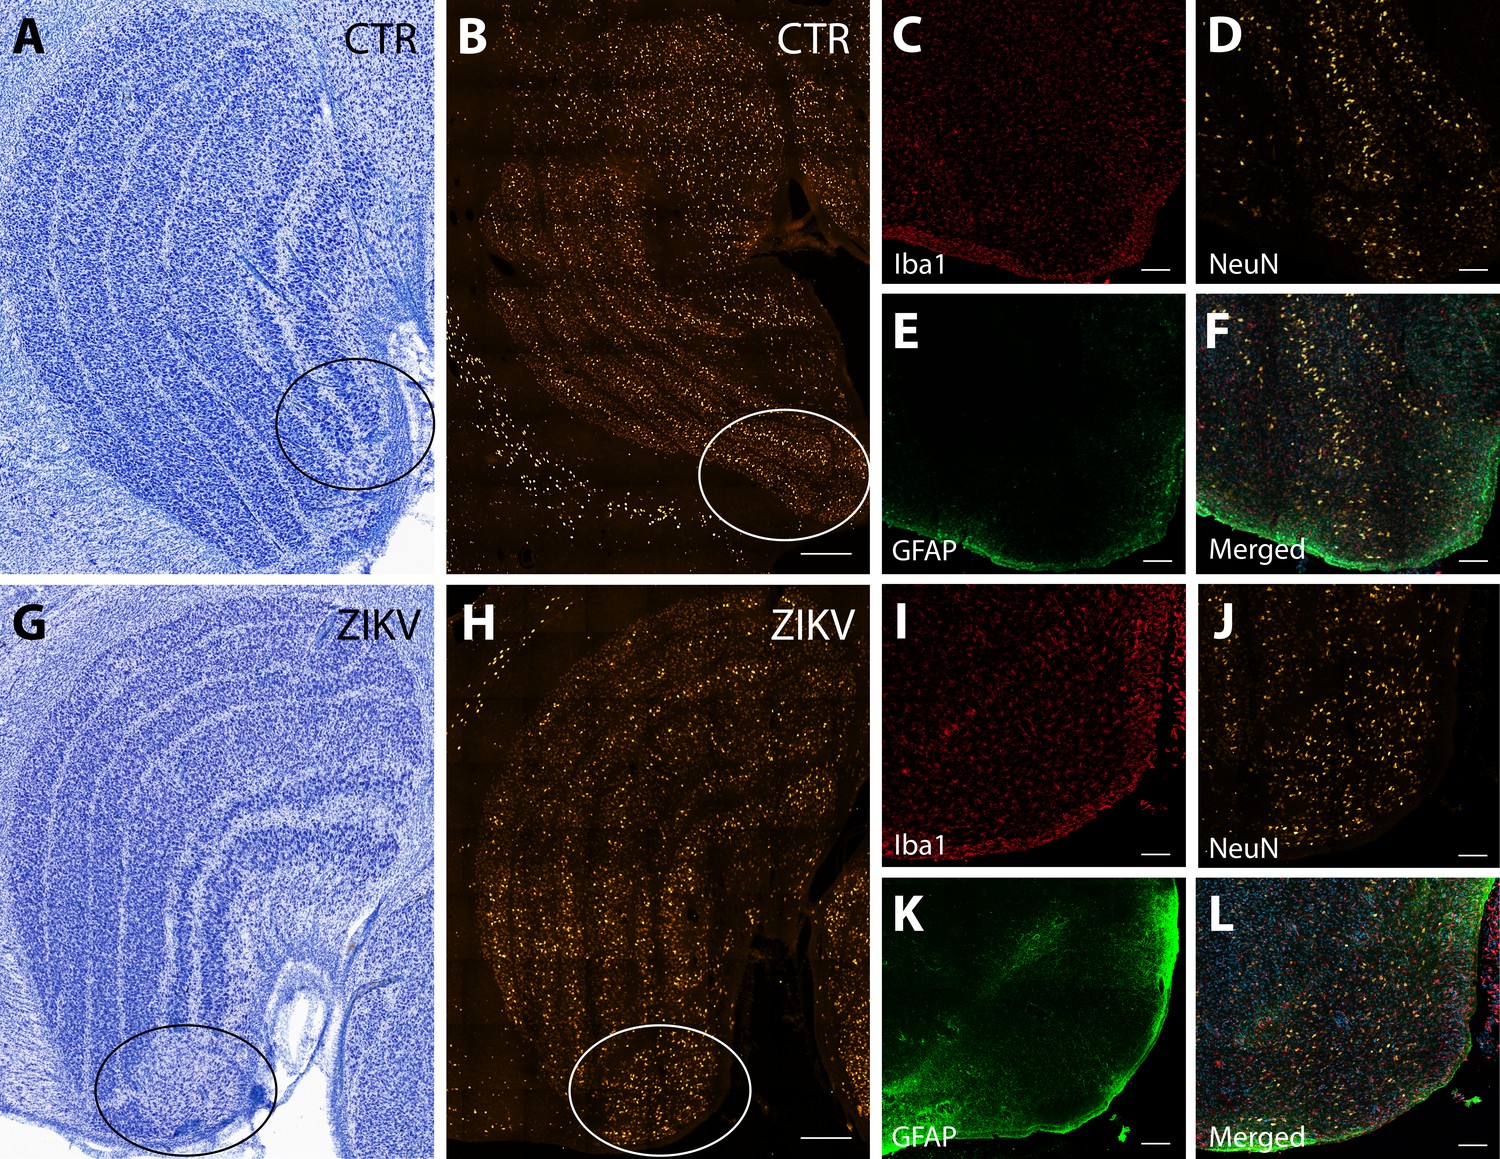
Neuroinflammatory abnormalities in the lateral geniculate nucleus (LGN) of ZIKV-infected animals.
The LGNs of control animals were all normal (A–F), but structural abnormalities were detected in the LGNs of all three ZIKV-infected fetuses in the Nissl-stained sections (an example depicted in G–L). A tissue section adjacent to each Nissl stained was analyzed using confocal microscopy. Neuronal layers and glia were analyzed using NeuN (B, H), Iba1 (C, D; red), and GFAP (E, K; green). Zoomed NeuN images in the same area are in D and J. Merged images are found in F and L. Scale = 250 µm in G–K, scale = 25 µm in B–F and L–P, scale = 10 µm in Q–U.
Figure 9 with 1 supplement
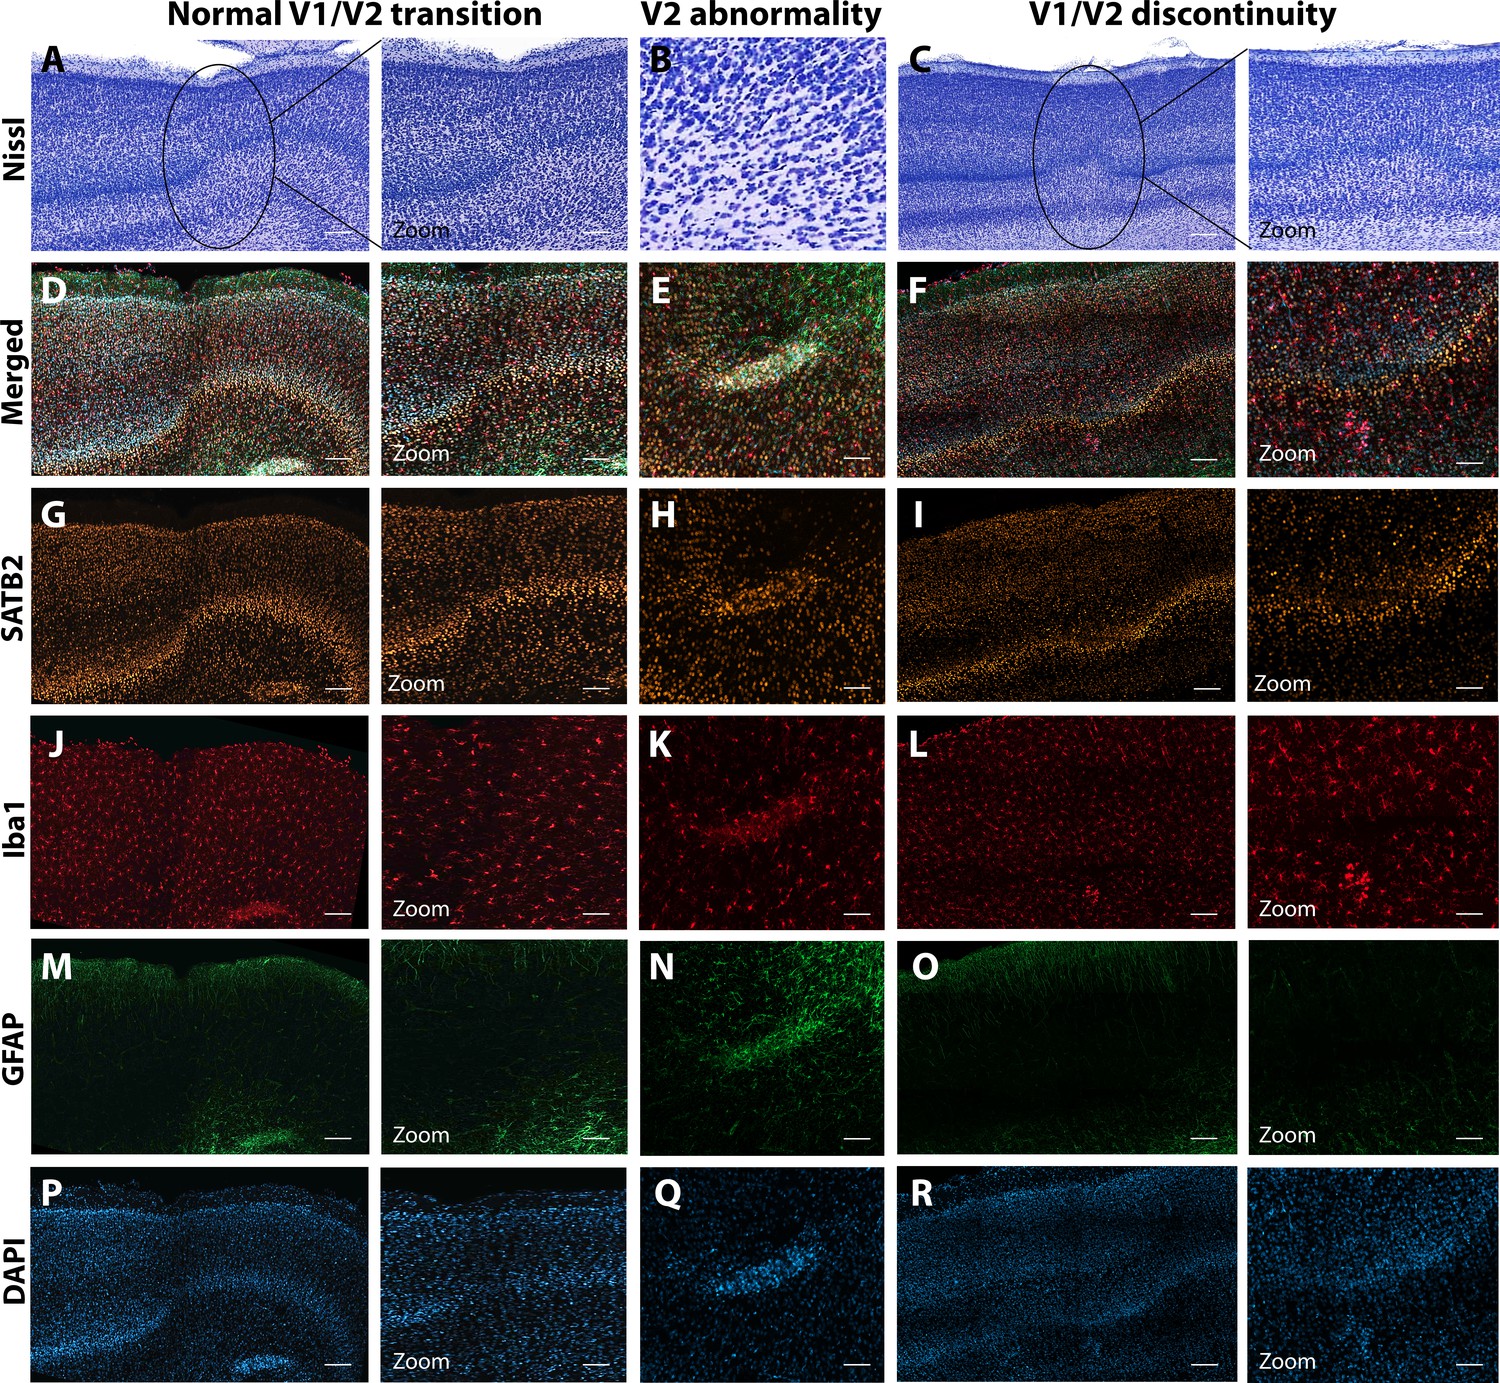
Anatomical abnormalities within the primary and secondary visual cortex of a ZIKV-infected animals.
Compared to normal transitions between primary (V1) and secondary (V2) visual cortex (A), cellular abnormalities in the transition were detected in ZIKV-infected monkeys (B, C) on the Nissl-stained sections. A deeper investigation using quadruple fluorescent staining (merged images in D–F) was performed in adjacent sections for SATB2 (G–I), Iba1 (J–L), and GFAP (M– O). A normal transition between V1 and V2 is characterized by the uniform contraction of layer 4 and the absence of laminar discontinuity (A, C, E, G, I, K). We identified a region of laminar discontinuity within the boundaries of V1 (B) that appears to be the caused by a disruption to layer 4a that resulted in the displacement of layers 4b and 4c toward the pial surface (seen in M–R). An additional abnormality was found below layer six in area V2 (seen in A–K and magnified in B–L). Disrupted neuronal layers present are surrounded by robust presence of activated microglia and astrocytes, as highlighted in the zoom area N–R. Scale = 250 µm in A–L, scale = 25 µm in M–R.
Figure 9—figure supplement 1
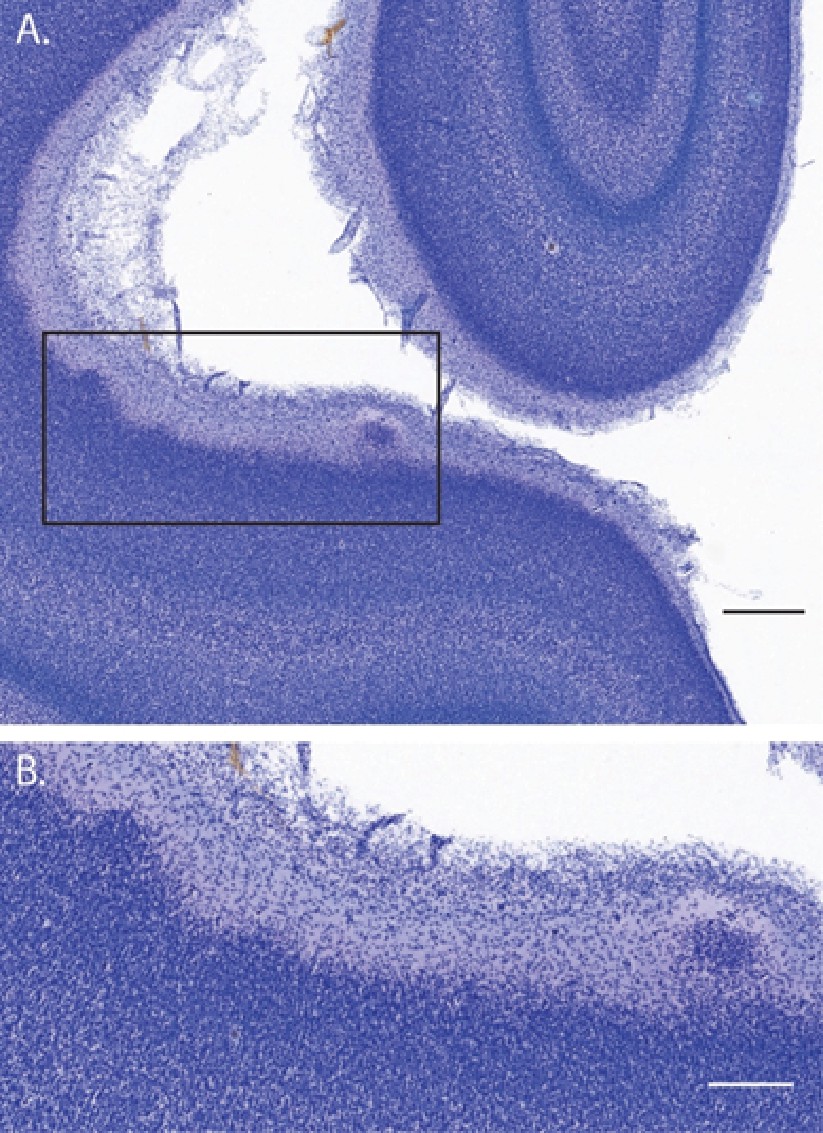
Suprapial cortical heterotopias observed only in ZIKV-infected animals.
In addition to the lamination issues that were documented in visual cortex (and described in the main text), there were a number of instances of suprapial cortical heterotopias in ZIKV-infected, but not control animals, visual cortices. (A) A low-magnification photomicrograph of two suprapial cortical heterotopias identified in the cortex of the fetus who was infected with ZIKV at gestational day (GD) 90. The black rectangle indicates the region shown in the higher magnification image in (B). Scale = 500 µm in A, 250 µm in B.
Additional files
Download links
A two-part list of links to download the article, or parts of the article, in various formats.
Downloads (link to download the article as PDF)
Open citations (links to open the citations from this article in various online reference manager services)
Cite this article (links to download the citations from this article in formats compatible with various reference manager tools)
Neuroanatomical abnormalities in a nonhuman primate model of congenital Zika virus infection
eLife 11:e64734.
https://doi.org/10.7554/eLife.64734


