An in vivo reporter for tracking lipid droplet dynamics in transparent zebrafish
- Cancer Biology and Genetics Program, Memorial Sloan Kettering Cancer Center, United States
- Weill Cornell/Rockefeller/Sloan Kettering Tri-Institutional MD-PhD Program, United States
- Gerstner Sloan Kettering Graduate School of Biomedical Sciences, Memorial Sloan Kettering Cancer Center, United States
- Developmental Biology Program, Memorial Sloan Kettering Cancer Center, United States
Figures
Figure 1
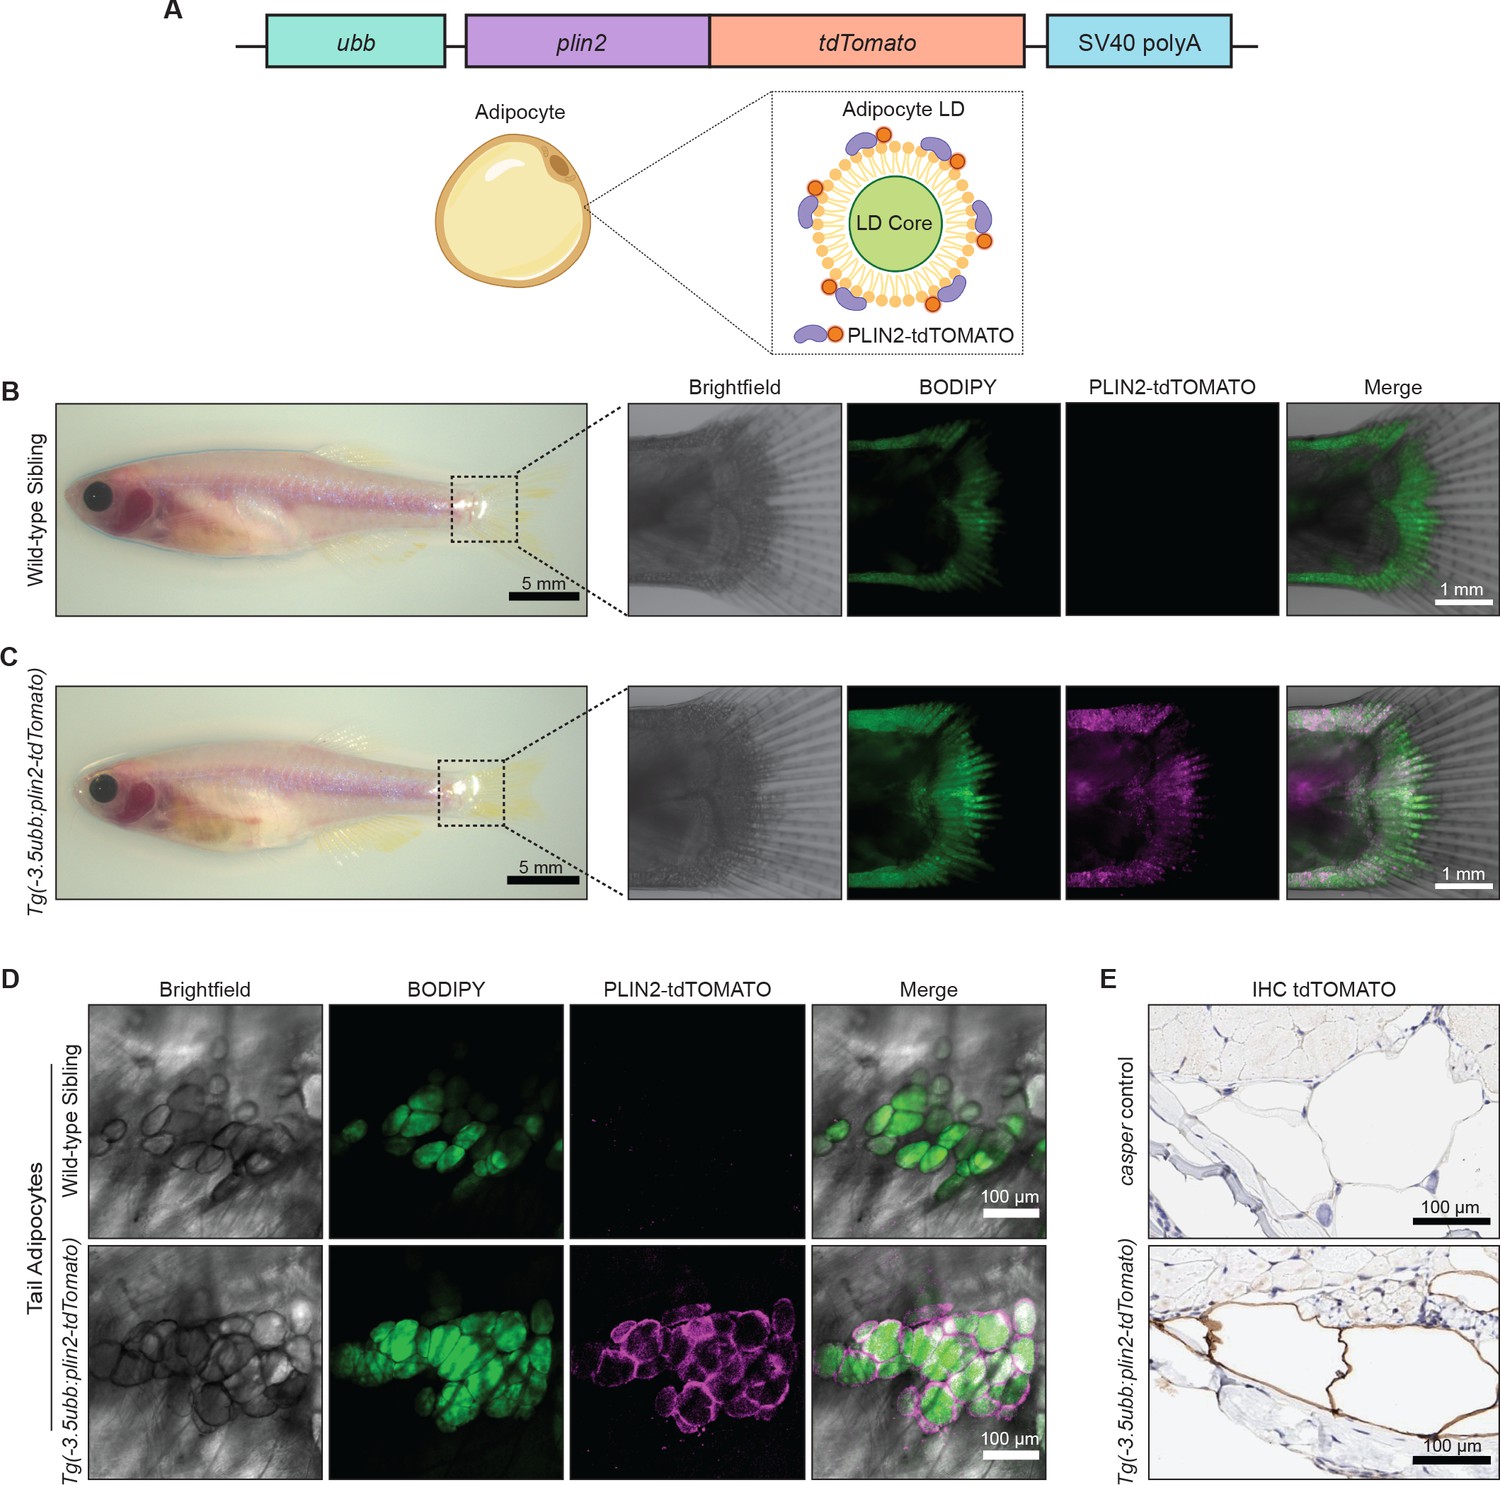
An in vivo lipid droplet reporter using a PLIN2-tdTOMATO fusion transgene.
(A) Schematic of ubb:plin2-tdTomato construct injected into zebrafish and an adipocyte lipid droplet labeled with PLIN2-tdTOMATO fusion protein. Widefield microscope images of adult (B) wild-type sibling and (C) Tg(-3.5ubb:plin2-tdTomato) zebrafish. Box shows zoomed images of the fish tail with panels for brightfield, BODIPY, PLIN2-tdTOMATO, and merge. (D) Confocal images of fish tail adipocytes of adult wild-type sibling and Tg(-3.5ubb:plin2-tdTomato) zebrafish. Panels show brightfield, BODIPY, PLIN2-tdTOMATO, and merge. (E) Adult casper and Tg(-3.5ubb:plin2-tdTomato) zebrafish tails were fixed and immunohistochemistry was conducted for tdTOMATO expression of tail adipocytes.
Figure 2 with 1 supplement
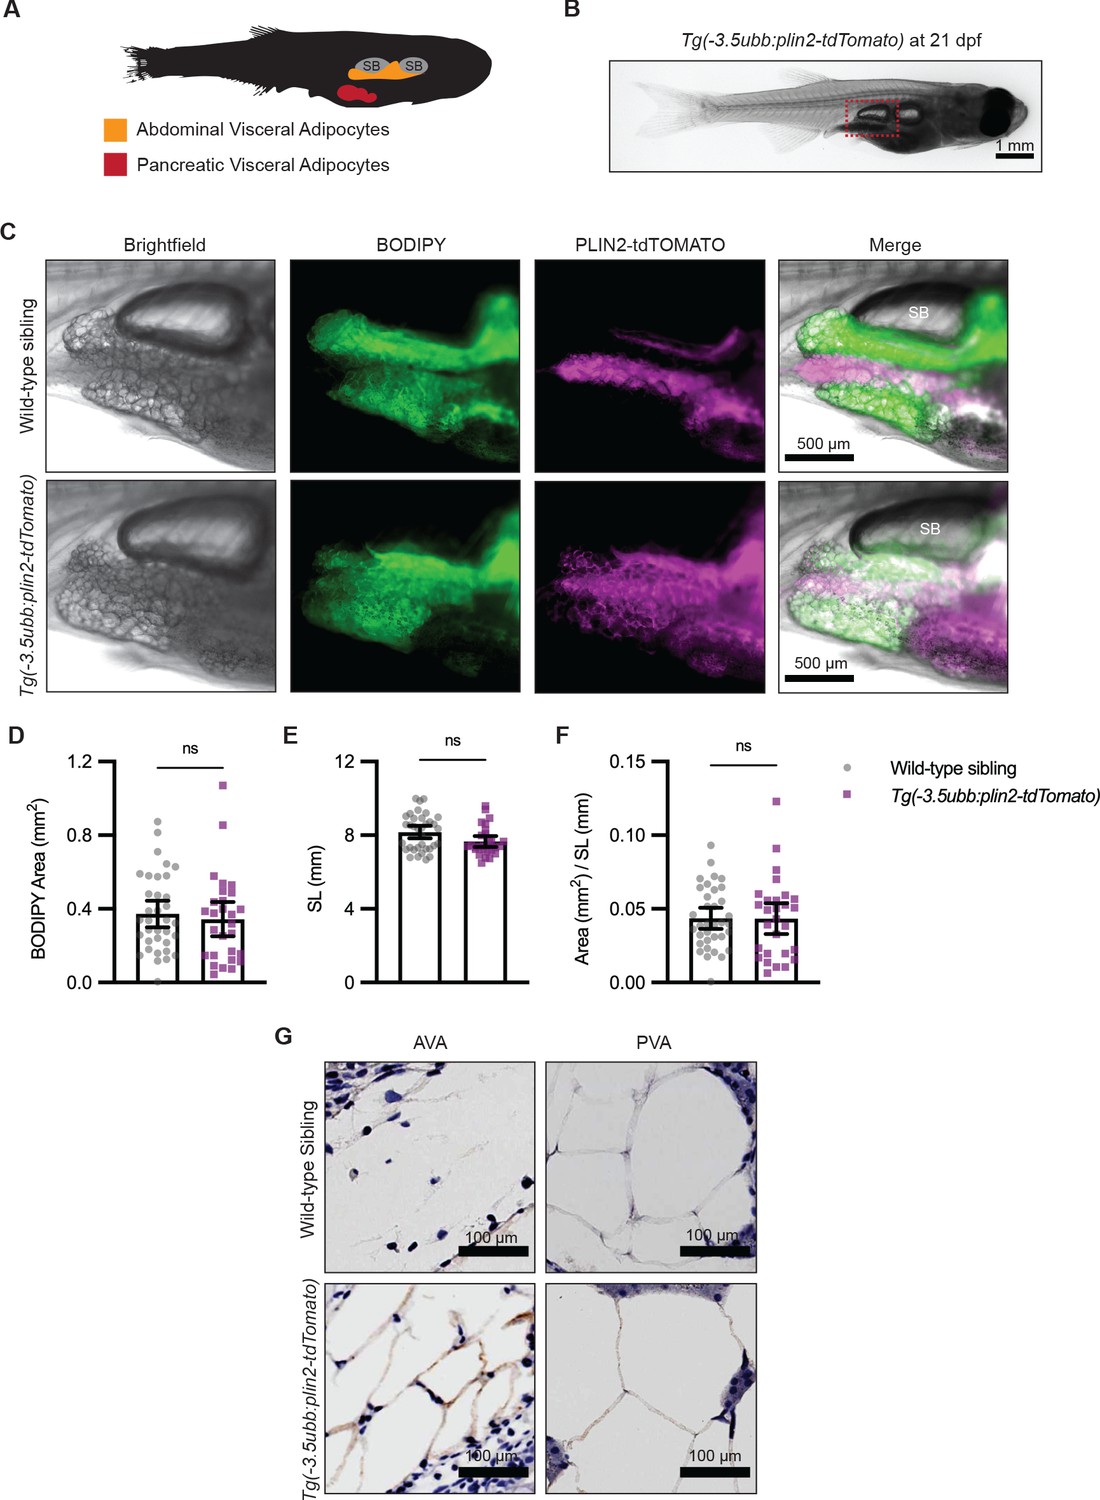
Tg(-3.5ubb:plin2-tdTomato) is an in vivo reporter for visceral adipocytes.
(A) Schematic of visceral adipose tissue development in the 21 days post-fertilization (dpf) zebrafish. Abdominal visceral adipocytes (orange) develop around the swim bladder (gray) and pancreatic visceral adipocytes (red) develop ventrally around the pancreas. (B) Brightfield image of Tg(-3.5ubb:plin2-tdTomato) at 21 dpf. Red box indicates position of higher magnification images to visualize abdominal visceral adipocytes. (C) Widefield microscope images of 21 dpf wild-type casper and Tg(-3.5ubb:plin2-tdTomato) visceral adipocytes around the posterior swim bladder (SB) costained with BODIPY. Panels show brightfield, BODIPY, tdTOMATO, and merge. BODIPY stained adipose tissue was imaged and analyzed for (D) area, (E) standard length, and (F) area/standard length. Points indicate individual fish for N = 3 independent experiments; wild-type sibling, Data values for (D-F). n=35; Tg(-3.5ubb:plin2-tdTomato), n = 28. Bars indicate mean and SEM. Significance calculated via Mann-Whitney test. (G) 21 dpf wild-typecasperandTg(-3.5ubb:plin2-tdTomato)zebrafish were fixed and immunohistochemistry conducted for tdTOMATO expression of abdominal (AVA) and pancreatic visceral adipocytes (PVA).
-
Figure 2—source data 1
Data values for Figure 2D-F.
- https://cdn.elifesciences.org/articles/64744/elife-64744-fig2-data1-v1.xlsx
Figure 2—figure supplement 1
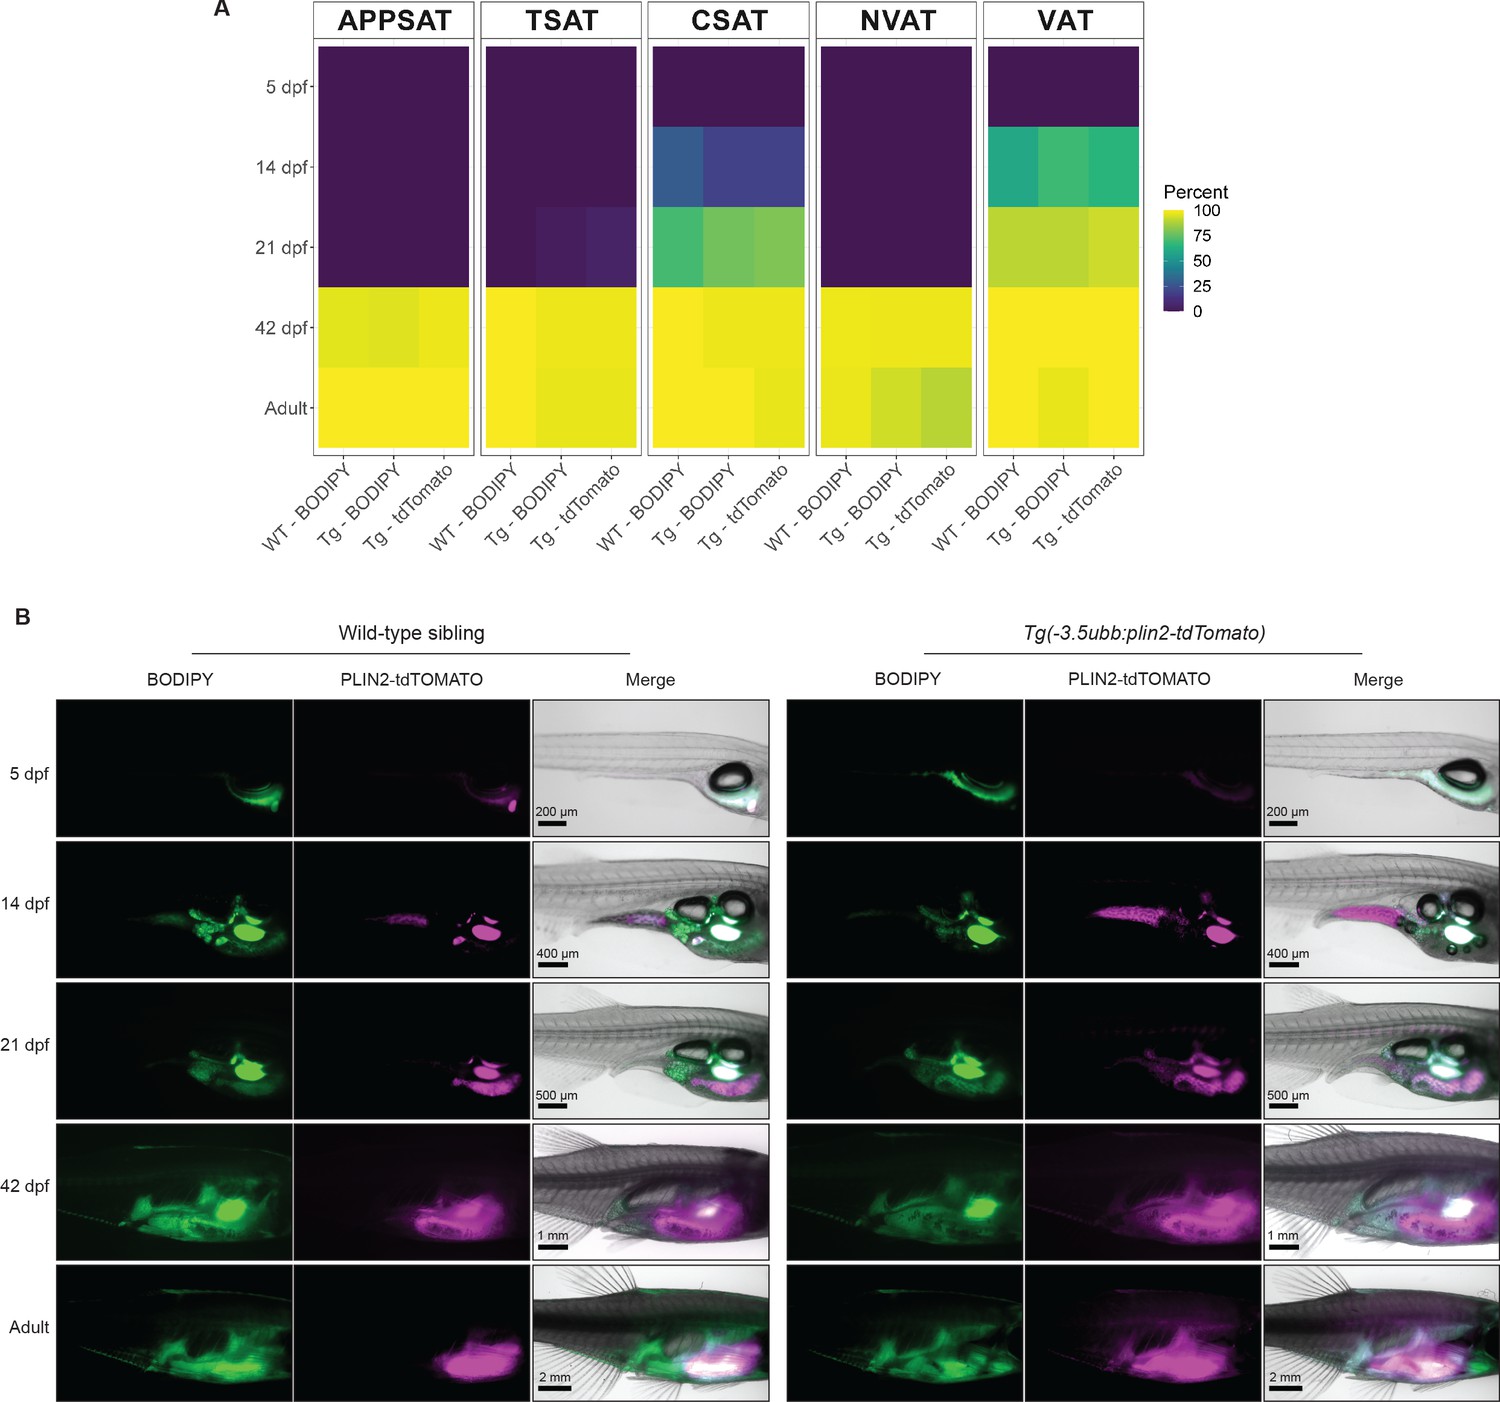
Adipose tissue development in wild-type and Tg(-3.5ubb-plin2-tdTomato) zebrafish.
(A) Heatmap of adipose depot presence during zebrafish development in Tg(-3.5ubb:plin2-tdTomato) and wild-type siblings. Shown is the percent of fish scored for presence of the depot using either BODIPY GFP signal or tdTOMATO expression at each time point. (B) Representative whole-mount images demonstrating the timing of adipose tissue development in Tg(-3.5ubb:plin2-tdTomato) and wild-type siblings using visceral adipose tissue as an example. Data points are an average of N = 3 independent experiments for each time point, excluding 14 days post-fertilization (dpf), where N = 4, and the adults, where N = 5 (5 dpf WT n = 32, 5 dpf Tg(-3.5ubb:plin2-tdTomato) n = 38, 14 dpf WT n = 32, 14 dpf Tg(-3.5ubb:plin2-tdTomato) n = 48, 21 dpf WT n = 30, 21 dpf Tg(-3.5ubb:plin2-tdTomato) n = 40, 42 dpf WT n = 48, 42 dpf Tg(-3.5ubb:plin2-tdTomato) n = 43, adult WT n = 38, adult Tg(-3.5ubb:plin2-tdTomato) n = 29).
-
Figure 2—figure supplement 1—source data 1
Data values for Figure 2—figure supplement 1A.
- https://cdn.elifesciences.org/articles/64744/elife-64744-fig2-figsupp1-data1-v1.xlsx
Figure 3 with 1 supplement
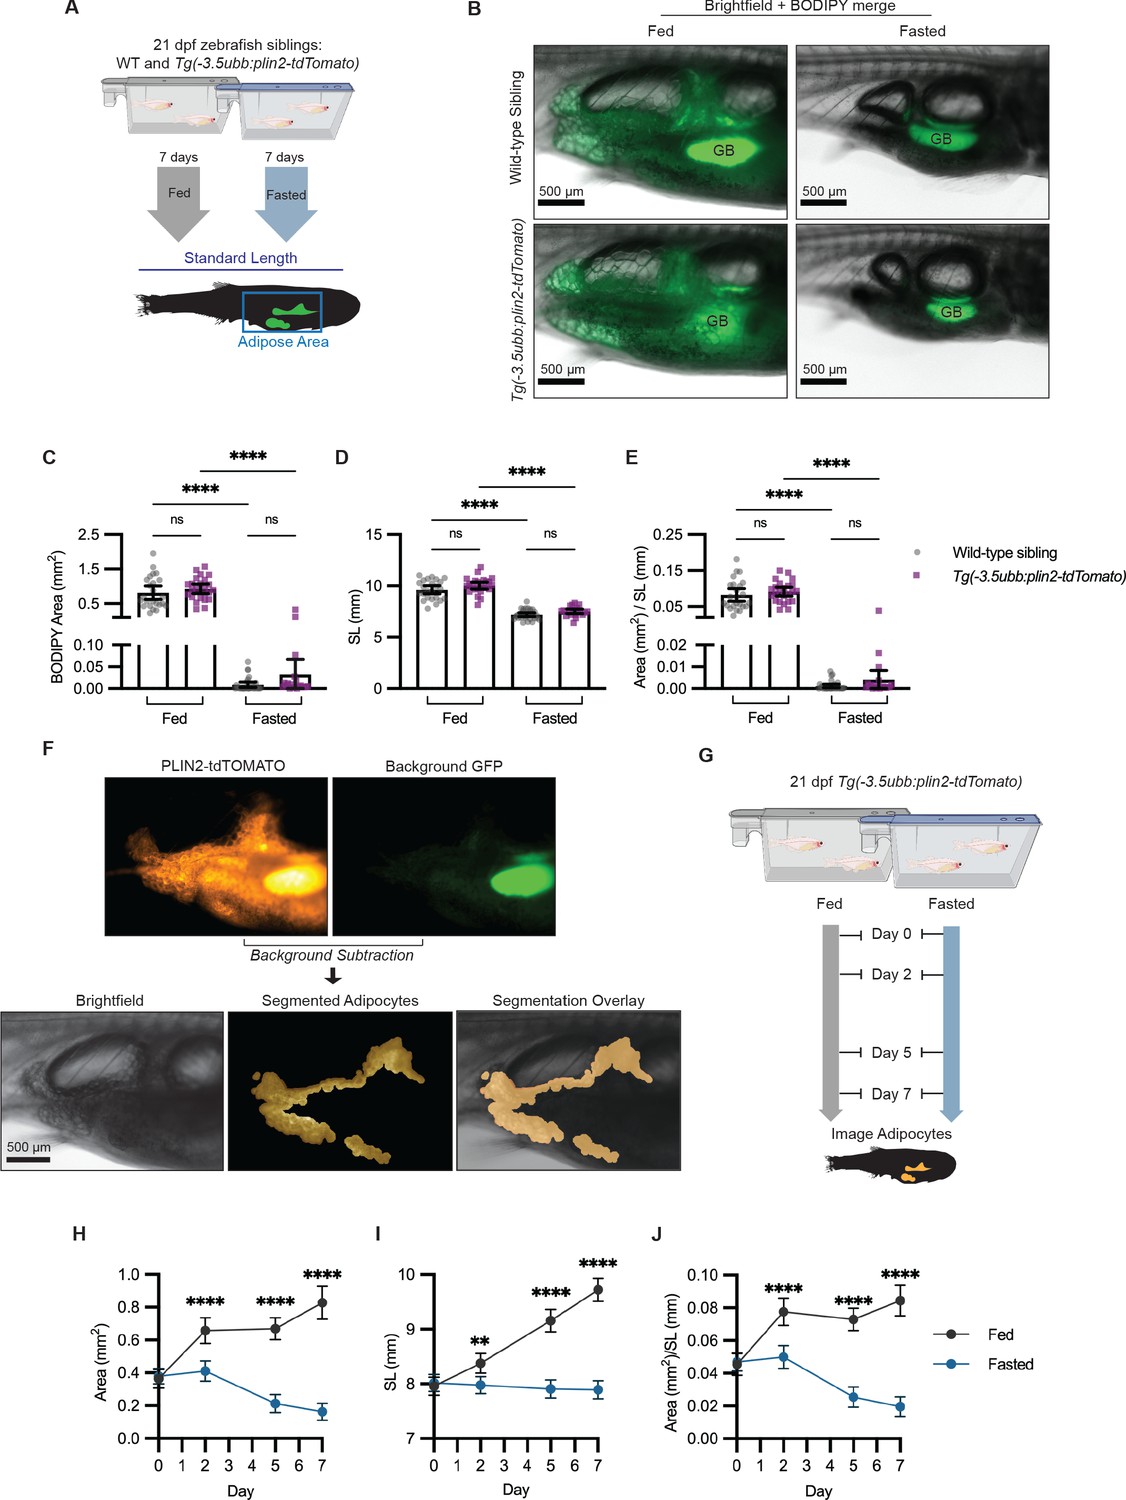
Fasting reduces visceral adipose tissue area.
(A) Schematic of experimental set-up for fasting experiment. 21 days post-fertilization (dpf) wild-type casper and Tg(-3.5ubb:plin2-tdTomato) zebrafish were fed or fasted for 7 days and imaged to measure standard length and adipose area. (B) Representative images of zebrafish fed or fasted after 7 days. Panels show merged images of brightfield and BODIPY-stained visceral adipose tissue. BODIPY-stained adipocytes were imaged to measure (C) area, (D) standard length, and (E) area/standard length. Data points indicate individual fish for N = 3 independent experiments; bars indicate mean and 95% CI. Fed wild-type n = 24; fed Tg(-3.5ubb:plin2-tdTomato) n = 24; fasted wild-type n = 29; fasted Tg(-3.5ubb:plin2-tdTomato) n = 20. Significance calculated via Kruskal-Wallis with Dunn’s multiple comparisons test; ****p<0.0001. (F) Representative image of computational segmentation of Tg(-3.5ubb:plin2-tdTomato) adipocytes. PLIN2-tdTOMATO was background subtracted with GFP fluorescence. Bottom panels show brightfield, segmented adipocytes, and segmentation overlaid on brightfield. (G) Schematic of experimental set-up for repeated imaging of 21 dpf Tg(-3.5ubb:plin2-tdTomato) zebrafish, which were fed or fasted for 7 days. Adipose tissue was imaged and analyzed for (H) area, (I) standard length, and (J) area/standard length. Points indicate mean and error bars indicate 95% CI for N = 3 independent experiments; by day 7, fed n = 46 and fasted n = 57. Significance calculated via Mann-Whitney test; **p<0.01, ****p<0.0001.
-
Figure 3—source data 1
Data values for Figure 3C-E.
- https://cdn.elifesciences.org/articles/64744/elife-64744-fig3-data1-v1.xlsx
-
Figure 3—source data 2
Data values for Figure 3H-J.
- https://cdn.elifesciences.org/articles/64744/elife-64744-fig3-data2-v1.xlsx
Figure 3—figure supplement 1
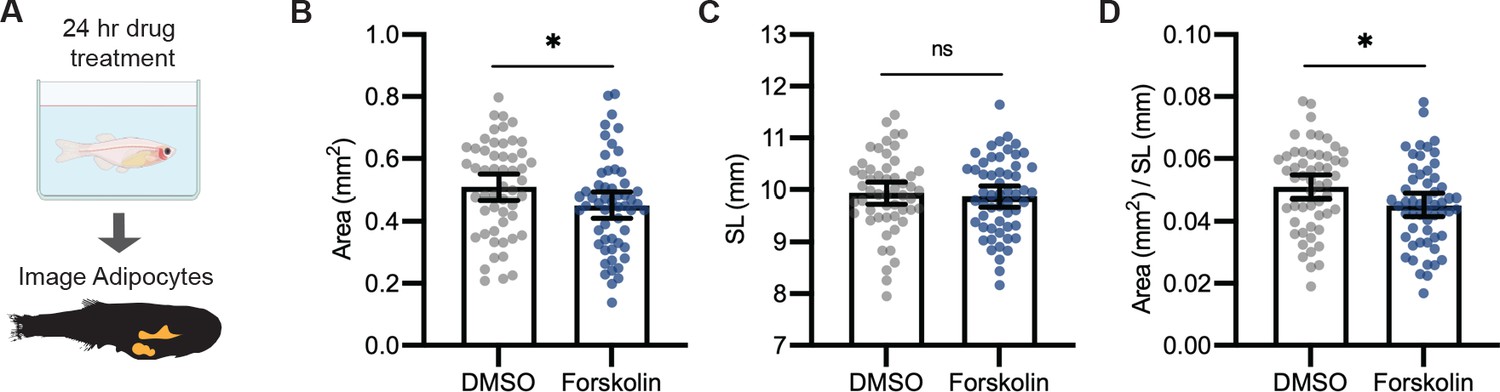
Forskolin reduces visceral adipose tissue area.
(A) Schematic of experimental set-up for Forskolin drug treatment. 21 days post-fertilization (dpf) Tg(-3.5ubb:plin2-tdTomato) zebrafish were individually placed in six-well plates with either dimethyl sulfoxide (DMSO) or 5 µM Forskolin for 24 hr. Adipose tissue was imaged and analyzed for (B) area, (C) standard length, and (D) area/standard length. Points indicate individual fish for N = 5 independent experiments; DMSO, n = 53; Forskolin, n = 55. Bars indicate mean and SEM. Significance calculated via Mann-Whitney test; *p<0.05.
-
Figure 3—figure supplement 1—source data 1
Data values for Figure 3—figure supplement 1B-D.
- https://cdn.elifesciences.org/articles/64744/elife-64744-fig3-figsupp1-data1-v1.xlsx
Figure 4
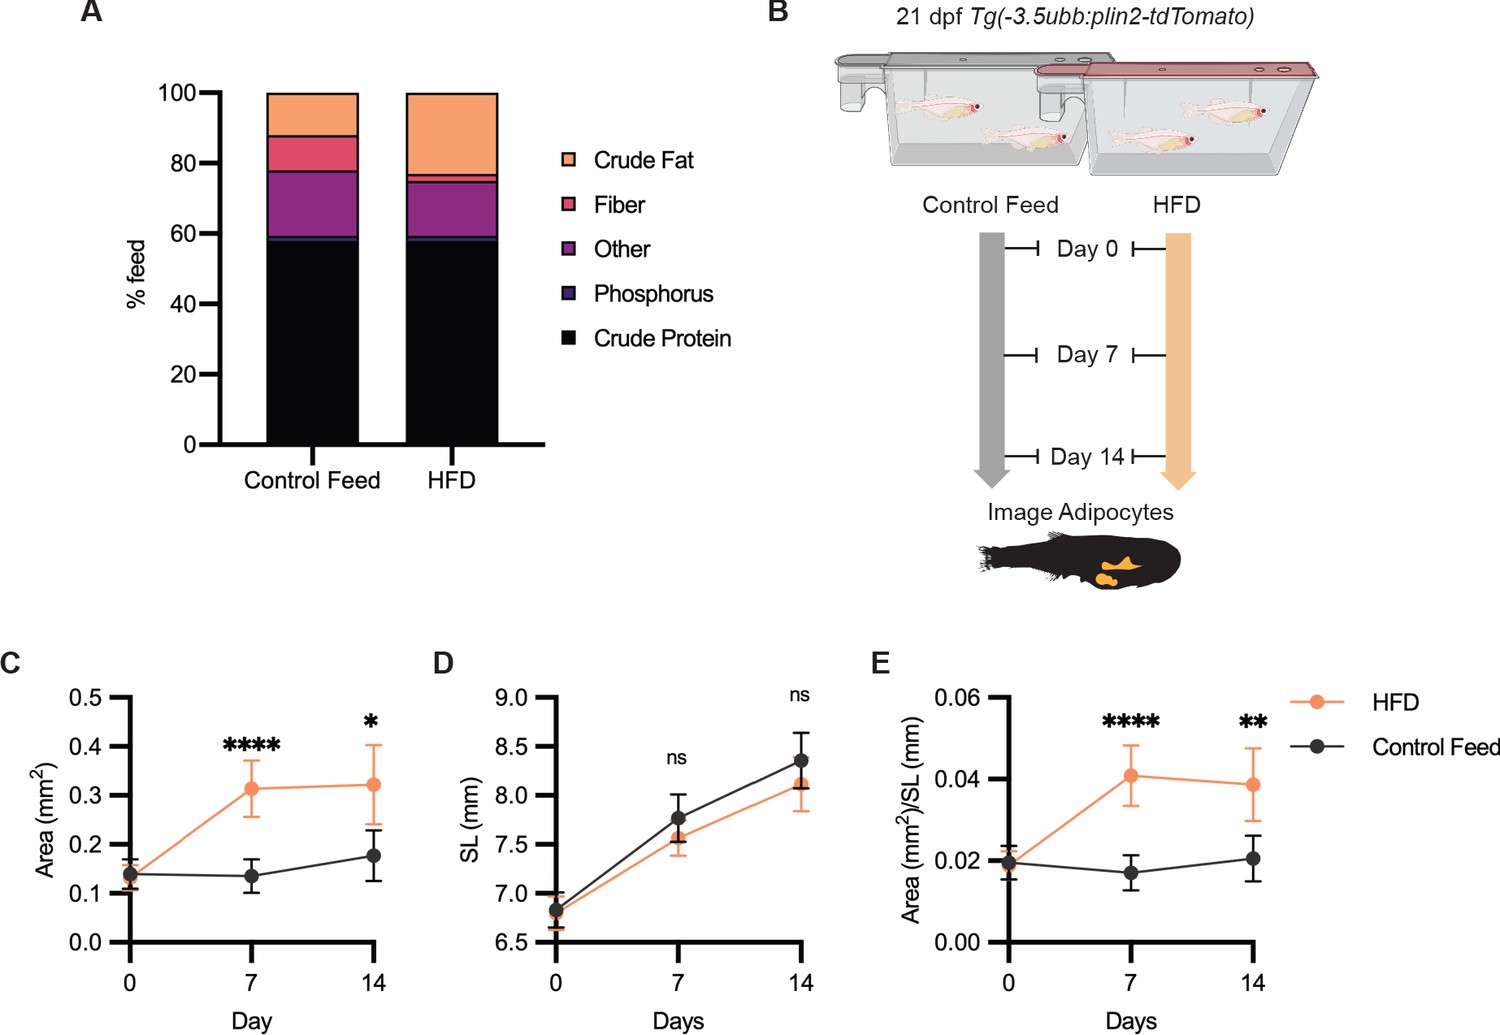
High-fat diet leads to specific enlargement of visceral adipose tissue.
(A) Percent breakdown of nutritional content for control feed and high-fat diet (HFD). (B) Schematic of experimental set-up for HFD experiment. 21 days post-fertiization (dpf) Tg(-3.5ubb:plin2-tdTomato) zebrafish were fed control feed or HFD for 14 days and imaged to measure standard length and adipose area. Image analysis pipeline resulted in measurements of adipose tissue (C) area, (D) standard length, and (E) area/standard length. Points indicate mean and error bars indicate 95% CI for N = 3 independent experiments; by day 14, control feed n = 57; HFD n = 61. Significance calculated via Mann-Whitney test; *p<0.05, **p<0.01, ****p<0.0001.
-
Figure 4—source data 1
Data values for Figure 4A-E.
- https://cdn.elifesciences.org/articles/64744/elife-64744-fig4-data1-v1.xlsx
Figure 5 with 1 supplement
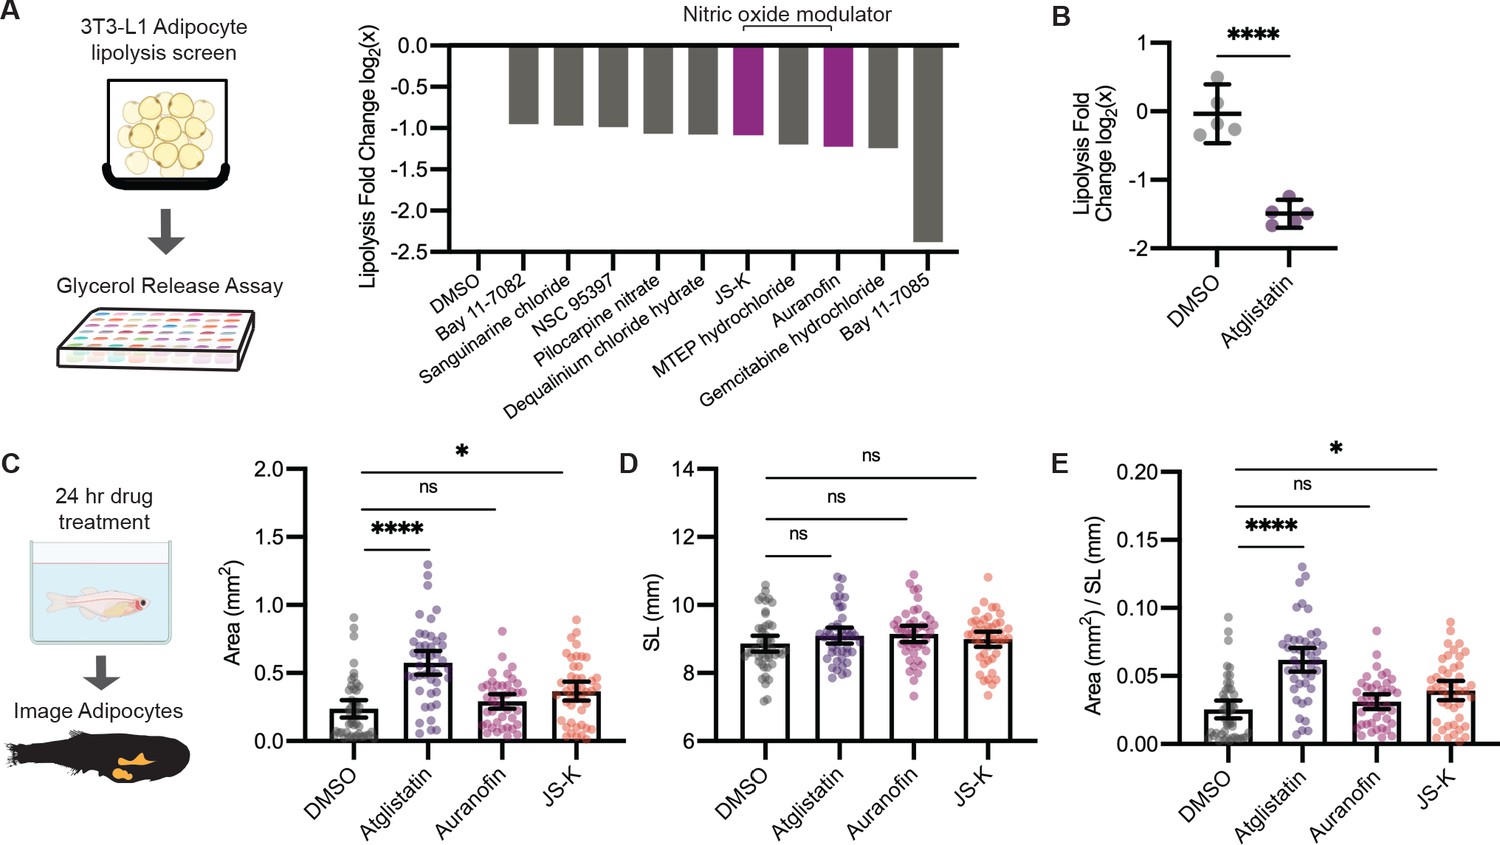
A screen to discover novel compounds that modulate lipolysis and lipid droplets in vivo.
(A) Schematic of pharmacologic lipolysis screen in 3T3-L1 adipocytes using a glycerol release assay. Normalized log2 transformed values for top 10 drugs that inhibit lipolysis are shown. Magenta indicates compounds that modulate nitric oxide. (B) Normalized log2 transformed values for lipolysis inhibition in 3T3-L1 adipocytes using either dimethyl sulfoxide (DMSO) or 100 µM Atglistatin. N = 5 independent experiments. Bars indicate mean and SEM. Significance calculated via Welch’s t-test; ****p<0.0001. (C) Schematic of experimental set-up for drug treatment. 21 days post-fertilization (dpf) Tg(-3.5ubb:plin2-tdTomato) zebrafish were individually placed in six-well plates with either DMSO, 40 µM Atglistatin, 1 µM Auranofin, or 1 µM JS-K for 24 hr. Adipose tissue was imaged and analyzed for (C) area, (D) standard length, and (E) area/standard length. Data points indicate individual fish for N = 4 independent experiments; DMSO n = 47; Atglistatin n = 44; Auranofin n = 42; JS-K n = 44. Bars indicate mean and SEM. Significance calculated via Kruskal-Wallis with Dunn’s multiple comparisons test; *p<0.05, ****p<0.0001.
-
Figure 5—source data 1
Complete list of lipolysis screen compounds and log2 transformed values.
- https://cdn.elifesciences.org/articles/64744/elife-64744-fig5-data1-v1.xlsx
-
Figure 5—source data 2
Data values for Figure 5B.
- https://cdn.elifesciences.org/articles/64744/elife-64744-fig5-data2-v1.xlsx
-
Figure 5—source data 3
Data values for Figure 5C-E.
- https://cdn.elifesciences.org/articles/64744/elife-64744-fig5-data3-v1.xlsx
Figure 5—figure supplement 1
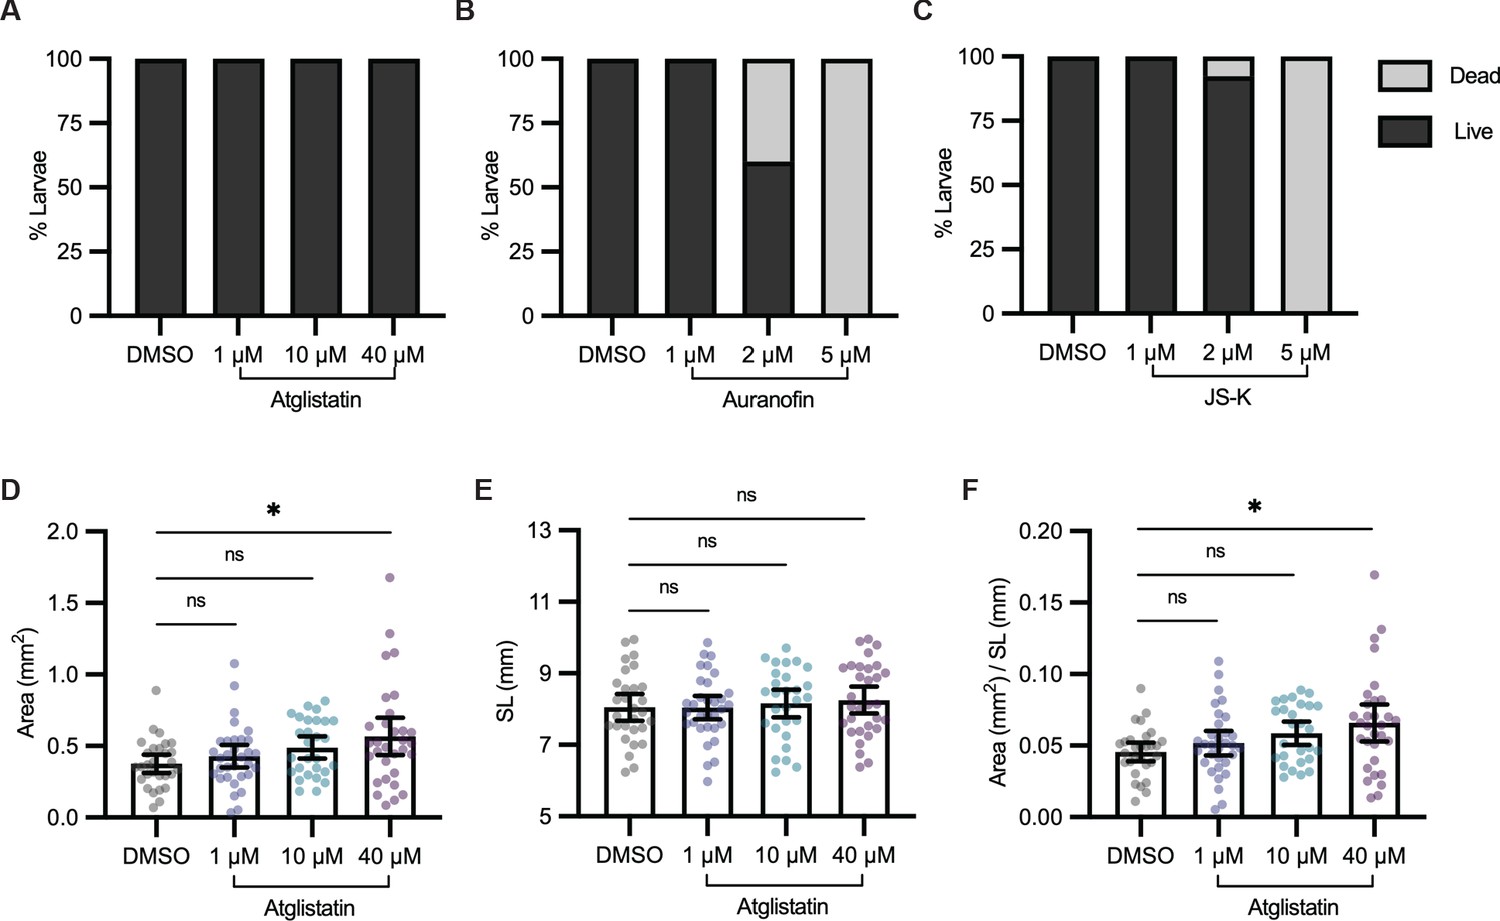
Atglistatin, Auranofin, and JS-K in vivo dose titration.
Viability of 21 days post-fertilization (dpf) Tg(-3.5ubb:plin2-tdTomato) zebrafish was measured after 24 hr of treatment with dimethyl sulfoxide (DMSO) or increasing concentrations of (A) Atglistatin, (B) Auranofin, or (C) JS-K. Percent larval viability measured from N = 3 independent experiments. After 24 hr of drug treatment, 21 dpf zebrafish were imaged to measure (D) area, (E) standard length, and (F) area/standard length. Data points indicate individual fish for N = 5 independent experiments; DMSO n = 29; 1 µM n = 32; 10 µM n = 28; 40 µM n = 31. Bars indicate mean and SEM. Significance calculated via Kruskal-Wallis with Dunn’s multiple comparisons test; *p<0.05.
-
Figure 5—figure supplement 1—source data 1
Data values for Figure 3—figure supplement 1A-F.
- https://cdn.elifesciences.org/articles/64744/elife-64744-fig5-figsupp1-data1-v1.xlsx
Figure 6 with 1 supplement
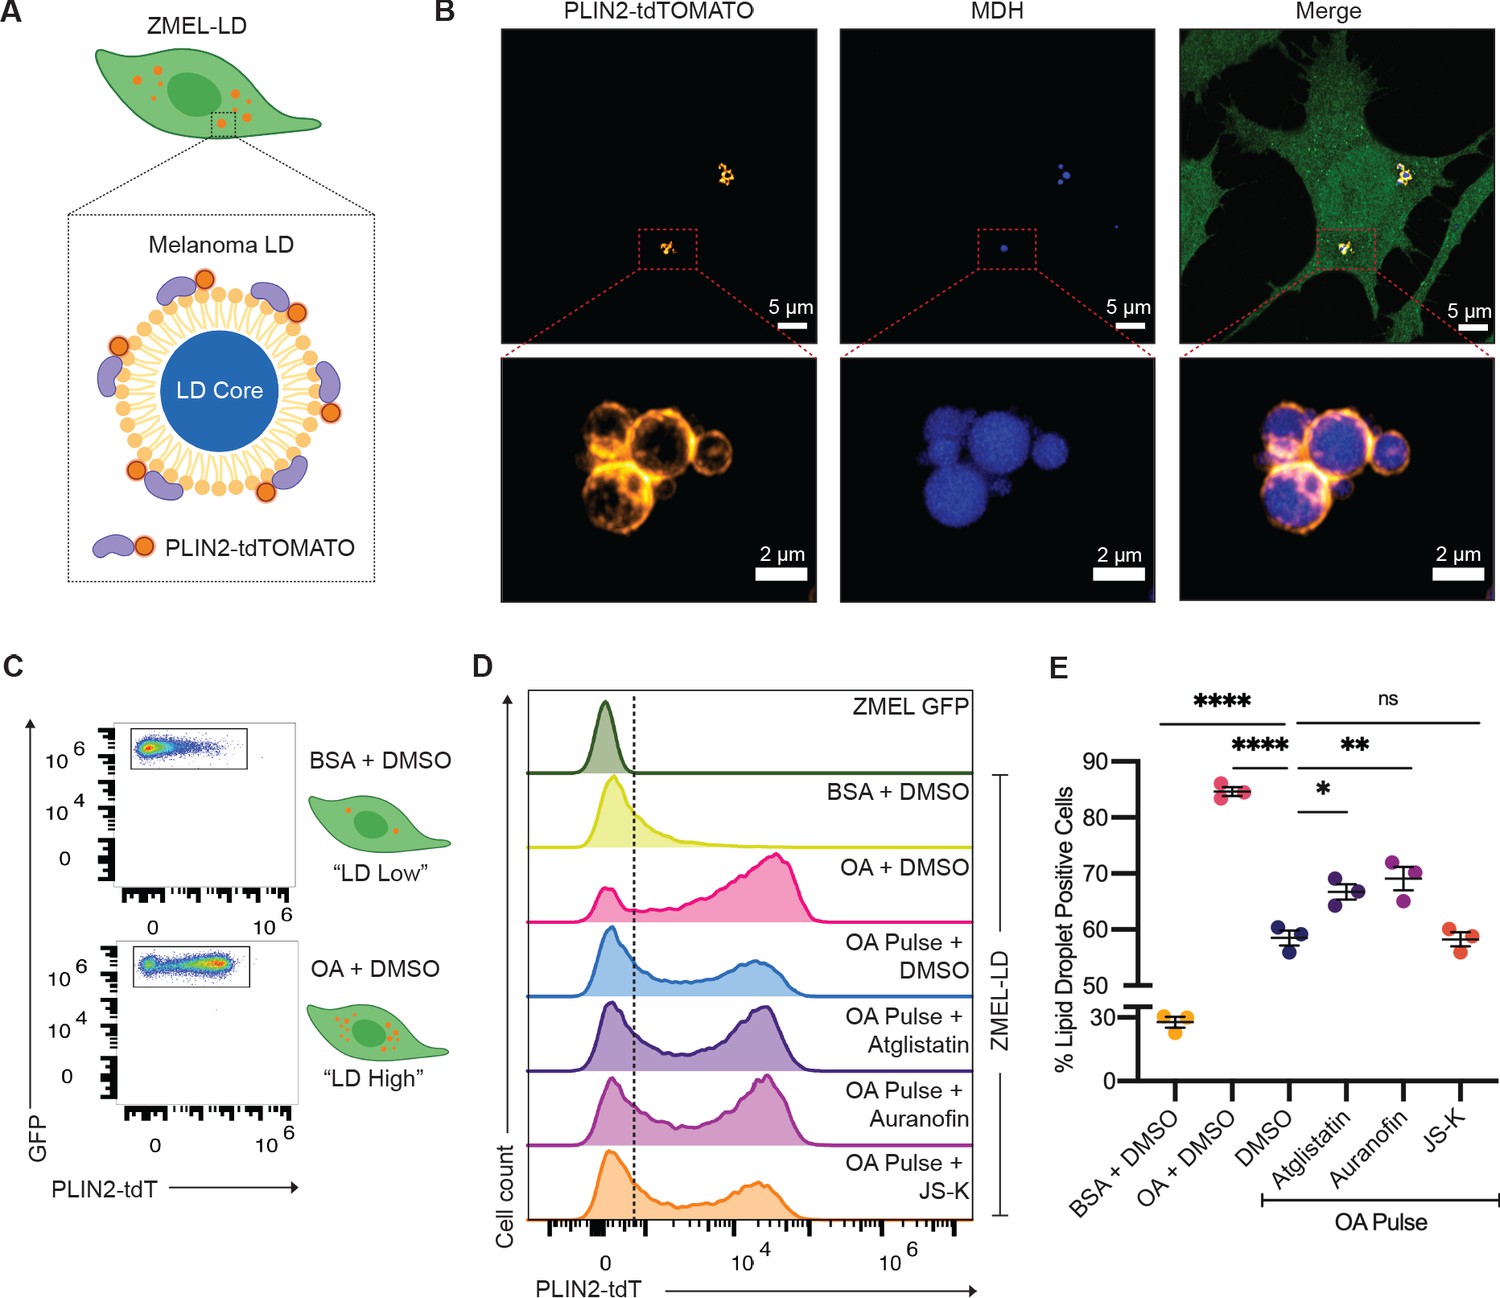
Lipolysis modulators also inhibit lipid droplet loss in melanoma cells.
(A) Schematic of zebrafish melanoma cell line with lipid droplet reporter (ZMEL-LD) with lipid droplet labeled by PLIN2-tdTOMATO. (B) Confocal images of ZMEL-LD cells after 24 hr of oleic acid treatment. Panels show fluorescence signals in PLIN2-tdTOMATO, MDH (lipid droplet dye) staining, and merge of images with cytoplasmic GFP. Red box indicates position of higher magnification image of lipid droplets. (C) ZMEL-LD cells were treated with either bovine serum albumin (BSA) or oleic acid with dimethyl sulfoxide (DMSO) for 72 hr and then analyzed by Fluorescence Activated Cell Sorting (FACS) for PLIN2-tdTOMATO expression. (D) Representative histogram of PLIN2-tdTOMATO expression of ZMEL-GFP and GFP+ZMEL-LD cells with indicated drugs. Dashed line shows threshold for PLIN2-tdTOMATO expression. (E) Quantification of percent of GFP+ZMEL-LD cells with lipid droplets. Lipid droplet low and high controls were ZMEL-LD cells treated with BSA or oleic acid for 72 hr. For drug treatments, ZMEL-LD cells were pulsed with oleic acid for 24 hr and then given DMSO, 40 µM Atglistatin, 0.5 µM Auranofin, or 0.5 µM JS-K for 48 hr. N = 3 independent experiments. Bars indicate mean and SEM. Significance calculated via one-way ANOVA with Dunnett’s multiple comparisons test; *p<0.05, ***p<0.001, ****p<0.0001.
Figure 6—figure supplement 1
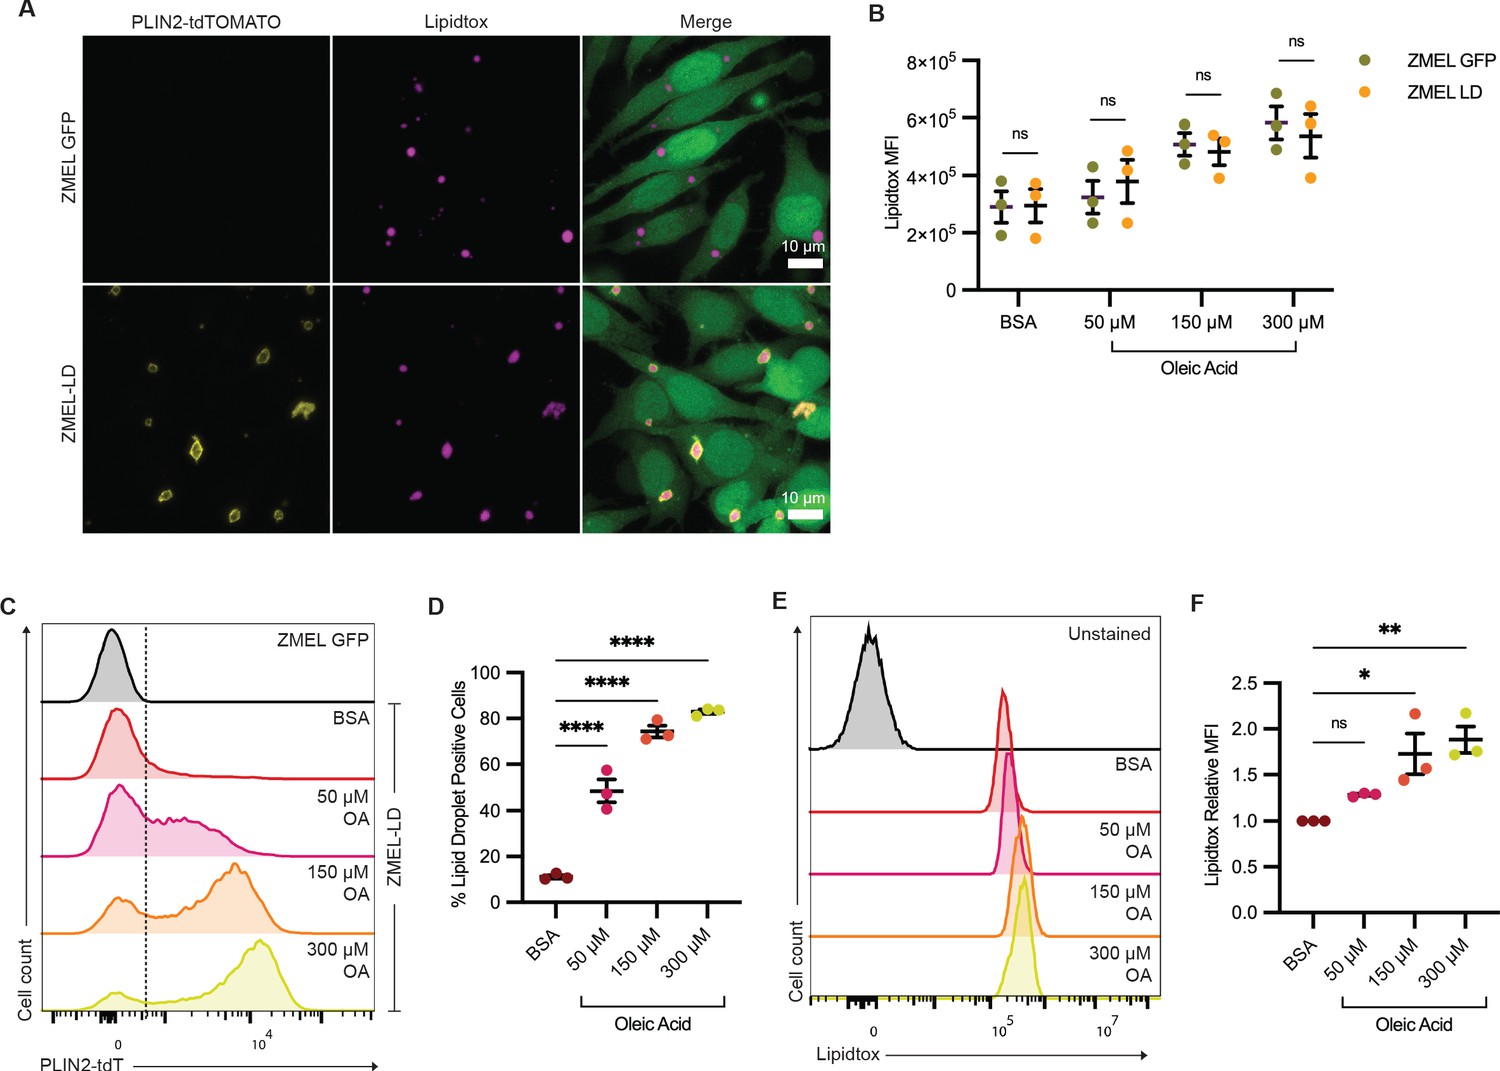
Lipid droplet production is equivalent between ZMEL-GFP and ZMEL-LD.
(A) Confocal images of ZMEL-GFP and ZMEL-LD after 24 hr of 150 µM oleic acid treatment. Cells were fixed and stained, with panels showing fluorescence signals for PLIN2-tdTOMATO, Lipidtox (lipid droplet dye), and merge of images with cytoplasmic GFP. ZMEL-GFP and ZMEL-LD cells were treated with bovine serum albumin (BSA) or increasing concentrations of oleic acid for 24 hr and then analyzed by FACS. (B) Comparison of Lipidtox median fluorescence intensity (MFI) between ZMEL-GFP and ZMEL-LD. Significance calculated via Welch’s t-test with Bonferroni correction. (C) Representative histogram of PLIN2-tdTOMATO expression of ZMEL-GFP and ZMEL-LD cells. Dashed line shows the threshold for PLIN2-tdTOMATO expression. (D) Quantification of percent of GFP+ ZMEL-LD cells with lipid droplets. Significance calculated via one-way ANOVA with Dunnett’s multiple comparison test. (E) Representative histogram of Lipidtox expression of ZMEL-LD cells. (F) Quantification of Lipidtox MFI relative to BSA control of GFP+ZMEL-LD cells. Significance calculated via one-way ANOVA with Dunnett’s multiple comparison test. N = 3 independent experiments. Bars indicate mean and SEM. *p<0.05, **p<0.01, ****p<0.0001.
Videos
Video 1
3D reconstruction of ZMEL-LD lipid droplet.
ZMEL-LD cells were given oleic acid for 24 hr, fixed, and stained with the lipid droplet dye MDH. This video is a 3D reconstruction of 37 planes covering a 6 µm stack of a lipid droplet cluster in a ZMEL-LD cell. PLIN2-tdTOMATO (orange) is located outside of the lipid droplet core (blue).
Tables
Key resources table
| Reagent type (species) or resource | Designation | Source or reference | Identifiers | Additional information |
|---|---|---|---|---|
| Cell line (Danio rerio) | ZMEL | Heilmann et al., 2015 | mitfa:BRAFV600E/p53-/- | |
| Cell line (Danio rerio) | ZMEL-LD | This paper | (-3.5ubb:plin2-tdtomato) in pDestTol2pA2-blastocidin | |
| Cell line (Mus musculus) | 3T3-L1 | ZenBio | SP-L1-F | |
| Strain, strain background (Danio rerio) | casper | White et al., 2008 | mitfaw2/w2;mpv17a9/a9 | |
| Strain, strain background (Danio rerio) | (-3.5ubb:plin2-tdtomato) | This paper | ||
| Recombinant DNA reagent | (-3.5ubb:plin2-tdtomato) in pDestTol2CG2 (plasmid) | This paper | ||
| Recombinant DNA reagent | (-3.5ubb:plin2-tdtomato) in pDestTol2pA2-blastocidin (plasmid) | This paper | ||
| Recombinant DNA reagent | pDestTol2pA2-blastocidin (plasmid) | Heilmann et al., 2015 | ||
| Recombinant DNA reagent | pDestTol2CG2 (plasmid) | Kwan et al., 2007 | ||
| Sequence-based reagent | PLIN2 cDNA FWD | This paper | PCR primer | AAAGCAGGCTCCACCATGAGCTTTCTTCTGTACTTGAAACTG |
| Sequence-based reagent | PLIN2 cDNA REV | This paper | PCR primer | GCCCTTGCTCACCATTTCAGTGACTTGAAGGGTCCTCTGT |
| Sequence-based reagent | PLIN2-TMT FWD | This paper | PCR primer | GCCGCCCCCTTCACCATGAGCTTTCTTCTGTACTTGAAAC |
| Sequence-based reagent | PLIN2-TMT REV | This paper | PCR primer | GCCCTTGCTCACCATTTCAGTGACTTG |
| Sequence-based reagent | tdTOMATO ME PLIN2 FWD | This paper | PCR primer | ATGGTGAGCAAGGGCGAG |
| Sequence-based reagent | tdTOMATO ME PLIN2 REV | This paper | PCR primer | GGTGAAGGGGGCGGC |
| Commercial assay or kit | Cloneamp HiFi PCR Premix | Takara | Catalog #639298 | |
| Commercial assay or kit | In-Fusion HD Cloning Plus | Takara | Catalog #638920 | |
| Commercial assay or kit | Gateway LR Clonase Enzyme mix | Thermo Fisher | Catalog #11791019 | |
| Commercial assay or kit | Zymogen Quick RNA Miniprep Kit | Zymo Research | Catalog #R1054 | |
| Commercial assay or kit | Invitrogen SuperScriptIII First-Strand Synthesis SuperMix Kit | Thermo Fisher | Catalog #18080400 | |
| Commercial assay or kit | NucleoSpin Gel and PCR Clean up | Takara | Catalog #740609.50 | |
| Commercial assay or kit | Free Glycerol Reagent | Sigma-Aldrich | Catalog #F6428 | |
| Chemical compound | Glycerol Standard Solution | Sigma-Aldrich | Catalog #G7793 | |
| Other | HCS LipidTOX deep red | Thermo Fisher | Catalog #H34477 | 1:250 or 1:500 |
| Other | BODIPY 493/503 | Thermo Fisher | Catalog #D3922 | 5 or 10 ng/µl |
| Other | AUTODOT Visualization Dye (MDH) | Abcepta | Catalog #SM1000a | 1:500 |
| Chemical compound, drug | Forskolin | Sigma-Aldrich | Catalog #F6886 | 5 µM (fish) |
| Chemical compound, drug | Auranofin | Sigma-Aldrich | Catalog #A6733 | 1 µM (fish), 0.5 µM (cells) |
| Chemical compound, drug | JS-K | Sigma-Aldrich | Catalog #J4137 | 1 µM (fish), 0.5 µM (cells) |
| Chemical compound, drug | Atglistatin | Sigma-Aldrich | Catalog #SML1075 | 40 µM |
| Chemical compound | Oleic Acid-Albumin | Sigma-Aldrich | Catalog #O3008-5M | |
| Chemical compound | LOPAC 1280 Library | Sigma-Aldrich | Catalog #LO1280 | |
| Antibody | Anti-RFP antibody (rabbit polyclonal) | Rockland | Catalog #600-401-379, RRID:AB_2209751 | (1:500), (1 µL) |
| Software, algorithm | MATLAB | Mathworks | ||
| Software, algorithm | PRISM | Graphpad | ||
| Software, algorithm | FIJI | Schindelin et al., 2012 | ||
| Software, algorithm | FlowJo | Becton, Dickinson and Company | ||
| Other | High-fat diet | Sparos | See detailed description of high-fat diet contents in the 'Methods' section below |
Additional files
Download links
A two-part list of links to download the article, or parts of the article, in various formats.
Downloads (link to download the article as PDF)
Open citations (links to open the citations from this article in various online reference manager services)
Cite this article (links to download the citations from this article in formats compatible with various reference manager tools)
An in vivo reporter for tracking lipid droplet dynamics in transparent zebrafish
eLife 10:e64744.
https://doi.org/10.7554/eLife.64744


