HIV-1 uncoating by release of viral cDNA from capsid-like structures in the nucleus of infected cells
- Department of Infectious Diseases Virology, University Hospital Heidelberg, Germany
- Department of Infectious Diseases Integrative Virology, University Hospital Heidelberg, Germany
- German Center for Infection Research, partner site Heidelberg, Germany
Figures
Figure 1 with 5 supplements
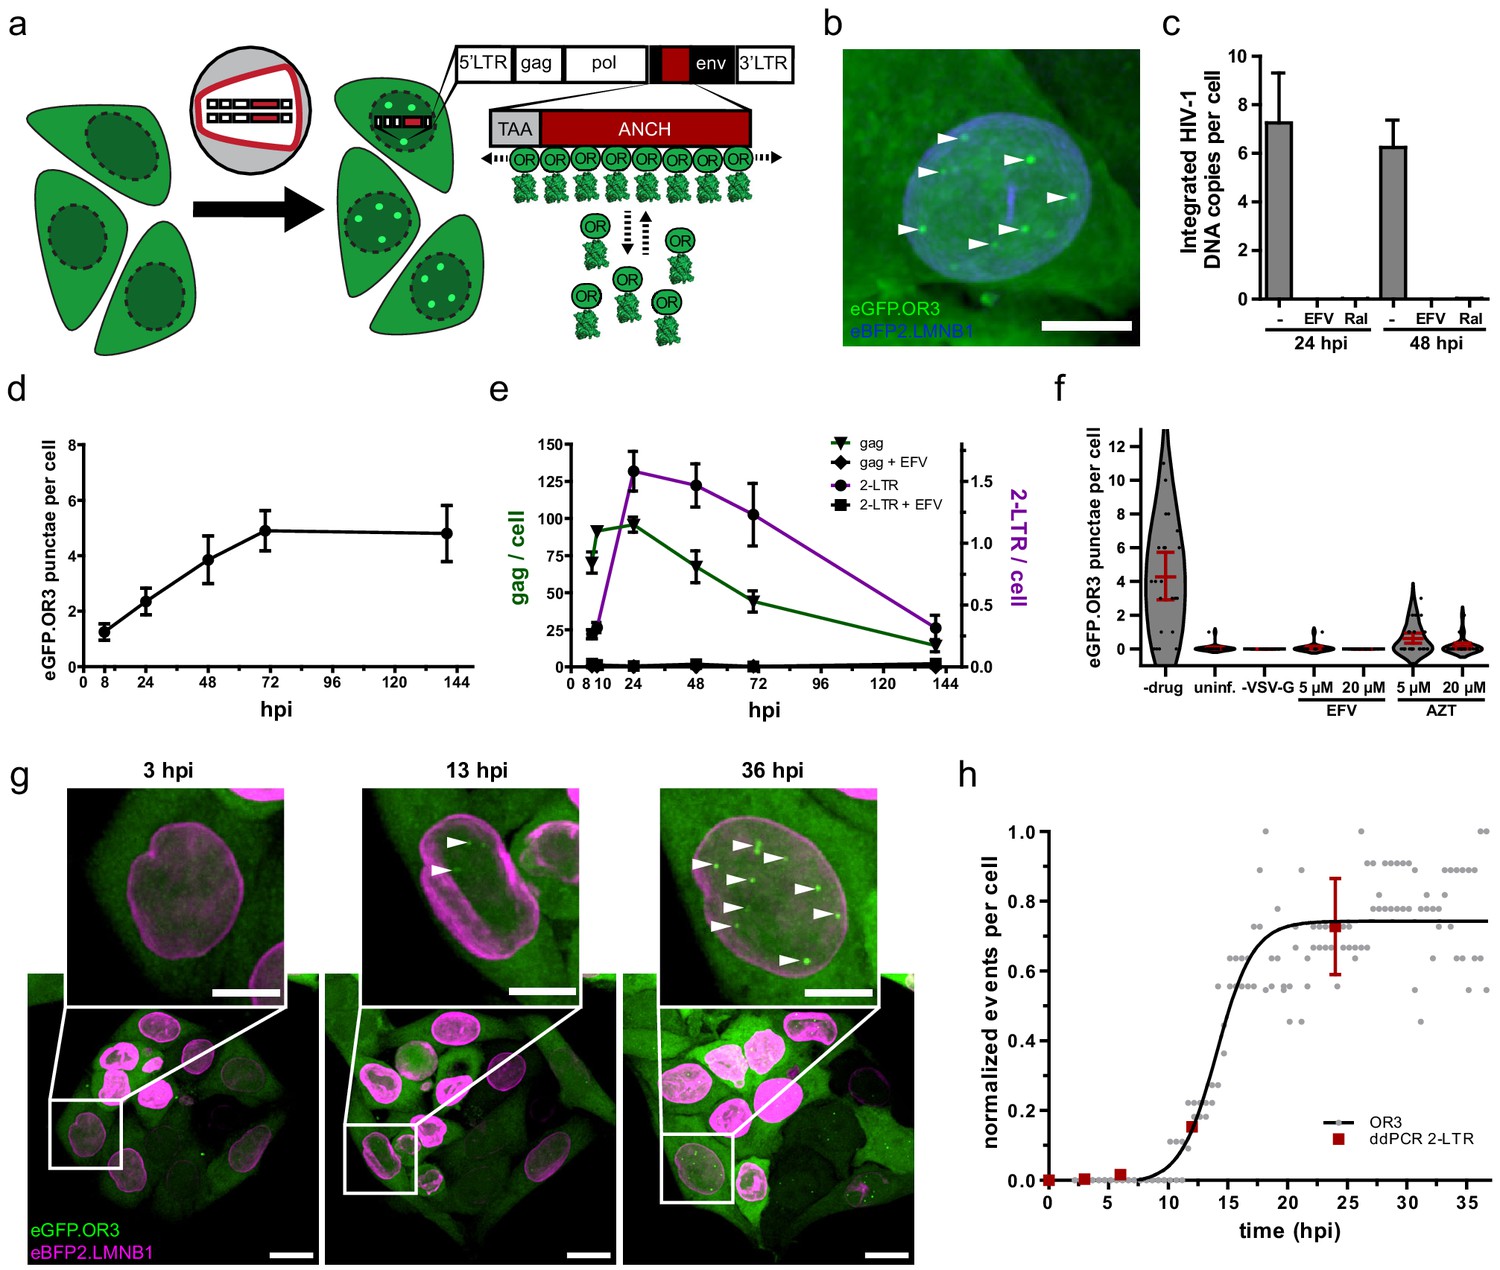
Visualization of HIV-1 dsDNA within the nucleus of infected cells.
(a) Scheme of the ANCHOR dsDNA visualization system. Fluorescently tagged OR3 binds to the ANCH sequence on the viral dsDNA (see Figure 1—figure supplement 1). (b) eGFP.OR3 punctae detected in the nuclei of infected cells. TZM-bl eBFP2.LMNB1 eGFP.OR3 cells were infected with VSV-G pseudotyped HIV-1NL4-3 ANCH (30 µUnits RT/cell, MOI 6), fixed at 55 h p.i. and imaged using SDCM. Six independent experiments with two independent virus preparations were performed. Maximum intensity projection (MIP) of a representative cell is shown. Note that some cells show one or two cytoplasmic, mostly perinuclear, infection-independent accumulations of the OR3 fusion protein, which we identified as multivesicular bodies (MVB) by CLEM-ET (Figure 1—figure supplement 2). Scale bar: 5 µm. (c) Quantification of integrated HIV-1NL4-3 ANCH provirus using nested Alu-LTR PCR. SupT1 cells were infected using VSV-G pseudotyped HIV ANCH (10 µU RT/cell, corresponding to an MOI ~ 8 under the conditions used). Raltegravir (RAL) or Efavirenz (EFV) were added at the time of infection as indicated. Data are shown for one experiment performed in biological triplicates; error bars represent SD. (d,e) eGFP.OR3 punctae are stable for more than 6 days while total and unintegrated DNA declined (see Figure 1—figure supplement 3). Quantification of eGFP.OR3 punctae by SDCM (d), and gag and 2-LTR cDNA by ddPCR (e) over time within the same experiment. Infection was performed as in (b). (d) Data from one of two independent experiments (n = 20 cells per time point, error bars represent SEM) (e) Data from one experiment performed in biological triplicates (error bars represent SEM). (f) Detection of eGFP.OR3 punctae is HIV-1 cell fusion and reverse transcription dependent. TZM-bl eGFP.OR3 cells were infected with VSV-G pseudotyped NNHIV ANCH (10 µU RT/cell) and imaged under live conditions at 27 h p.i. Control experiments were performed adding HIV-1 RT inhibitors EFV or azidothymidine (AZT) at time of infection or using particles lacking a fusion protein (‘-VSV-G’). n = 20–29 cells were analyzed per sample and error bars represent 95 % CI; The graph shows data from one of three independent experiments (see Figure 1—figure supplement 4). (g,h) Live cell imaging of vDNA punctae formation. TZM-bl eBFP2.LMNB1 and eGFP.OR3 cells were infected with NNHIV ANCH (30 µU RT/cell) and image acquisition by SDCM was initiated at 2 h p.i. 3D stacks were acquired every 30 min for 36 hr. Representative data from one of four independent experiments are shown. MIP of a representative cell is shown. Scale bars: 10 µm (overview), 5 µm (enlargement). See Figure 1—video 1. (h) Quantification of eGFP.OR3 punctae formation in cells from video shown in (g). Analyzed was the eGFP.OR3 punctae formation from two cells within the field of view (FOV) with each point representing the normalized amount of OR3 punctae per nucleus at the respective timepoint. Data were fit to a logistic growth model giving t1/2 = 14.1 ± 0.5 h p.i. Detection of 2-LTR circles (mean and SEM) by ddPCR in biological triplicates is shown for TZM-bl cells infected with NNHIV WT.
-
Figure 1—source data 1
Data corresponds to the number of eGFP.OR3 punctae per cell nucleus (Figure 1f), the normalized number of eGFP.OR3 punctae per cell nucleus (Figure 1h) and normalized number of 2-LTR circles quantified by ddPCR in biological triplicates (Figure 1h).
- https://cdn.elifesciences.org/articles/64776/elife-64776-fig1-data1-v2.xlsx
Figure 1—figure supplement 1
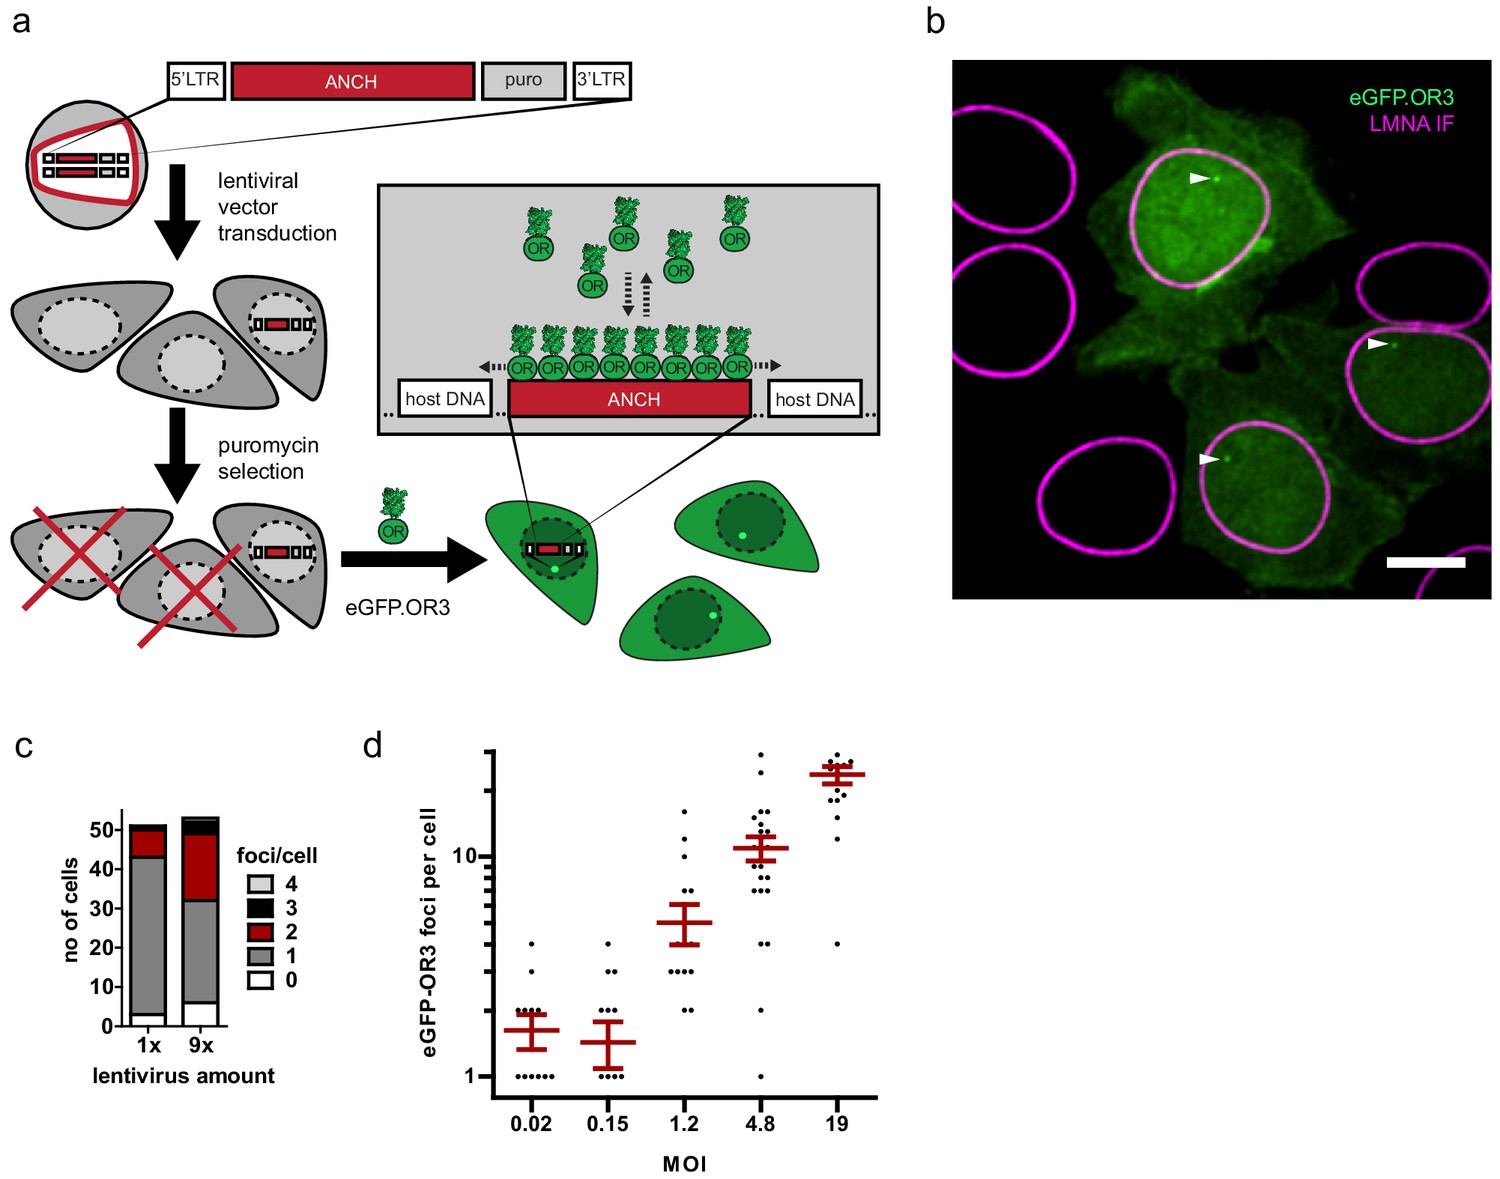
The ANCHOR system enables sensitive visualization of integrated lentiviral DNA without loss through recombination during reverse transcription.
(a) Scheme of experiment. A HIV-1 lentiviral vector harboring the ANCH sequence and a puromycin expression cassette was used to transduce TZM-bl cells. After 2–3 days, puromycin was added to deplete untransduced cells, after which eGFP.OR3 was delivered by lentiviral transduction or transfection. All surviving cells are expected to display one or more OR3 punctae in the nucleus. (b) Exemplary cells from low MOI transduction of cells using lentiviral particle containing supernatant. Scale bar: 5 µm. One of two independent experiments is shown. (c) Quantification of spots per cell from 50 µl (1×) and 450 µl (9×) used supernatant. (d) Titration of concentrated lentiviral particles. MOI was determined by counting the number of surviving cell colonies 5 days after puromycin selection. The transduced cells were kept in culture for over 4 weeks to ensure degradation of unintegrated vDNA products. Error bars represent SEM.
-
Figure 1—figure supplement 1—source data 1
Data corresponds to the number of cells showing between 0 and 4 eGFP.OR3 punctae per cell nucleus (Figure 1—figure supplement 1c) and the number of eGFP.OR3 punctae per cell nucleus for different MOIs (Figure 1—figure supplement 1d).
- https://cdn.elifesciences.org/articles/64776/elife-64776-fig1-figsupp1-data1-v2.xlsx
Figure 1—figure supplement 2
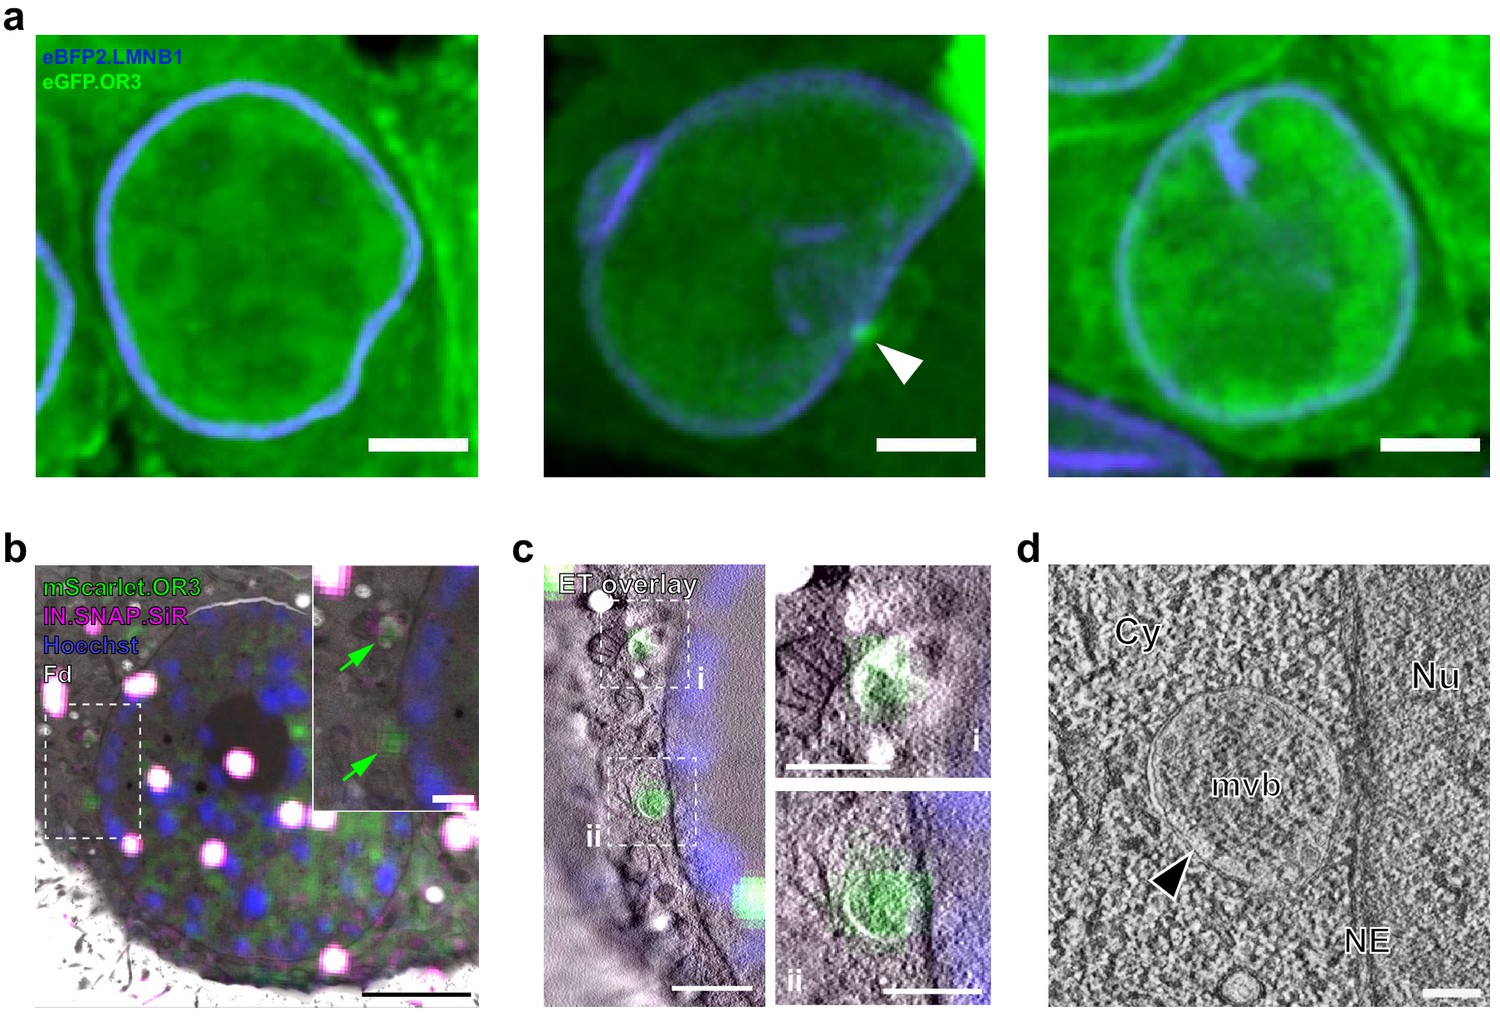
CLEM-ET analysis of infection-independent cytoplasmic OR3 fusion protein accumulations.
(a) Representative maximum intensity projections (MIPs) of uninfected TZM-bl eBFP2.LMNB1 eGFP.OR3 expressing cells. Note the perinuclear accumulation of eGFP.OR3 in the middle cell (white arrow). (b–d) CLEM analysis of infection-independent cytoplasmic OR3 fusion protein accumulations. Experimental details as in Figure 5. All examined cytoplasmic mScarlet.OR3+ accumulations by CLEM-ET (n = 4) correlated to position of MVBs. (b) CLEM overlays (with enlargements) of EM sections of infection-independent mScarlet.OR3 (green) accumulations. Shown is the same cell section as in Figure 5a. (c) CLEM-ET overlay of regions enlarged in (b). (d) Computational slices from tomographic reconstructions at the correlated positions boxed in (c, ii). Scale bars: 5.0 µm (a), 2.5 µm (b), 750 nm (c), 500 nm for enlargements (b,c) and 100 nm (d).
Figure 1—figure supplement 3
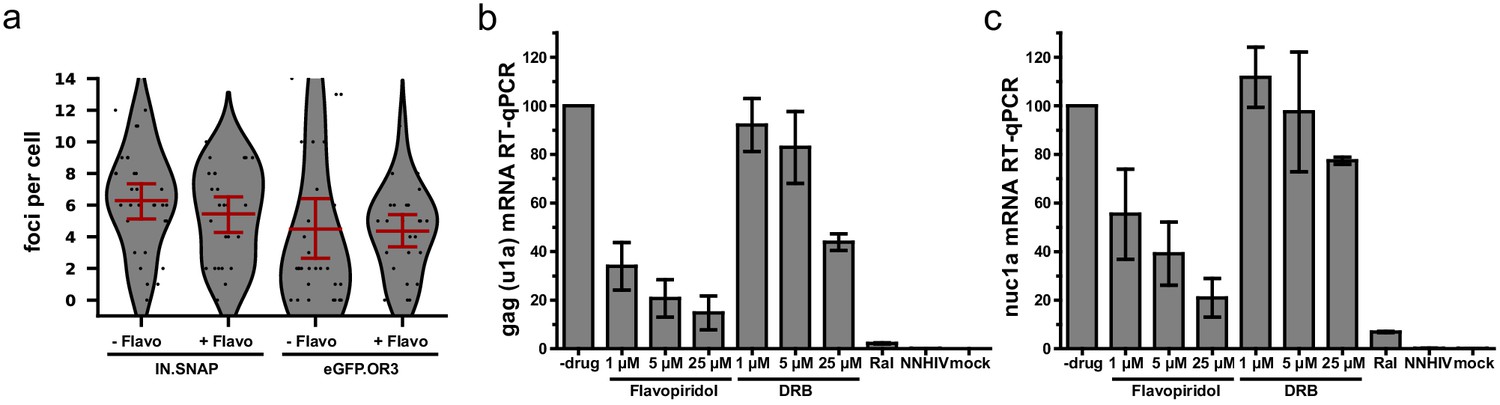
eGFP.OR3 punctae in infected cell nuclei are detected independent of HIV-1 transcription.
(a) eGFP.OR3 and eBFP2.LMNB1 expressing TZM-bl cells were infected with 30 µU RT/cell VSV-G pseudotyped HIV ANCH for 47 hr, after which 5 µM of the pTEF-b transcription initiation inhibitor Flavopiridol was added for another 8 hr. Number of nuclear IN.SNAP and eGFP.OR3 punctae were quantified. One of three independent experiments is shown with n > 25 cells per sample, error bars represent 95 % CI. (b,c) qRT-PCR of viral RNA products specific for gag (u1a) (b) and the transcription of the first nucleosome nuc1a (c) quantified at 55 h post i. eBFP2.LMNB1 and eGFP.OR3 expressing TZM-bl cells were infected with 5 µU RT/cell VSV-G pseudotyped HIV ANCH. Flavopiridol and the transcription elongation inhibitor 5,6-dichloro-1-beta-D-ribofuranosylbenzimidazole (DRB) were added 8 hr prior RNA extraction. The experiment was performed in biological triplicates and error bars represent SD.
-
Figure 1—figure supplement 3—source data 1
Data corresponds to the number of IN.SNAP.SiR or eGFP.OR3 punctae per cell nucleus with and without flavopiridol treatment (Figure 1—figure supplement 2a).
- https://cdn.elifesciences.org/articles/64776/elife-64776-fig1-figsupp3-data1-v2.xlsx
Figure 1—figure supplement 4
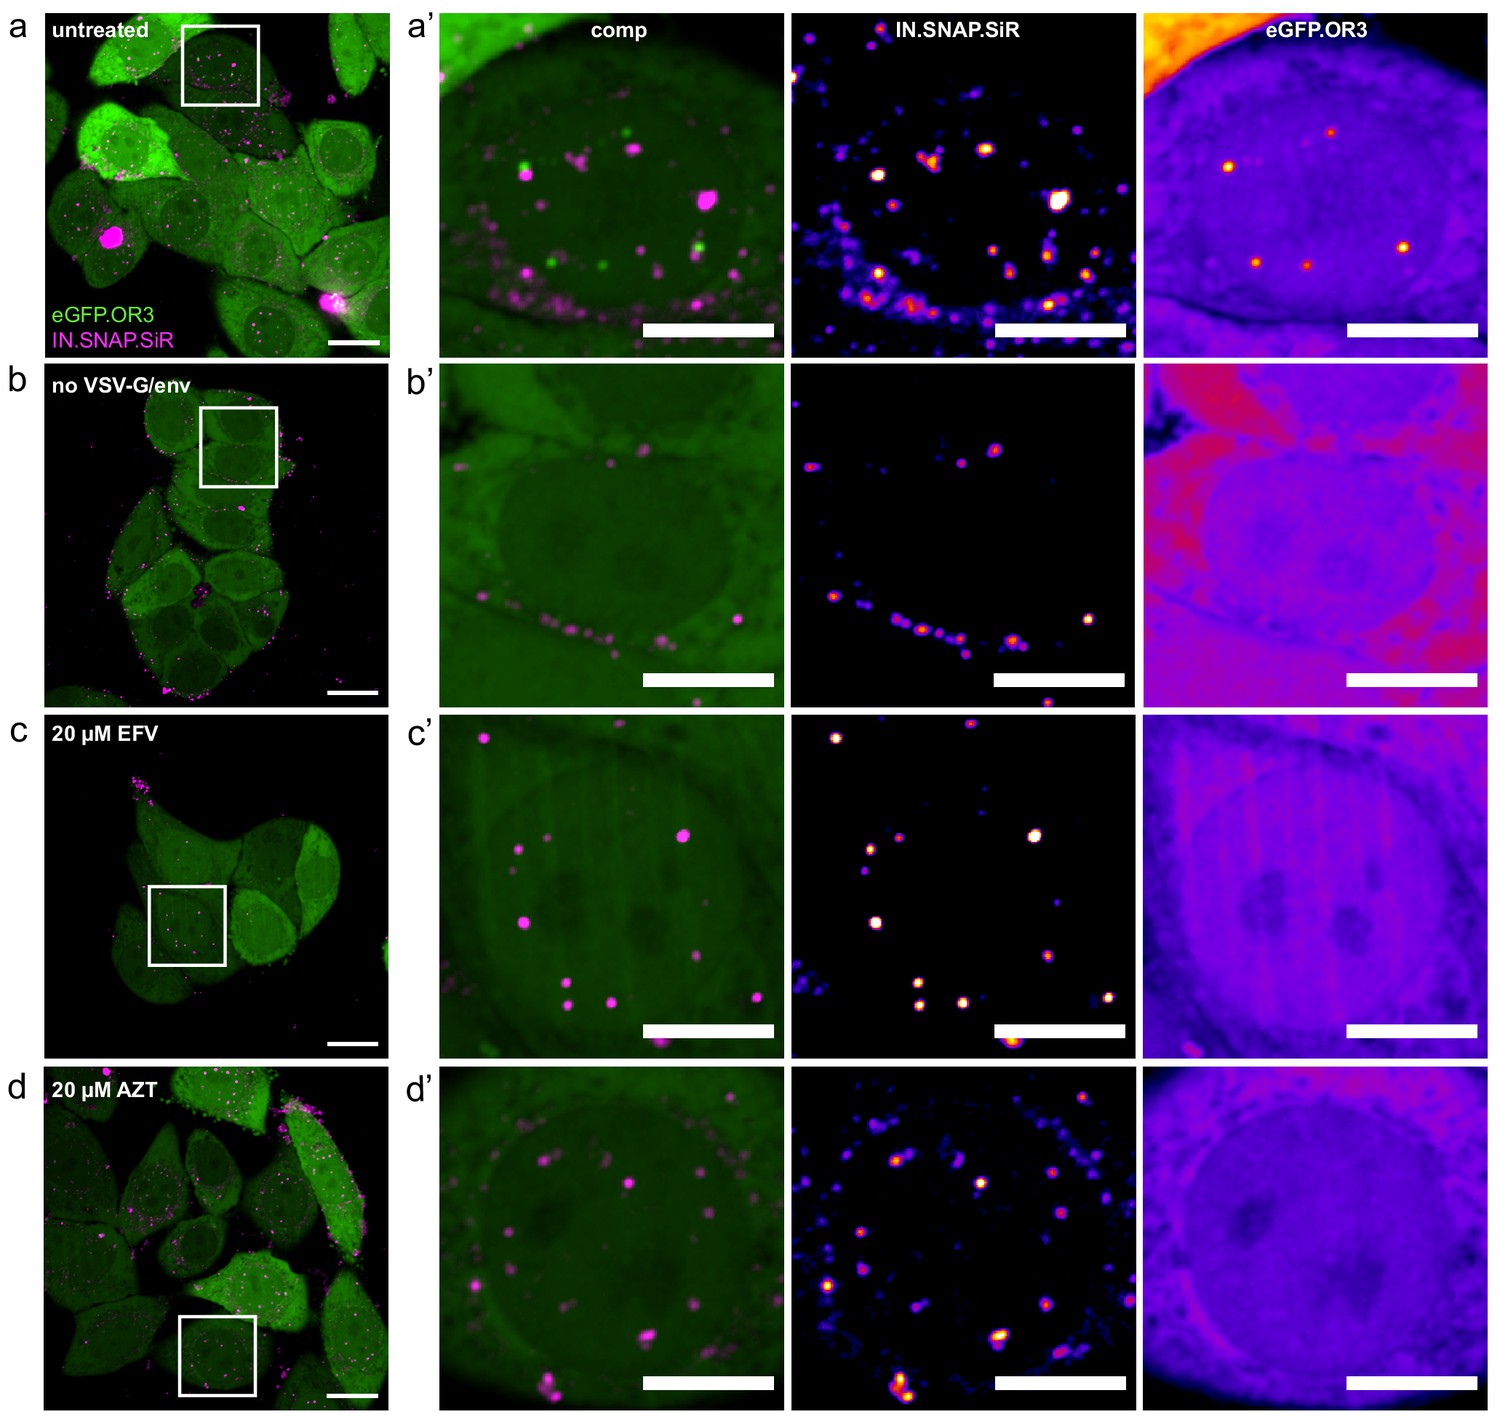
Representative images from control experiments.
Experimental details as in Figure 1f. FOVs (a–d) and boxed enlargements (a’–d’) from untreated samples (a and a’), addition of fusion-incompetent virus (b and b’), samples treated with 20 µM EFV (c and c’) and 20 µM AZT (d and d’). Scale bars: 20 µm (a–d), 10 µm (a’–d’).
Figure 1—video 1
Live cell imaging of viral DNA punctae formation in TZM-bl cells.
Related to Figure 1g and h. While the figure shows raw data (only mean filtered), for the movie 3D stacks were denoised using CARE and rendered in napari (see Material and methods for details). The movie is a composite of eBFP2.LMNB1 (magenta) and eGFP.OR3 (green). Scale bar: 5 µm and time in hr:min post infection.
Figure 2 with 1 supplement
Viral cDNA in cytosolic complexes does not recruit OR3 proteins and contains less DNA compared to nuclear complexes.
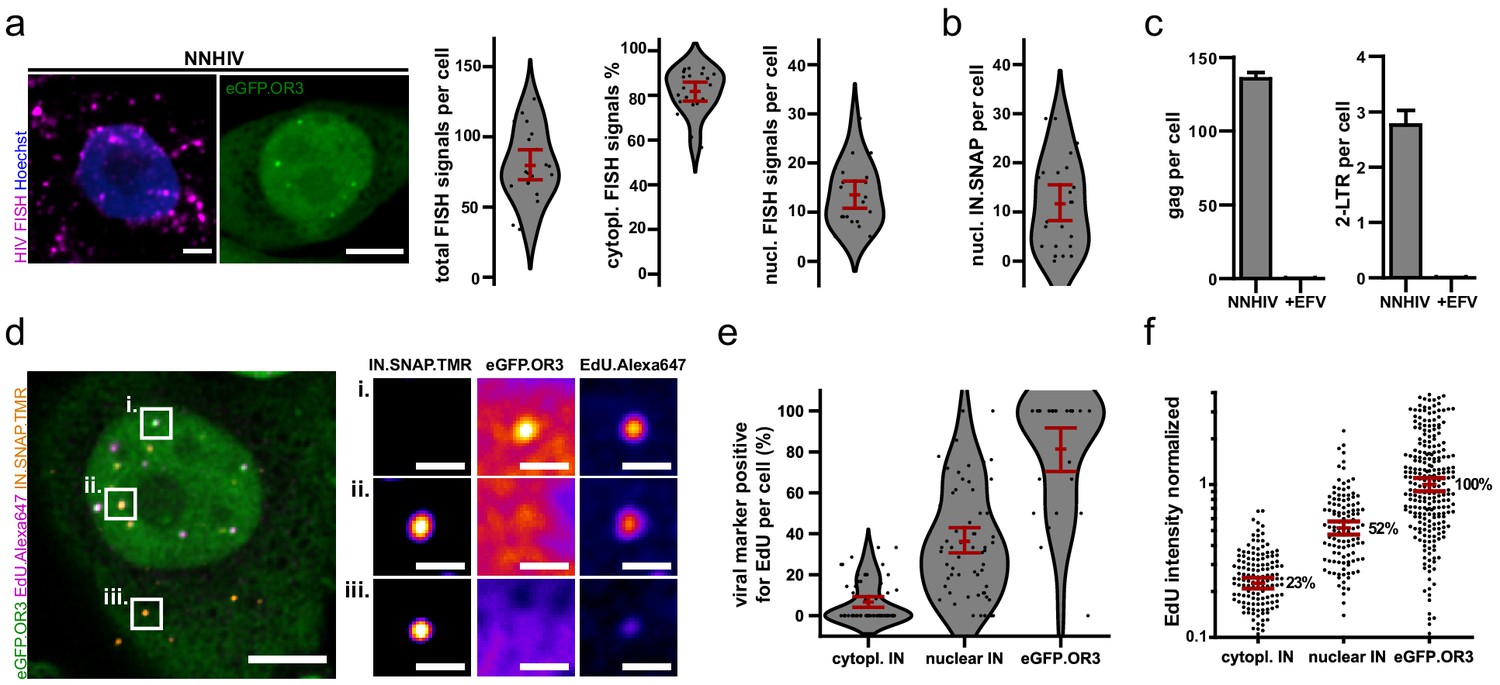
(a) HIV FISH staining of TZM-bl cells infected with VSV-G pseudotyped NNHIV ANCH (10 µU/RT cell; 24 h p.i.). A cell showing nuclear eGFP.OR3 signals from a different experiment is shown for comparison (two left panels). Scale bars: 5 µm. Quantification of the total number of FISH signals per cell, the percentage of cytoplasmic FISH signals and the total number of nuclear FISH signals per cell (right panels). The number of background nuclear FISH signals in uninfected cells (from prior HIV LTR integrations in the TZM-bl cell line) was subtracted from infected cells. Data points represent individual cells and error bars 95 % CI. (b) Quantification of nuclear IN.SNAP signals per cell. TZM-bl eBFP2.LMNB1 eGFP.OR3 cells were infected with VSV-G pseudotyped NNHIV ANCH (10 µU/RT cell; 24 h p.i.). Data points represent individual cells and error bars 95 % CI. (c) ddPCR quantification of late RT products (gag region; left panel) and 2-LTR circles (right panel). TZM-bl cells were infected using the same amount of VSV-G pseudotyped NNHIV ANCH (10 µU RT/cell, 24 h p.i.) as in Figure 1f, (a and b). Mean and SEM of one experiment performed in biological triplicates are shown. (d) TZM-bl eBFP2.LMNB1 and eGFP.OR3 expressing cells were infected with VSV-G pseudotyped and IN.SNAP.TMR labeled NNHIV ANCH (30 µU RT/cell) in the presence of EdU. Cellular DNA synthesis was blocked by aphidicolin (APC). At 24 h p.i. cells were fixed and click labeled. Two independent experiments were performed in biological triplicates. A 2 µm MIP of a representative cell and three enlarged single z slices are shown. See Figure 2—figure supplement 1 for more examples. Scale bars: 5 µm (MIP) and 1 µm (enlargements). (e,f) Quantification of data from the experiment described in (d). Pooled data from one experiment performed in biological triplicates are shown, with data points representing individual cells (e) or subviral complexes (f); error bars represent 95 % CI. (e) Percentage of EdU-positive viral marker spots (IN or OR3) per cell. (f) Intensity of EdU signals associated with the respective viral marker. Data were normalized to the mean signal of eGFP.OR3 punctae. Differences are statistically significant (p<0.0001; two-tailed Student’s t-test).
-
Figure 2—source data 1
Data corresponds to the total FISH signals per cell, percent of cytoplasmic FISH signal, number of nuclear FISH signals per cell (Figure 2a) and number of nuclear IN.SNAP signals per cell (Figure 2b), the percentages of EdU-positive subviral structures per cell (Figure 2e) and the normalized (to the geometrical mean EdU intensity of eGFP.OR3 objects) intensities of EdU per cell localized at different subviral structures (Figure 2f).
- https://cdn.elifesciences.org/articles/64776/elife-64776-fig2-data1-v2.xlsx
Figure 2—figure supplement 1
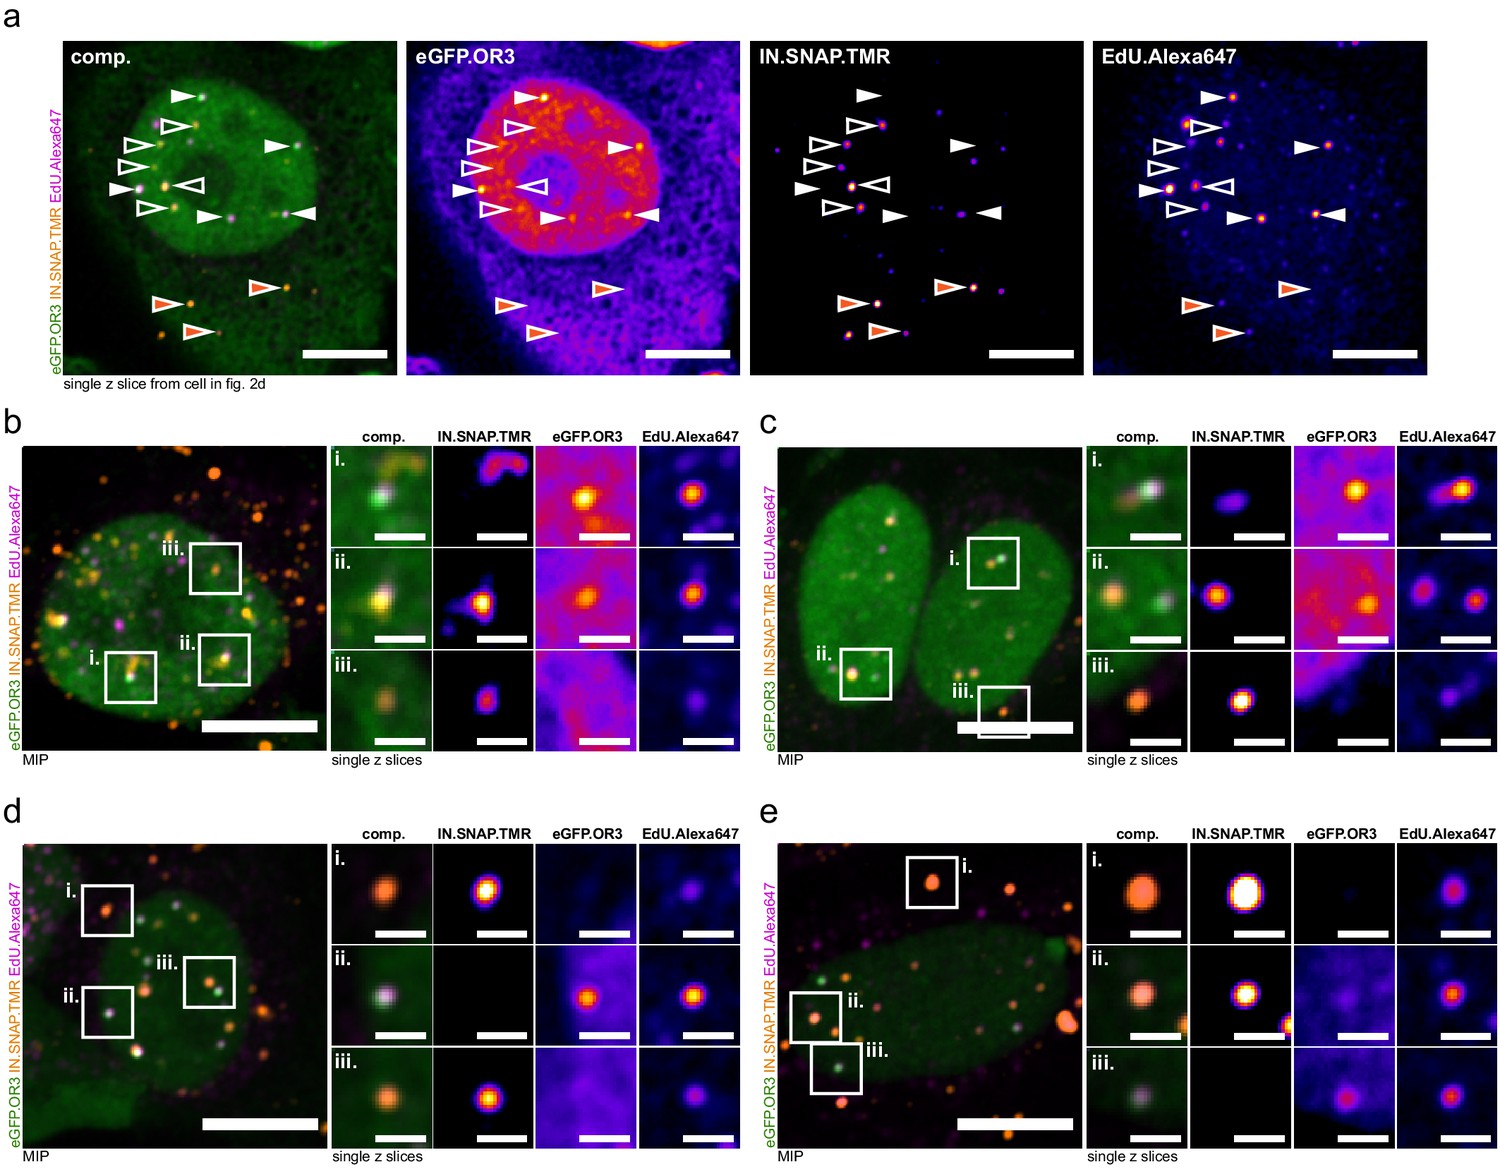
Exemplary images of newly synthesized DNA content in subviral complexes.
Experimental details and quantification see Figure 2d–f. (a) A single z slice of the whole cell in Figure 2d is shown. Filled white arrows indicate eGFP.OR3 objects, empty white arrows indicate nuclear IN.SNAP objects and filled orange arrows point at cytoplasmic IN.SNAP objects. Scale bars: 10 µm. (b–e) Overview MIP and three enlarged single z slices of additional representative cells. Scale bars: 10 µm (overviews) and 2 µm (enlargements).
Figure 3 with 4 supplements
Separation of viral cDNA from IN marker within the nucleus.
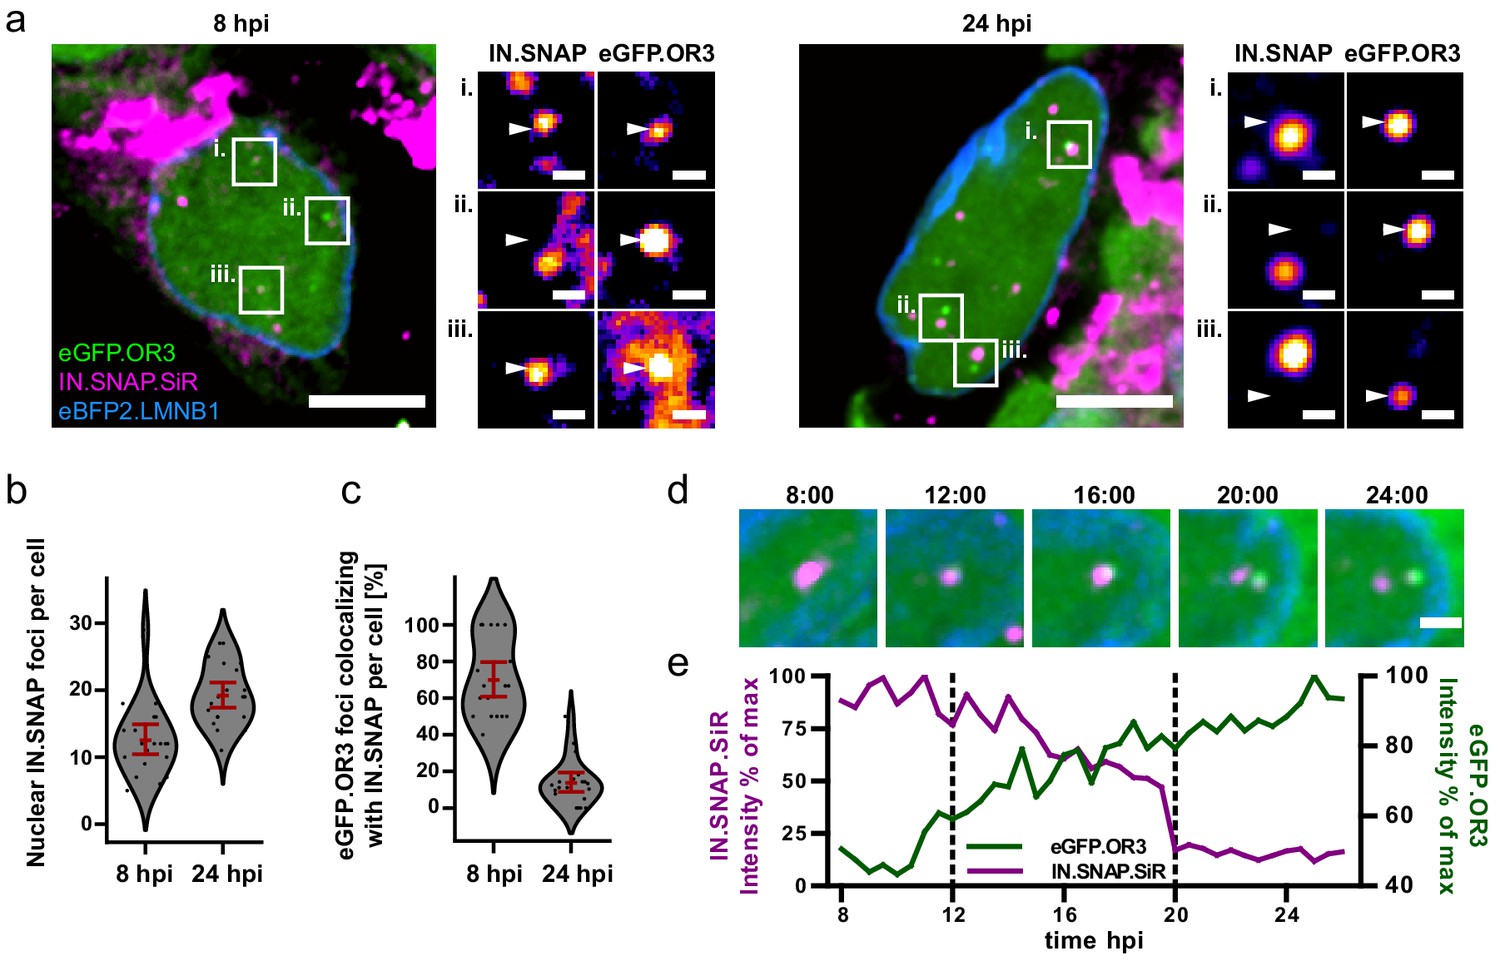
(a) TZM-bl eBFP2.LMNB1 eGFP.OR3 cells were infected with VSV-G pseudotyped and IN.SNAP.SiR- labeled NNHIV ANCH particles (30 µU RT/cell), fixed at 8 and 24 h.p.i as indicated and imaged by SDCM. A 1 µm MIP of a representative cell and three enlarged single z slices are shown. Scale bars: 10 µm (MIP) and 1 µm (enlargements). The nuclear background of eGFP.OR3 was subtracted in enlargements for clarity. The figure shows representative images from one of three independent experiments. See Figure 3—figure supplement 1 for control samples. (b) Number of nuclear IN.SNAP punctae/cell detected at the indicated time p.i.; 13 ± 3 punctae/cell (8 h p.i.; ±95 % CI) and 19 ± 2 punctae/cell (24 h p.i.; ±95 % CI). Error bars represent 95 % CI. (c) eGFP.OR3 and IN.SNAP co-localization observed over time; 70 ± 11% (8 h p.i.; ±95 % CI) and 14 ± 6% (24 h p.i.; ±95 % CI). Error bars represent 95 % CI. (d) Live imaging of IN.SNAP.SiR (magenta) and eGFP.OR3 (green) signal separation within the nucleus. eBFP2.LMNB1 is shown in blue. The figure shows individual frames from Figure 3—video 1 (4.5 µm MIP) recorded at the indicated times (h:min p.i.). Scale bar: 2 µm; one of three independent experiments. Also see Figure 3—video 2. (e) Relative intensities of IN.SNAP.SiR and eGFP.OR3 fluorescence detected at the eGFP.OR3 focus in (d). The plot comprises data corresponding to the position of the respective IN.SNAP focus recorded before the appearance of eGFP.OR3 (8–11 h p.i.). The area between the dotted lines corresponds to the period of colocalization between the major parts of the IN.SNAP signal and the eGFP.OR3 signal. See Figure 3—figure supplement 2 for another example.
-
Figure 3—source data 1
Data corresponds to the number of IN.SNAP.SiR punctae per cell nucleus (Figure 3b) and the percent colocalization of eGFP.OR3 punctae with IN.SNAP.SiR per cell nucleus (Figure 3c).
- https://cdn.elifesciences.org/articles/64776/elife-64776-fig3-data1-v2.xlsx
Figure 3—figure supplement 1
Different TZM-bl cell lines infected with different particles.
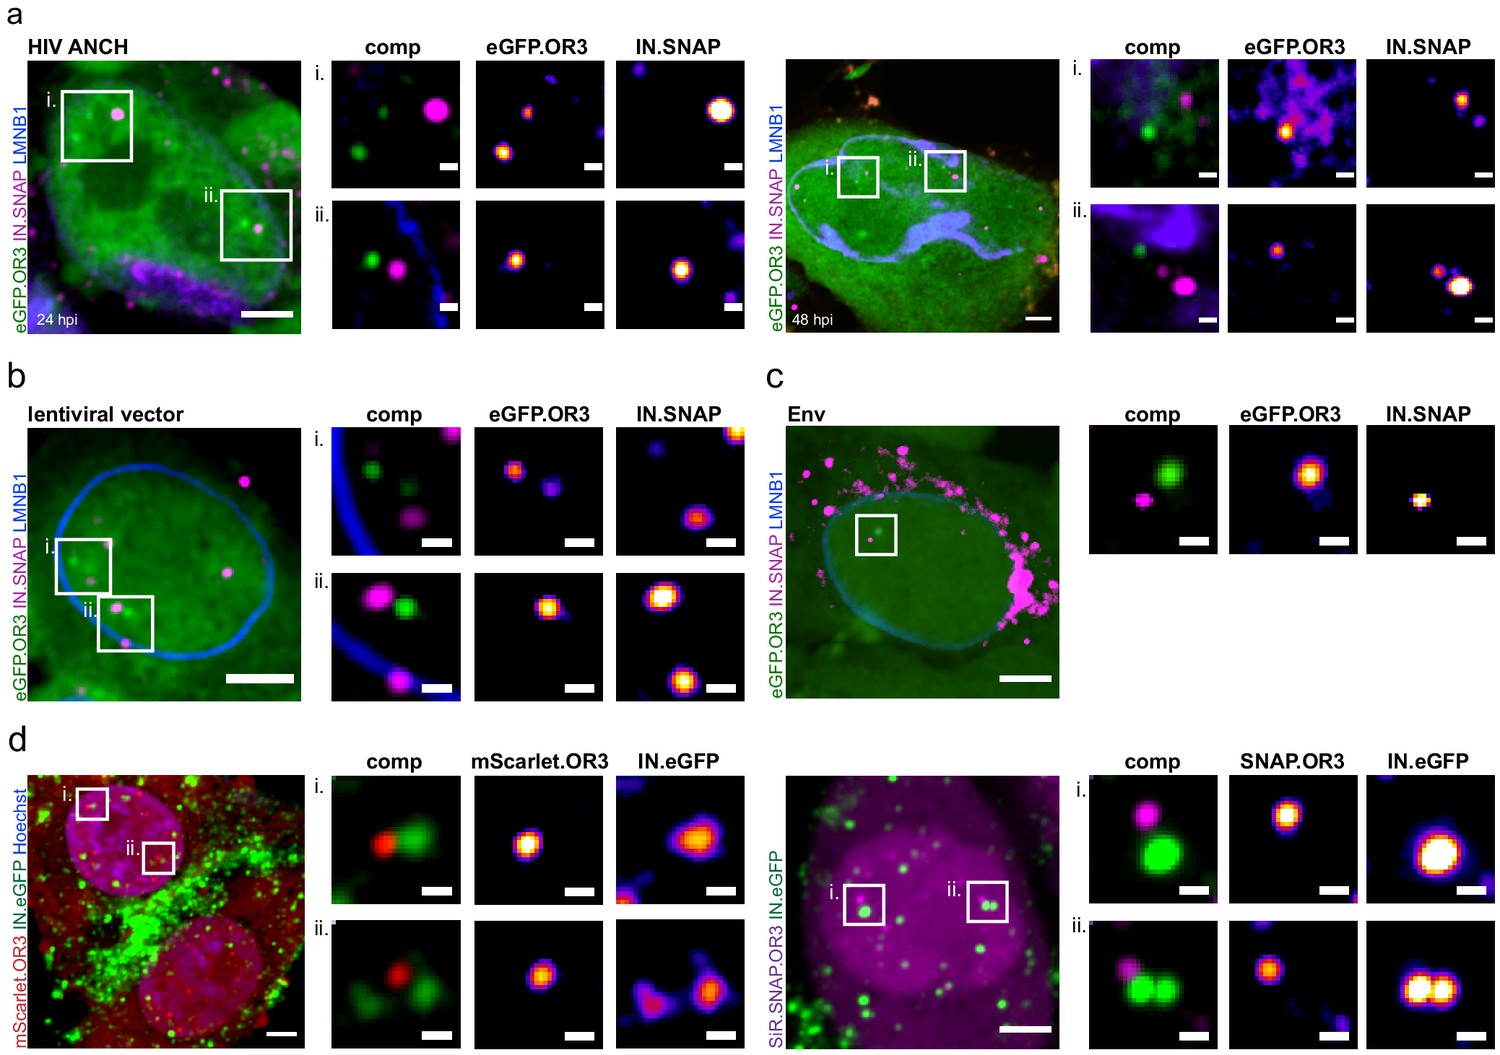
Infection was performed using 30 µU RT/cell of the following viral particles for 24 h p.i.: Integration competent HIV-1NL4-3 ANCH (a), an integration competent lentiviral vector (b), NNHIV ANCH (c,d) pseudotyped with HIV-1 Env fusion protein instead of VSV-G (c) or with an inversion of the fluorescent proteins used (d). Separation between IN-FP and eGFP.OR3 was observed in all cases. In enlargements OR3 background has been subtracted for clarity. Scale bars: 5 µm (overview) and 1 µm (enlargements); single z plane (a), 2.5 µm z-projection (a-c, d right panel), z-projection of entire nucleus (d left panel).
Figure 3—figure supplement 2
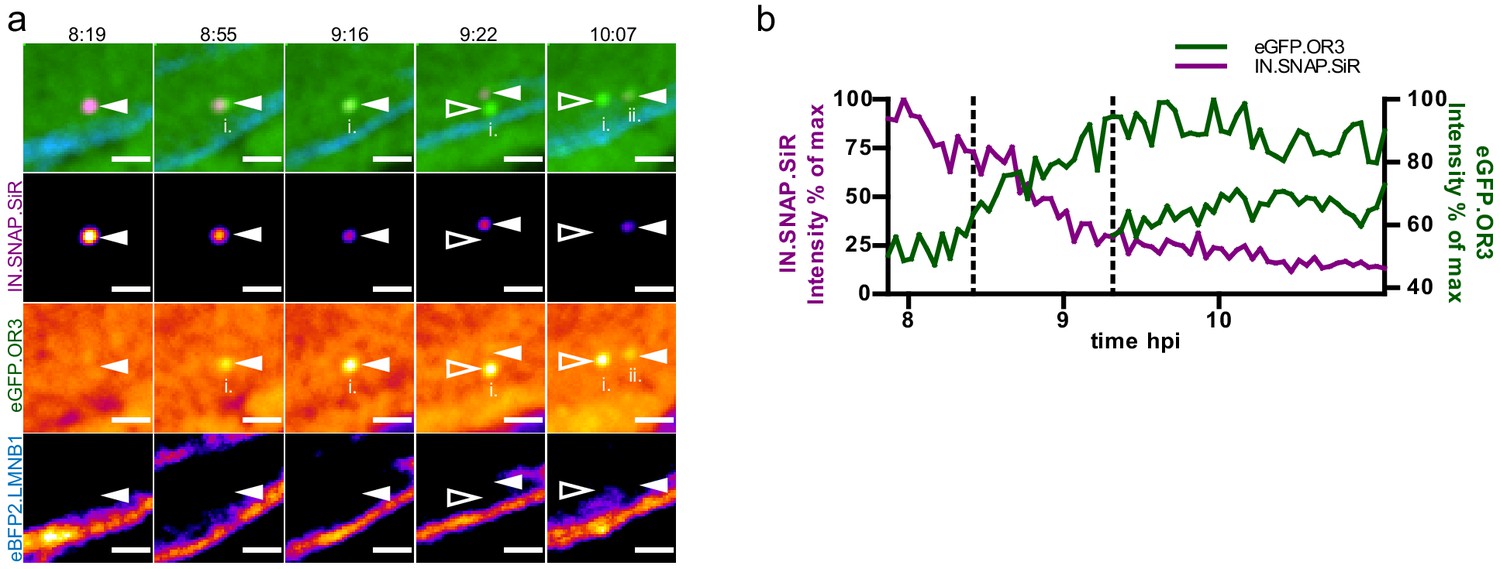
Additional example of live imaging separation data.
(a) Live imaging of IN.SNAP.SiR (magenta) and eGFP.OR3 (green) signal separation within the nucleus. eBFP2.LMNB1 is shown in blue. The figure shows individual single z frames from Figure 3—video 1 (MIP) recorded at the indicated times (h:min p.i.; dt = 3 min). Scale bars: 2 µm (b) Relative intensities of IN.SNAP.SiR and eGFP.OR3 fluorescence detected at the eGFP.OR3 focus in (a). The plot comprises data corresponding to the position of the respective IN.SNAP focus recorded before the appearance of eGFP.OR3 (<8 h p.i.). The dotted lines mark appearances of eGFP.OR3 signals.
Figure 3—video 1
Live cell imaging of eGFP.OR3 separation from IN.SNAP.
Related to Figure 3d and e. Shown is a maximum intensity projection of a cell nucleus. The movie is a composite of eBFP2.LMNB1 (blue), eGFP.OR3 (green), and IN.SNAP.SiR (magenta). Scale bar: 5 µm and time in hr:min post infection.
Figure 3—video 2
Live cell imaging of eGFP.OR3 separation from IN.SNAP.
Related to Figure 3d and e and Figure 3—figure supplement 2 Appearance of two eGFP.OR3 punctae from a single IN-FP spot. Shown is a maximum intensity projection of a nuclear particle with the nucleus at top left and the cytoplasm at the bottom right of the movie. The movie is a composite of eBFP2.LMNB1 (blue), eGFP.OR3 (green), and IN.SNAP.SiR (magenta). Scale bar: 2 µm and time in hr:min post infection.
Figure 4 with 2 supplements
HIV-1 CA complexes can enter the nucleus of non-dividing HeLa derived cells through intact NPCs.
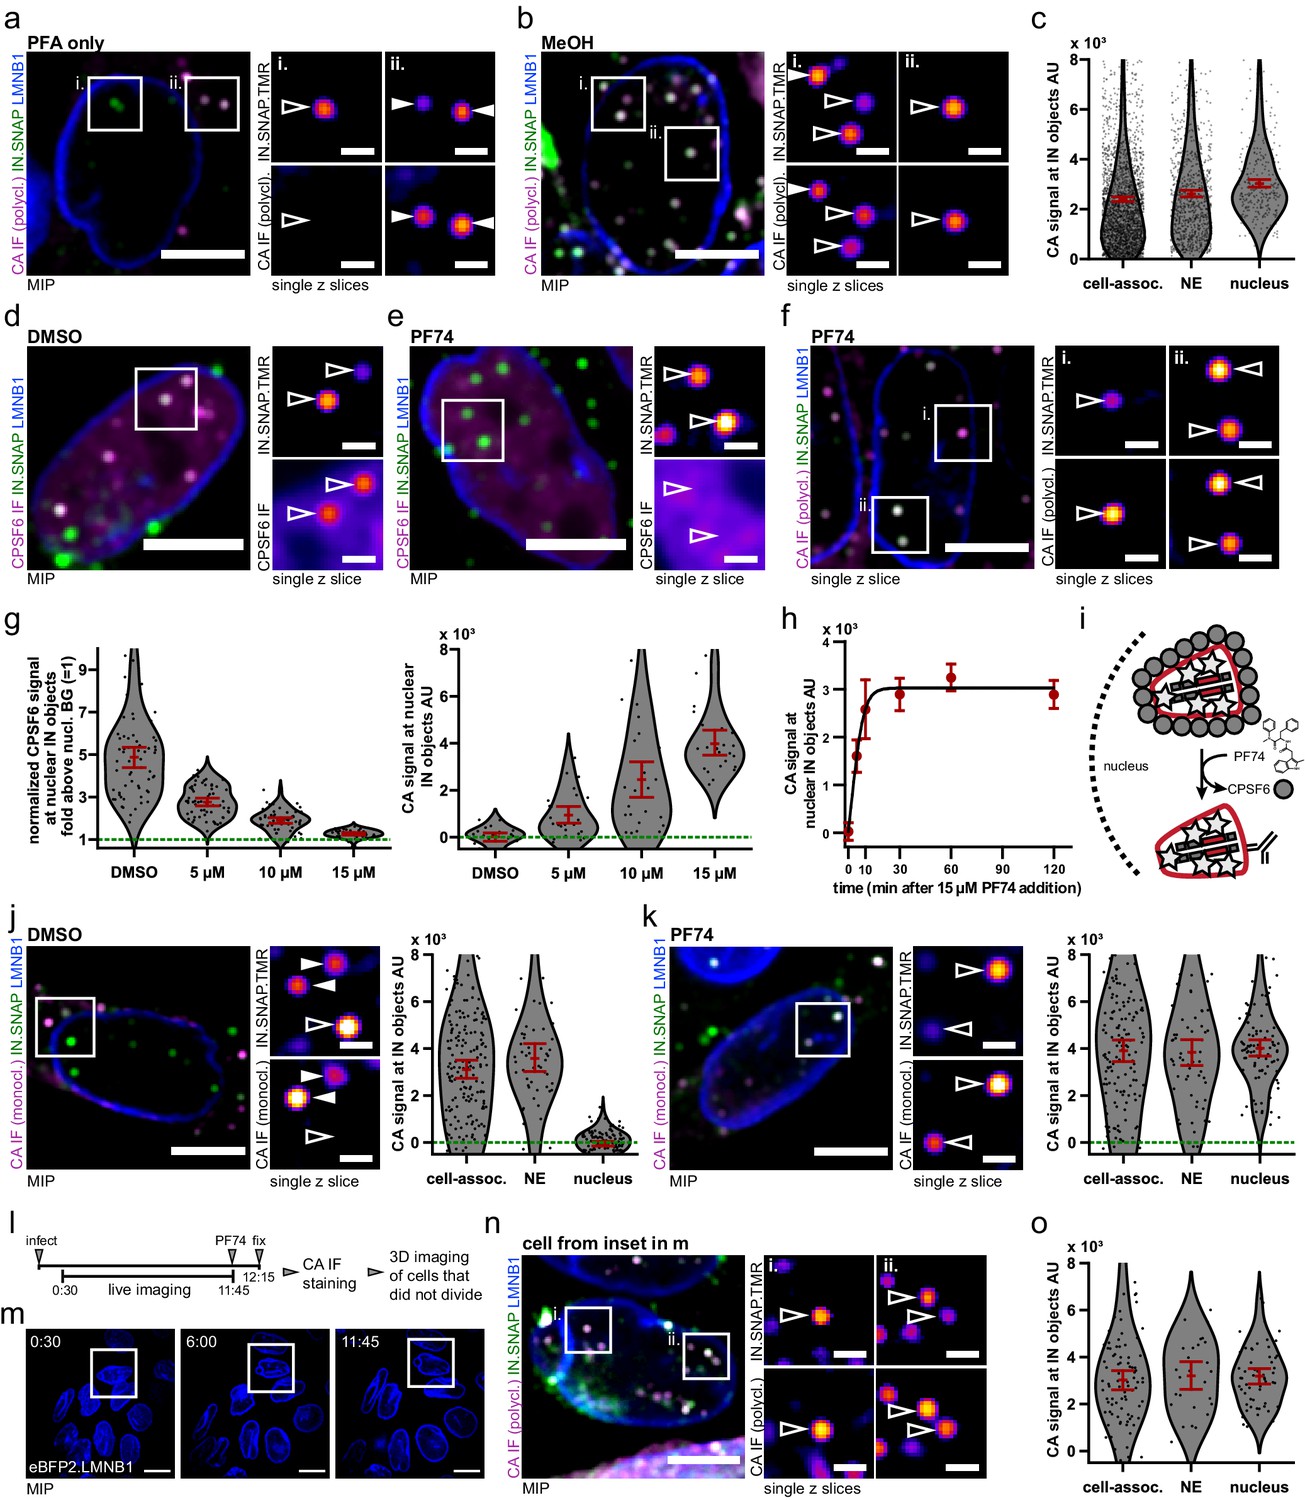
(a–c) IF detection of HIV-1 CA in the nuclei of TZM-bl cells is dependent on extraction with methanol. Cell were infected with VSV-G pseudotyped NNHIV ANCH labeled with IN.SNAP.TMR (30 µU RT/cell), fixed at 24 h p.i. using PFA only (a) or extracted using methanol after PFA fixation (b–c). Data from one of three independent experiments are shown. (c) Quantification of CA intensities at IN.SNAP.TMR objects. Dots represent individual subviral complexes localized at the cytosol/plasma membrane (cell-assoc.), the NE or the nucleus; error bars represent 95 % CI. Cells from five fields of view were analyzed (n = 2610, 932, and 286 particles, respectively). Cells had been treated with APC at the time of infection to inhibit division. (d–i) PF74-mediated displacement of CPSF6 enables detection of nuclear CA in TZM-bl cells. Infection as in (a) for 24 hr followed by 2 hr incubation with DMSO (d) or 15 µM PF74 (e–f) or the indicated amount of drug or solvent (g–h) (see Figure 4—figure supplement 1a–b). (g) Quantification of nuclear CPSF6 (left panel, n = 215 particles) and nuclear CA (right panel, n = 97 particles) signals at IN.SNAP objects upon treatment with indicated amounts of PF74. CPSF6 signals were normalized to the diffuse nuclear background expression (green line). Dots represent individual subviral complexes localized inside the nucleus; error bars represent 95 % CI. (h) Time course of PF74-mediated CA signal appearance. Shown is the mean CA signal at nuclear IN.SNAP objects with error bars indicating 95 % CI fit to a four-parameter logistic equation (as in Figure 1h; n = 252 particles) (i) Scheme of PF74-mediated CPSF6 displacement. (j–k) TZM-bl cells were infected as in (f) and treated with DMSO (j) or PF74 (k) but stained using a monoclonal CA antibody (71-31) (Figure 4—figure supplement 1c–d). Graphs show quantification of CA intensities with dots representing individual subviral complexes localized at the cytosol/plasma membrane (cell-assoc.), the NE or the nucleus; error bars represent 95 % CI (n = 200, 56, 113 particles, respectively (j); n = 163, 63, 89 particles, respectively (k)). (l–o) Detection of nuclear CA in non-dividing cells. TZM-bl eBFP2.LMNB1 cells were infected as in (c) in the presence of 6 µM APC and live imaging in the eBFP2.LMNB1 channel was initiated recording one frame every 15 min. After 11 hr 45 min cells were treated with 15 µM PF74 for 30 min and then fixed, processed for immunostaining and imaged as in (f). Only cells that had not undergone division were analyzed. The figure shows representative images of one of two independent experiments performed in biological duplicates. (l) Scheme of experiment (see Figure 4—figure supplement 1e–f). (m) MIP of exemplary frames from one movie. None of the cells in the FOV displayed nuclear envelope breakdown and mitosis (see Figure 4—video 1). Scale bars: 20 µm. (n) IF detection of nuclear CA signals in the cell boxed in (m). 1 µm MIP and two enlarged z slices are shown. (o) Quantification of CA intensities in the subset of non-dividing TZM-bl cells at IN.SNAP.TMR objects. Dots represent individual subviral complexes localized at the cytosol/plasma membrane (cell-assoc.), the NE or the nucleus; error bars represent 95% CI (n = 97, 27, 57 particles, respectively). Scale bars: 10 µm (overviews) and 2 µm (enlargements). Filled arrowheads point at cytoplasmic particles and open arrowheads at nuclear particles.
-
Figure 4—source data 1
Data corresponds to the CA IF intensities of IN.SNAP objects at different localizations within the cell (Figure 4c), the CPSF6 and CA IF intensities of nuclear IN.SNAP objects treated with different PF74 concentrations for 2 hr (Figure 4g), the CA IF intensities of nuclear IN.SNAP objects treated with 15 µM PF74 for different durations (Figure 4h), the CA IF intensities of IN.SNAP objects at different localizations within the cell after DMSO or PF74 treatment stained with a monoclonal antibody (71-31) (Figure 4j–k) and the CA IF intensities of IN.SNAP objects at different localizations within cell that have not divided (Figure 4o).
- https://cdn.elifesciences.org/articles/64776/elife-64776-fig4-data1-v2.xlsx
Figure 4—figure supplement 1
Either methanol extraction or PF74 mediated CPSF6 displacement are sufficient to expose CA epitopes for antibody staining in HeLa-derived cells.
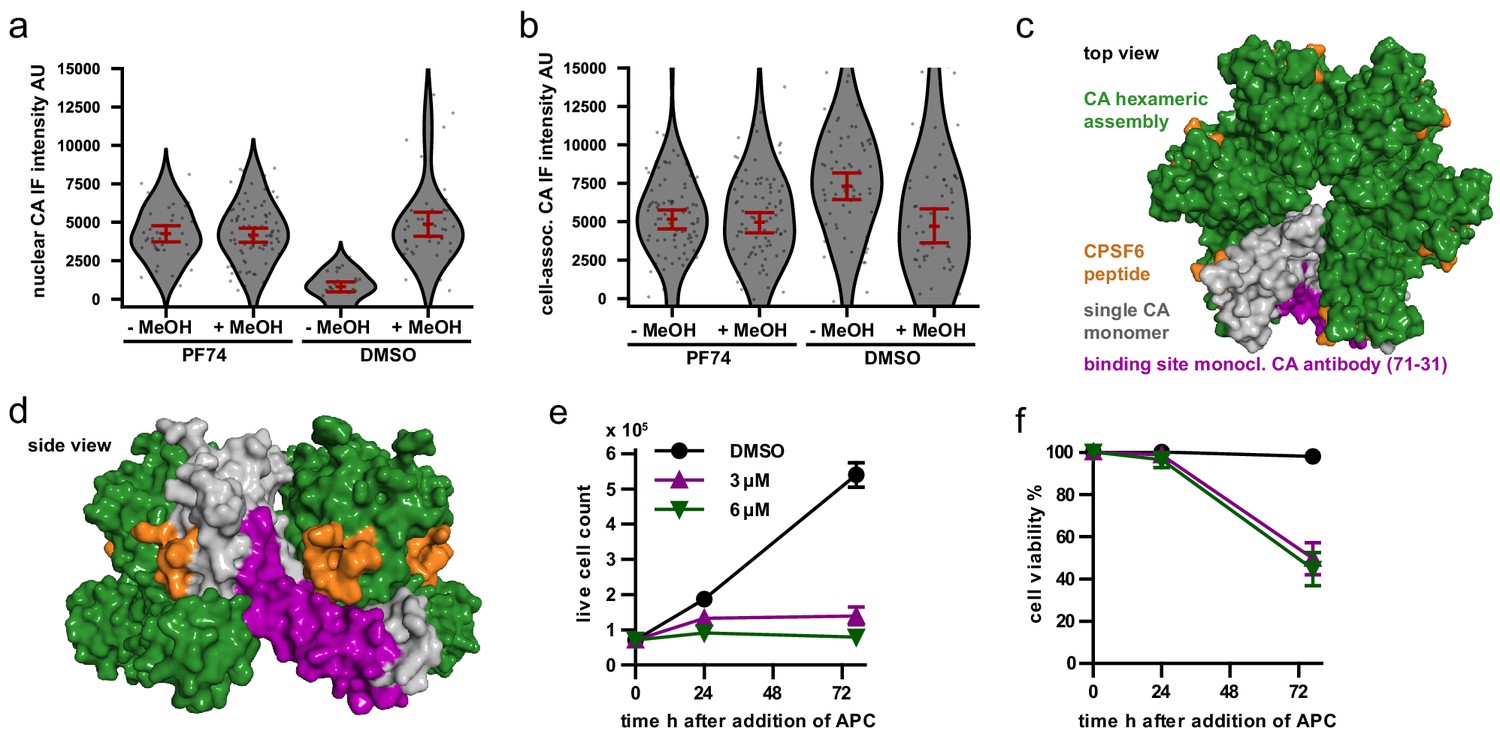
(a–b) TZM-bl cells were infected with VSV-G pseudotyped NNHIV ANCH labeled with IN.SNAP.TMR (30 µU RT/cell) for 24 hr and subsequently treated with either 15 µM PF74 or DMSO for 2 hr. Cells were then PFA-fixed and either methanol-extracted (ice-cold, 10 min) or directly immunostained, and CA intensities at extranuclear (a; n = 307 particles) or nuclear (b; n = 200 particles) IN.SNAP.TMR objects were quantified. Dots represent individual subviral complexes; error bars represent 95 % CI. (c,d) Surface rendered structure of a top view (c) or side view (d) of the hexameric CA assembly (pbd: 4u0a; Price et al., 2014) indicating a single CA monomer (gray) and the a bound CPSF6-peptide (organge). The epitope of the monoclonal anti CA antibody (71-31) is shown in magenta. (e–f) TZM-bl cells were treated with DMSO, 3 µm APC or 6 µm APC for 24–72 hr and the number of live cells (e) or the cell viablity (f) was determined in biological triplicates.
-
Figure 4—figure supplement 1—source data 1
Data corresponds to the CA IF intensities of IN.SNAP objects at different localizations within the cell (Figure 4—figure supplement 1a,b).
- https://cdn.elifesciences.org/articles/64776/elife-64776-fig4-figsupp1-data1-v2.xlsx
Figure 4—video 1
Live cell imaging of nuclear integrity in TZM-bl cells.
Related to Figure 4l–o. Shown is a maximum intensity projection (of three 2 µm spaced z slices) of cells expressing eBFP2.LMNB1 (blue) recorded every 15 min. Scale bar: 20 µm and time in hr:min post infection.
Figure 5 with 1 supplement

HIV-1 capsids cluster within the nucleus of HeLa derived cells.
(a) STED nanoscopy of CA accumulation at diffraction limited spots. Shown are four examples of nuclear CA and OR3 signals. TZM-bl eBFP2.LMNB1 and eGFP.OR3 cells were infected using VSV-G pseudotyped NNHIV ANCH labeled with IN.SNAP.TMR (30 µU RT/cell) and fixed at 24 h p.i.; bottom panel shows STED microscopy of CA signals. Scale bars: 500 nm (b) Intensity profiles measured along the dashed white line in (a) normalized to the respective maximal value. Magenta, CA intensities in STED mode; dashed magenta, CA intensities in confocal mode; green, eGFP.OR3 intensities in confocal mode. (c) Electron tomography of NNHIV capsids detected in the nucleus. eGFP.OR3 expressing TZM-bl cells were infected with VSV-G pseudotyped NNHIV ANCH labeled with IN.SNAP.SiR (30 µU RT/cell) and high pressure frozen at 24 h p.i. Left and middle panels show slices through a tomographic reconstruction at the position within the nucleus correlated to an IN.SNAP spot (negative for eGFP.OR3). Arrowheads point to two closely associated cone-shaped structures where the wide end of one cone is oriented toward the narrow end of the other cone. Scale bar: 100 nm. The right panel shows the segmented and isosurface rendered structure of these cones. Magenta, capsid; green, nucleic acid containing replication complex. See Figure 5—video 1. (d) STED nanoscopy of SNAP.OR3 expressing TZM-bl cells infected with VSV-G pseudotyped NNHIV ANCH (30 µU RT/cell) and fixed at 24 h p.i. Shown is a selection of eight nuclear SNAP.OR3 signals stained with O6-benzylguanine (BG)-SiR for 30 min prior fixation and analyzed by STED nanoscopy. Note that nuclear background of SNAP.OR3 has been subtracted for clarity. Scale bars: 300 nm.
Figure 5—video 1
CLEM-ET analysis, segmentation, and rendering of nuclear capsid cone clustering in an infected HeLa-derived cell.
Related to Figure 5c. Morphology of clustered capsid-related structures observed at the position indicated by an IN.SNAP.SiR signal lacking mScarlet.OR3 signal.
Figure 6 with 3 supplements
CLEM-ET analysis of IN and OR3 punctae inside the nucleus of infected HeLa-derived cells.
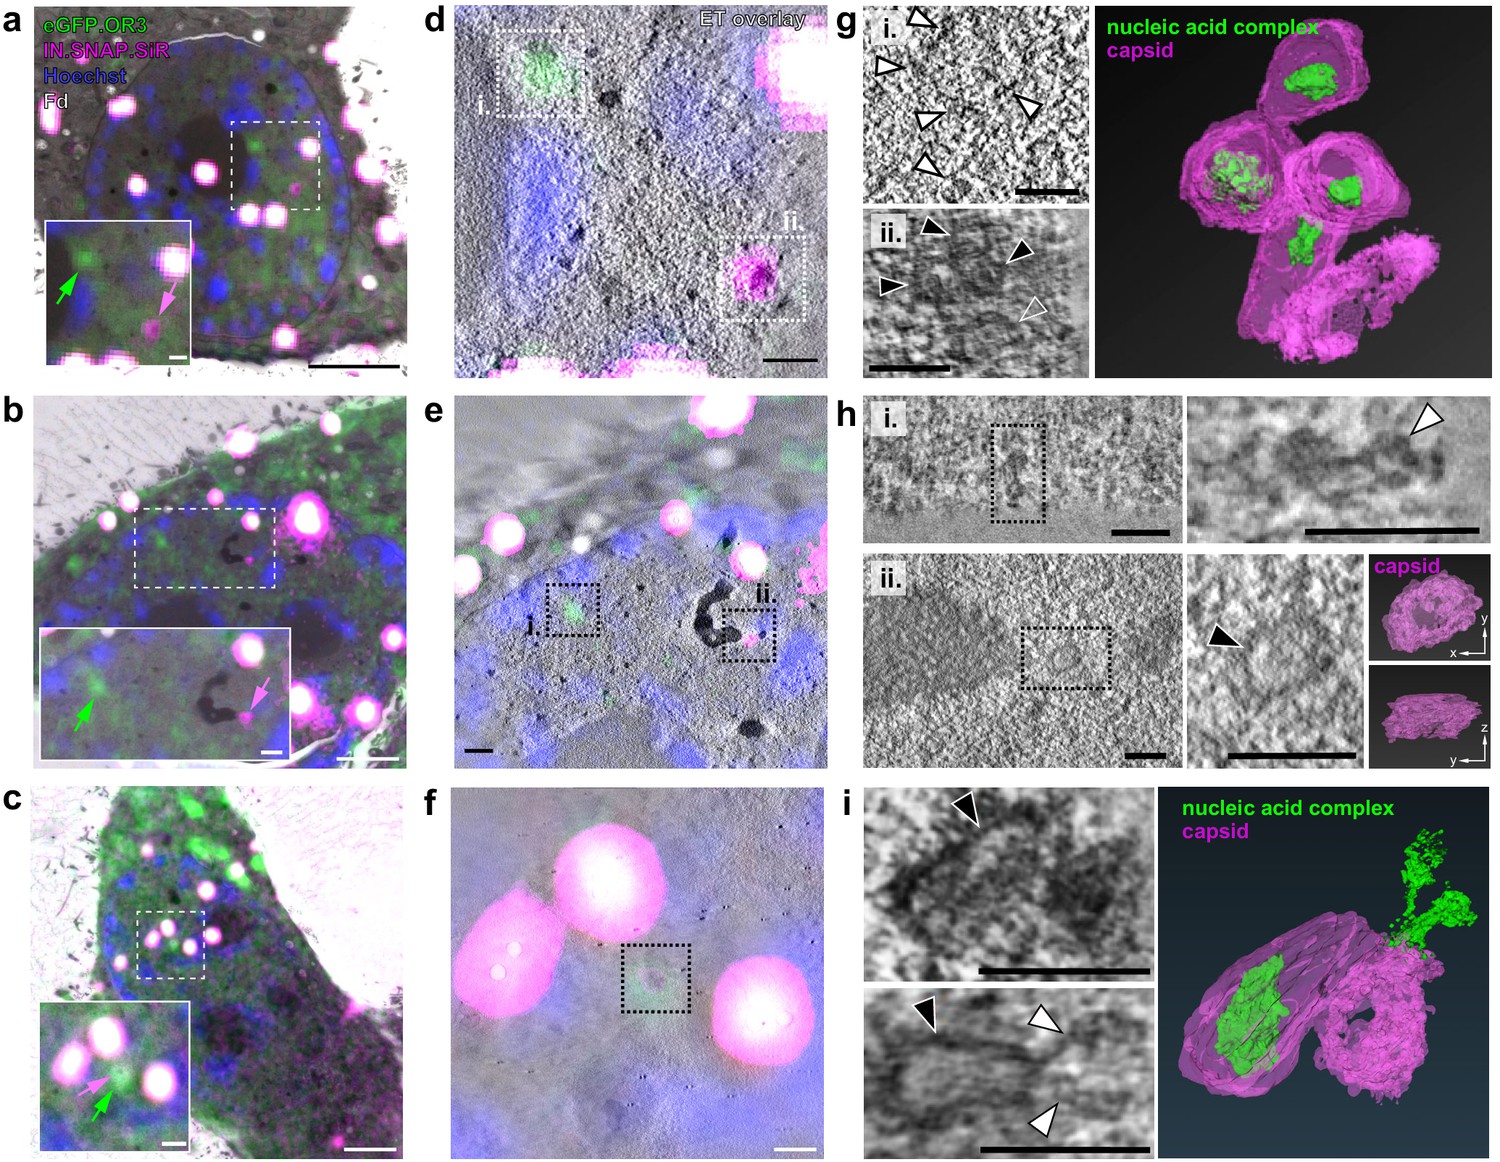
TZM-bl cells expressing mScarlet.OR3 were infected with VSV-G pseudotyped and IN.SNAP.SiR-labeled NNHIV ANCH (30 µUnits RT/cell). At 24 h p.i., cells were cryo-immobilized by high pressure freezing, freeze substituted and further processed for CLEM and ET. (a–c) CLEM overlays (with enlargements) of EM sections of cells expressing mScarlet.OR3 (green), infected with NNHIV ANCH IN.SNAP.SiR (magenta), post-stained with Hoechst (blue) and decorated with multi-fluorescent fiducials (Fd; white) for correlation. Positions of intranuclear spots positive for mScarlet.OR3 (green arrows) and IN.SNAP.SiR (magenta arrows) are indicated. Enlargements of area in dashed boxes is shown at the lower left of each panel. (d–f) CLEM-ET overlay of regions enlarged in (a–c). (g–i) Computational slices from tomographic reconstructions at the correlated positions boxed in (d–f). (g) Top panel (i.), white arrowheads point to a filamentous structure corresponding to an mScarlet.OR3 (and IN.SNAP negative) spot boxed in (d; i. - green arrow in (a)). Bottom panel (ii.), black arrowheads indicate capsid-reminiscent structures and the open arrowhead indicates a remnant-like tubular structure lacking internal density correlating to the IN.SNAP.SiR spot boxed in (d; ii. - magenta arrow in (a)). The right panel shows the segmented and isosurface rendered structures shown in (d; ii.). See Figure 6—video 1. (h) Top panels show a chromatin-like density (white arrowhead), consisting of apparently linked globular structures, correlating to the mScarlet.OR3-positive and IN.SNAP.SiR-negative spot boxed in (e; i.). Lower panels show the morphology of an empty open structure (black arrowhead) correlating to the IN.SNAP.SiR positive, mScarlet.OR3 negative spot boxed in (e; ii.). The right panels show the segmented and isosurface rendered structure shown in (e; ii.). (i) Morphology of structures clustering at the position indicated by co-localizing mScarlet.OR3 and IN.SNAP.SiR spots boxed in (f). Top left, black arrowhead indicates an apparently intact capsid with density inside the cone. Bottom left, the black arrowhead indicates an apparently empty cone-like structure. Note an elongated density (white arrowhead) protruding from the narrow end of the cone. The right panel shows the segmented and isosurface rendered structures shown on the left. See Figure 6—video 2. Scale bars: 2.5 µm for overviews (a–c), 500 nm for enlargements (a–c), 250 nm (d–f), and 100 nm (g–i). See Figure 6—figure supplement 1 for a gallery of all visualized capsid structures.
Figure 6—figure supplement 1
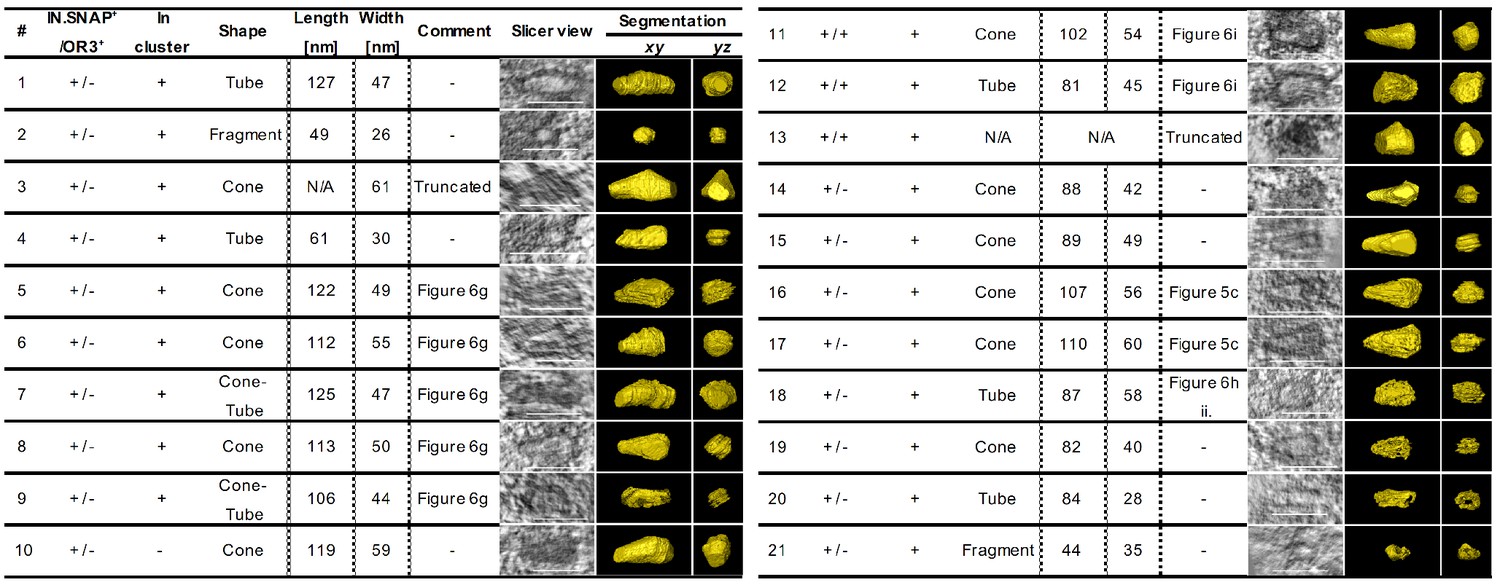
Overview of viral capsid structures captured by CLEM-ET inside the nucleus of infected HeLa-derived cells.
Indicated is the positivity (+) of structures for IN.SNAP.SiR (IN.SNAP+), mScarlet.OR3 (OR3+) and clustering with other structures. ‘Truncated’ indicates that only a partial structure was covered within the resin section. Capsid-related structures are shown as tomographic slices or manually segmented and isosurface rendered views (yellow). Scale bars: 100 nm.
Figure 6—video 1
CLEM-ET analysis, segmentation and rendering of IN-positive (and OR3-negative) structures in an infected HeLa-derived cell.
Related to Figure 6g ii. Morphology of clustered capsid-related structures observed at the position indicated by an IN.SNAP.SiR signal lacking mScarlet.OR3 signal.
Figure 6—video 2
CLEM-ET analysis, segmentation, and rendering of IN- and OR3-positive structures in an infected HeLa-derived cell.
Related to Figure 6i. Morphology of clustered capsid-related structures observed at the position indicated by co-localizing mScarlet.OR3 and IN.SNAP.SiR.
Figure 7 with 2 supplements

HIV DNA separates from IN/CA/CPSF6-positive structures in primary CD4+ T cells and MDM.
(a) Activated CD4+ T cells were transduced with a lentiviral vector expressing eGFP.OR3. After 48 hr, cells were infected using VSV-G pseudotyped NNHIV ANCH labeled with IN.SNAP.SiR (30 µU RT/cell) for 24 hr before fixation and methanol extraction (as in Figure 4a–b). Arrowheads indicate the positions of a nuclear (left, open white) and cytoplasmic (bottom, blue) IN.SNAP particle as well as a nuclear eGFP.OR3 focus (right, filled white). A representative image of one of three independent experiments is shown. Scale bars: 5 µm. See Figure 7—figure supplement 1 for SupT1 cells. (b–f) Addition of PF74 (15 µM) after nuclear import enables immuno-detection of strong CA signals in CD4+ T cells. Activated primary CD4+ T cells were infected using VSV-G pseudotyped NNHIV ANCH IN.mScarlet or IN.SNAP.SiR (30 µU RT/cell). PF74 or DMSO was added after 5 or 22 hr for another 2 hr prior to fixation and methanol extraction. Shown is one of two independent experiments performed with cells from three different blood donors. (b) PF74 displaces CPSF6 from IN spots. Shown are single z slices from cells fixed at 24 h p.i. and immunostained for CPSF6. Scale bars: 3 µm (c) Quantification of CPSF6 intensity at IN spots. IN objects were segmented in 3D data sets. The CPSF6 mean intensity of these volumes was quantified as described in Materials and methods. Dots represent single subviral complexes and error bars represent 95 % CI. (d) PF74 enables CA IF detection at IN spots. Shown are single z slices from cells fixed at 24 h p.i. and immunostained for HIV-1 CA (see Figure 7—figure supplement 2). Scale bars: 3 µm. (e–f) Quantification of CA intensities at IN spots at 7 hr (e) and 24 hr (f) p.i. IN-positive objects were segmented in 3D. The CA mean intensity of these volumes was quantified and normalized to the CA intensity of IN-positive objects located on glass in DMSO-treated samples. Error bars represent 95 % CI. P values of differences between DMSO and PF74 treatments (two-tailed Student’s t-test): glass = 1.000 (e, not significant (ns)), 1.000 (f, ns); cell-assoc.=0.2684 (e, ns), 0.9427 (f, ns); NE = 0.7884 (e, ns), 0.7514 (f, ns); nucleus = <0.0001 (e, significant),<0.0001 (f, significant). (g) CA-positive structure colocalizing with IN and vDNA markers inside the nucleus of CD4+ T cells. PF74 was added for 2 hr prior to fixation at 24 h p.i. Nuclear background of OR3 was subtracted in enlargements for clarity (in g–i). Shown is a single z slice, scale bars: 5 µm (overview) and 1 µm (enlargement). (h) CPSF6 remains colocalized with the IN signal. Shown is a single z slice, scale bars: 5 µm (overview) and 2 µm (enlargement). (i) MDM were transduced using a Vpx containing eGFP.OR3 expressing lentiviral vector. After 72 h cells were infected using VSV-G pseudotyped NNHIV IN.mScarlet (120 µU RT/cell), fixed and imaged at 24 h p.i. Shown is a 4 µm maximum intensity projection. Scale bar: 5 µm. Enlargements represent a single z slice; scale bars: 2 µm.
-
Figure 7—source data 1
Data corresponds to the normalized (to the nuclear expression) CPSF6 intensities of IN.SNAP.SiR objects (Figure 7c), and to the normalized (to the mean intensity of glass-bound particles of the DMSO sample) CA intensities of IN.SNAP.SiR objects at different locations at 7 h p.i. (Figure 7e) and at 24 h p.i. (Figure 7f).
- https://cdn.elifesciences.org/articles/64776/elife-64776-fig7-data1-v2.xlsx
Figure 7—figure supplement 1
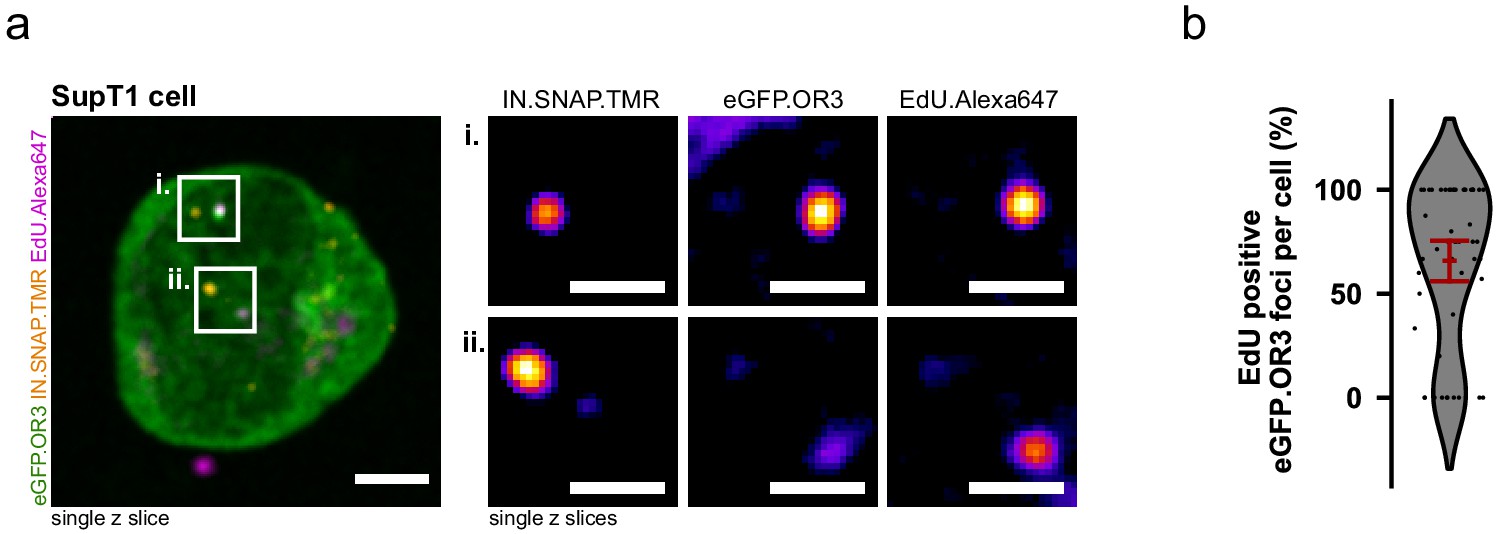
ANCHOR system adopted to the T cell line SupT1.
(a) SupT1 cells expressing eGFP.OR3 were infected with 30 µU RT/cell VSV-G pseudotyped NNHIV ANCH in the presence of APC and EdU, fixed and click labeled at 24 h p.i. A similar separation between IN-FP and eGFP.OR3 as in TZM-bl cells was observed. In enlargements the nuclear background of eGFP.OR3 has been subtracted for clarity. Scale bars: 5 µm (overview) and 1 µm (enlargement). (b) Quantification of EdU-positive nuclear eGFP.OR3 spots per cell. Pooled data from biological triplicates are shown, error bar represents 95 % CI.
-
Figure 7—figure supplement 1—source data 1
Data corresponds to the number of eGFP.OR3 objects and percent of EdU-positive eGFP.OR3 objects per cell nucleus (Figure 7—figure supplement 1b).
- https://cdn.elifesciences.org/articles/64776/elife-64776-fig7-figsupp1-data1-v2.xlsx
Figure 7—figure supplement 2
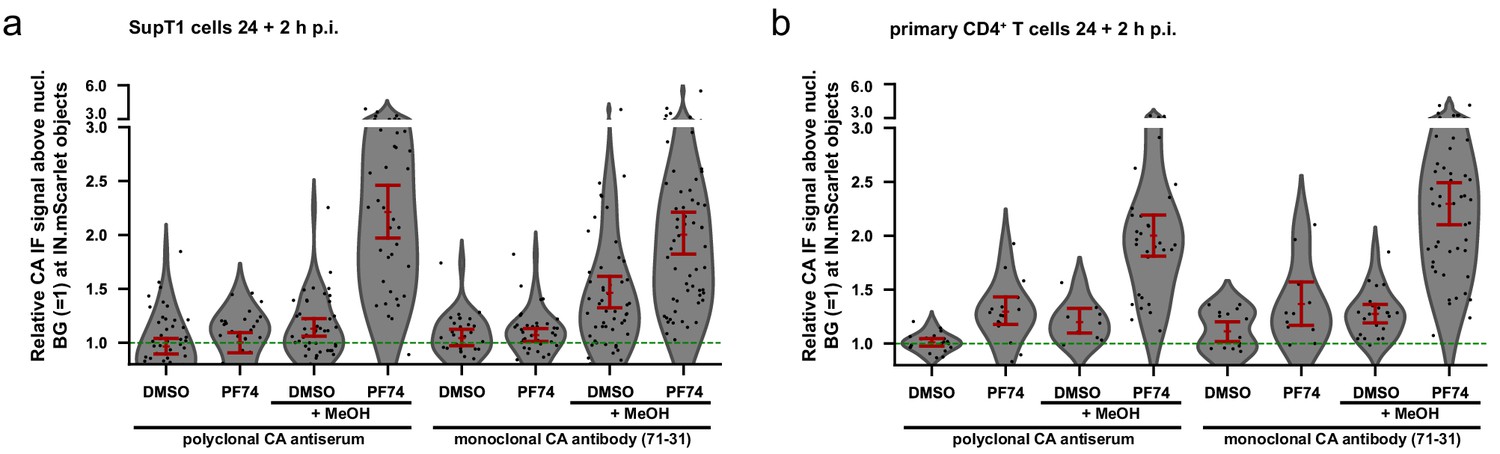
Efficient detection of nuclear CA in T cells depends on the combination of PF74 treatment with methanol extraction.
SupT1 cells (a) or primary CD4 +T cells (b) were infected with 18 µU RT/cell (MOI ~25) (a) or 30 µU RT/cell (MOI ~1) (b) VSV-G pseudotyped NNHIV ANCH IN.mScarlet and after 24 hr treated with eiter 15 µM PF74 to displace CPSF6 or DMSO for 2 hr. Cells were then either fixed with PFA and directly immunostained or PFA-fixed, MeOH extracted and subsequently immunostained. Staining was performed with a polyclonal CA antiserum or the monoclonal 71–31 CA antibody. Nuclear IN.mScarlet objects of cells in 5–20 different fields of view were segmented and the respective CA signals measured. Each dot corresponds to a nuclear subviral particle. Error bars represent 95 % CI.
-
Figure 7—figure supplement 2—source data 1
Data corresponds to the CA IF intensities of nuclear IN.mScarlet objects with different treatments in SupT1 cells (Figure 7—figure supplement 2a) and primary CD4+ T cells (Figure 7—figure supplement 1b).
- https://cdn.elifesciences.org/articles/64776/elife-64776-fig7-figsupp2-data1-v2.xlsx
Figure 8
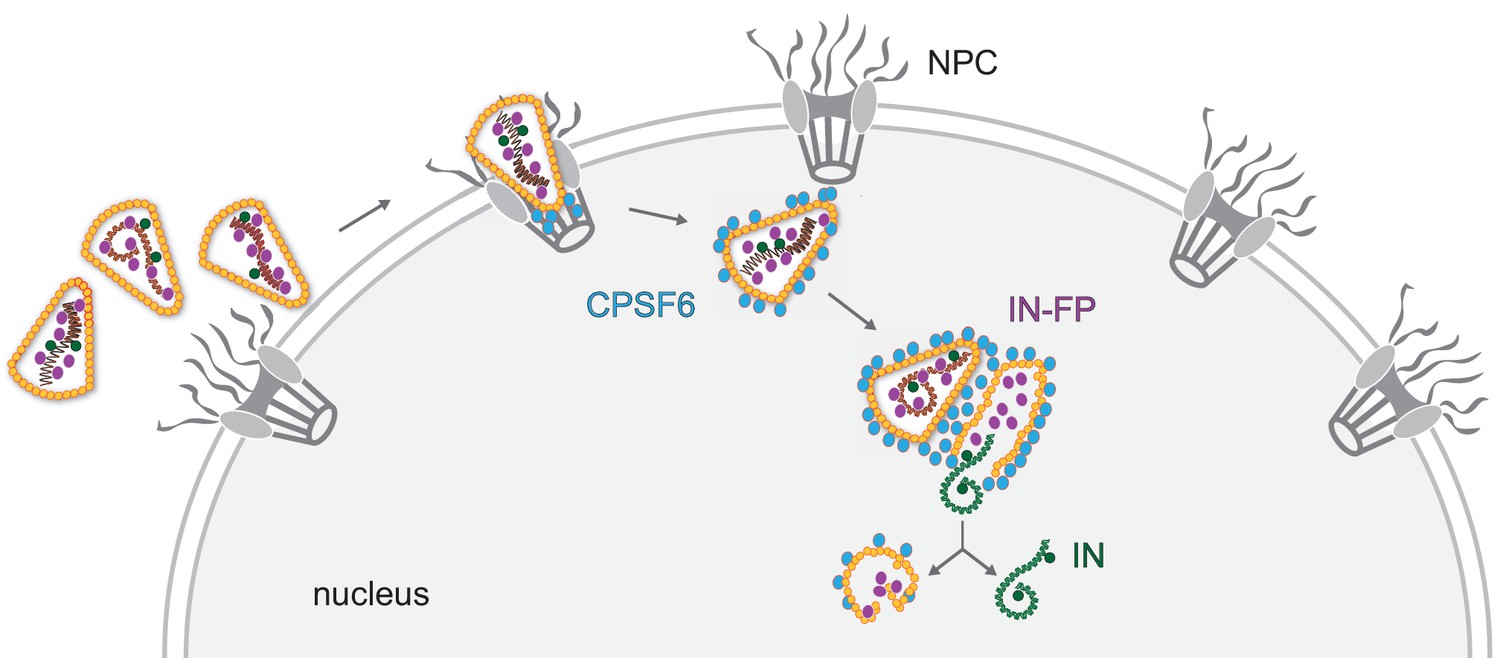
Model of HIV-1 nuclear entry and uncoating.
Apparently intact HIV capsids are imported into the nucleus through nuclear pore complexes retaining their cone-shaped morphology. CPSF6 releases the cores from the NPC and clusters on nuclear capsids. Multiple capsids accumulate at certain positions within the nucleus, and plus strand synthesis of the viral double-stranded cDNA is completed in the nucleus. Physical disruption of the capsid releases the completed cDNA into the nucleoplasm, where it becomes integrated into the host cell genome in the vicinity of the uncoating site. Empty remnants of the broken capsid, associated with incorporated viral proteins that are not part of the cDNA complex, remain as distinct structures in the nucleus for prolonged times after uncoating.
Tables
Key resources table
| Reagent type (species) or resource | Designation | Source or reference | Identifiers | Additional information |
|---|---|---|---|---|
| Antibody | Anti-HIV-1 CA (rabbit polyclonal) | In-house; Bejarano et al., 2019; doi:10.7554/eLife.41800 | - | IF (1:1000) |
| Antibody | Anti-HIV-1 CA 71–31 (human monoclonal) | NIH ARP; Gorny et al., 1989; doi:10.1073/pnas.86.5.1624 | NIH:ARP-530 | IF (1:500) |
| Antibody | Anti-hCPSF6 (rabbit polyclonal) | Atlas Antibodies | Cat#:HPA039973 RRID:AB_10795242 | IF (1:500) |
| Antibody | Anti-hLamin A/C (mouse monoclonal) | Santa Cruz Biotech. | Cat#:sc-7292 RRID:AB_627875 | IF (1:100); works for HeLa cells and MDM |
| Antibody | Anti-hLaminB1 (mouse monoclonal) | Santa Cruz Biotech. | Cat#:sc-365962 | IF (1:200); works for SupT1 and primary CD4+ T cells |
| Antibody | Alexa Fluor 405, 488, 568 and 647 secondary antibodies (goat polyclonal) | Thermo Fisher Scientific | - | IF (1:1000) |
| Antibody | Anti-rabbit IgG Atto 594 (goat polyclonal) | Sigma Aldrich | Cat#:77671 | IF (1:500); STED |
| Cell line (Homo sapiens) | Hela TZM-bl | Wei et al., 2002; doi:10.1128/AAC.46.6.1896-1905.2002 | RRID:CVCL_B478 | - |
| Cell line (H. sapiens) | Embryonic kidney 293 T cells (HEK293T) | Pear et al., 1993; doi:10.1073/pnas.90.18.8392 | RRID:CVCL_0063 | - |
| Cell line (H. sapiens) | T cell line SupT1 | Smith et al., 1984; PMID:6437672 | RRID:CVCL_1714 | - |
| Cell line (H. sapiens) | TZM-bl eGFP.OR3 IRES puro | This paper | - | Polyclonal TZM-bl cell line stably expressing eGFP.OR3 |
| Cell line (H. sapiens) | TZM-bl mScarlet.OR3 IRES puro | This paper | - | Polyclonal TZM-bl cell line stably expressing mScarlet.OR3 |
| Cell line (H. sapiens) | TZM-bl SNAP.OR3 IRES puro | This paper | - | Polyclonal TZM-bl cell line stably expressing SNAP.OR3 |
| Cell line (H. sapiens) | TZM-bl eBFP2.LMNB1 IRES BLR | This paper | - | Polyclonal TZM-bl cell line stably expressing eBFP2.LMNB1 |
| Cell line (H. sapiens) | TZM-bl eBFP2.LMNB1 IRES BLR eGFP.OR3 IRES puro | This paper | - | Polyclonal TZM-bl cell line stably expressing eBFP2.LMNB1 and eGFP.OR3 |
| Cell line (H. sapiens) | SupT1 eGFP.OR3 IRES puro | This paper | - | Polyclonal SupT1 cell line stably expressing eGFP.OR3 |
| Recombinant DNA reagent | pWPI eGFP.OR3 IRES puro | This paper | - | Lentiviral transfer plasmid containing eGFP.OR3 |
| Recombinant DNA reagent | pWPI mScarlet.OR3 IRES puro | This paper | - | Lentiviral transfer plasmid containing mScarlet.OR3 |
| Recombinant DNA reagent | pWPI SNAP.OR3 IRES puro | This paper | - | Lentiviral transfer plasmid containing SNAP.OR3 |
| Recombinant DNA reagent | pWPI eBFP2.LMNB1 IRES BLR | This paper | - | Lentiviral transfer plasmid containing eBFP2.LMNB1 |
| Recombinant DNA reagent | pWPI ANCH3 IRES puro | This paper | - | Lentiviral transfer plasmid containing ANCH3 |
| Recombinant DNA reagent | NNHIV | Zila et al., 2021; doi:10.1016/j.cell.2021.01.025 | - | Integration/transcription deficient HIV-1 proviral plasmid |
| Recombinant DNA reagent | NNHIV env(s) ANCH | This paper | - | Integration/transcription deficient HIV-1 proviral plasmid containing ANCH3 |
| Recombinant DNA reagent | NLC4-3 env(s) ANCH | This paper | - | HIV-1 proviral plasmid containing ANCH3 |
| Recombinant DNA reagent | Vpr-IN.SNAP | This paper | - | Expression of labelled IN |
| Recombinant DNA reagent | Vpr-IND64N/D116N.SNAP | This paper | - | Expression of labelled IN |
| Recombinant DNA reagent | Vpr-IN.eGFP | Albanese et al., 2008; doi:10.1371/journal.pone.0002413 | - | Expression of labelled IN |
| Recombinant DNA reagent | Vpr-IND64N/D116N.eGFP | other | - | Expression of labelled IN; D. Bejarano (University Hospital Heidelberg) |
| Recombinant DNA reagent | Vpr-IN.mScarlet | Zila et al., 2021; doi:10.1016/j.cell.2021.01.025 | - | Expression of labelled IN |
| Recombinant DNA reagent | Vpr-IND64N/D116N.mScarlet | Zila et al., 2021; doi:10.1016/j.cell.2021.01.025 | - | Expression of labelled IN |
| Recombinant DNA reagent | psPAX2 | Addgene | RRID:Addgene_35002 | Lentiviral packaging vector; D. Trono (EPFL, Lausanne, Switzerland) |
| Recombinant DNA reagent | pCMV-VSV-G | Addgene | RRID:Addgene_8454 | Expression of VSV-G; B. Weinberg (Whitehead Institute, MA, USA) |
| Recombinant DNA reagent | ANCHOR system | NeoVirTech (France) | - | http://www.neovirtech.com |
| Commercial assay, kit | Click-iT EdU Alexa Fluor 647 Imaging kit | Thermo Fisher Scientific | Cat#:C10340 | - |
| Commercial assay, kit | InviTrap Spin Universal RNA Mini kit | Stratec | Cat#:1060100300 | - |
| Software, algorithm | Fiji 1.53 c | Schindelin et al., 2012; doi:10.1038/nmeth.2019 | RRID:SCR_002285 | General image analysis |
| Software, algorithm | Icy 2.0.3.0 | de Chaumont et al., 2012; doi:10.1038/nmeth.2075 | RRID:SCR_010587 | Intensity quantification, Correlation |
| Software, algorithm | Imspector 16.1.6905 | Abberior Instruments | RRID:SCR_015249 | STED data acquisition and deconvolution |
| Software, algorithm | Prism 5.01 | GraphPad Software Inc | RRID:SCR_002798 | Visualization and Plotting |
| Software, algorithm | Matplotlib 3.1.3 | Hunter, 2007; doi:10.1109/MCSE.2007.55 | RRID:SCR_008624 | Visualization and Plotting |
| Software, algorithm | Seaborn 0.10.0 | Waskom et al., 2020; doi:10.5281/zenodo.3629446 | RRID:SCR_018132 | Visualization and Plotting |
| Software, algorithm | CSBdeep 0.4.1 | Weigert et al., 2018; doi:10.1038/s41592-018-0216-7 | - | Content-aware image restoration |
| Software, algorithm | Volocity 6.3 | Perkin Elmer | RRID:SCR_002668 | Data acquisition |
| Software, algorithm | IMOD 4.9.4 | Kremer et al., 1996; doi:10.1006/jsbi.1996.0013 | RRID:SCR_003297 | Tomogram Reconstruction |
| Software, algorithm | SerialEM 3.7.9 | Mastronarde, 2005; doi:10.1016/j.jsb.2005.07.007 | RRID:SCR_017293 | Tomogram acquisition, pre-correlation |
| Software, algorithm | ec-CLEM (Icy plugin) 1.0.1.5 | Paul-Gilloteaux et al., 2017; doi:10.1038/nmeth.4170 | - | Correlation |
| Software, algorithm | Amira-Avizo Software 2019.3 | Thermo Fisher Scientific | RRID:SCR_007353 | Visualization and rendering |
| Software, algorithm | PyMol 1.3 | Schrodinger LLC | RRID:SCR_000305 | Visualization and rendering |
Additional files
Download links
A two-part list of links to download the article, or parts of the article, in various formats.
Downloads (link to download the article as PDF)
Open citations (links to open the citations from this article in various online reference manager services)
Cite this article (links to download the citations from this article in formats compatible with various reference manager tools)
HIV-1 uncoating by release of viral cDNA from capsid-like structures in the nucleus of infected cells
eLife 10:e64776.
https://doi.org/10.7554/eLife.64776


