The development of Nanosota-1 as anti-SARS-CoV-2 nanobody drug candidates
- Department of Veterinary and Biomedical Sciences, University of Minnesota, United States
- Center for Coronavirus Research, University of Minnesota, United States
- Department of Pharmacology, University of Minnesota, United States
- Department of Microbiology and Immunology, University of Iowa, United States
- Institutional Office of Regulated Nonclinical Studies, University of Texas Medical Branch, United States
- Department of Biochemistry, Molecular Biology and Biophysics, University of Minnesota, United States
- Laboratory of Viral Immunology, Lindsley F. Kimball Research Institute, New York Blood Center, United States
Figures
Figure 1 with 1 supplement
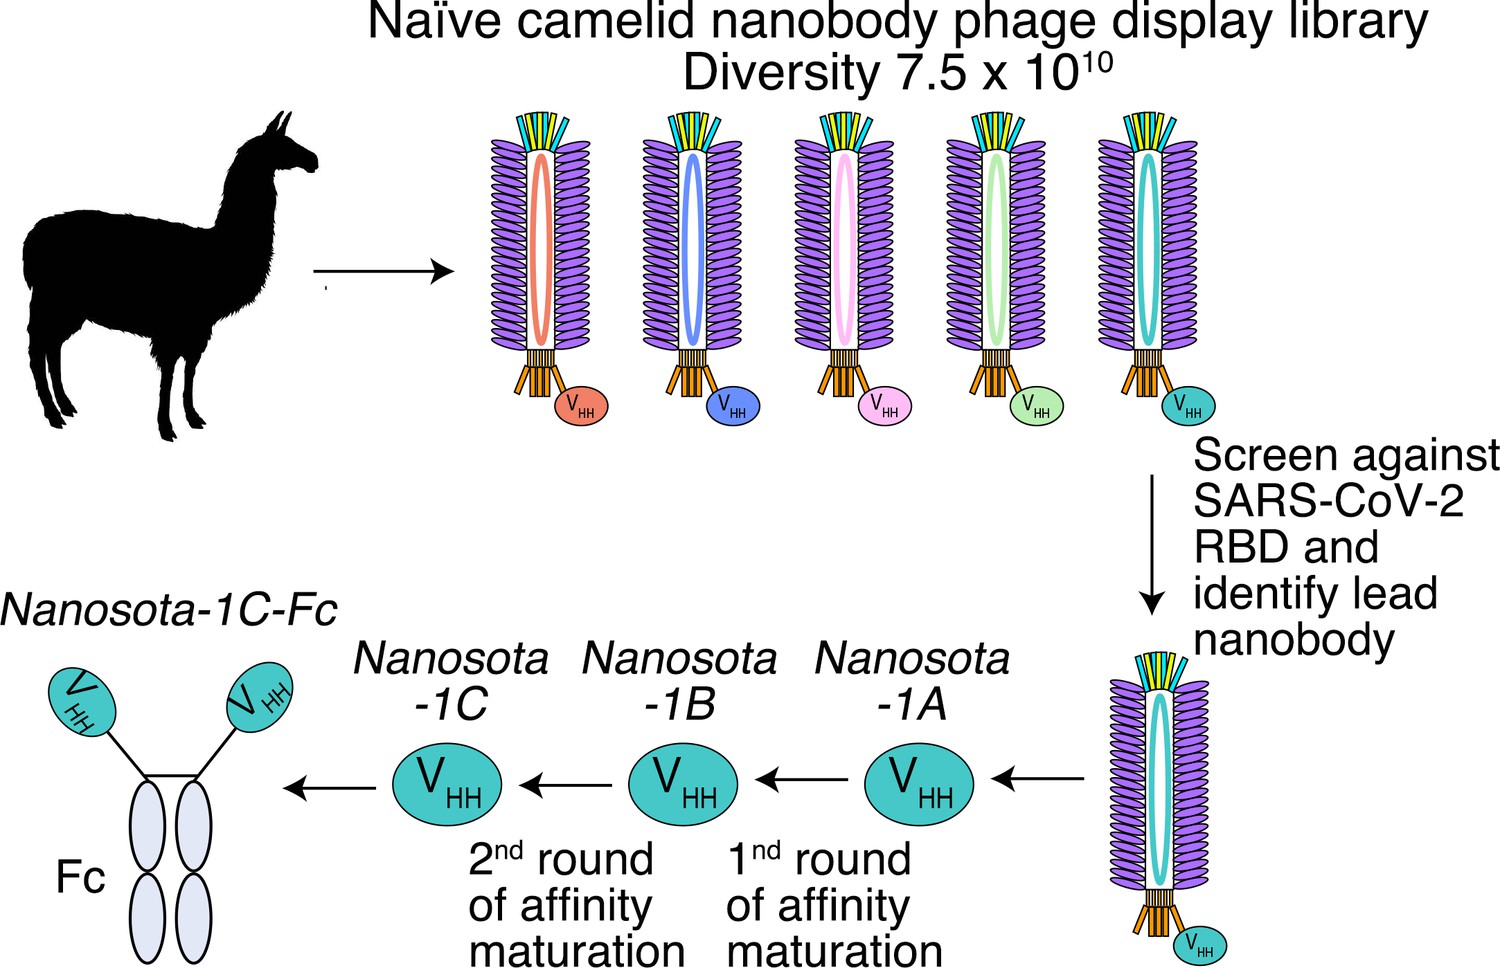
Construction of a camelid nanobody phage display library and use of this library for screening of anti-SARS-CoV-2 nanobodies.
A large-sized (diversity 7.5 x 10¹⁰) naive nanobody phage display library was constructed using B cells of over a dozen llamas and alpacas. Phages were screened for their high binding affinity for SARS-CoV-2 receptor-binding domain (RBD). Nanobodies expressed from the selected phages were further screened for their potency in neutralizing SARS-CoV-2 pseudovirus entry. The best performing nanobody was subjected to two rounds of affinity maturation.
Figure 1—figure supplement 1
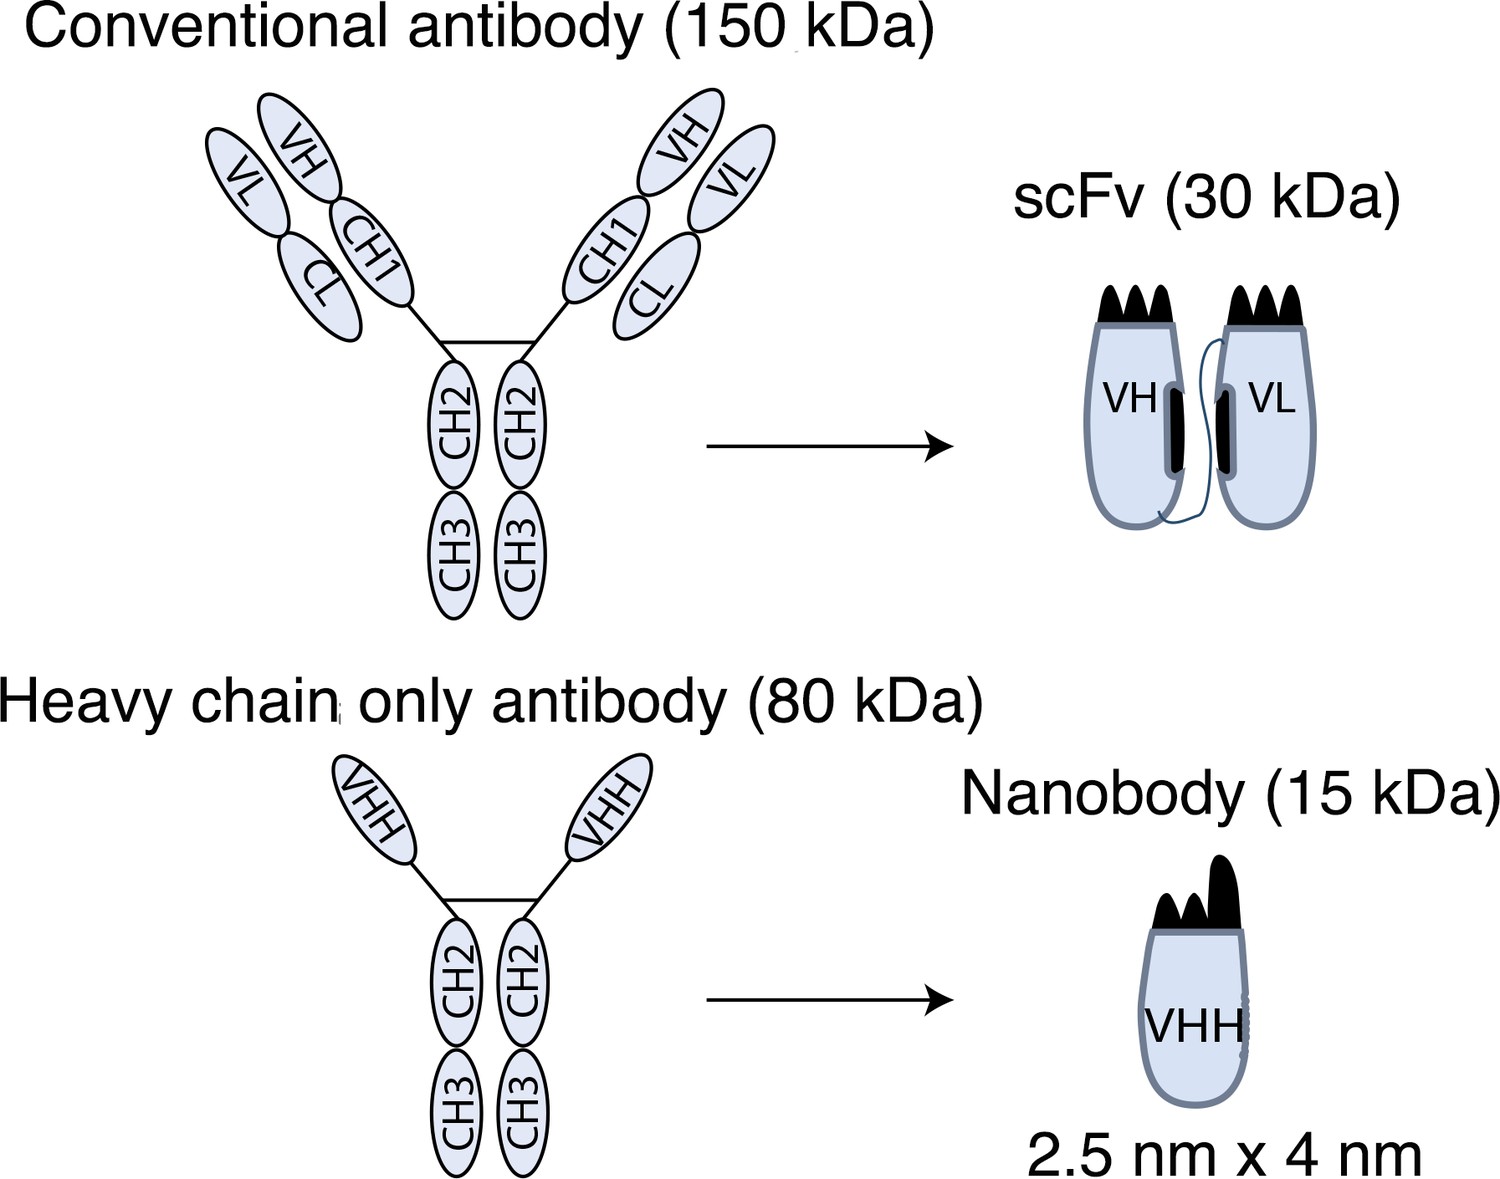
Schematic drawings of nanobodies and conventional antibodies.
VH: variable domain of heavy chain; CH: constant domain of heavy chain; VL: variable domain of light chain; CL: constant domain of light chain; VHH: variable domain of heavy-chain-only antibody; scFv: single-chain variable fragment.
Figure 2 with 4 supplements
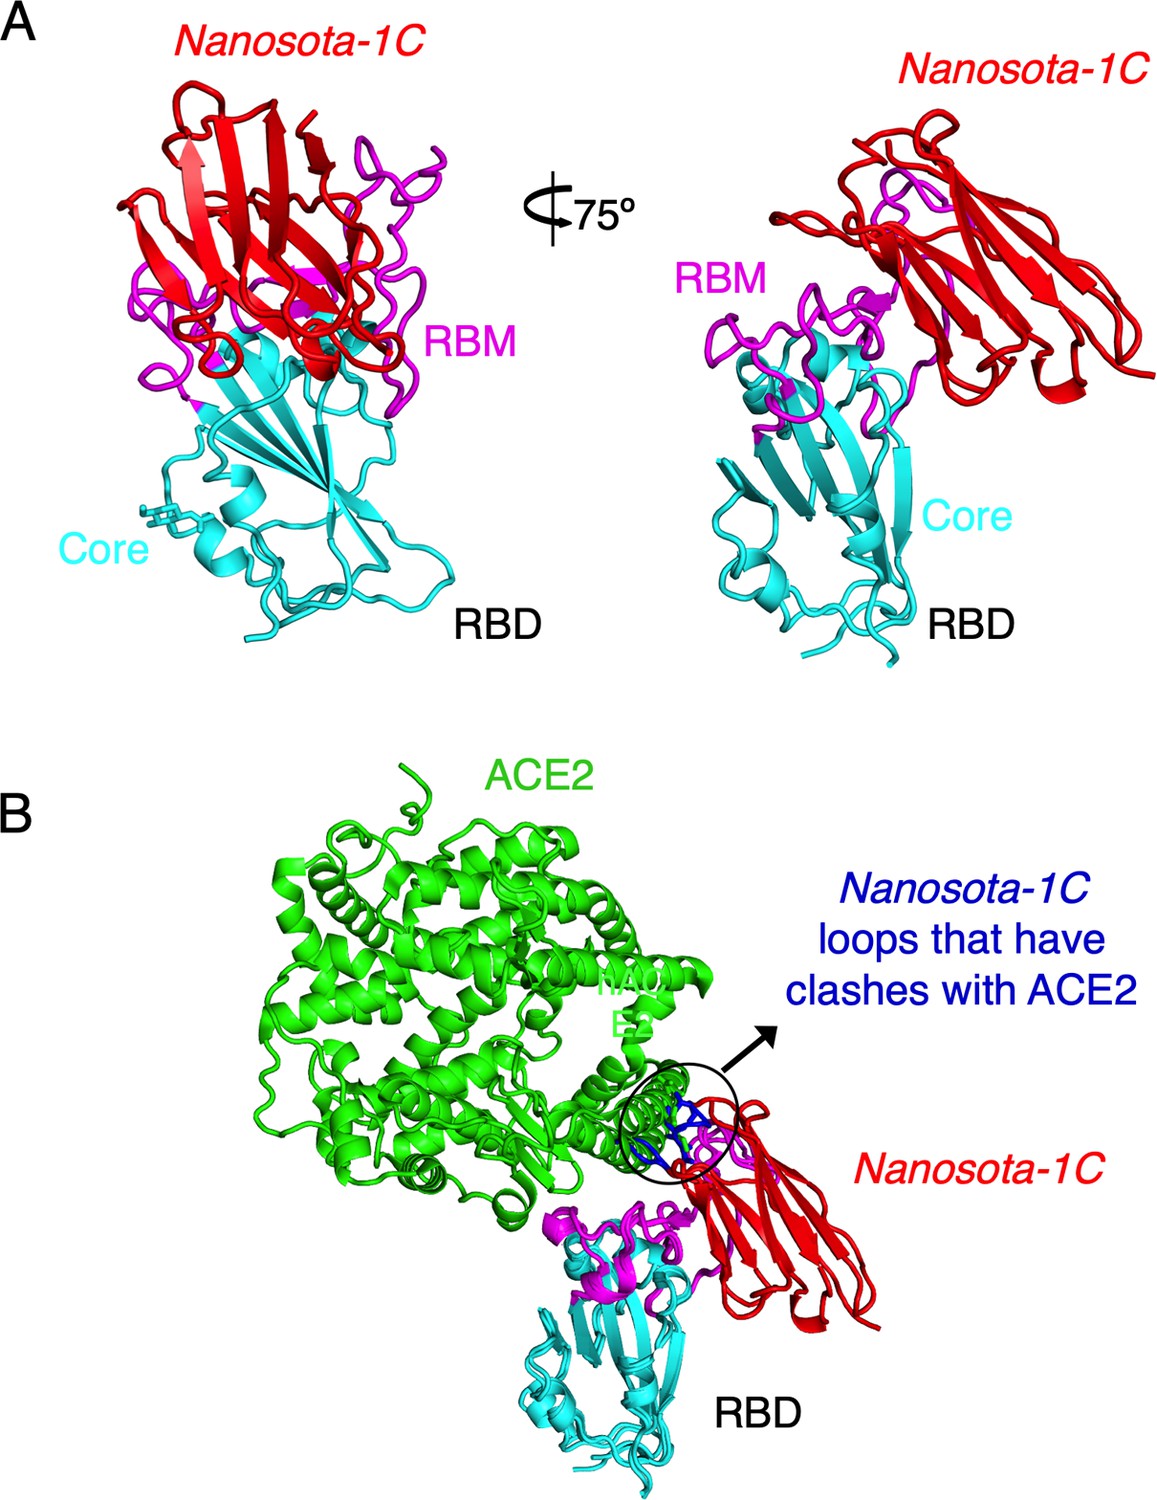
Crystal structure of SARS-CoV-2 RBD complexed with Nanosota-1C.
(A) Structure of SARS-CoV-2 receptor-binding domain (RBD) complexed with Nanosota-1C, viewed at two different angles. Nanosota-1C is in red, the core structure of RBD is in cyan, and the receptor-binding motif (RBM) of RBD is in magenta. Structure data and refinement statistics are shown in Table 2. (B) Overlay of the structures of the RBD/Nanosota-1C complex and RBD/angiotensin-converting enzyme 2 (ACE2) complex (PDB 6M0J). ACE2 is in green. The structures of the two complexes were superimposed based on their common RBD structure. The Nanosota-1C loops that have clashes with ACE2 are in blue.
Figure 2—figure supplement 1
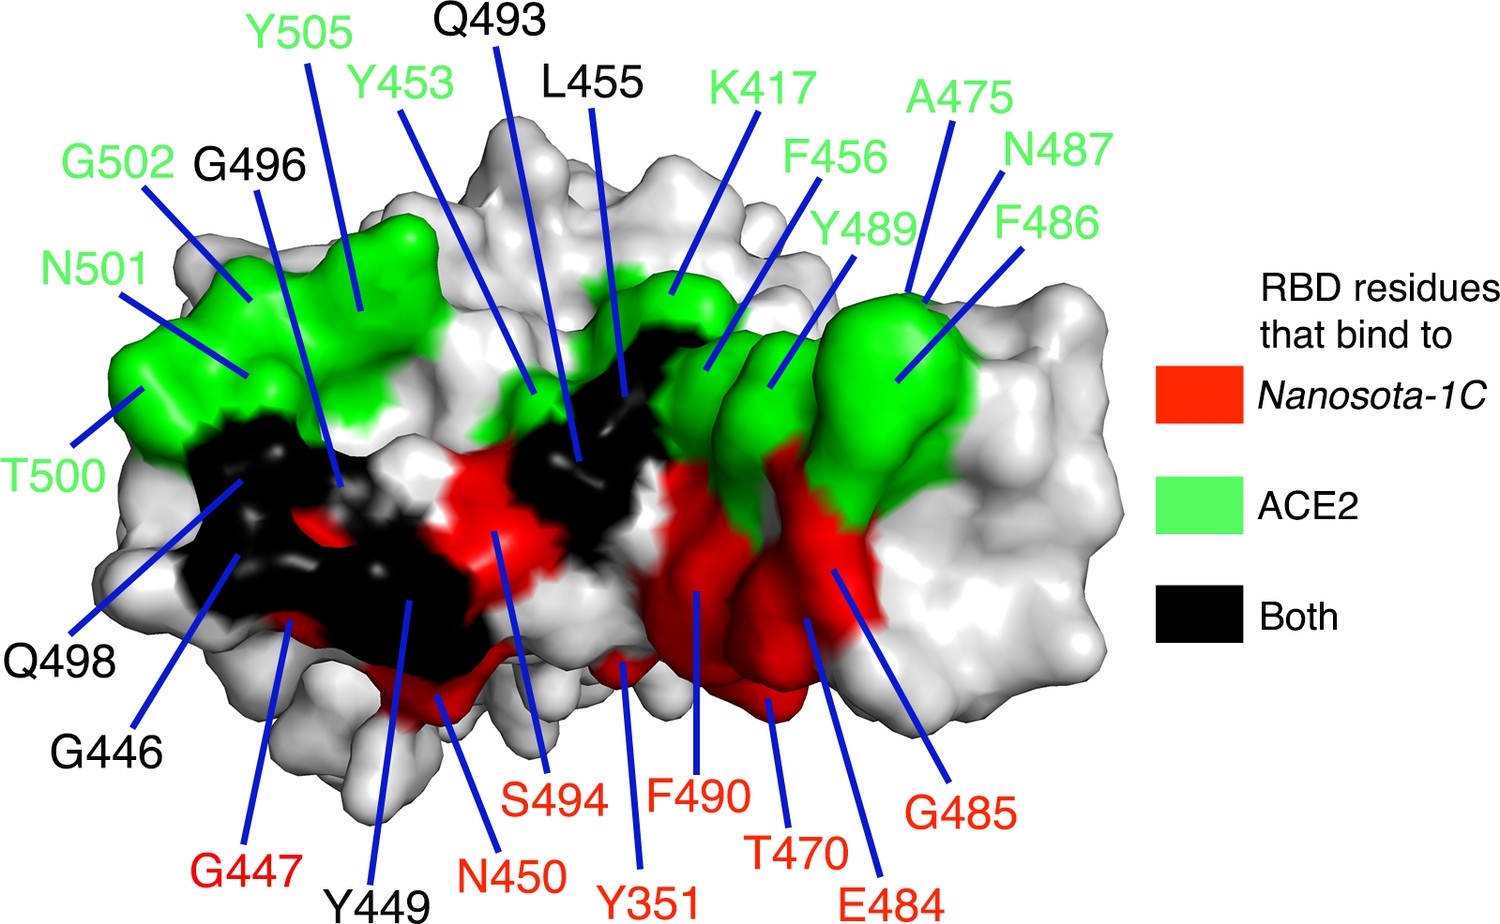
Footprint of Nanosota-1C on SARS-CoV-2 RBD.
Receptor-binding domain (RBD) residues that bind to Nanosota-1C are labeled in red, those that bind to angiotensin-converting enzyme 2 (ACE2) are labeled in green, and those that bind to both Nanosota-1C and ACE2 are labeled in black.
Figure 2—figure supplement 2
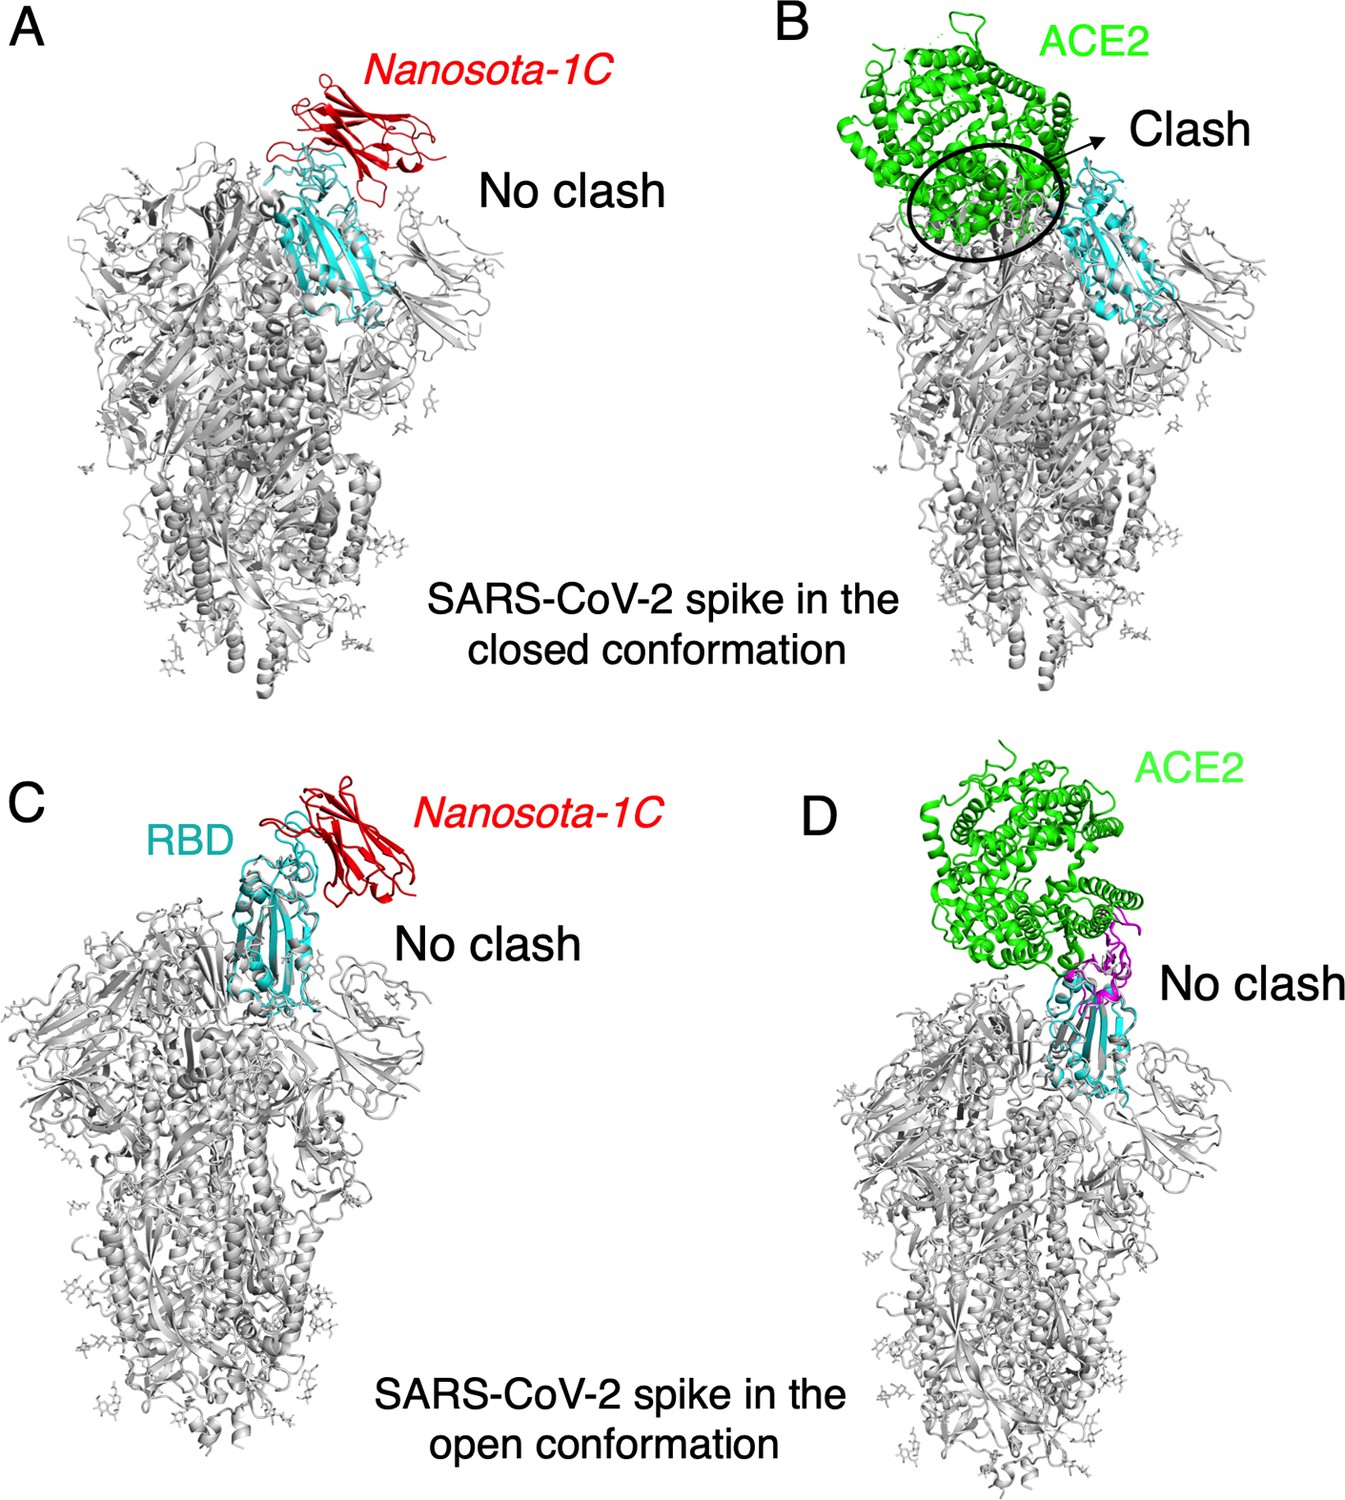
The binding of Nanosota-1C to SARS-CoV-2 spike protein in different conformations.
(A) The binding of Nanosota-1C to the spike protein in the closed conformation. The structures of the RBD/Nanosota-1C complex and SARS-CoV-2 spike protein in the closed conformation (PDB: 6ZWV) were superimposed based on their common receptor-binding domain (RBD) structure (in cyan). Nanosoto-1C is in red. The rest of the spike protein is in gray. (B) The binding of angiotensin-converting enzyme 2 (ACE2) to the spike protein in the closed conformation. The structures of the RBD/ACE2 complex (PDB 6M0J) and SARS-CoV-2 spike protein in the closed conformation (PDB: 6ZWV) were superimposed based on their common RBD structure. ACE2 is in green. Clashes between ACE2 and the rest of the spike protein are circled. (C) The binding of Nanosota-1C to the spike protein in the open conformation (PDB: 6VSB). (D) The binding of ACE2 to the spike protein in the open conformation (PDB: 6VSB).
Figure 2—figure supplement 3
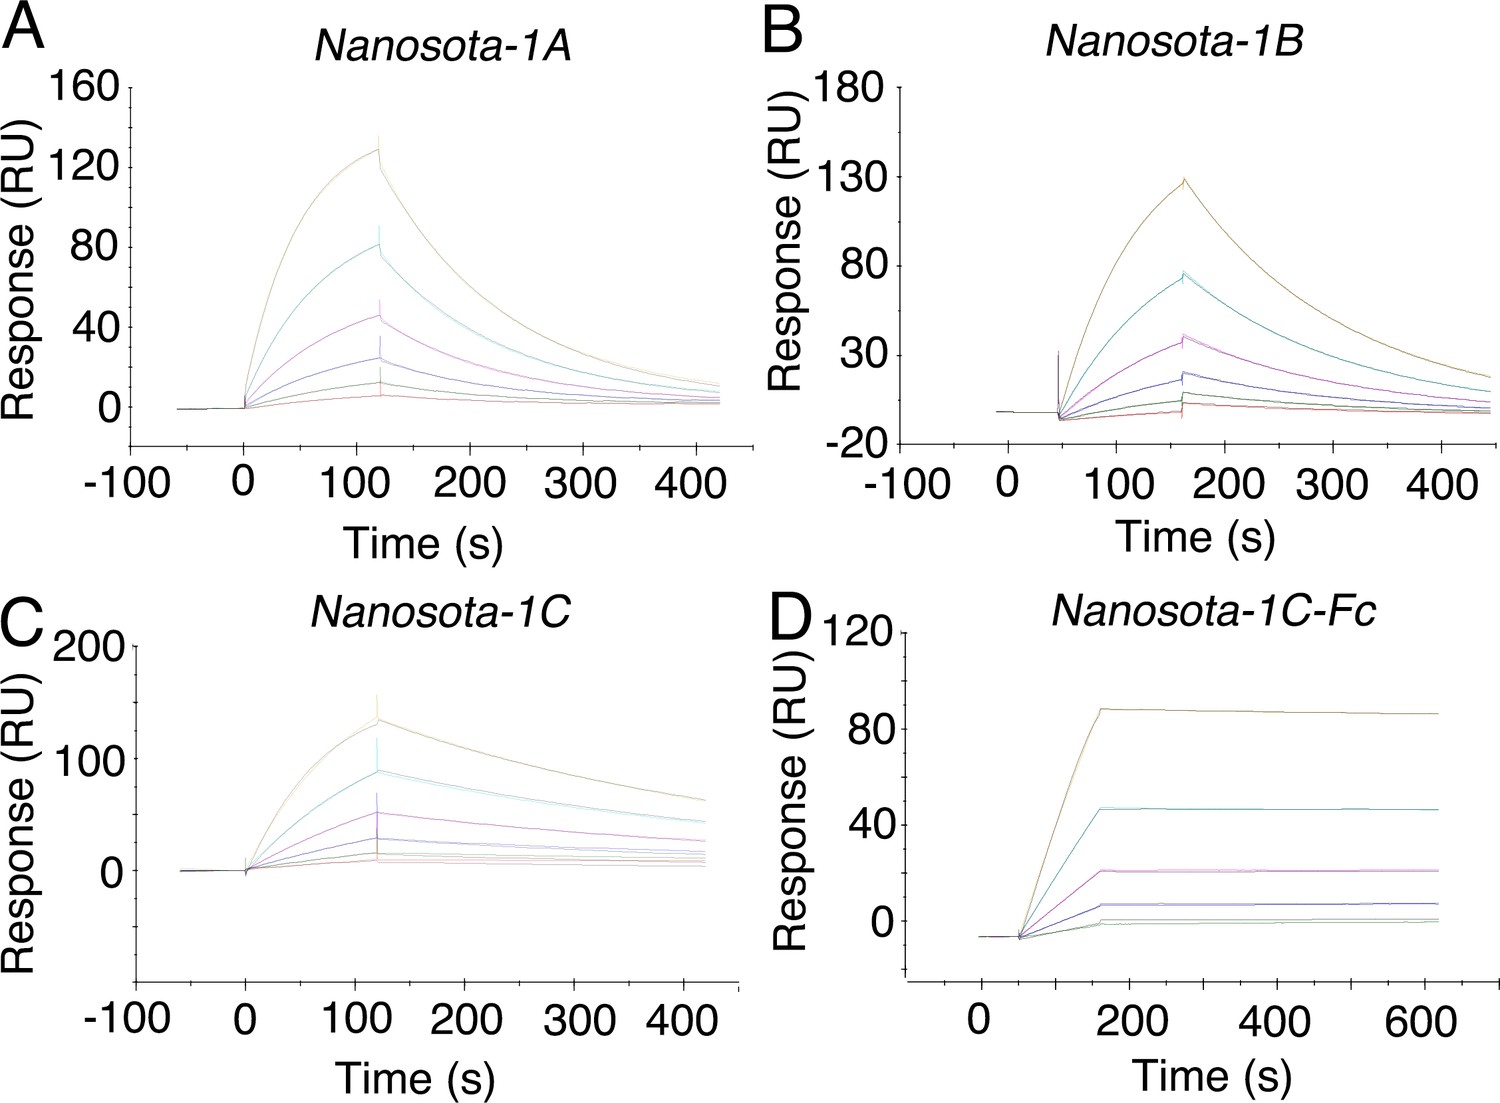
Measurement of the binding affinities between Nanosota-1 and SARS-CoV-2 RBD by surface plasmon resonance assay using Biacore.
Purified recombinant SARS-CoV-2 receptor-binding domain (RBD) was covalently immobilized on a sensor chip through its amine groups. Purified recombinant nanobodies (A, B, C, D) flowed over the RBD individually at one of five different concentrations. The resulting data were fit to a 1:1 binding model and the value of Kd was calculated for each nanobody (Table 1). The assay was repeated three times (biological replication: new aliquots of proteins and new sensor chips were used for each repeat).
Figure 2—figure supplement 4
Binding interactions between Nanosota-1 and SARS-CoV-2 RBD.
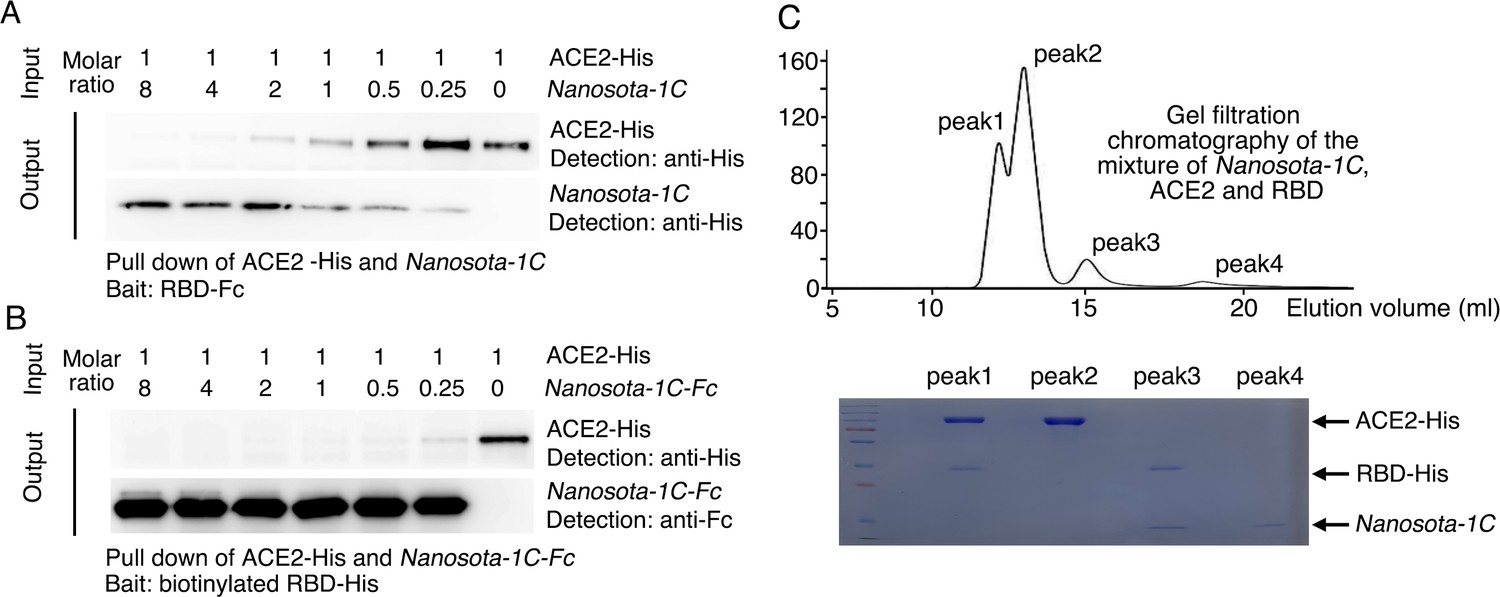
(A) Binding interactions among Nanosota-1C, angiotensin-converting enzyme 2 (ACE2), and SARS-CoV-2 receptor-binding domain (RBD) as evaluated using a protein pull-down assay. Various concentrations of Nanosota-1C and a constant concentration of ACE2 (both His tagged) were combined in different molar ratios. SARS-CoV-2 RBD (Fc tagged) was used to pull down Nanosota-1C and ACE2. A western blot was used to detect the presence of Nanosota-1C and ACE2 following pull down by SARS-CoV-2 RBD. The assay was repeated three times (biological replication: new aliquots of proteins were used for each repeat). (B) Binding interactions among Nanosota-1C-Fc, ACE2, and SARS-CoV-2 RBD as evaluated using a protein pull-down assay. Various concentrations of Nanosota-1C-Fc (Fc tagged) and a constant concentration of ACE2 (His tagged) were combined in different molar ratios. Biotinylated SARS-CoV-2 RBD (His tagged) was used to pull down Nanosota-1C-Fc and ACE2. A western blot was used to detect the presence of Nanosota-1C and ACE2 following pull down by SARS-CoV-2 RBD. The assay was repeated three times (biological replication: new aliquots of proteins were used for each repeat). (C) Binding interactions among Nanosota-1C, ACE2, and SARS-CoV-2 RBD as examined using gel filtration chromatography. Nanosota-1C, ACE2, and SARS-CoV-2 RBD (all His tagged) were mixed together in solution (both Nanosota-1C and ACE2 in molar excess of SARS-CoV-2 RBD) and purified using gel filtration chromatography. Protein components in each of the gel filtration chromatography peaks were analyzed with sodium dodecyl sulfate-polyacrylamide gel electrophoresis (SDS-PAGE) and stained by Coomassie blue. The assay was repeated three times (biological replication: new aliquots of proteins were used for each repeat).
-
Figure 2—figure supplement 4—source data 1
Raw images for Figure 2—figure supplement 4.
- https://cdn.elifesciences.org/articles/64815/elife-64815-fig2-figsupp4-data1-v2.zip
Figure 3 with 2 supplements
Efficacy of Nanosota-1 in neutralizing SARS-CoV-2 infections in vitro.
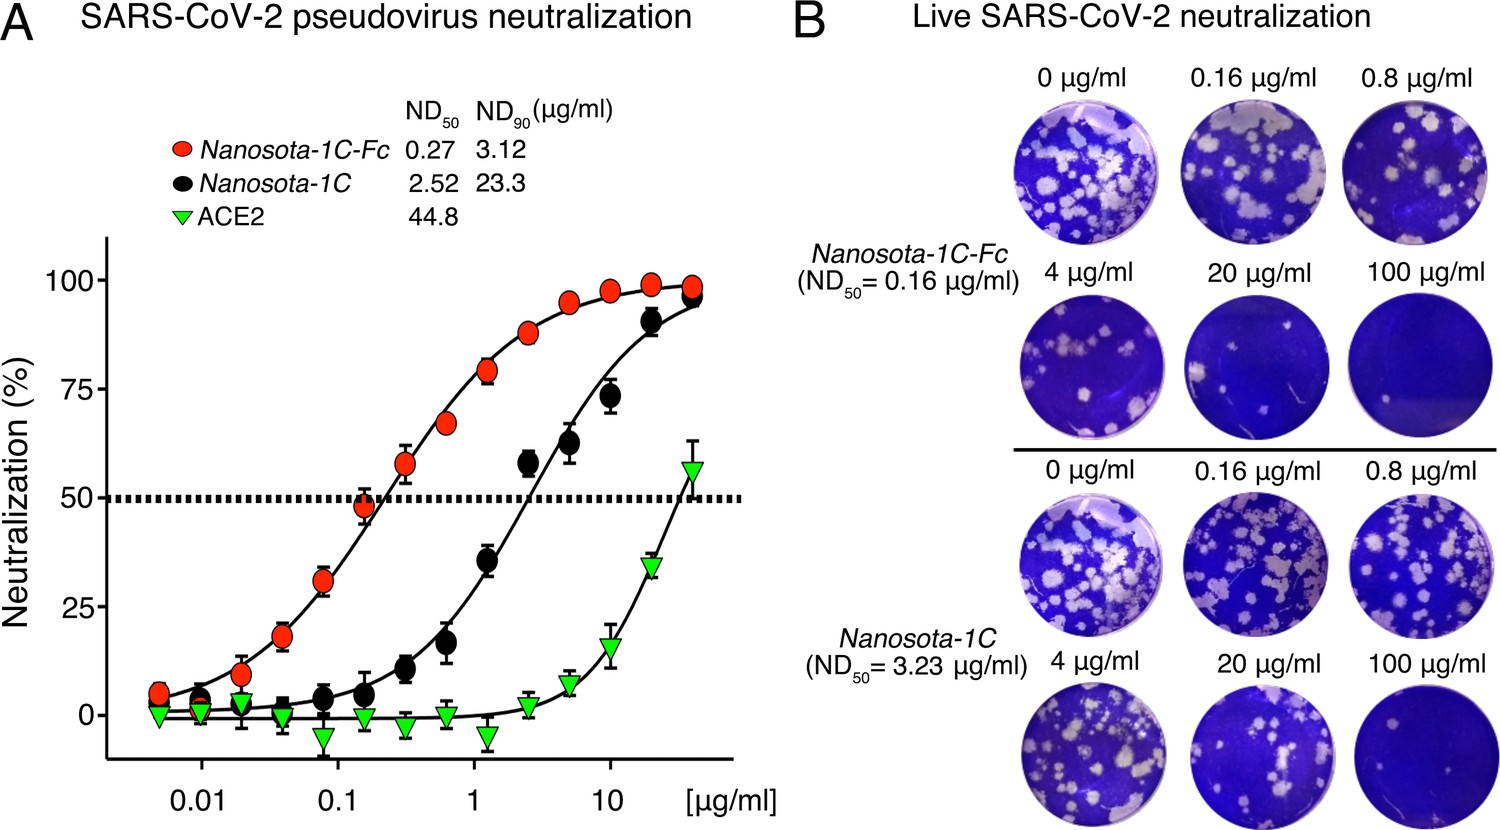
(A) Neutralization of SARS-CoV-2 pseudovirus entry into target cells by one of three inhibitors: Nanosota-1C-Fc, Nanosota-1C, and recombinant human angiotensin-converting enzyme 2 (ACE2). Retroviruses pseudotyped with SARS-CoV-2 spike protein (i.e., SARS-CoV-2 pseudoviruses) were used to enter HEK293T cells expressing human ACE2 in the presence of individual inhibitors at various concentrations. Entry efficiency was characterized via a luciferase signal, indicating successful cell entry. Data are the mean ± SEM (n = 4). Nonlinear regression was performed using a log (inhibitor) versus normalized response curve and a variable slope model (R2>0.95 for all curves). The efficacy of each inhibitor was expressed as the concentration capable of neutralizing pseudovirus entry by 50% (i.e., ND50) or 90% (i.e., ND90). ND90 for ACE2 was not calculated due to insufficient data points. The assay was repeated three times (biological replication: new aliquots of pseudoviruses and cells were used for each repeat). (B) Neutralization of live SARS-CoV-2 infection of target cells by one of two inhibitors: Nanosota-1C-Fc and Nanosota-1C. The potency of Nanosota-1 in neutralizing live SARS-CoV-2 infections was evaluated using a SARS-CoV-2 plaque-reduction neutralization test (PRNT) assay. 80 plaque-forming unit (PFU) infectious SARS-CoV-2 particles were used to infect Vero E6 cells in the presence of individual inhibitors at various concentrations. Infection was characterized as the number of virus plaques formed in overlaid cells. Images of virus plaques for each inhibitor at the indicated concentrations are shown. Each image represents data from triplications. The efficacy of each inhibitor was calculated and expressed as the concentration capable of reducing the number of virus plaques by 50% (i.e., ND50). The assay was repeated twice (biological replication: new aliquots of virus particles and cells were used for each repeat).
Figure 3—figure supplement 1
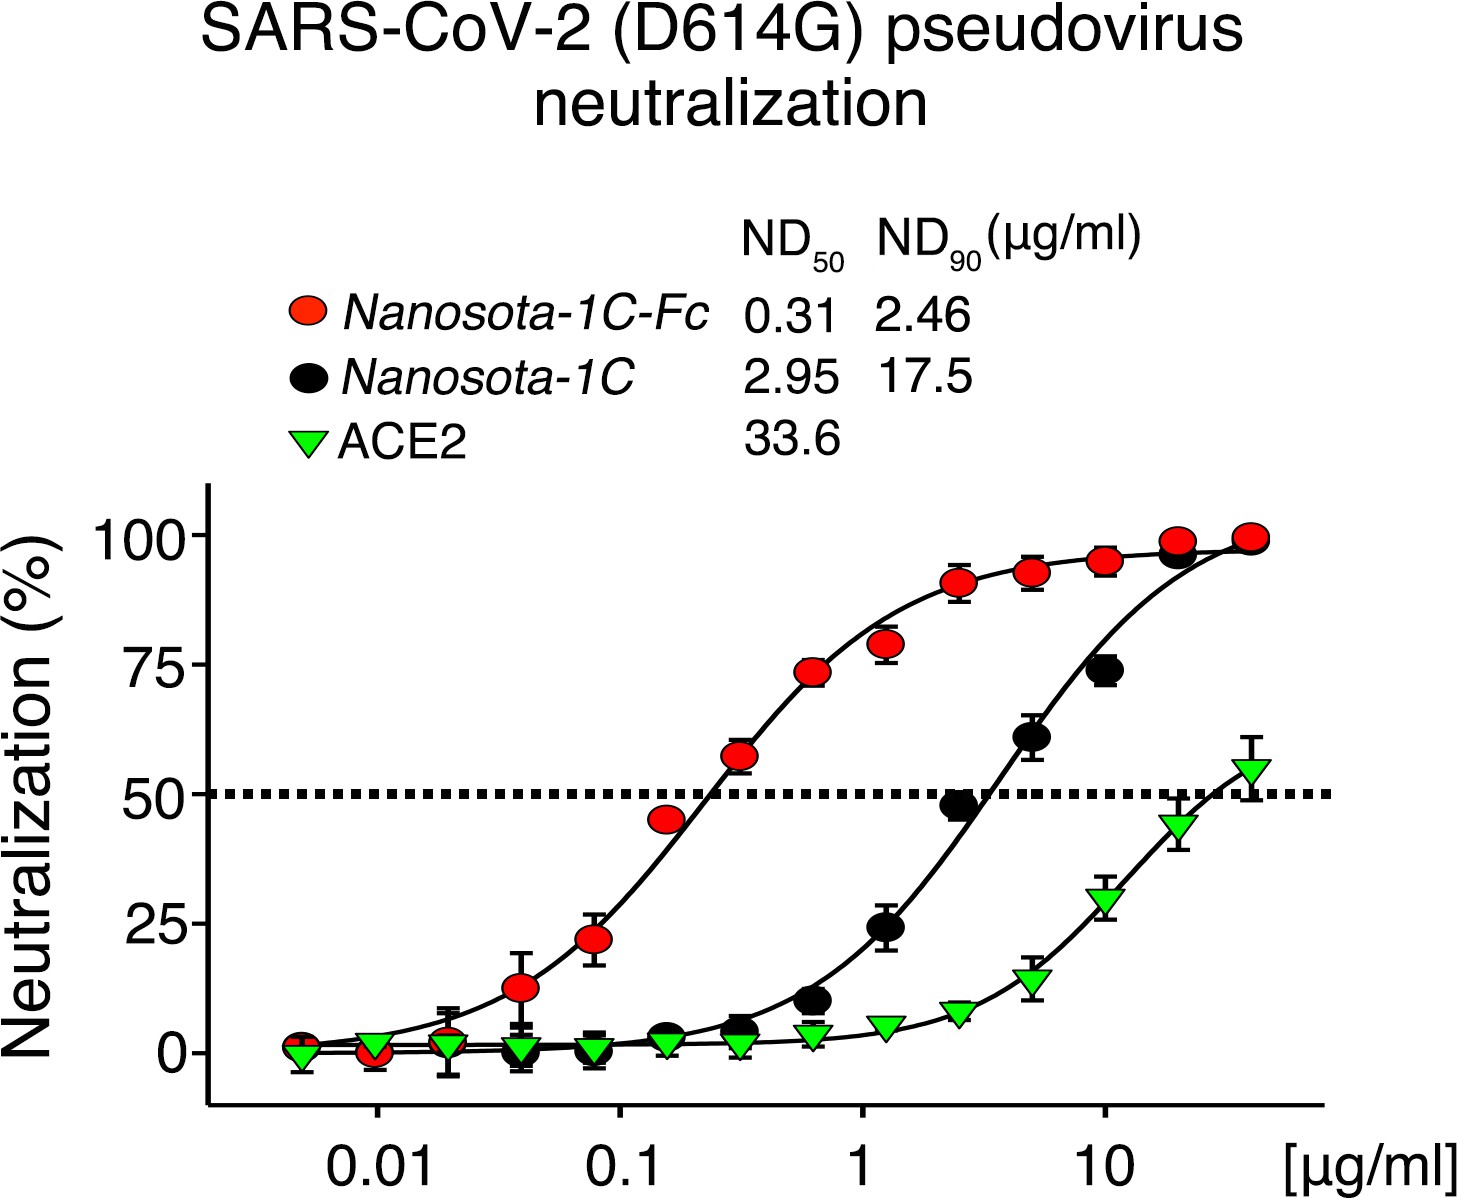
Neutralization of SARS-CoV-2 pseudovirus, which contains the D614G mutation in the spike protein, by Nanosota-1.
The procedure was the same as described in Figure 3A, except that the mutant spike protein replaced the wild-type spike protein. The assay was repeated three times (biological replication: new aliquots of pseudoviruses and cells were used for each repeat).
Figure 3—figure supplement 2
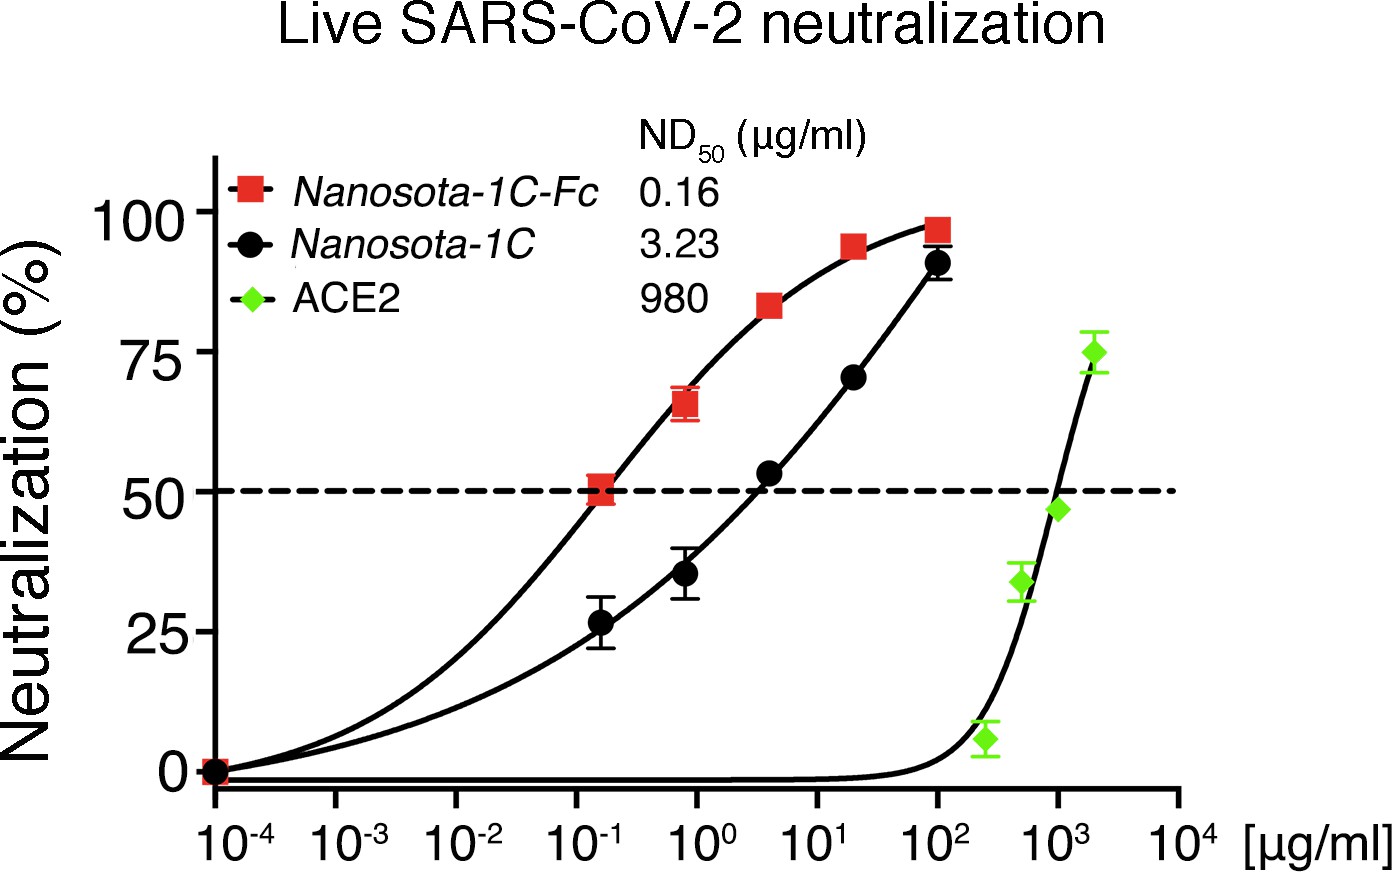
Detailed data on the neutralization of live SARS-CoV-2 infection of target cells by Nanosota-1.
Data are the mean ± SEM (n = 3). Nonlinear regression was performed using a log (inhibitor) versus normalized response curve and a variable slope model (R2>0.95 for all curves). The assay was repeated twice (biological replication: new aliquots of virus particles and cells were used for each repeat).
Figure 4
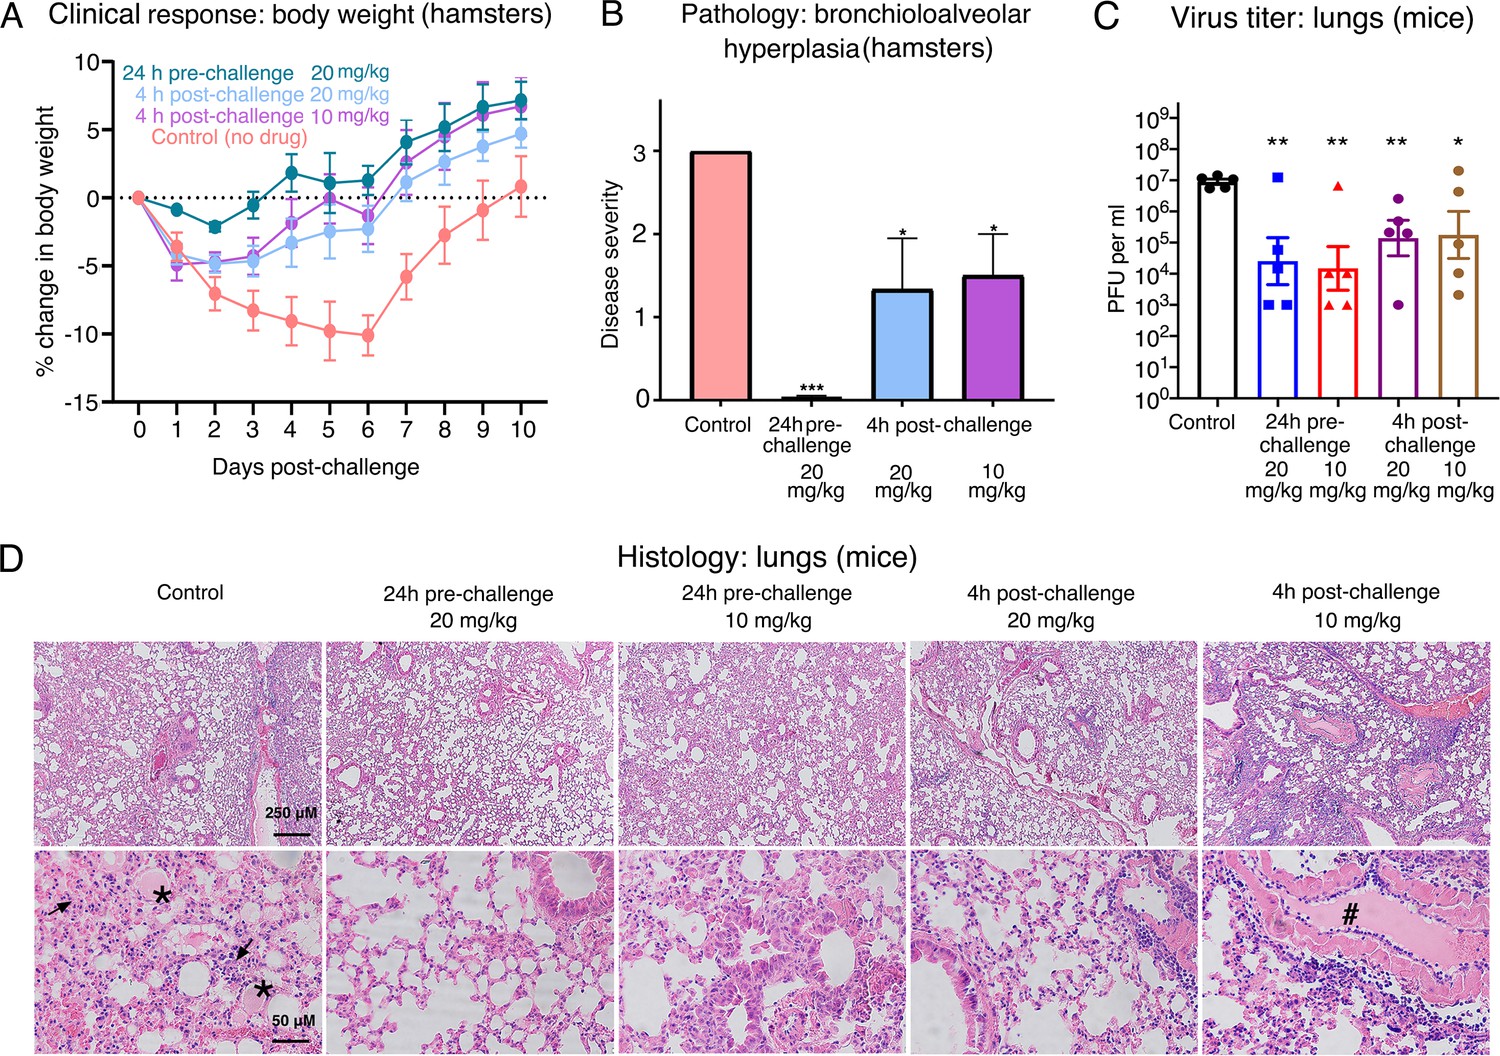
Efficacy of Nanosota-1 in protecting both hamsters and mice from SARS-CoV-2 infections.
(A, B) Hamsters (six per group) were injected with a single dose of Nanosota-1C-Fc at the indicated time point and the indicated dosage. At day 0, all groups (experimental and control) were challenged with SARS-CoV-2 (at a titer of 106 Median Tissue Culture Infectious Dose [TCID50]). (A) Body weights of hamsters were monitored on each day and percent change in body weight relative to day 0 was calculated for each hamster. Data are the mean ± SEM (n = 6). Analysis of variance (ANOVA) on group as a between-group factor and day (1-10) as a within-group factor revealed significant differences between the control group and each of the following groups: 24-hr pre-challenge (20 mg/kg) group (F(1, 10) = 17.80, p = 0.002; effect size ηp2 = 0.64), 4-hr post-challenge (20 mg/kg) group (F(1, 10) = 5.02, p = 0.035; ηp2 = 0.37), and 4-hr post-challenge (10 mg/kg) group (F(1, 10) = 7.04, p = 0.024; ηp2 = 0.41). All p-values are two-tailed. (B) Tissues of bronchial tubes from each of the hamsters were collected on day 10 and scored for the severity of bronchioloalveolar hyperplasia: 3 - moderate; 2 - mild; 1 - minimum; 0 - none. Data are the mean ± SEM (n = 6). A comparison between the control group and each of other groups was performed using one-tailed Student’s t-test for directional tests. ***p<0.001; *p<0.05. (C, D) Human ACE2-transgenic mice (seven per group) were injected with a single dose of Nanosota-1C-Fc at the indicated time point and the indicated dosage. At day 0, all groups (experimental and control) were challenged with SARS-CoV-2 (at a titer of 5 x 10³ plaque-forming unit [PFU]). (C) Five mice from each group were euthanized on day 2 post-challenge, and the virus titers in their lungs were measured using a plaque assay. A comparison between the control group and each of the other groups was performed using one-tailed Student’s t-test for directional tests. Data are the mean ± SEM (n = 5). **p<0.01; *p<0.05. (D) The remaining two mice from each group were euthanized on day 5 post-challenge. Lung tissues were collected and examined for pathological changes after staining with hematoxylin and eosin. Phosphate-buffered saline (PBS) control group: severe inflammatory cell infiltration and bronchiole infiltration on the top panel; severe alveolar edema filled with liquid (labeled *) and proliferative alveolar epithelium (labeled →) on the bottom panel. 24-hr pre-challenge 20 mg/kg group: close to normal. 24-hr pre-challenge 10 mg/kg group: minor proliferative alveolar epithelium and inflammatory cell infiltration. 4-hr post-challenge 20 mg/kg group: close to normal. 4-hr post-challenge 10 mg/kg group: obvious cell inflammatory cell infiltration and vascular thrombosis (labeled #).
-
Figure 4—source data 1
Raw images for Figure 4.
- https://cdn.elifesciences.org/articles/64815/elife-64815-fig4-data1-v2.zip
Figure 5 with 1 supplement
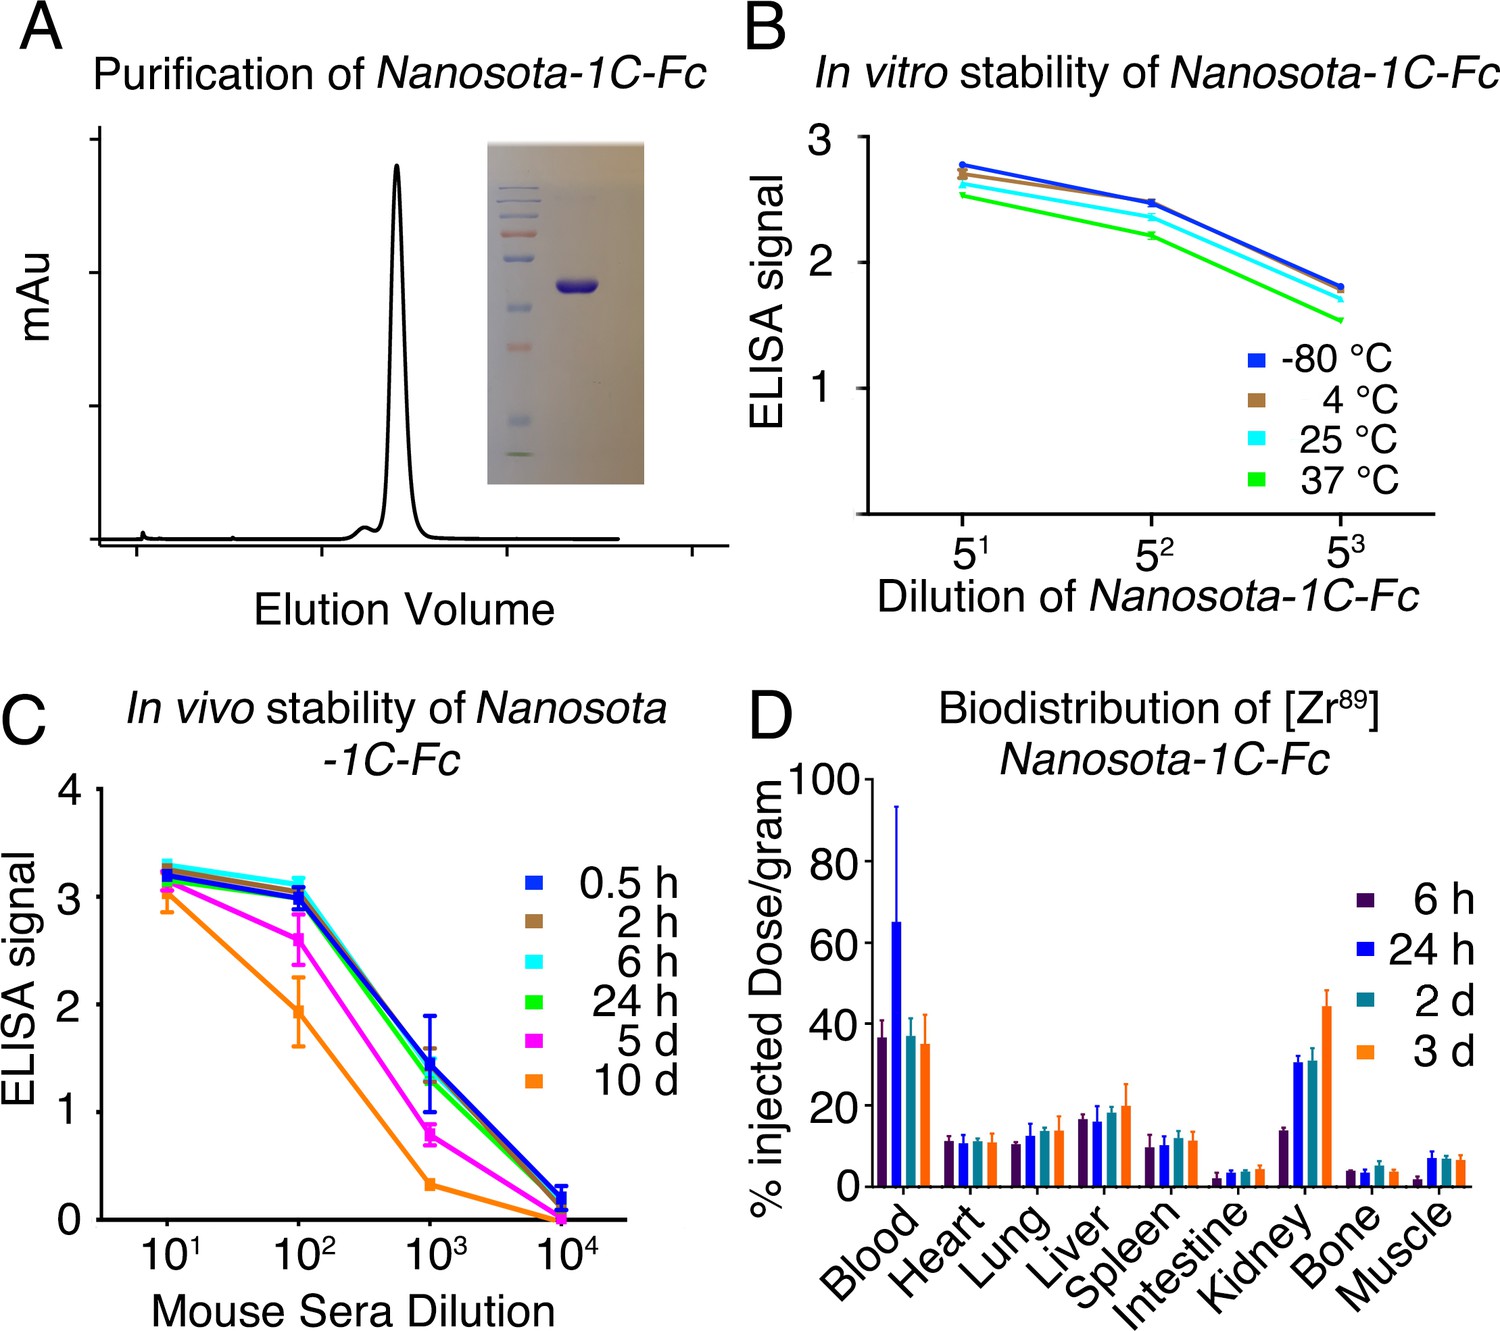
Analysis of expression, purification, and pharmacokinetics of Nanosota-1C-Fc.
(A) Purification of Nanosota-1C-Fc from bacteria. The protein was nearly 100% pure after gel filtration chromatography, as demonstrated by its elution profile and sodium dodecyl sulfate-polyacrylamide gel electrophoresis (SDS-PAGE) (stained by Coomassie blue). The yield of the protein was 40 mg/l of bacterial culture, without any optimization of the expression. (B) In vitro stability of Nanosota-1C-Fc. The protein was stored at indicated temperatures for a week, and then a dilution enzyme-linked immunosorbent assay (ELISA) was performed to evaluate its SARS-CoV-2 receptor-binding domain (RBD)-binding capability. Data are the mean ± SEM (n = 4). (C) In vivo stability of Nanosota-1C-Fc. Nanosota-1C-Fc was injected into mice, mouse sera were collected at various time points, and Nanosota-1C-Fc remaining in the sera was detected for its SARS-CoV-2 RBD-binding capability as displayed in a dilution ELISA. Data are the mean ± SEM (n = 3). (D) Biodistribution of [89Zr]Zr-Nanosota-1C-Fc. Nanosota-1C-Fc was radioactively labeled with zirconium-89 (89Zr) and injected into mice via the tail vein. Different tissues or organs were collected at various time points (n = 3 mice per time point). The amount of Nanosota-1C-Fc present in each tissue or organ was measured through examining the radioactive count of each tissue or organ. Data are the mean ± SEM (n = 3).
-
Figure 5—source data 1
Raw images for Figure 5.
- https://cdn.elifesciences.org/articles/64815/elife-64815-fig5-data1-v2.zip
Figure 5—figure supplement 1
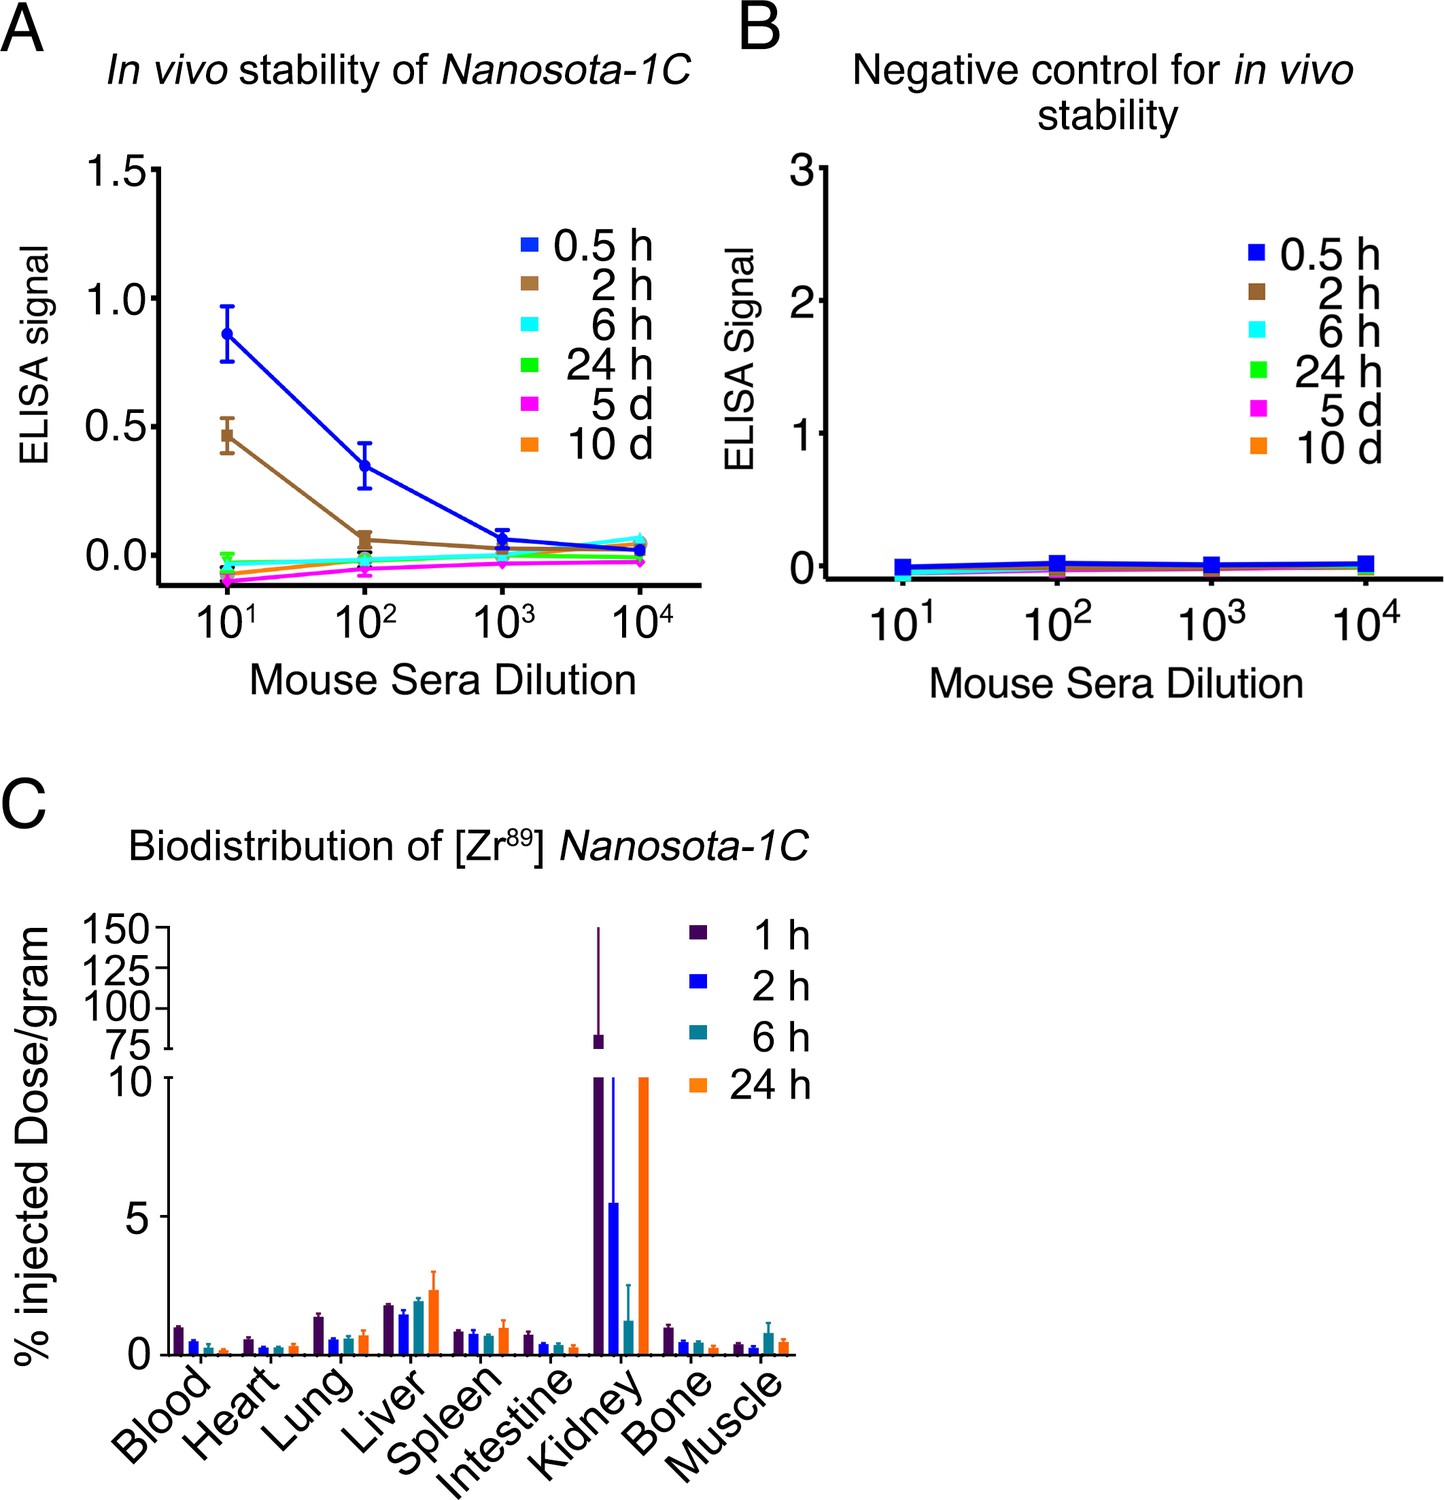
Pharmacokinetics of Nanosota-1C.
In vivo stability (A) and biodistribution (C) of Nanosota-1C were measured in the same way as described in Figure 5C and Figure 5D, respectively, except that time points for Nanosota-1C differed from those for Nanosota-1C-Fc due to pharmacokinetic differences of the small-molecular weight nanobody versus the larger Fc-tagged nanobody. Phosphate-buffered saline (PBS) was used as a negative control for the in vivo stability experiment (B).
Tables
Table 1
Binding affinities between Nanosota-1 and SARS-CoV-2 RBD as measured using surface plasmon resonance.
The previously determined binding affinity between human ACE2 and RBD is shown as a comparison (Shang et al., 2020a).
| Kd with SARS-CoV-2 RBD (M) | koff (s−1) | kon (M−1s−1) | |
|---|---|---|---|
| Nanosota-1A (before affinity maturation) | 2.28 x 10⁻⁷ | 9.35 x 10⁻³ | 4.10 x 10⁴ |
| Nanosota-1B (after first round of affinity maturation) | 6.08 x 10⁻⁸ | 7.19 x 10⁻³ | 1.18 x 10⁵ |
| Nanosota-1C (after second round of affinity maturation) | 1.42 x 10⁻⁸ | 2.96 x 10⁻³ | 2.09 x 10⁵ |
| Nanosota-1C-Fc (after second round of affinity maturation; containing a C-terminal human Fc tag) | 1.57 x 10⁻¹¹ | 9.68 x 10⁻⁵ | 6.15 x 10⁶ |
| ACE2 | 4.42 x 10⁻⁸ | 7.75 x 10⁻³ | 1.75 x 10⁵ |
Table 2
X-ray data collection and structure refinement statistics (SARS-CoV-2 RBD/Nanosota-1C complex).
| Data collection | |
|---|---|
| Wavelength | 0.979 |
| Resolution range | 45.48–3.19 (3.30–3.19) |
| Space group | P 43 21 2 |
| Unit cell | 60.849 60.849 410.701 90 90 90 |
| Total reflections | 64167 (5703) |
| Unique reflections | 13607 (1308) |
| Multiplicity | 4.7 (4.4) |
| Completeness (%) | 96.82 (97.60) |
| Mean I/sigma(I) | 8.41 (1.80) |
| Wilson B-factor | 83.24 |
| R-merge | 0.145 (0.928) |
| R-meas | 0.1638 (1.053) |
| R-pim | 0.07385 (0.4858) |
| CC1/2 | 0.995 (0.861) |
| CC* | 0.999 (0.962) |
| Refinement | |
| Reflections used in refinement | 13567 (1301) |
| Reflections used for R-free | 674 (62) |
| R-work | 0.2483 (0.3521) |
| R-free | 0.2959 (0.4153) |
| CC (work) | 0.963 (0.819) |
| CC (free) | 0.909 (0.615) |
| Number of non-hydrogen atoms | 4890 |
| Macromolecules | 4833 |
| Ligands | 57 |
| Protein residues | 621 |
| RMS (bonds) | 0.002 |
| RMS (angles) | 0.45 |
| Ramachandran favored (%) | 93.11 |
| Ramachandran allowed (%) | 6.89 |
| Ramachandran outliers (%) | 0.00 |
| Rotamer outliers (%) | 3.23 |
| Clashscore | 5.25 |
| Average B-factor | 90.29 |
| Macromolecules | 89.84 |
| Ligands | 127.91 |
-
Statistics for the highest-resolution shell are shown in parentheses.
Additional files
-
Source data 1
Raw data for figures and figure supplements.
- https://cdn.elifesciences.org/articles/64815/elife-64815-data1-v2.xlsx
-
Transparent reporting form
- https://cdn.elifesciences.org/articles/64815/elife-64815-transrepform-v2.docx
Download links
A two-part list of links to download the article, or parts of the article, in various formats.
Downloads (link to download the article as PDF)
Open citations (links to open the citations from this article in various online reference manager services)
Cite this article (links to download the citations from this article in formats compatible with various reference manager tools)
The development of Nanosota-1 as anti-SARS-CoV-2 nanobody drug candidates
eLife 10:e64815.
https://doi.org/10.7554/eLife.64815


