Dynamics of primitive streak regression controls the fate of neuromesodermal progenitors in the chicken embryo
- Department of Pathology, Brigham and Women’s Hospital, United States
- Department of Genetics, Harvard Medical School, United States
- Harvard Stem Cell Institute, United States
- Howard Hughes Medical Institute, United States
Figures
Figure 1 with 2 supplements

Characterization of the SOX2/T-positive territory of the epiblast.
(A–C) Whole-mount embryos and (E, F) transverse cryosections showing the immunolocalization of SOX2 (A), T (B), T and SOX2 (C, E), and MSGN1 (F) in chicken embryos at stage 5HH. (D) Schematic representation of the expression of T (blue: high; green: low), SOX2 (red), and SOX2/T (gold) in a stage 5HH chicken embryo. The level of the tissue sections in (E, F) is shown with dashed double arrows labeled from 1 to 5 from anterior to posterior. (E’, F’) Higher magnification of the NMP region (level 3, E, F). (E’’, F’’) Higher magnification of the PMP region (level 4, E, F). (n = 7 embryos for whole mount; n = 3 for cryosections). PS regions are defined based on distance from Hensen’s node as described in Psychoyos and Stern, 1996. (G) Maximum intensity projections from confocal images of chicken embryos immunostained for T (green) and SOX2 (red) proteins. Double-positive cells are shown in yellow. White hatched line in the 25-somite embryo marks the end of the neural tube (red) and the NMP region (orange) (n = 23 embryos analyzed in total). (H) Diagram summarizing the experimental procedure to label NMP cells in stage 5HH embryos using electroporation of a fluorescent reporter in the epiblast of the anterior PS region (in green) followed by analysis at the tail bud stage. (I, J) Fate of descendants of cells of the NMP region electroporated at stage 5HH with an H2B-RFP plasmid and imaged in time lapse at the 25-somite stage in the tail bud region. Z-projection from confocal images (I) and tracks (J) of a time-lapse movie showing the movements of the cells in the NMP territory for 10 hr (Video 1). Tracks were color-coded a posteriori. Neural, mesodermal, and NMP cell trajectories are shown in red, green, and gold, respectively. NP: neural plate; NMP: neuromesodermal progenitors; PMP: presomitic mesoderm progenitors; LPP: lateral plate progenitors; EMP: extraembryonic mesoderm progenitors; n: node; epi: epiblast; Meso: mesoderm; PS: primitive streak; NT: neural tube. Arrowheads: Hensen’s node. Asterisk: primitive streak. (A–D, G–J) Dorsal views. Anterior to the top. Scale bar: 100 µm.
Figure 1—figure supplement 1
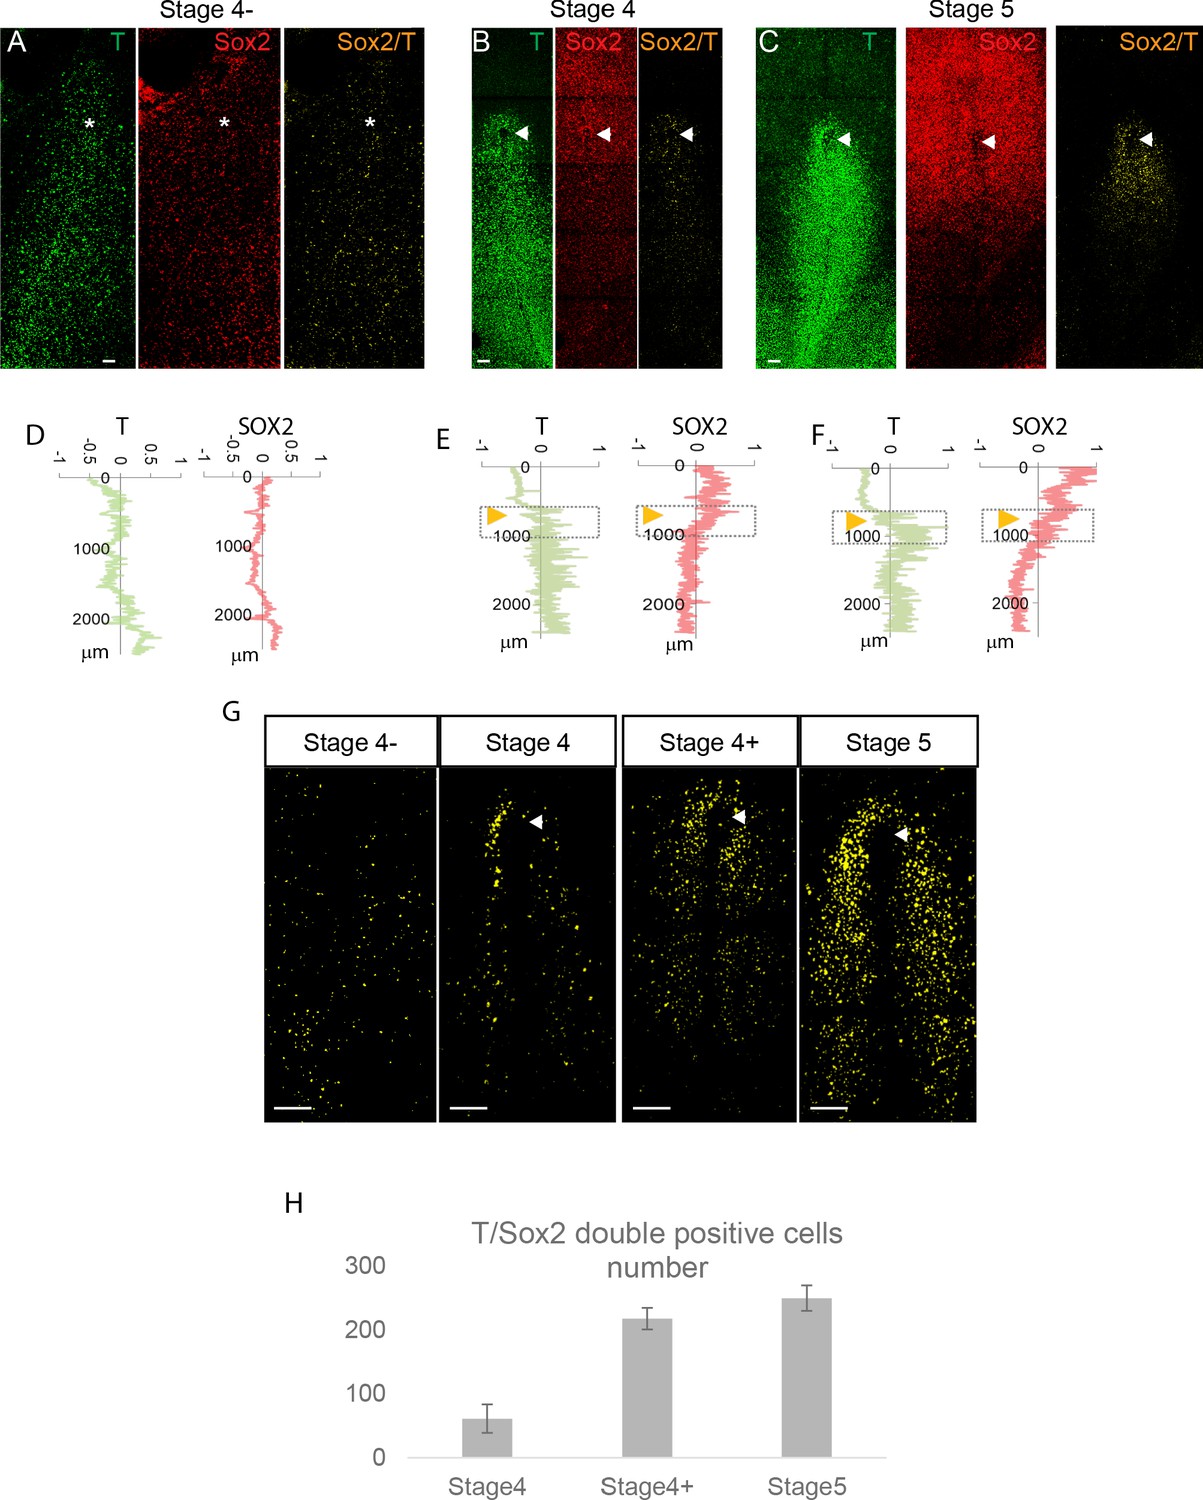
Onset of SOX2/T expression cells in chicken.
(A–C) Representative maximum z-projections of confocal images of T and SOX2 whole-mount immunohistochemistry from stage 4 to stage 5HH. (D–F) Representative line profile intensities showing the quantification of the fluorescence intensity of the SOX2 (red) and T (green) staining along the anteroposterior axis of the embryos (y axis). 0 marks the anterior neural plate. Orange arrowheads: position of Hensen’s node representative of the anterior border of the primitive streak (PS). (G) Maximum z-projection of embryos stained in whole mount with SOX2/T antibodies showing the localization and the number of the SOX2/T double-positive cells (in yellow) in the anterior PS region. Within each color channel, we threshold the cells expressing T and SOX2 in the nucleus. The double-positive cells are identified by creating a new image with the thresholded image such as only cells expressing T and SOX2 are visible and quantified. Single positive cells are not shown. (H) Quantification of the number of SOX2/T double-positive cells between stage 4 and 5HH. Dorsal views, anterior to the top. Asterisk marks the tip of PS. White arrowheads: Hensen’s node (n = 18; seven embryos at stage 4HH, four at stage 4+HH, seven at stage 5HH). Scale bar: 100 µm.
-
Figure 1—figure supplement 1—source data 1
Number of T/SOX2 double-positive cells during early chicken stages.
- https://cdn.elifesciences.org/articles/64819/elife-64819-fig1-figsupp1-data1-v1.xlsx
Figure 1—figure supplement 2
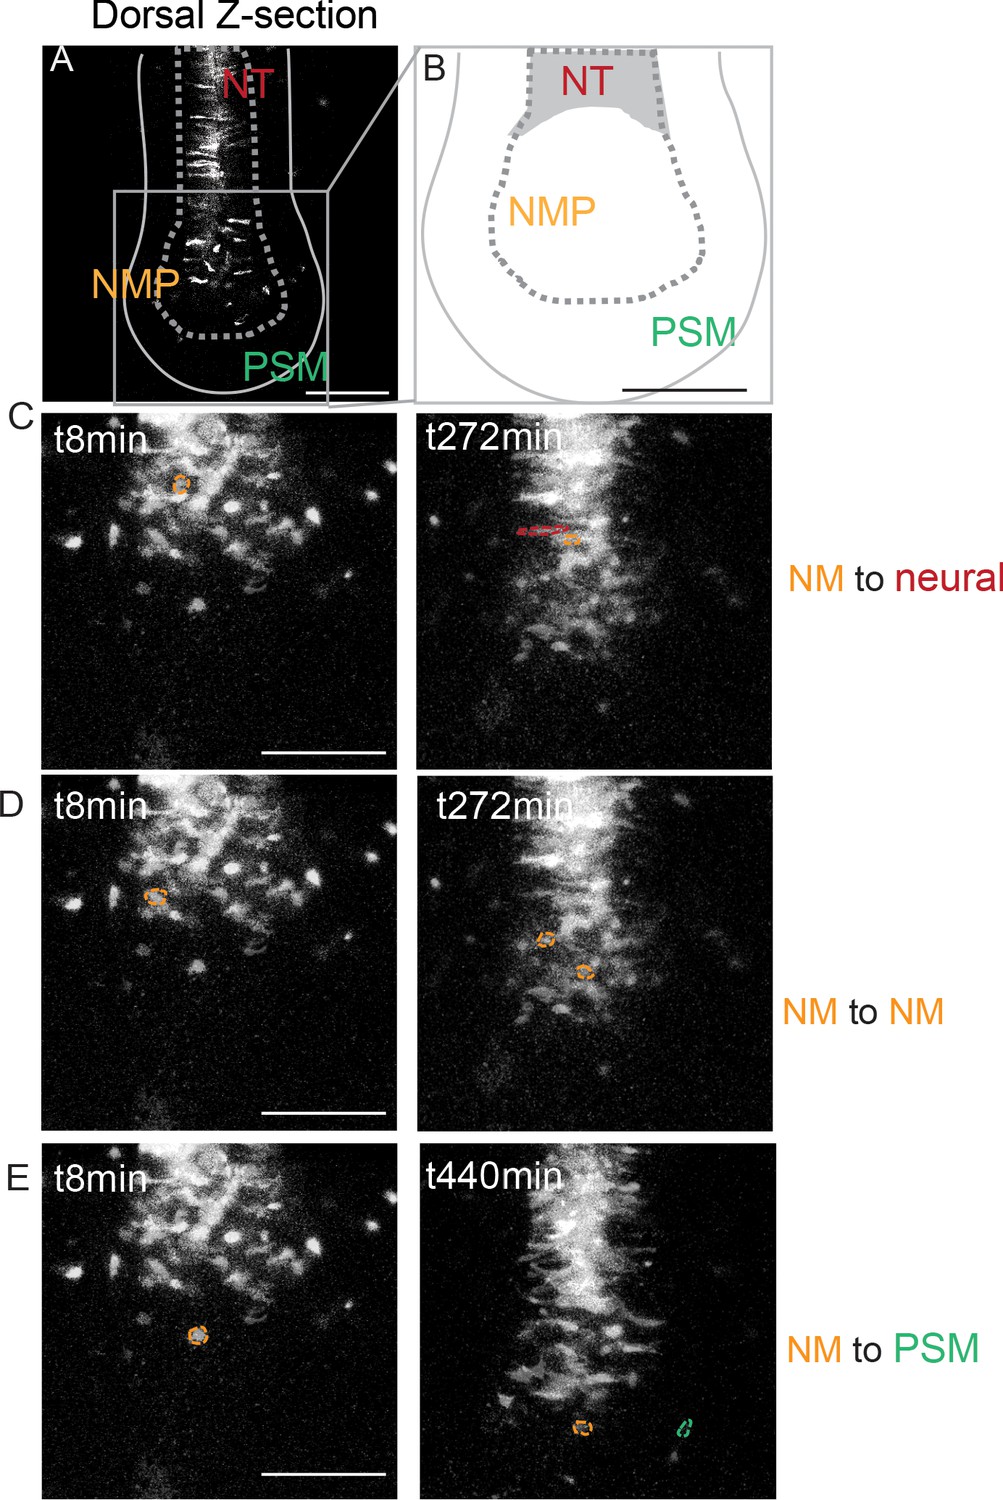
Fate of cells of the anterior PS region at the tail bud stage.
(A) Dorsal z-section of a 25-somite embryo showing the superficial localization of the descendants from the cells co-electroporated at stage 5 HH in the NMP region of the anterior PS with a GAP43-Venus and an H2B-RFP plasmid (marking the membrane and the nucleus, respectively). (B) Diagram showing the dorsal region of the tail bud region where cells were tracked in (C–E). (C–E) Images of tracked cells of the anterior PS that become neural (C), remain NMP, (D) or become PSM (E) cells. NMP cells are circled in gold, neural cells are circled in red, and PSM cells are circled in green (52 cells tracked in three embryos). NT: neural tube; NMP: neuromesodermal progenitors; PSM: presomitic mesoderm; PS: primitive streak. Anterior to the top, dorsal views. Scale bar: 100 µm.
Figure 2 with 1 supplement
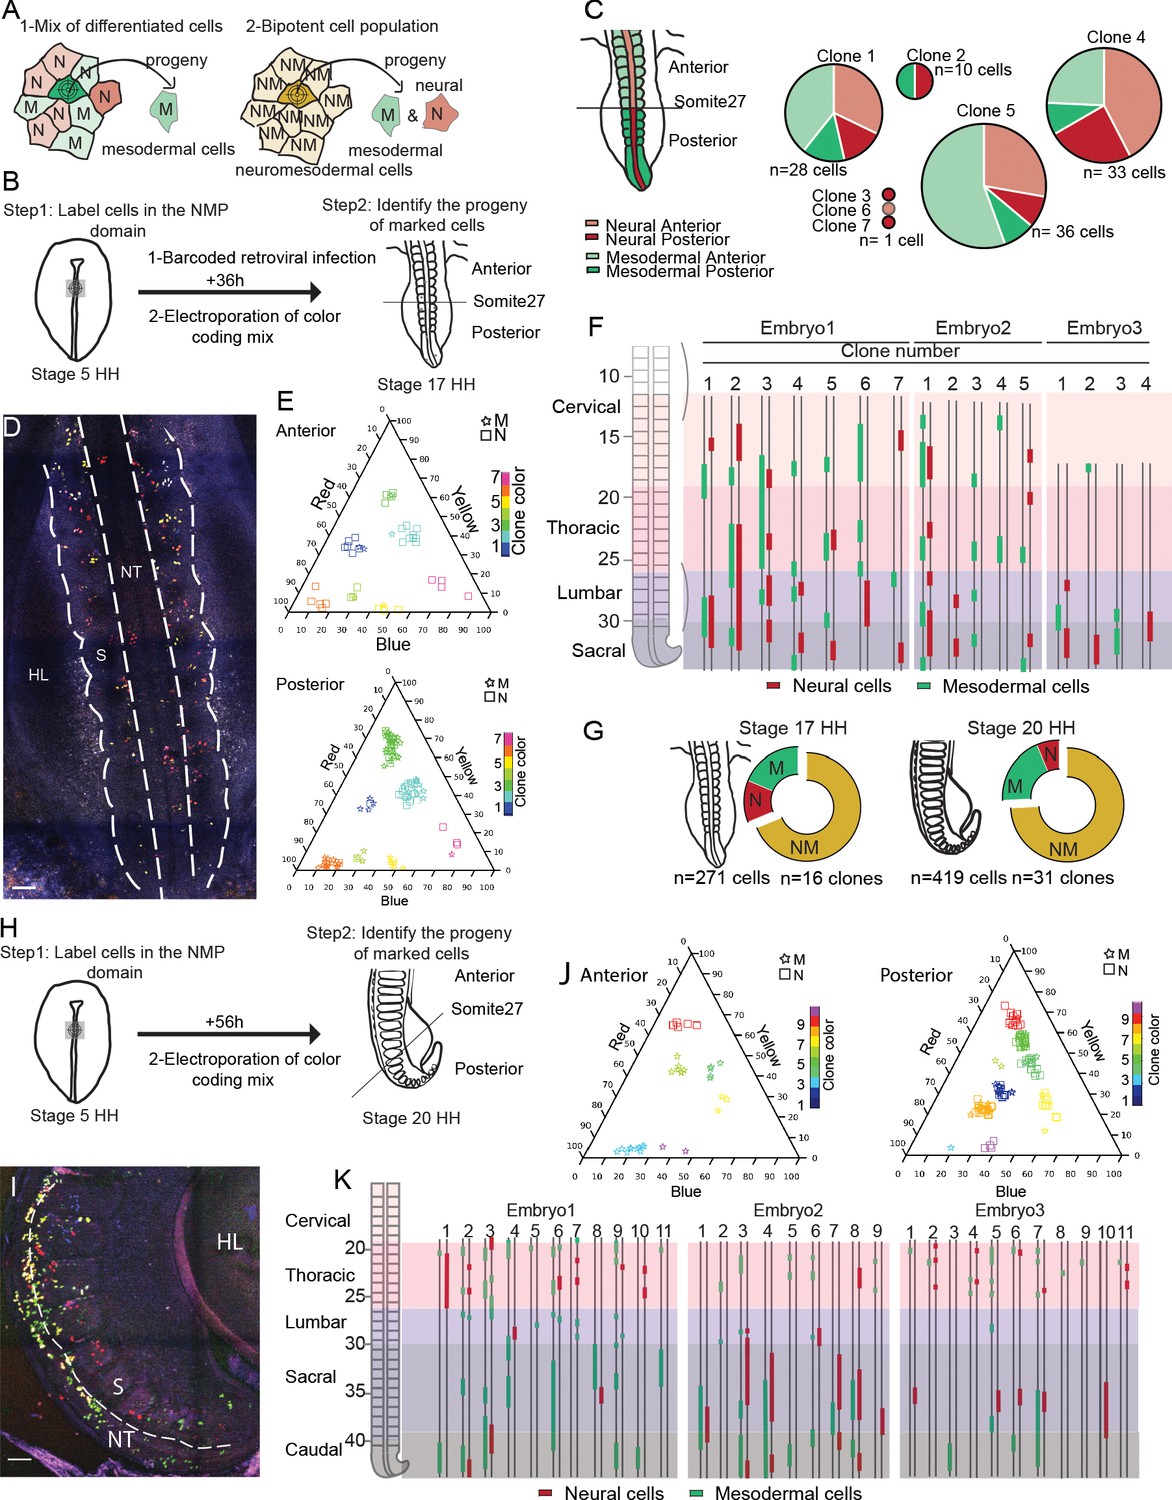
Cells of the SOX2/T-positive territory of the anterior primitive streak epiblast contribute to the neural tube and paraxial mesoderm tissues during axis formation.
(A) Schematic diagram showing the strategy used to decipher if the neuromesodermal progenitor (NMP) territory is a mix of monopotent cells (left) or composed of bipotent cells (right). Schemes show an example of a cell that has been marked by retroviral barcoding or genetic color coding and its expected outcome in the different cases (arrows). The color indicates the neural (red, N), the mesodermal (green, M), and the neuromesodermal (gold, NM) identities. (B) Experimental procedure showing the infected or electroporated region of the epiblast at stage 5HH (left, green) and the stage at which embryos were harvested for analysis (n = 3). (C) (left) Diagram showing the neural tube (red) and paraxial mesoderm (green) in the anterior (light) and posterior (dark) regions of the embryo. (Right) Pie graphs showing the distribution of the neural (red) and mesodermal (green) cells anterior (light) or posterior (dark) to the 27th somite in the seven clones identified by retrovirus labeling analyzed (n = 110 cells in three embryos). (D) Confocal z-section showing the region of a stage 17HH embryo shown in (H) and acquired using three separated laser paths to retrieve the color codes genetically encoded as described in Loulier et al., 2014. (E) Triplot diagrams showing the distribution of descendants of cells labeled with different Nucbow combinations in the anterior (top) and posterior (bottom) regions of seven clones in a representative stage 17HH embryo. Each symbol represents a cell identified based on the percentage of red, blue, and yellow expressed. The symbols are colored based on their clonal identity. Squares: neural cells; stars: mesodermal cells. (F) (left) Region analyzed showing the different axial levels. (Right) Axial distribution of the clones in three-stage 17HH embryos. Red bars: neural cells; green bars: mesodermal cells. (G) Quantification of the different clones: mesodermal (M, green), neural (N, red), and bipotent neuromesodermal clones (NM, gold) at stage 17HH (left) and stage 20HH (right) (n = 16 clones, 271 cells in three embryos) and (n = 40 clones, 519 cells in three embryos), respectively. (H) Experimental procedure showing the electroporated region of the epiblast at stage 5HH (left, green) and the stage at which embryos were harvested for analysis (n = 3). (I) Confocal z-section using three-color imaging (Loulier et al., 2014) corresponding to the posterior region of a stage 20HH embryo shown in (H). (J) Triplots showing the distribution of 10 representative clones in the anterior (left) and posterior (right) regions of a stage 20HH embryo electroporated at stage 5HH. Squares: neural cells; stars: mesodermal cells. (K) (left) Region analyzed showing the different axial levels. (Right) Axial distribution of the clones in three embryos. Green bars: mesodermal cells; red bars: neural cells, double line: anteroposterior axis. M: mesoderm; N: neural; NM: neuromesodermal; S: somite; HL: hindlimb; D: dorsal views. Anterior to the top. Scale bar: 100 µm.
-
Figure 2—source data 1
Retrovirus and Brainbow labeling of chicken embryo.
- https://cdn.elifesciences.org/articles/64819/elife-64819-fig2-data1-v1.xlsx
-
Figure 2—source data 2
Matlab code for clone identification.
- https://cdn.elifesciences.org/articles/64819/elife-64819-fig2-data2-v1.zip
Figure 2—figure supplement 1
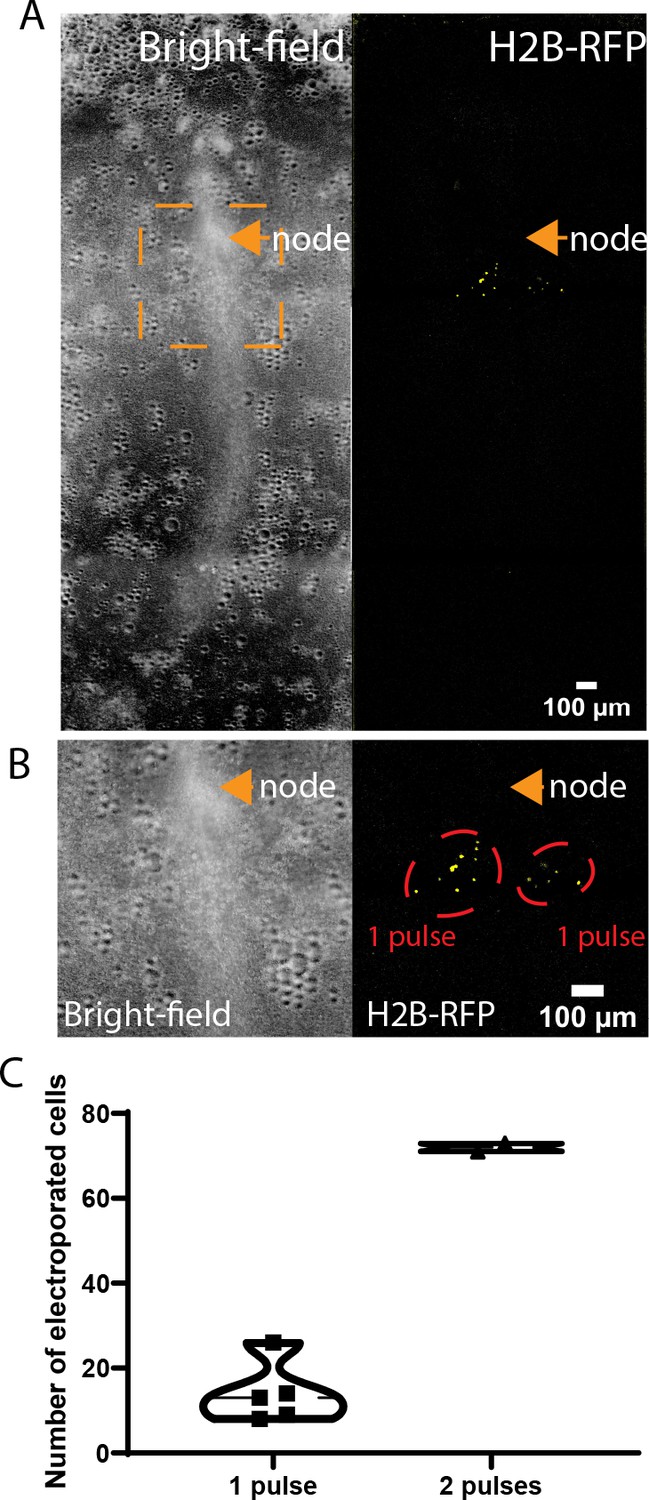
Quantification of the number of epiblast cells electroporated.
(A) Brightfield (left) and fluorescence (right) images of a stage 5HH chicken embryo 4 hr after one pulse of electroporation on each side of the anterior primitive streak (PS) with an H2B-RFP plasmid. The electroporated areas are within the orange box. (B) Higher magnification of the orange box shown in (A). Fluorescent nuclei in electroporated cells are shown in yellow, and the electroporated areas are circled in red. (C) Violin plot showing the quantification of the number of fluorescent nuclei 4 hr after one pulse or two successive pulses of electroporation at the same location (n = 4 embryos).
-
Figure 2—figure supplement 1—source data 1
Number of electroporated cells after one or two pulses.
- https://cdn.elifesciences.org/articles/64819/elife-64819-fig2-figsupp1-data1-v1.xlsx
Figure 3 with 4 supplements

Single-cell RNA-sequencing (scRNAseq) analysis of the posterior tissue precursors during posterior axis formation.
(A–C) (left) Diagrams of a stage 5HH (A), a 6-somite (B), and a 35-somite (C) chicken embryo showing the region dissected and analyzed by scRNAseq in the hatched red boxes, which includes the NMP territory (in gold). (Right) k-NN graph showing the 2059 cells sequenced from stage 5HH embryos (A), the 1628 cells sequenced from 6-somite embryos (B), and the 3561 cells sequenced from 35-somite embryos (C) visualized with Uniform Manifold Approximation and Projection (UMAP). Single cells are colored based on Leiden clustering identities. (D) Dotplot showing the expression level of NMP signature genes in the chicken neural, NMP, and PSM clusters. (E–G) k-NN graphs combining all sequenced cells from stage 5HH, 6-somite and 35-somite chicken embryos (total: 7992 cells), visualized with UMAP and colored following Leiden clustering to show cell identities (E), or by developmental stage (F) or to show cells of the neural, NMP, PSM, and somite clusters (in red), which were used for the subsequent analysis shown in (H–J). Note that cells in the tan color belong to different cluster identities with less than 50 cells, and we decided to show them to represent the entirety of the data but do not analyze them in our study. (H–J) k-NN graphs showing cells of the chicken neural, NMP, PSM, and somite clusters extracted based on the analysis shown in (E–G) (total: 2801 cells) from stage 5HH, 6-somite, and 35-somite visualized with diffusion map (diffmap) and analyzed using Leiden clustering to show cell identities that include neural, NMP, PSM, and somite (H), as well as the developmental stage (I) or pseudo-temporal ordering with the NMP cluster as the starting node (J). (K–M) k-NN graphs showing cells of the mouse neural, NMP, and PSM clusters extracted based on the analysis shown in Figure 3—figure supplement 3 (total: 27,083 cells) from stage E7.0–E9.5 visualized with diffusion map (diffmap) and analyzed using Leiden clustering to show cell identities that include neural, NMP, and PSM (K), as well as the developmental stage (L) or pseudo-temporal ordering with the NMP cluster as the starting node (M). (N) Dotplot showing the expression level of NMP signature genes in mouse in the neural, NMP, and PSM clusters. Ecto: ectoderm; Endo: endoderm; Epi: epiblast; Meso: mesoderm; LP: lateral plate; NMP: neuromesodermal progenitors; NT: neural tube; NC: notochord; PSM: presomitic mesoderm; postPS: posterior PS; SOM: somite; LP2: lateral plate 2; MG: mixed gastrulation in (D, N). Circle size shows the percentage of cells expressing the gene in the cluster. Color shows the normalized level of expression. Normalization is done by gene across the clusters.
Figure 3—figure supplement 1
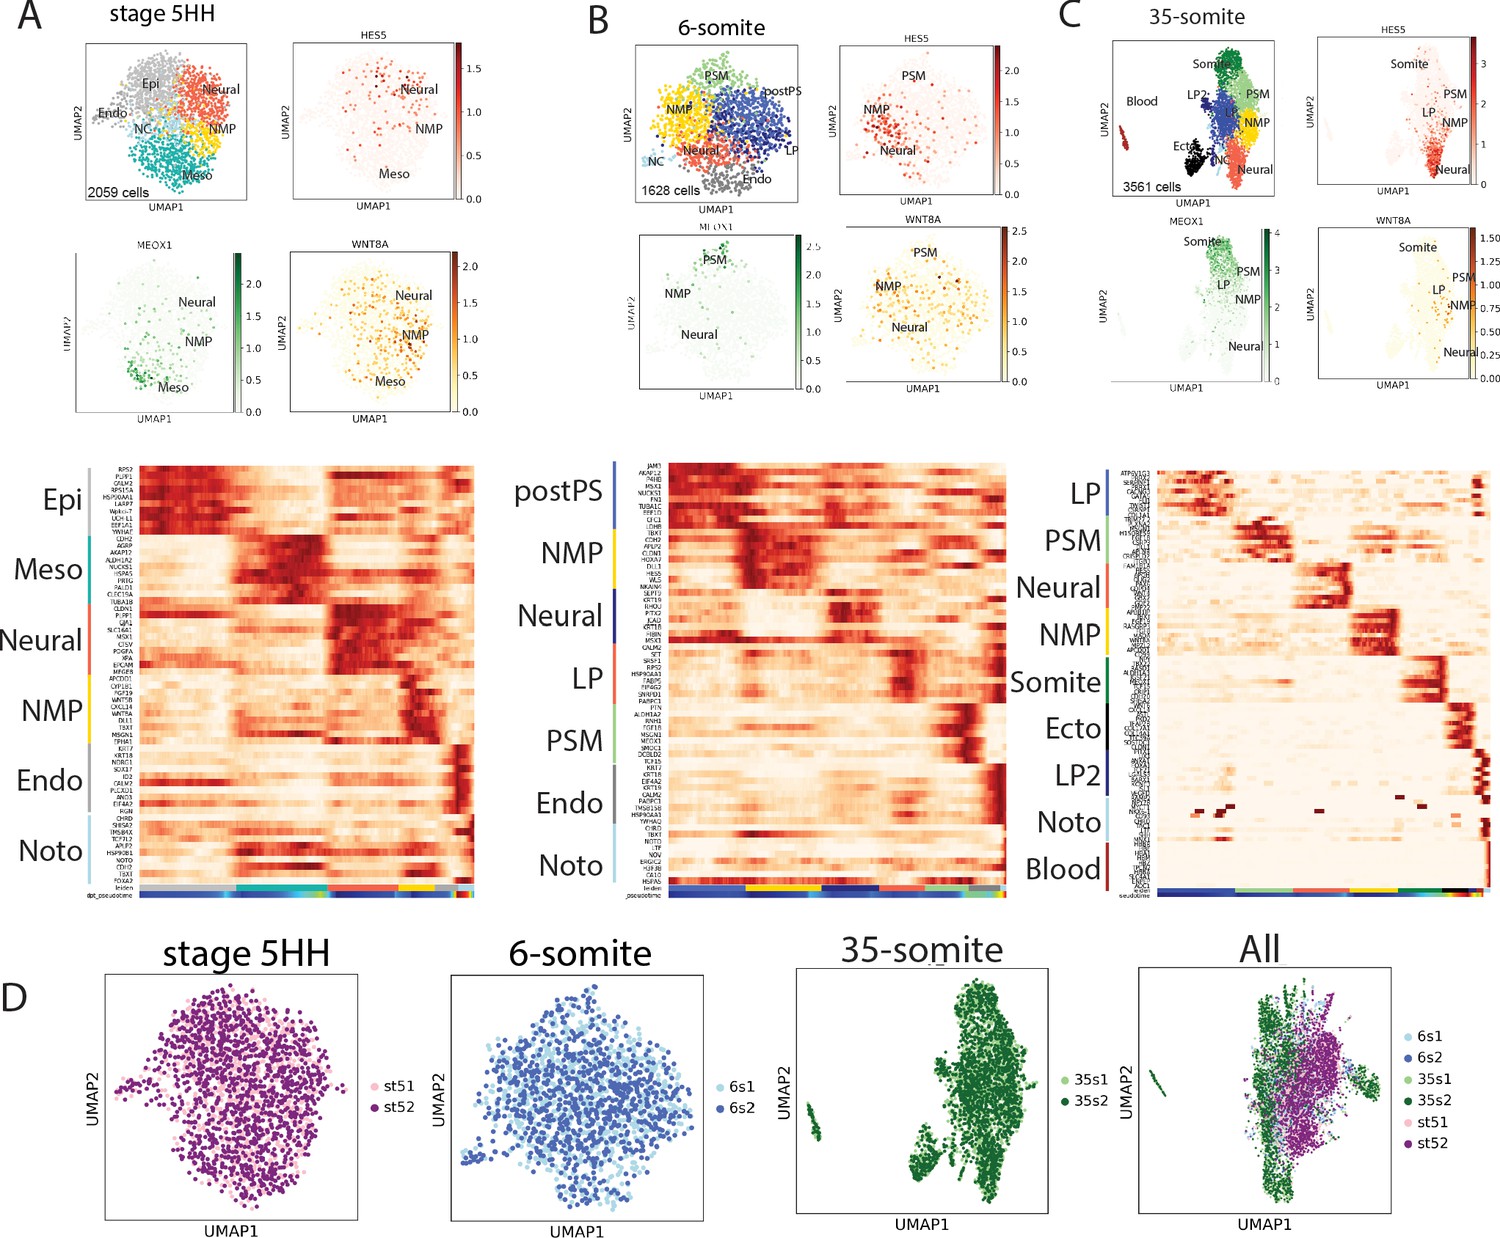
Single-cell RNA-sequencing (scRNAseq) analysis of stage 5HH to 35-somite chicken embryos.
(A–C) Top: Uniform Manifold Approximation and Projection (UMAP) plots showing Leiden clustering of the three chicken stages analyzed and the expression of neural (HES5), mesodermal (MEOX1), and neuromesodermal (WNT8A) genes in red, green, and gold respectively. Bottom: Heat maps showing the top 10 differentially expressed genes for each clusters. (D) UMAP plots of the different batches of cells within the corresponding stages analyzed. Pink and purple (stage 5HH); light and dark blue (6-somite); light and dark green (35-somite); and a merge of all the stages (All).
Figure 3—figure supplement 2
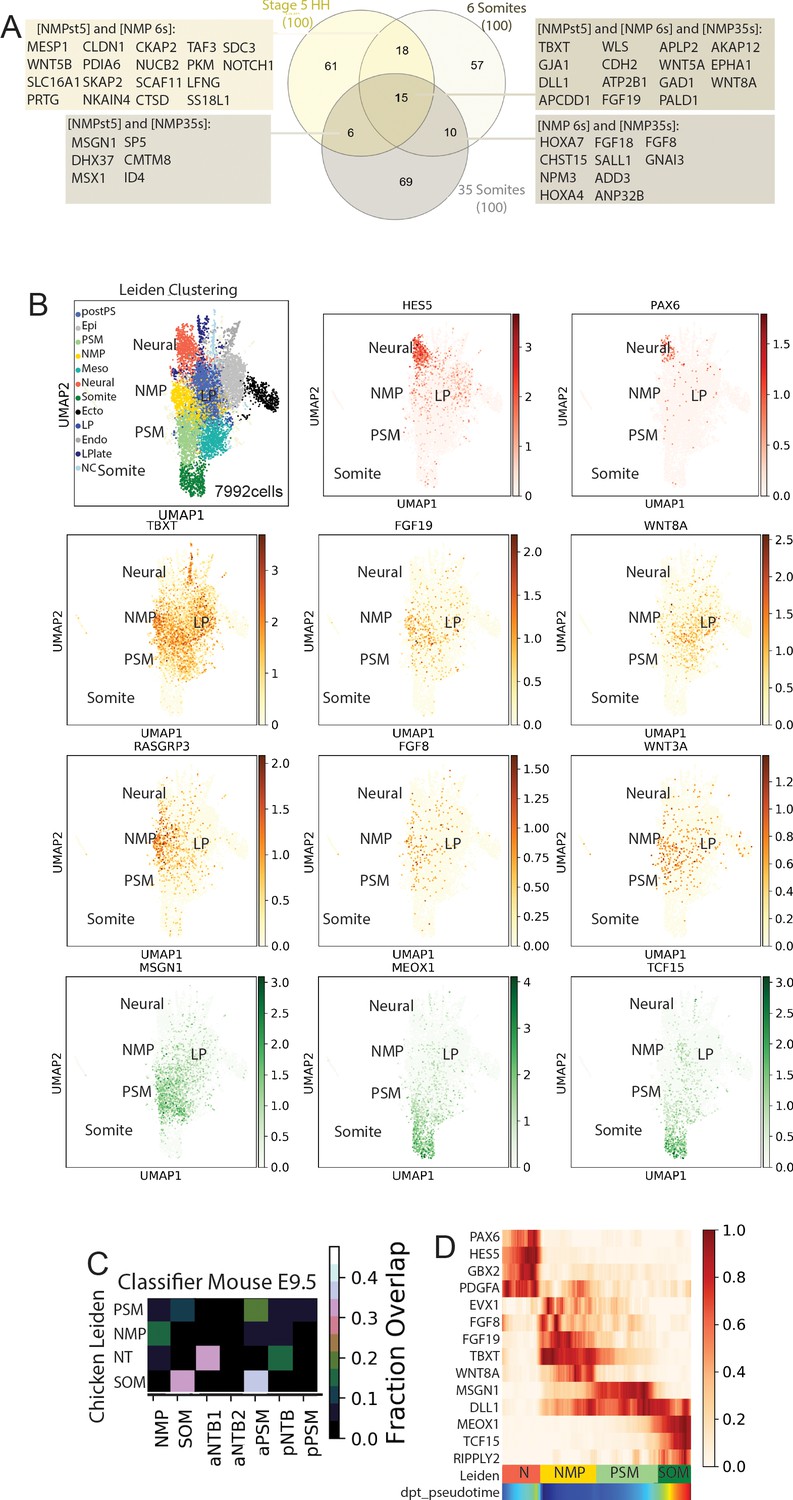
Analysis of combined data from stage 5HH, 6-somite, and 35-somite chicken embryos and identification of chicken neuromesodermal progenitor (NMP) signature genes.
(A) Venn diagram showing the intersection of the top 100 differentially expressed genes from stage 5HH, 6-somite, and 35-somite embryos. (B) Uniform Manifold Approximation and Projection (UMAP) plots showing Leiden clustering of the data combined from the three chicken developmental stages and the expression of the neural tube (HES5, PAX6), mesodermal (MSGN1, MEOX1, TCF15), and neuromesodermal (TBXT, FGF19, WNT8A,RASGRP3, FGF8, WNT3A) genes in red, green, and gold, respectively. (C) A k-NN classifier (linear discriminant analysis [LDA]) trained on clusters of the E9.5 mouse was used to predict identities of cells of the clusters (Diaz-Cuadros et al., 2020). The heat map shows the fraction of E9.5 assignments for each cluster. SOM: somite; aNTB: anterior neural tube; pNTB: posterior neural tube; PSM: presomitic mesoderm. (D) Pseudo-temporal ordering of gene expression. Heat map showing genes with significant dynamic expression ordered by peak expression, and selected markers of the neural (N) (PAX6, HES5, GBX2, PDGFA) and paraxial mesoderm (MSGN1, DLL1, MEOX1, TCF15, RIPPLY2) differentiation from the NMP state (EVX1, FGF8, FGF19, TBXT, WNT8A). Color bars indicate Leiden cluster identities and pseudo-temporal position.
Figure 3—figure supplement 3
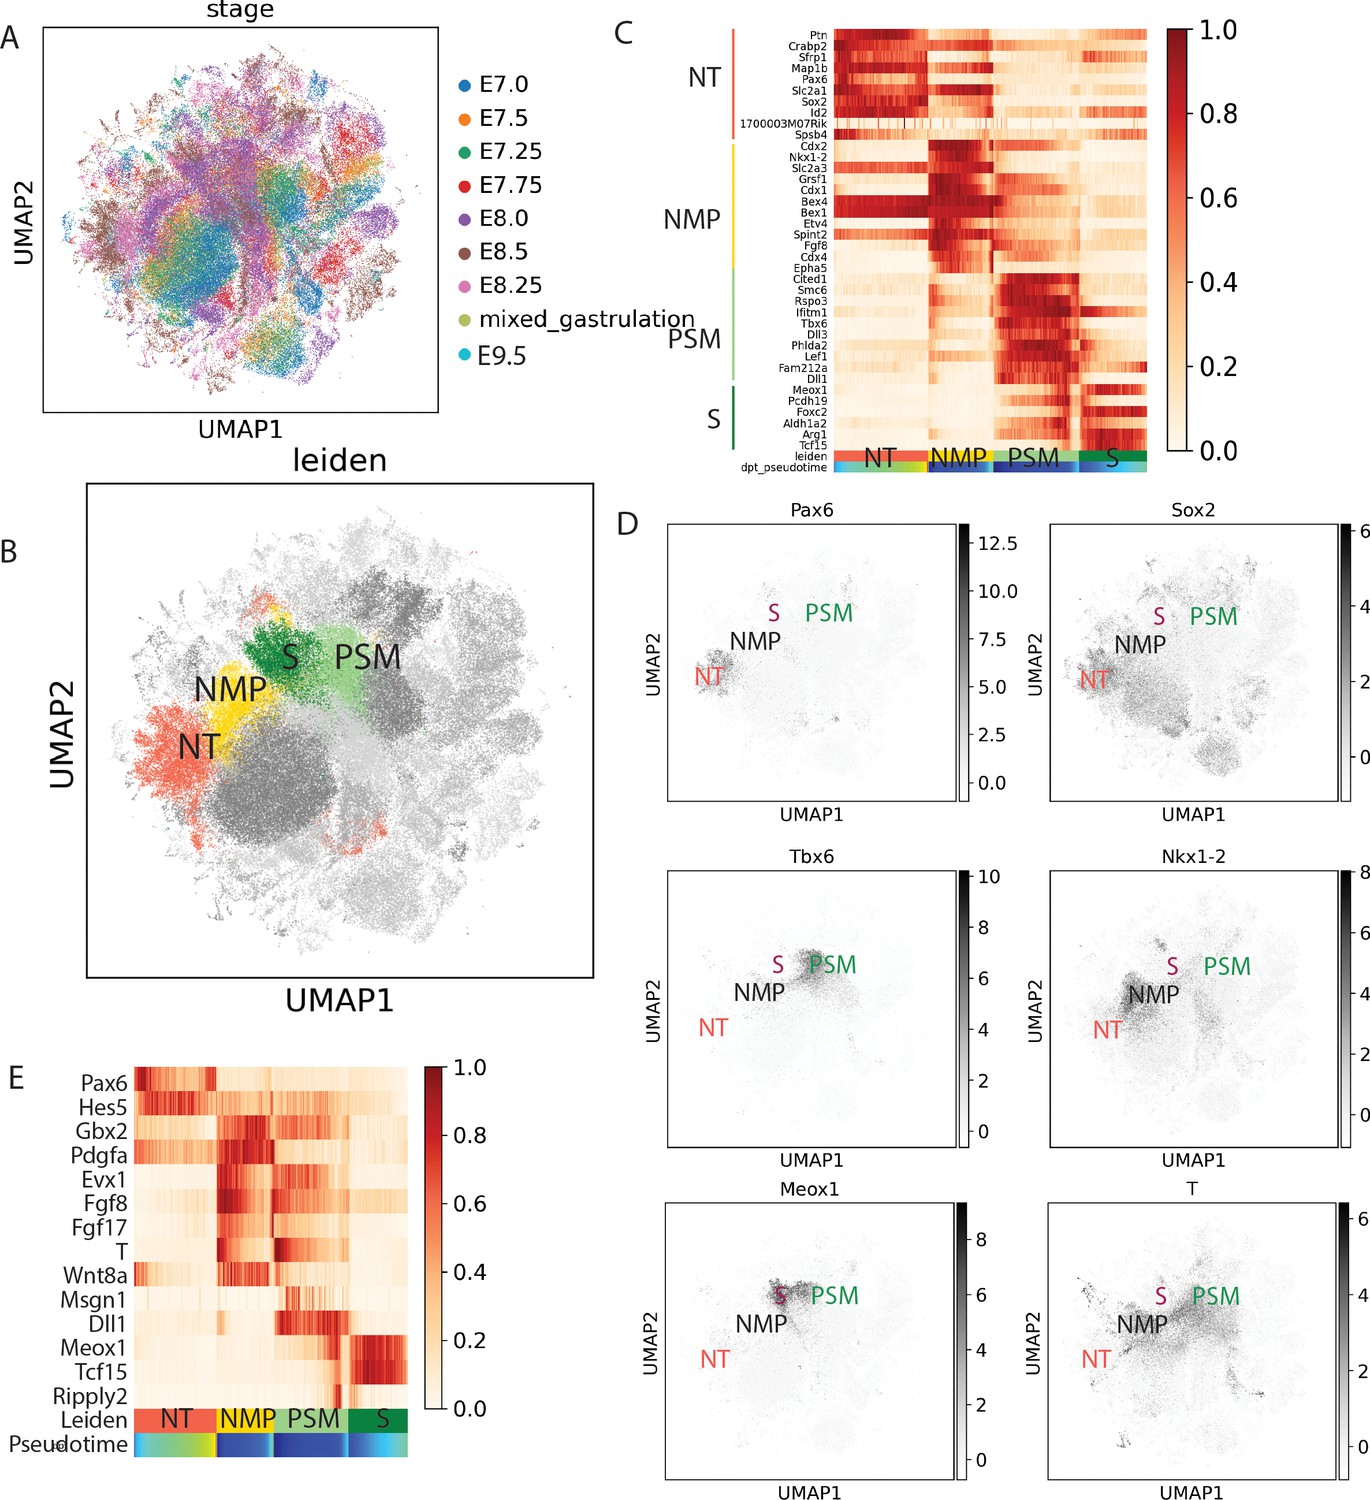
Analysis of combined data from E7.0 to E9.5 mouse embryos to identify the neuromesodermal progenitor (NMP), presomitic mesoderm (PSM), neural, and somite clusters.
(A) Uniform Manifold Approximation and Projection (UMAP) showing the integration of the two mouse datasets (Pijuan-Sala et al., 2019 and Diaz-Cuadros et al., 2020) by stage (n = 120,679 cells), (B) Identification of the neural tube (NT), NMP, PSM, and somite (S) clusters from the dataset shown in (A) using the Leiden algorithm. (C) Expression of the genes used for identifying the NT (Pax6, Sox2), NMP (Nkx1.2, T, Sox2), PSM (T, Tbx6), and somite (Meox1) clusters identification (D). NT (red), NMP (pink), PSM (green), and somite (purple). (C) Heat map showing the top 10 differentially expressed genes for the NT, PSM, NMP, and somite clusters. (C–E) Pseudo-temporal ordering of gene expression in cells of the NMP, PSM, neural tube, and somite clusters. Heat map showing the genes with significant dynamic expression ordered by peak expression, and selected markers of the neural (Pax6, Hes5, Gbx2, Pdgfa) and paraxial mesoderm (Msgn1, Dll1, Meox1, Tcf15, Ripply2) differentiation from the NMP state (Evx1, Fgf8, FGF17, T, Wnt8a). Color bars indicate Leiden cluster identities and pseudo-temporal position. Neural: red; PSM: light green; somite: dark green; NMP: gold.
Figure 3—figure supplement 4

Expression of neuromesodermal progenitor (NMP) signature genes in chicken and mouse.
(A, B) Projections of the expression of NMP signature genes on the diffmap plots (top left) of the nNeural tube (NT), NMP, presomitic mesoderm (PSM), and somite (S) clusters identified with the Leiden algorithm in chicken (A) and mouse embryos (B).
Figure 4 with 1 supplement

NMPs trajectory analysis in silico.
(A, B) (left) Uniform Manifold Approximation and Projection (UMAP) projection of cells of the NMP, neural, and PSM clusters, extracted from the mouse (A) and chicken (B) datasets showing the cell types identified following Leiden unsupervised clustering and differential gene-expression analysis. 2362 cells for the chicken dataset and 12072 cells for the mouse dataset. (Middle) Developmental trajectories of the cells of the NMP, PSM, and neural tube clusters at day E9.5 in the mouse dataset and stage 35 somites in the chicken dataset identified with the Waddington-OT pipeline. Optimal transport was used to infer temporal couplings in the mouse dataset at time E7, E7.15, E7.25, E7.5, 7E.75, E8, E8.5, E9, and in the chicken dataset at stage 5HH, 6 somites, 35 somites, subclustered for NMP, PSM, and neural tube. (Right) Distribution of cells by developmental age. (C, D) Transition tables representing the amount of mass transported from NMPs to the other cell types from day E7 to day E9.5 for the mouse dataset (C) and from stage 5HH to 35 somites for the chicken dataset (D). (E) Predicted transcription factors enriched in cells most likely to transition to each particular fate from day E7 to day E9.5 for the mouse dataset and from stage 5HH to 35-somites for the chicken dataset (transcription factors found in the mouse dataset but not in the chicken dataset are annotated with *). (F, G) Normalized Log gene expression of the predicted transcription factors for each cell type during axis elongation in mice (F) and chicken (G). NMP: neuromesodermal progenitors; PSM: presomitic mesoderm.
Figure 4—figure supplement 1
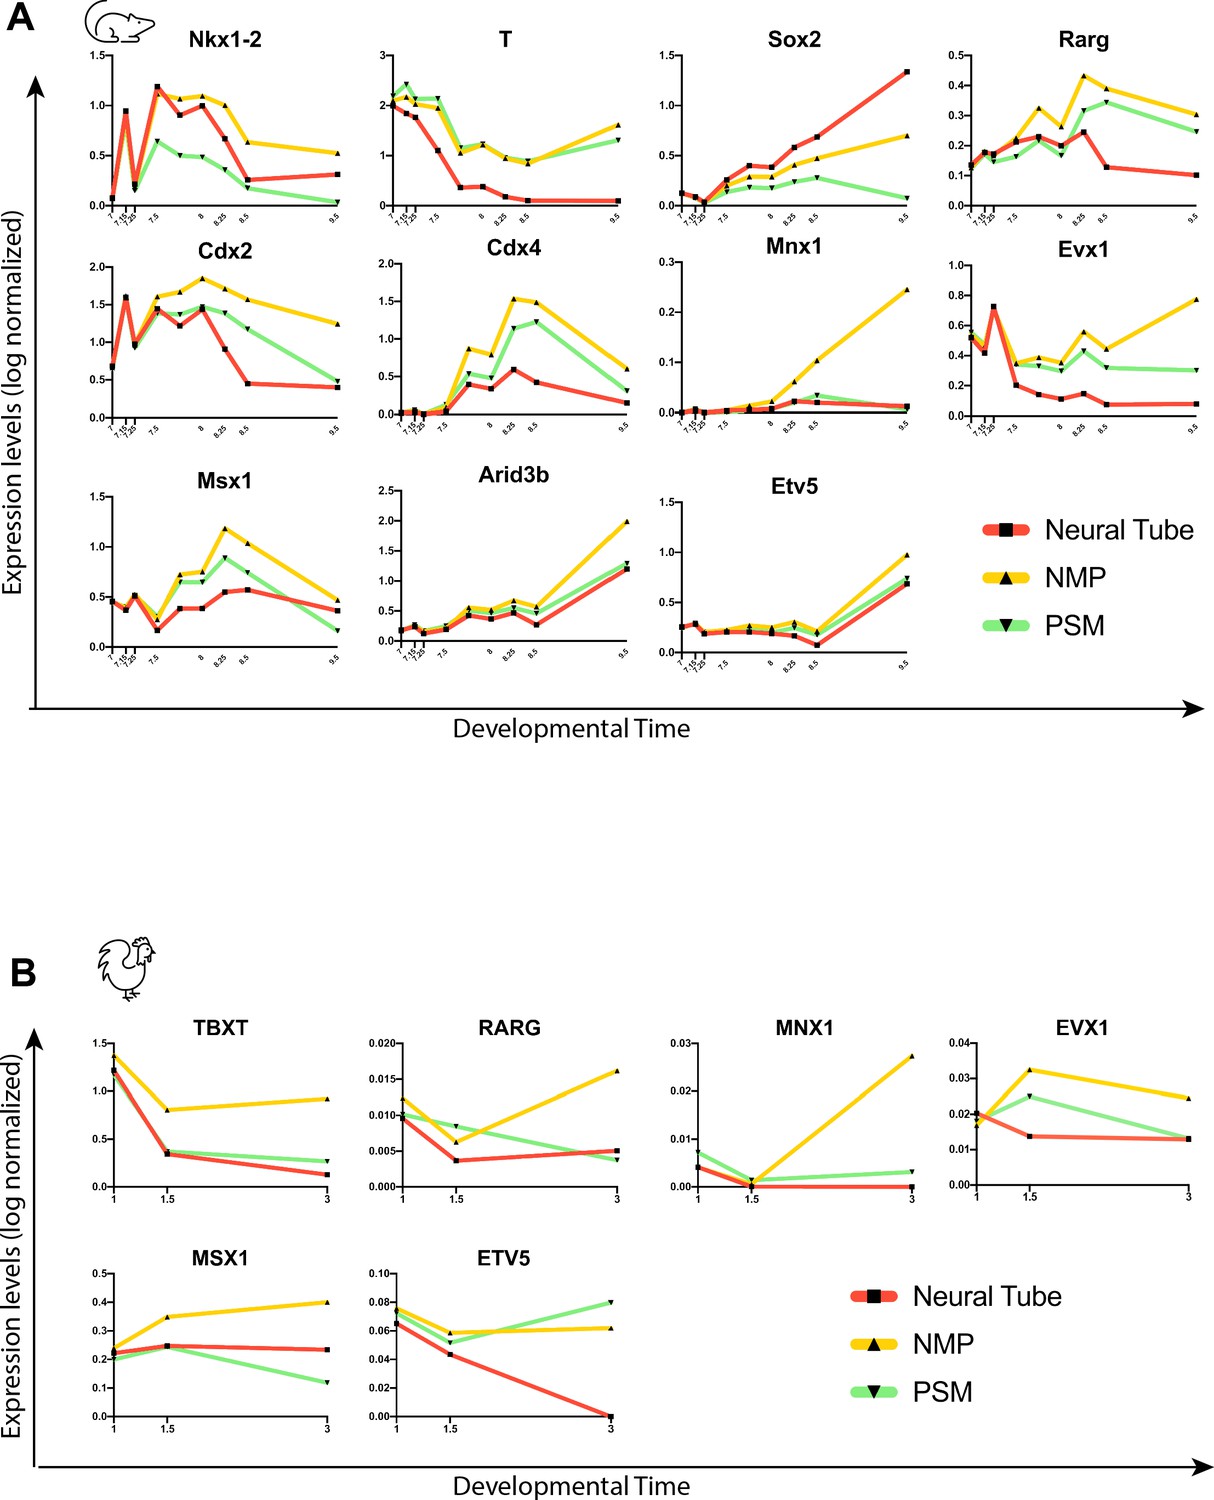
Predictive transcription factor gene trends along trajectory of the neuromesodermal progenitor (NMP) fate.
(A) Mice and (B) chicken. Log-normalized expression of the predicted transcription factors associated with the NMP fate during development. X-axis represents developmental time in days.
Figure 5 with 1 supplement
Downregulation of neuromesodermal progenitors’ (NMPs) epithelial phenotype during development.
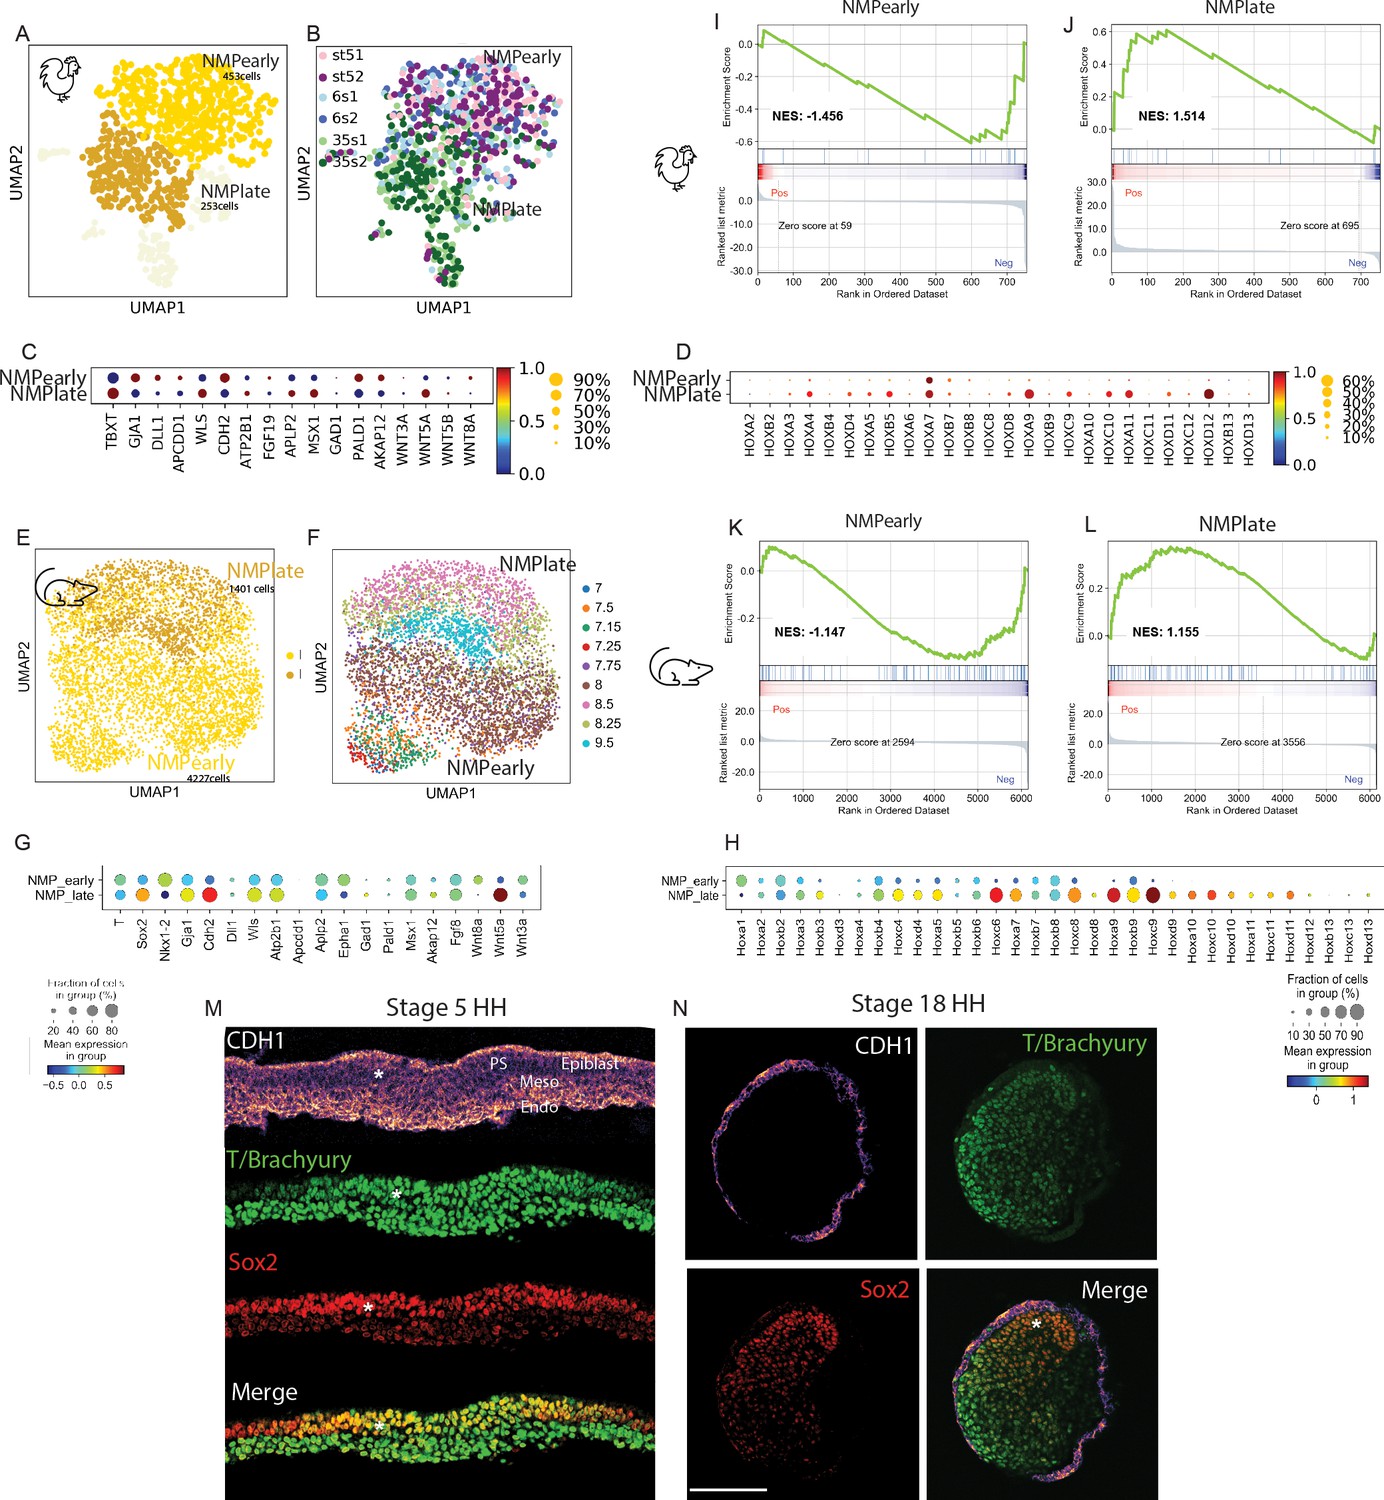
(A, B) k-NN graphs showing cells of the chicken NMP cluster identified in the analysis shown in Figure 3H (total: 706 cells) from stage 5HH, 6-somite, and 35-somite visualized with Uniform Manifold Approximation and Projection (UMAP) and analyzed using Leiden clustering. Major clusters include an NMP early cluster (gold) and an NMP late cluster (goldenrod) (A). (B) Distribution of cells by developmental age. (C, D) Dotplot showing the expression levels of NMP signature (C) and HOX genes (D) in chicken NMP clusters. (E, F) k-NN graphs showing cells of the mouse NMP cluster identified in the analysis shown in Figure 3K (total: 5628 cells) from stage E7.0–E9.5, visualized with UMAP and analyzed using Leiden clustering. Major clusters include the early NMP and late NMP clusters (E). (F) Distribution of cells by developmental age. (G) Dotplot showing the expression levels of NMP signature genes in mouse NMP clusters. Note that Fgf19 is not expressed in mouse. Both Sox2 and Nkx1.2 genes are detected in mouse data and added to the dotplot. (H) Dotplot showing the expression levels of Hox genes in mouse NMP clusters. (I–L) Gene Set Enrichment Analysis (GSEA) of early NMP clusters in chicken (I) and mouse (J) and of late NMP clusters in chicken (K) and mouse (L) using the Hallmark Epithelium to Mesenchymal Transition gene set. The normalized enrichment score (NES) is based on the gene set enrichment scores and accounts for differences in gene set size and in correlations between gene sets and the expression dataset. The top portion of the plot shows the running enrichment score (ES) for the gene set as the analysis walks down the ranked list. The middle portion of the plot shows where the members of the gene set appear in the ranked list of genes. The bottom portion of the plot shows the value of the ranking metric as you move down the list of ranked genes. (M, N) Representative immunostaining of E-cadherin/CDH1, T/Brachyury, and SOX2 in cryosections of the NMP-containing anterior PS region in stage 5HH (M) and of the tail bud region of stage 18HH (N) in chicken embryos. PS: primitive streak; Endo: endoderm; Meso: mesoderm; PSM: paraxial mesoderm; Nt: neural tube. Asterisk shows the NMP domain dorsal to the top (M). D: dorsal; V: ventral and anterior to the top (N). Scale bar: 100 µm (n = 3 embryos). Circle sizes in (C, D, G, H) show the percentage of cells expressing the gene in the cluster. Color shows the normalized level of expression. Normalization is done by clusters across all the Hox genes.
-
Figure 5—source data 1
Time in the primitive streak before ingression from the tracking.
- https://cdn.elifesciences.org/articles/64819/elife-64819-fig5-data1-v1.xlsx
Figure 5—figure supplement 1
Characterization of the early and late neuromesodermal progenitor (NMP) clusters.
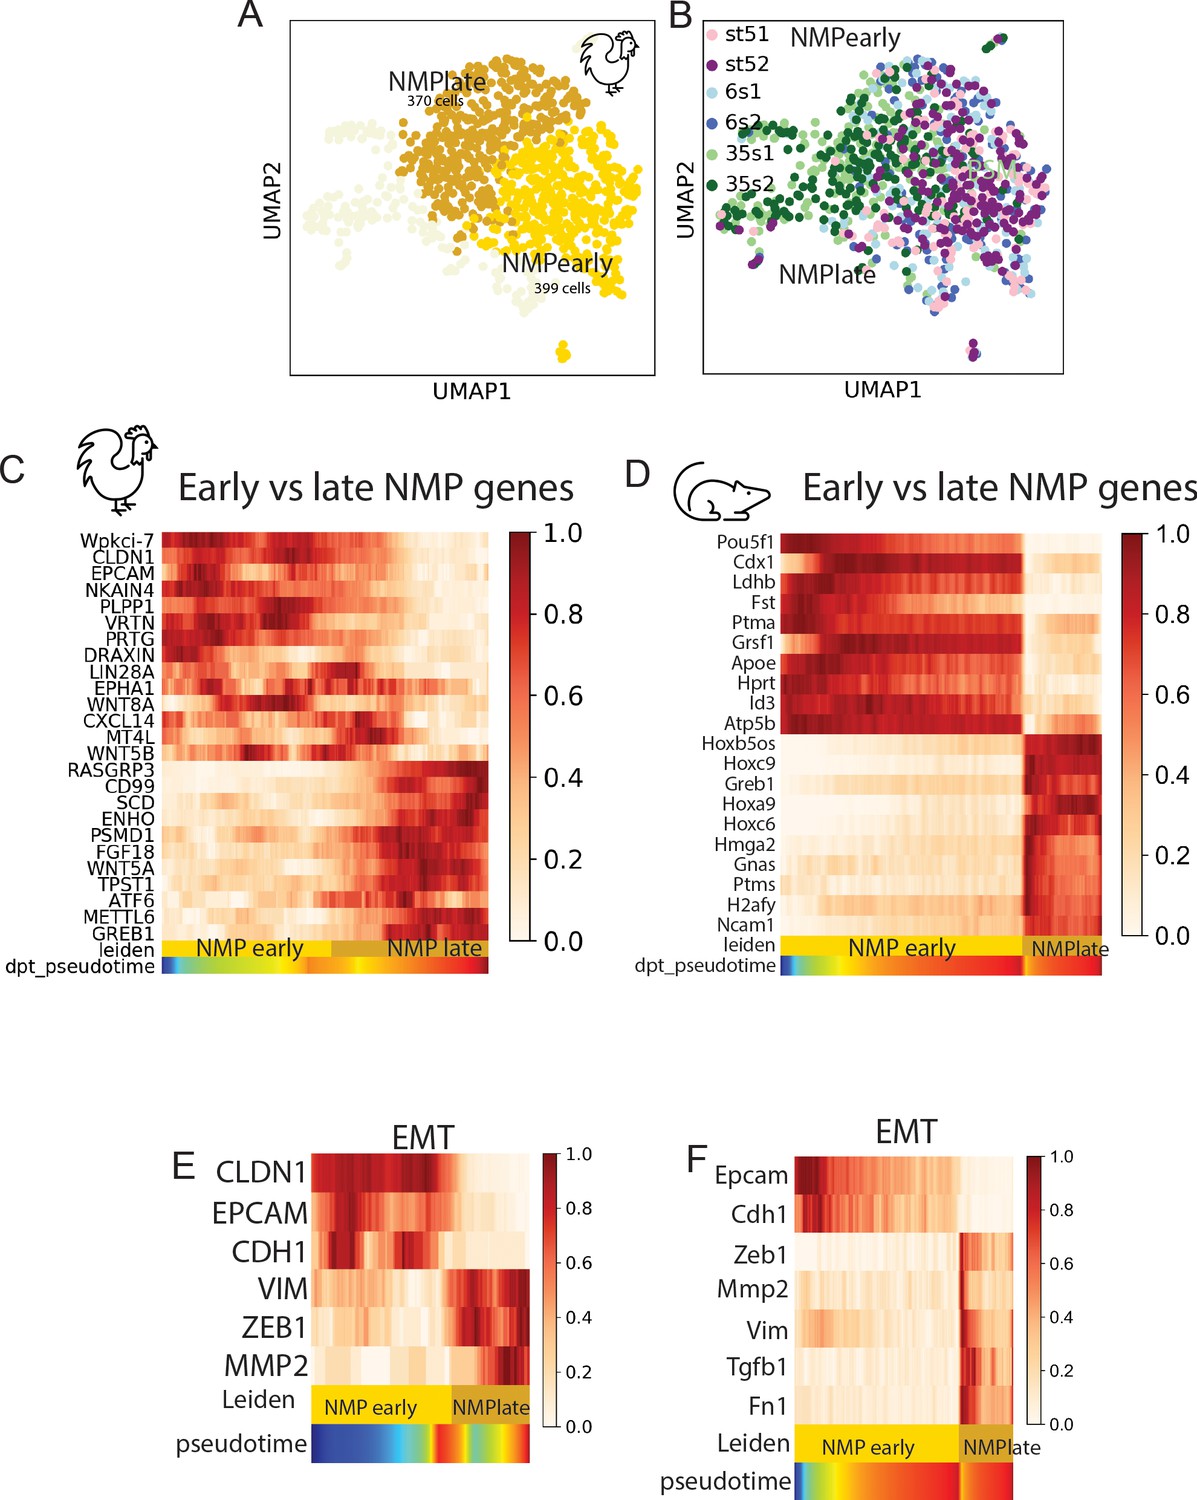
(A, B) k-NN graphs visualized with Uniform Manifold Approximation and Projection (UMAP) showing cells of the chicken NMP cluster (of the three developmental stages) after Hox genes removal from the analysis. Leiden clustering was used to show cell identities, which include an early NMP cluster (NMP gold) and a late NMP cluster (NMP, dark gold) (A), as well as the distribution of cells by developmental stage (B) (n = 769 cells). (C, D) Pseudo-temporal ordering of the genes differentially expressed in the early and late NMP clusters in chicken (C) and mouse (D). Color bars indicate Leiden cluster identities and pseudo-temporal position. (E, F) Heat map showing expression of genes associated with the epithelial (CLDN1, EPCAM, CDH1) and mesenchymal (TWIST1, VIM, ZEB1, MMP2) states in chicken (E) and mouse (F). Color bars indicate Leiden cluster identities and pseudo-temporal position.
Figure 6 with 1 supplement
Limited convergence and ingression of the NMP territory in the epiblast.
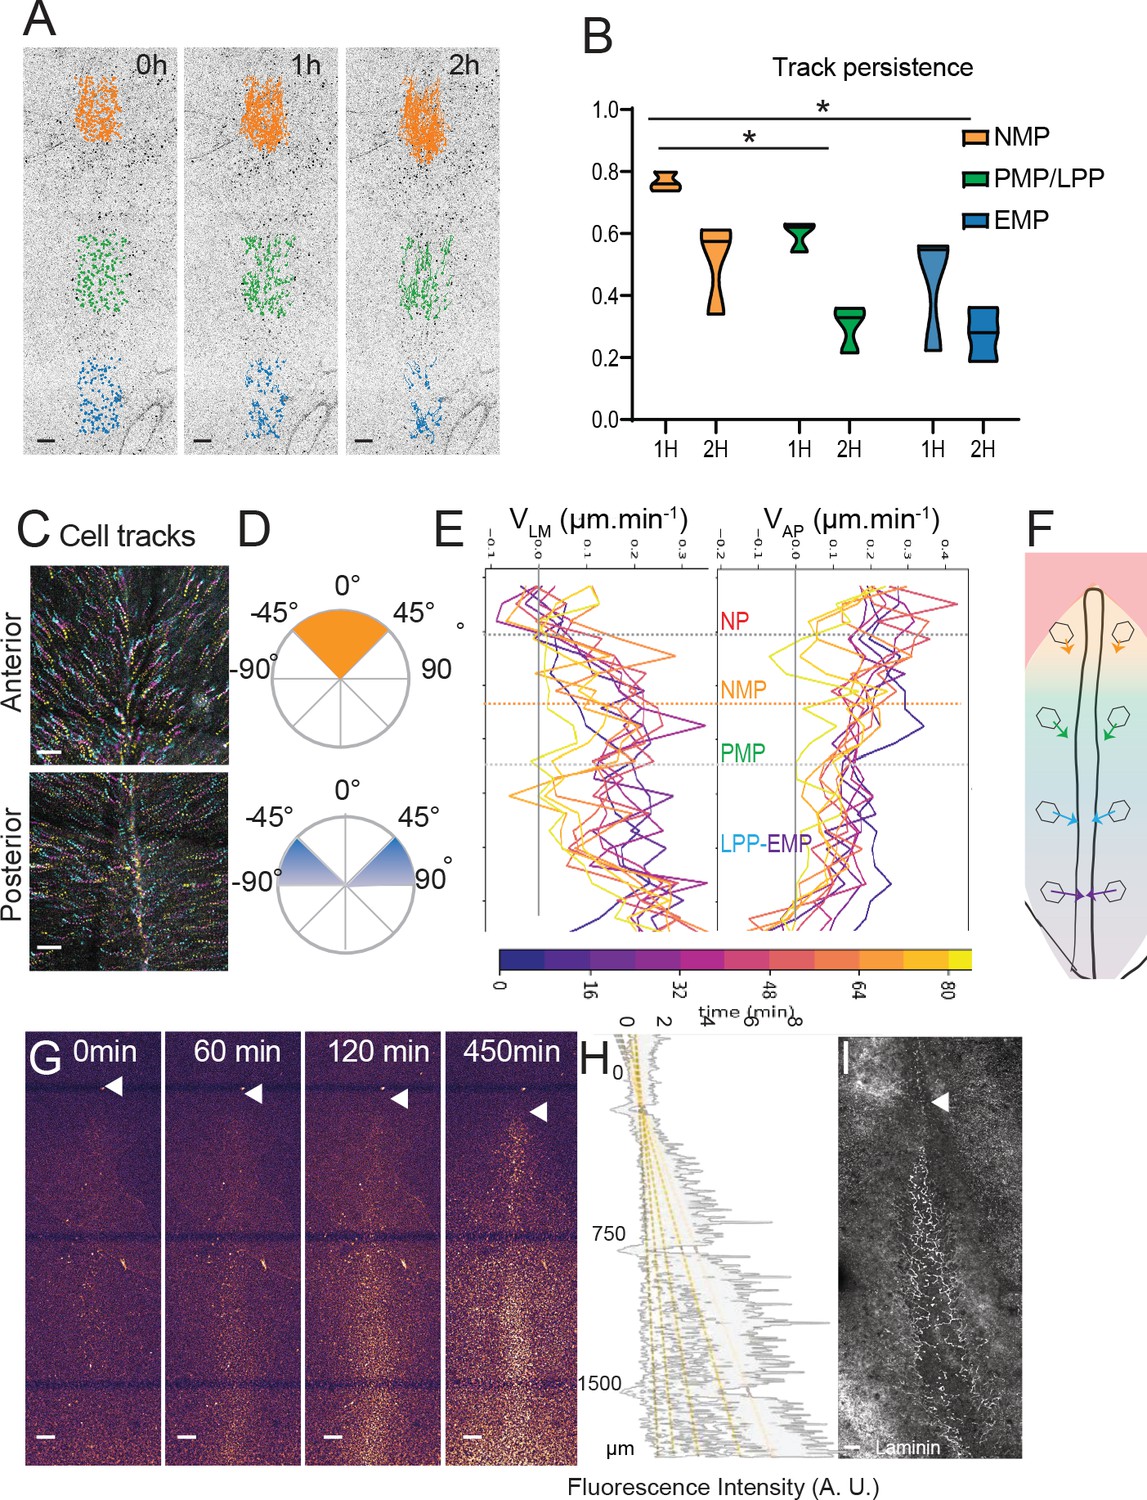
(A) Representative snapshots from a time-lapse movie of a stage 5HH chicken embryo in which the epiblast was labeled with nuclear red (Video 4). Tracks of single-labeled nuclei are shown at three different PS levels at three different timepoints (0, 1, and 2 hr) to illustrate differences in longevity of the cells (n = 3 embryos) (NMP: gold; PMP/LPP: green; EMP: blue). (B) Quantification of tracks longevity measured as the ratio of tracks number after 1 and 2 hr divided by the number of tracks at t0 in each of the colored regions shown in Figure 3A. t0 marks the start of time-lapse movies of stage 5HH chicken embryos labeled with nuclear red. Gold, green, and blue show tracks in the NMP, PMP/LPP, and EMP domains, respectively, corresponding to the tracks shown in Figure 5A (n = 3; n = 1502 tracks). Two-way ANOVA NMP-PMP/LPP; NMP-EMP. *p<0.05. (C) Representative color-coded time projection showing tracks of epiblast cells at the anterior and posterior PS level after nuclear red labeling in a stage 5HH chicken embryo. The tracks color code represents early timepoints in cyan and later timepoints in yellow (n = 3 embryos). (D) Representative quantification of the angle with the midline of tracks shown in (C). Top: anterior PS region; bottom: posterior PS region (n = 3 embryos). (E) Representative mean lateral to medial speed (VLM) and anterior to posterior speed (VAP) over time of epiblast cells labeled with nuclear red in stage 5HH chicken embryos. Y axis represents AP position along the embryo. Color code indicates time of measurement since beginning of the movie (n = 3 embryos). (F) Diagram showing the main direction of epiblast cell movements as a function of their AP position in the epiblast. The length of arrows is proportional to convergence speed. (G) Representative snapshots from a confocal movie of the PS region of a chicken embryo labeled dorsally at stage 5HH with nuclear red and imaged from the ventral side to show epiblast cells ingression (n = 3 embryos). (H) Representative intensity measurement of the nuclear red signal from the ventral side along the PS of the movie shown in (G). Y axis, distance to Hensen’s node (n = 3 embryos). (I) Representative whole-mount immunohistochemistry with anti-laminin (white) in a stage 5HH chicken embryo. Ventral view (n = 3 embryos). Dorsal views, anterior to the top. EMP: extraembryonic progenitors; NMP: neuromesodermal progenitors; PMP: presomitic mesoderm progenitor; LPP: lateral plate progenitor; PS: primitive streak. Arrowhead shows Hensen’s node position. Scale bar: 100 µm.
-
Figure 6—source data 1
Double-positive T/SOX2 cells, pattern of cell division, and time in the primitive streak before ingression.
- https://cdn.elifesciences.org/articles/64819/elife-64819-fig6-data1-v1.xlsx
Figure 6—figure supplement 1
Quantification of longevity, cell speed, and trajectories in time-lapse movies of nuclear red-labeled chicken embryos.
(A) Maximum time color-coded projection showing the tracks of cells labeled with nuclear red in a stage 5HH chicken embryo analyzed at the 6-somite stage. Early to later timepoints are indicated by cyan to magenta to yellow color code. (B, C) Mean medial to lateral speed (VML, C) and anterior to posterior speed (VAP, D) over time of epiblast cells labeled with nuclear red in stage 5HH chicken embryos imaged by confocal imaging in vitro at the 5-somite stage. Y axis represents AP position along the embryo. The color code indicates the time of analysis from purple to yellow where blue is t = 0 min (stage 7HH) and yellow is t = 184 min. (D, E) Color-coded time projection of the epiblast cells labeled in ovo with nuclear red in stage 5HH chicken embryos, imaged by confocal imaging in vitro (D) showing different track angles with the midline quantified in (E). Early timepoints are in cyan, later timepoints are in yellow. Dorsal views, anterior to the top. EMP: extraembryonic progenitors; NP: neural plate; NMP: neuromesodermal progenitors; PMP: presomitic mesoderm progenitor; LPP: lateral plate progenitor; PS: primitive streak (n = 3 embryos). Scale bar: 100 µm.
Figure 7 with 1 supplement
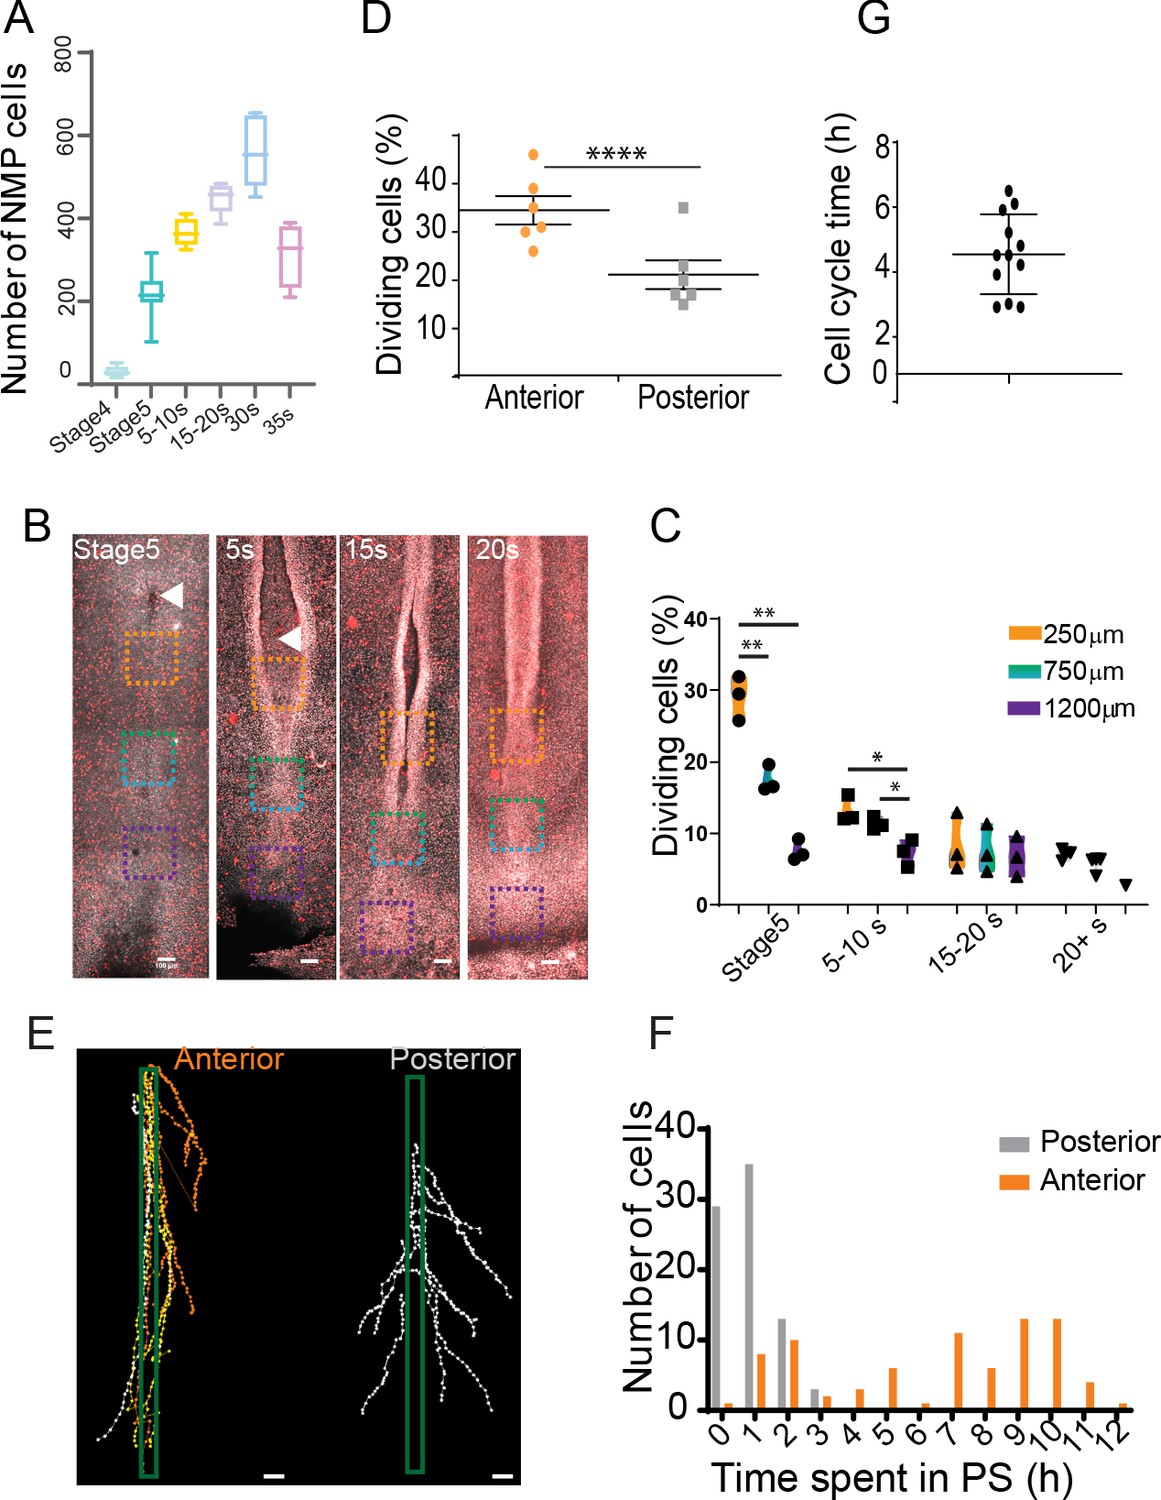
An anterior to posterior gradient of proliferation counteracts ingression in the anterior primitive streak (PS) epiblast.
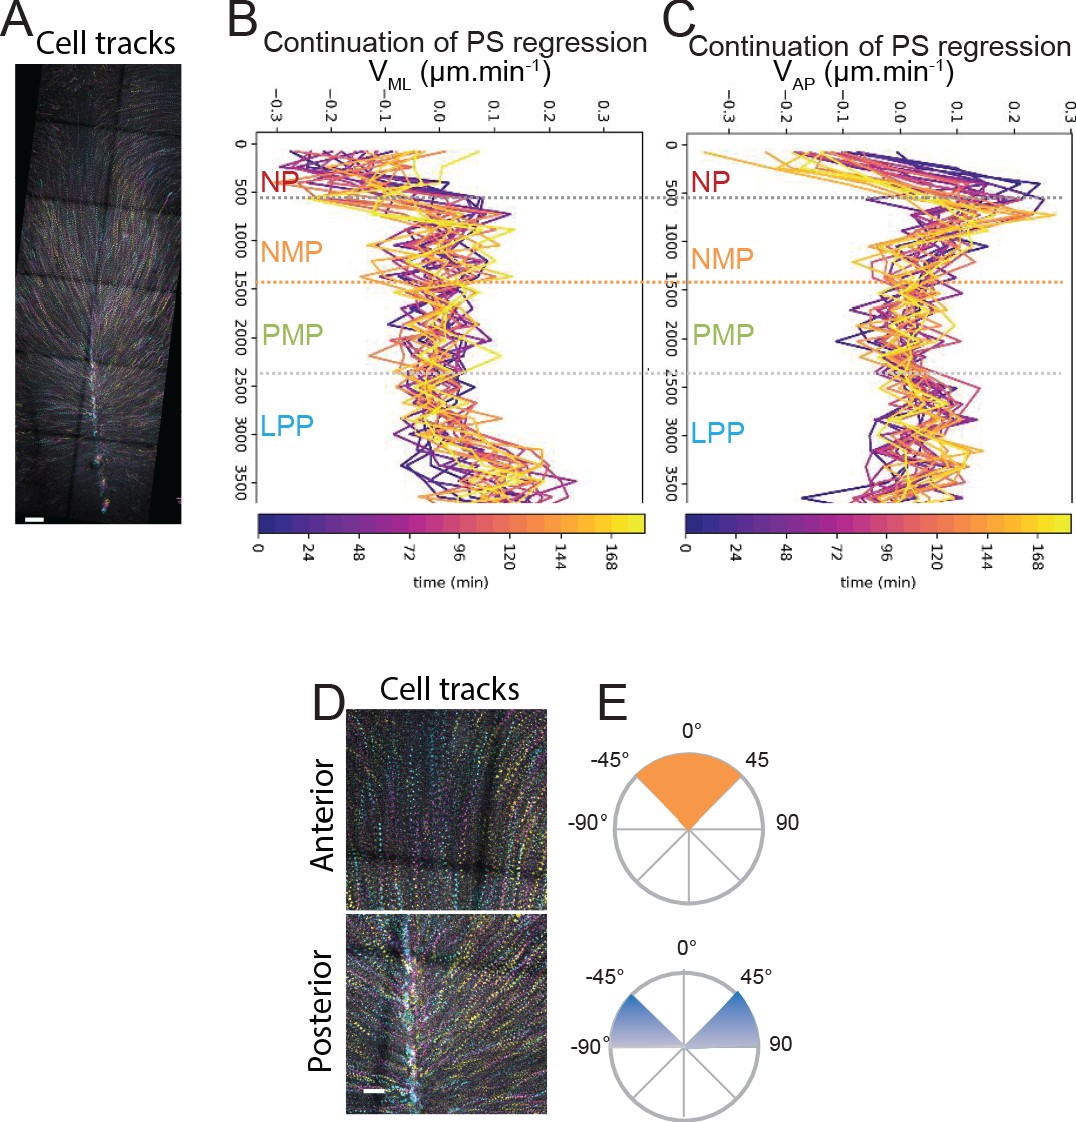
(A) Quantification of the number of SOX2/T double-positive cells in chicken embryos from stage 4HH to 35-somite (n = 38 embryos). (B) Snapshots of the posterior region of chicken embryos from stage 5HH to 20-somite stained in whole-mount with an anti-phosphorylated histone H3 (pH3) antibody. (C) Quantifications of the mitotic index along the PS in the boxes shown in (B). Orange box: 250 µm from node; green box: 750 µm from node; blue box: 1200 µm from node (n = 13 embryos). Unpaired t-test; **p=0.0017 and 0.0022; *p=0.0187, p=0.0278. (D) Quantification of the number of dividing cells in H2B-Cherry transgenic quails at stage 4+/5HH in the anterior and posterior PS (n = 6). Paired t-test; ***p=0.0001. (E) Tracks and (F) quantification of trajectories of the neuromesodermal progenitor (NMP) (gold) and lateral plate progenitor (LPP) (gray) cells during PS regression (n = 159 cells, 80 posterior, 79 anterior in seven embryos). (G) Quantification of the time interval between two rounds of division in cells of the NMP region measured in time-lapse movies (n = 12 inter-division events in four embryos). (B, E) Dorsal views, anterior to the top. Arrowhead shows Hensen’s node position. Scale bar: 100 µm.
Figure 7—figure supplement 1
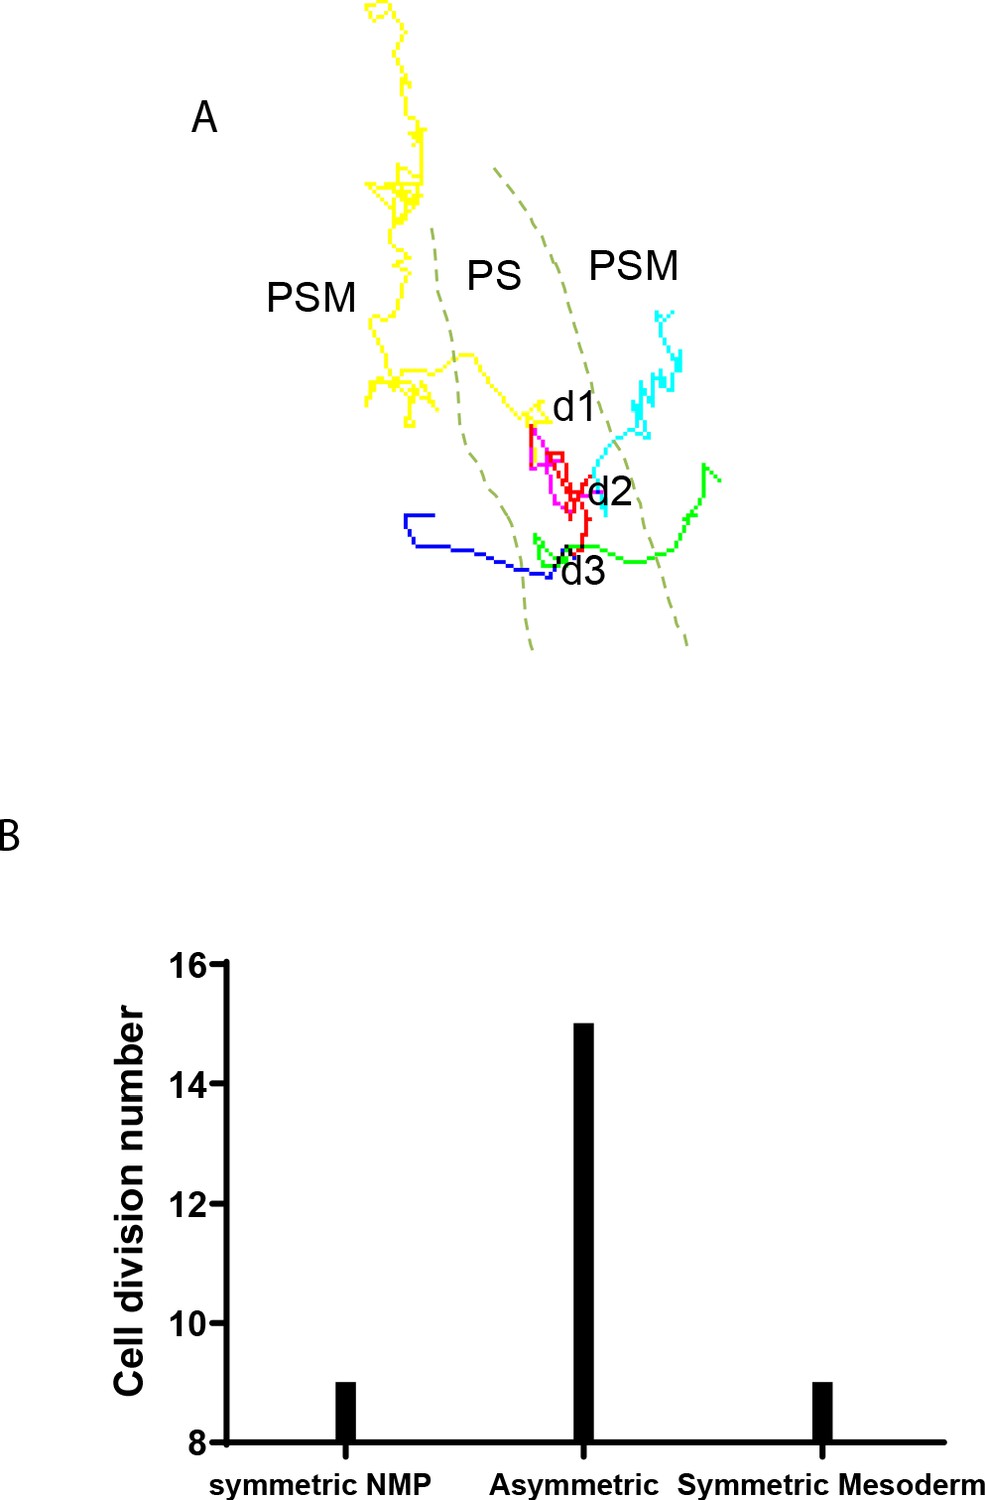
Analysis of cell division profiles in the SOX2/T region.
(A) Tracks of three rounds of cell division of an epiblast cell of the SOX2/T-positive territory in an H2B-RFP electroporated chicken embryo imaged for 12 hr starting at stage 5HH (corresponding to Video 6). d1, d2, d3: the division events. (B) Based on the location of daughter cells after cell division, we defined the cell division as symmetric (symmetric neuromesodermal progenitor [NMP]: when both daughter cells remain in the primitive streak [PS]; symmetric mesoderm: when both daughter cells subsequently join the mesoderm [d3]) or asymmetric (when one daughter cell remains in the PS and the other daughter cell joins the mesoderm) (d1, d2). We identified 33 division events in seven embryos, which are shown in (A). Scale bars: 100 µm.
-
Figure 7—figure supplement 1—source data 1
Type of cell division in the neuromesodermal progenitor (NMP) domain.
- https://cdn.elifesciences.org/articles/64819/elife-64819-fig7-figsupp1-data1-v1.xlsx
Figure 8
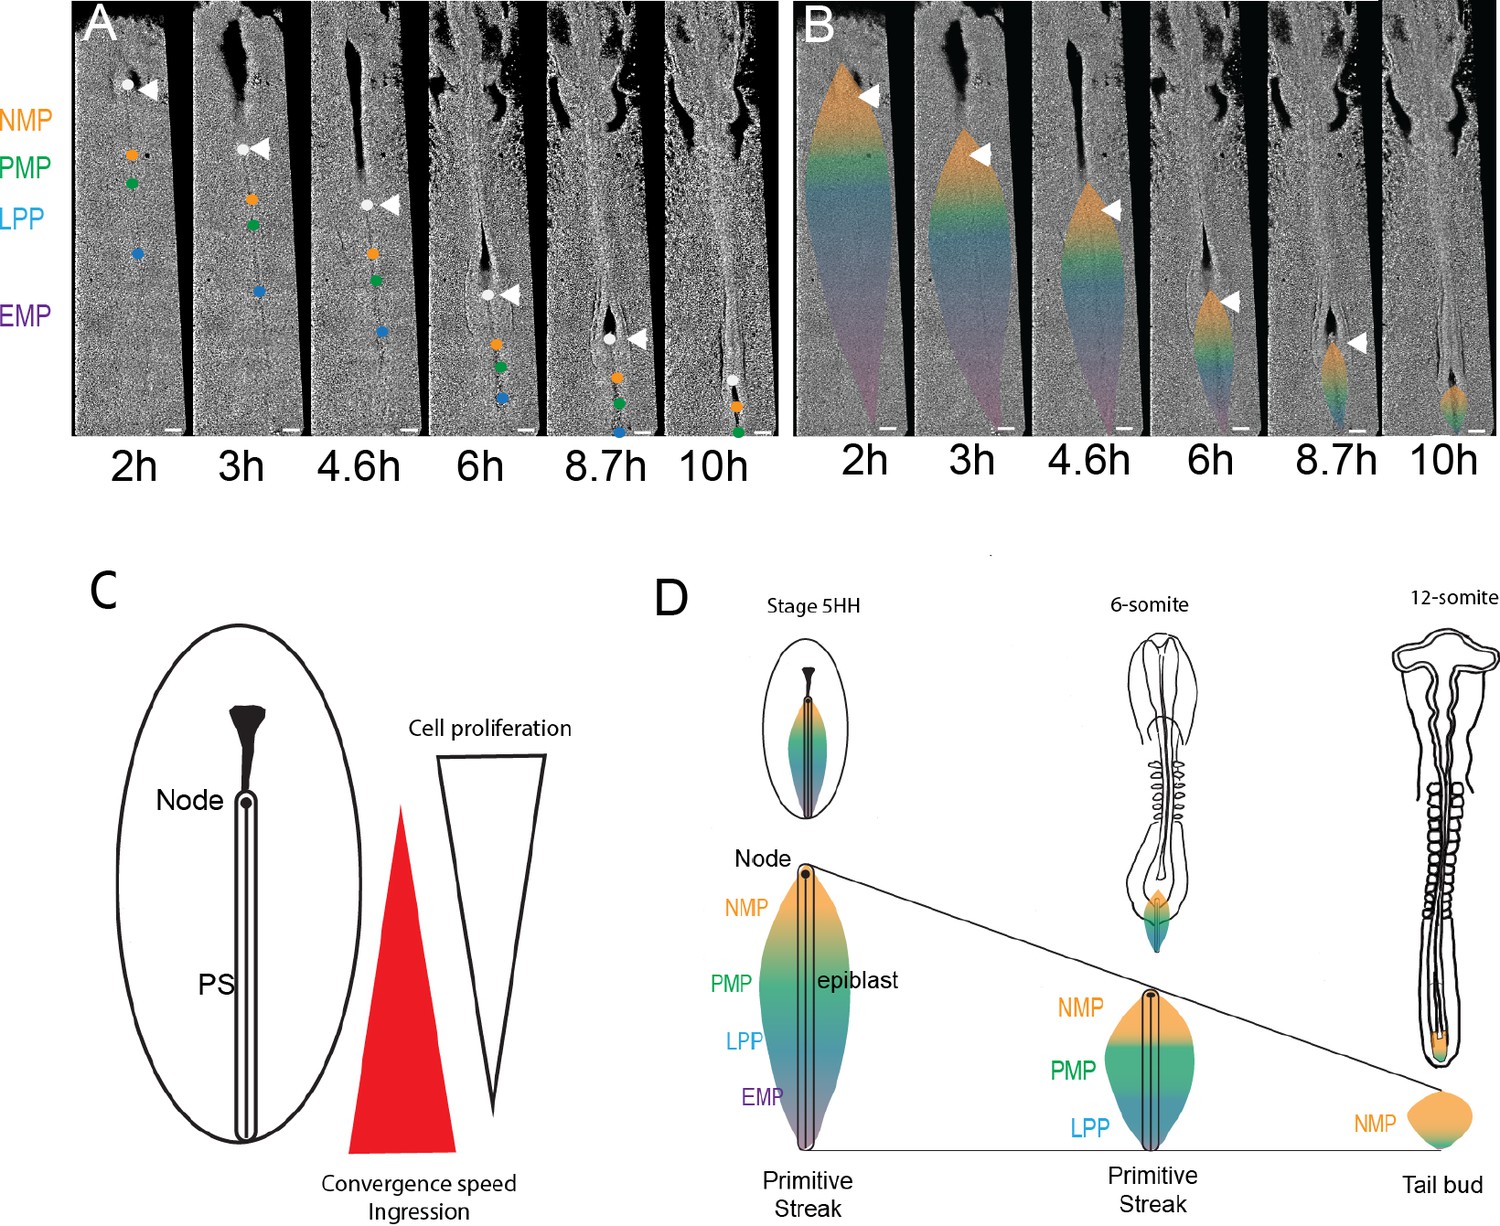
Posterior to anterior exhaustion of primitive streak (PS) progenitor territories results in NMPs remaining as the major PS remnant in the tail bud.
(A, B) Snapshots from a 13 hr time-lapse movie of a chicken embryo starting at stage 5HH. The approximate position of the boundaries is shown by colored dots (A), and the corresponding territories are shown (B) during PS regression. Boundaries between NMP-PMP, PMP-LPP, and LPP-EMP are illustrated by orange, green, and blue dots (A) and color transition (B), respectively. The initial position of groups of cells marking the boundaries between the different PS territories was identified based on their distance to Hensen’s node (white arrowhead) as established in our experiments and in Psychoyos and Stern, 1996. These groups of cells were tracked during PS regression to follow the fate of the different PS territories (n = 3 embryos). Dorsal views. (C) Schematics illustrating the position of the opposite gradients of cell proliferation and ingression in the epiblast during PS regression. (D) Schematics summarizing the dynamics of the NMP territory (gold) during PS regression in embryos of stage 5HH and 6-somite and around PS to tail bud transition (12-somite embryo). (A–D) Dorsal views, anterior to the top. AP: anteroposterior; NMP: neuromesodermal progenitors (gold); PMP: presomitic mesoderm progenitors (green); LPP: lateral plate progenitor (blue); EMP: extraembryonic mesoderm precursors (purple). Arrowhead: Hensen’s node (n = 3 embryos). Scale bar: 100 µm.
Videos
Video 1
Tracking descendants of the anterior primitive streak (PS) epiblast at 25 somites.
Time-lapse movie of dorsal maximum z-projections showing descendants from the neuromesodermal progenitor (NMP) region electroporated at stage 5HH with an H2B-RFP plasmid in time lapse. t = 4 min between frames, movie = 10 hr. z-sectioning = 4 μm. 20× objective, LSM 780.
Video 2
Tracking the fate of descendants of the anterior epiblast at 25 somites.
Time-lapse movie of dorsal maximum z-projections of a 25-somite embryo showing the localization and fate of descendants from cells of the anterior primitive streak (PS) epiblast region co-electroporated at stage 5HH with a GAP43-Venus and an H2B-RFP plasmid (marking the membrane and the nucleus, respectively). The SOX2/T region of the tail bud is delimited by the white lines. Tracks of selected cells are shown. Color code indicates the z position of the cells (yellow: dorsal; blue: ventral). t = 8 min between frames. z-sectioning = 4 μm. 20× objective, LSM 780.
Video 3
Long-term tracking of a nuclear red stained embryo.
Time-lapse movie of dorsal maximum z-projections of epiblast cells labeled with nuclear red showing their tracks from stage 5HH to 5 somites during PS regression. Colors indicate the z-position from magenta (dorsal) to yellow (ventral). t = 4 min between frames, z-sectioning = 4 μm. 20× objective, LSM 780. NMP: neuromesodermal progenitors; PMP: presomitic mesoderm progenitors; LPP: lateral plate progenitors. PS = primitive streak; NT: neural tube.
Video 4
Longevity of tracks along the primitive streak (PS).
3.5 hr time-lapse movie of a stage 5HH chicken embryo in which the epiblast was labeled with nuclear red. Tracks of single-labeled nuclei are shown at three different AP levels of the PS to illustrate differences in longevity of the cells. Dorsal view (neuromesodermal progenitor [NMP]: gold; paraxial mesoderm precursor [PMP]/lateral plate progenitor [LPP]: green; extraembryonic mesoderm progenitor [EMP]: blue). t = 4 min. 20× objective, LSM 780.
Video 5
Dynamics of mesodermal cell ingression.
Time-lapse movie showing ventral z-maximum projections of the primitive streak (PS) region of a chicken embryo labeled dorsally at stage 5HH with nuclear red. t = 15 min. z = 4 μm. 20× objective, LSM 780.
Video 6
Tracking cell division time in the SOX2/T region.
Tracking of cell divisions in cells of the SOX2/T region electroporated with an H2B-RFP plasmid at stage 5HH. d1, d2, d3: division events; PS: primitive streak. t = 6 min. 10× objective, Leica DMR.
Video 7
Long-term tracking of the mesodermal progenitors.
13 hr time-lapse movie of a GFP chicken embryo starting at stage 5HH (left). Fate of the color-coded mesodermal primitive streak (PS) progenitor territories during regression is shown in the right movie. NMP: neuromesodermal progenitors (gold); PMP: presomitic mesoderm progenitors (green); LPP: lateral plate progenitor; LPP-EMP: extraembryonic mesoderm precursors (blue-purple). Arrowhead: Hensen’s node. Anterior to the top. t = 4 min. 20× objective, LSM 780.
Tables
Key resources table
| Reagent type (species) or resource | Designation | Source or reference | Identifiers | Additional information |
|---|---|---|---|---|
| Strain, strain background | Gallus gallus | Charles River Laboratories, RRID:SCR_003792 | Specific-pathogen-free chicken (SPF) eggs | |
| Strain, strain background | Gallus gallus | Susan Chapman at Clemson University; South Carolina; USA, RRID:SCR_011159 McGrew et al., 2004 | Cytoplasmic GFP eggs | |
| Strain, strain background | Northern Bobwhite quail | Ozark Hatcheries Bénazéraf et al., 2017 | Transgenic quails expressing H2B-Cherry | |
| Chemical compound, drug | Paraformaldehyde | Sigma | 158127 | |
| Antibody | T/Brachyury (goat polyclonal) | R&D Systems | AF2085 | IF (1/1000) |
| Antibody | SOX2 (rabbit polyclonal) | Millipore RRID:AB_2286686 | Cat# AB5603 | IF (1/1000) |
| Antibody | E-Cadherin (mouse monoclonal) | Abcam RRID:AB_1310159 | ab76055 | IF (1/250) |
| Antibody | N-Cadherin (rabbit polyclonal) | Abcam RRID:AB_298943 | ab12221 | IF (1/250) |
| Antibody | Fibronectin (mouse) | DSHB | MT4S | IF (1/50) |
| Antibody | Laminin (rabbit) | Sigma-Aldrich RRID:AB_477163 | Cat# L9393 | IF (1/200) |
| Antibody | Phospho-histone 3 (rabbit polyclonal) | Santa Cruz BiotechnologyRRID:AB_2233067 | sc-8656 | IF (1/1000) |
| Antibody | MSGN1 (rabbit polyclonal) | Pourquie Laboratory Oginuma et al., 2017 | IF (1/1000) | |
| Recombinant DNA reagent | pCAGG-H2B- Venus | Pourquie Laboratory Denans et al., 2015 | pCAGG backbone | |
| Recombinant DNA reagent | pCAGG-H2B-RFP | Pourquie Laboratory Denans et al., 2015 | pCAGG backbone | |
| Recombinant DNA reagent | pCAGG-GAP43-Venus | Pourquie Laboratory Oginuma et al., 2017 | pCAGG backbone | |
| Chemical compound, drug | NucRed Live 647 ReadyProbes Reagent | Thermo Fisher | R37106 | Two drops in 1 ml |
| Software, algorithm | MOSAIC plug-in from ImageJ | ImageJ Sbalzarini and Koumoutsakos, 2005 | ||
| Software, algorithm | Tracs reconstruction | Arthur Michaut | This study | Python-based homemade code |
| Software, algorithm | K mean Brainbow clustering | Figure 2—source data 2 | MATLAB | |
| Recombinant DNA reagent | pQCGICIDPA | Retroviral barcoding | This study | pQCXIX backbone |
| Recombinant DNA reagent | Tol2-CAG::Nucbow | RRID:Addgene_158992 Loulier et al., 2014 | pCX backbone |
Additional files
-
Supplementary file 1
Table showing the cluster full names, cluster name abbreviation, and cell number at stage 5HH, 6 somites, 35 somites, all chicken embryo data, data subset from the chick (corresponding to Figures 3H and 5H), chick and mouse data subsets shown in Figures 4A, B and 5E, and the mouse subset data (Figure 3K).
- https://cdn.elifesciences.org/articles/64819/elife-64819-supp1-v1.xlsx
-
Supplementary file 2
Tables showing the differentially expressed genes per clusters at stage 5HH, 6 somites, 35 somites, all chicken data, chicken data subset, neuromesodermal progenitor (NMP) early and late reclustering with and without HOX genes and the mouse subsets.
Each cluster is divided into three subcolumns where the first column indicates the gene name, the second column the p value, and the third the log fold changes. All the tables are ranked by z-score. The expression of the 10 first genes with the highest log fold change for each cluster is shown in the dotplots.
- https://cdn.elifesciences.org/articles/64819/elife-64819-supp2-v1.xlsx
-
Supplementary file 3
Predicted transcription factors identified by the Waddington-OT (WOT) analysis along the neuromesodermal progenitor (NMP), presomitic mesoderm (PSM), and neural trajectories.
List of all the genes that are differentially expressed in the cells with the highest probability to transition to each cell type; the list is then filtered by a curated list of transcription factors. The fraction expressed ratio (second column) represents the variation of cell fraction that express each gene between the first and second timepoint used to infer the trajectories (days 1–3 for chicken data and E7.25–E9.5 for mouse data). The false discovery rate (FDR) column show the FDR (adjusted p-value) for each gene.
- https://cdn.elifesciences.org/articles/64819/elife-64819-supp3-v1.xlsx
-
Supplementary file 4
Comparative analysis of the differentially expressed genes (DEGs) in the early and late neuromesodermal progenitor (NMP) clusters in mouse, chicken, and human models.
We used the list of differentially expressed genes identified in Dias et al., 2020, Guibentif et al., 2021; Gouti et al., 2017; the top 350 genes of Table 5 from Guibentif et al., 2021. For the human gene list, we computed the list of DEG in the NMP cluster compared to the pluripotent stem cell cluster and took the 350 top genes from the Diaz-Cuadros et al., 2020 study. For the list identified in this study, the genes that were kept are those that have a false discovery rate (FDR) > 0.05. To maintain a comparable number of genes, we decided to take only the top 350 genes when more than 1000 genes had an FDR > 0.05. In this table, we also compared the newly identified gene from this study to the list of up- and downregulated genes from Wymeersch et al., 2019 providing from dissection of the node streak border NSB at E8.5 and the chordo-neural hinge CNH at E10.5 in mouse. The comparison of the different lists was done by using http://www.molbiotools.com/listcompare. For each analysis, we provide the matrix with the number of genes that are shared between two gene lists. We also provide the list of the shared items between all the lists and the gene list that intersect between two gene lists.
- https://cdn.elifesciences.org/articles/64819/elife-64819-supp4-v1.xlsx
-
Supplementary file 5
Comparative analysis of the neuromesodermal progenitor (NMP) gene lists in mouse, chicken, and human models.
We used the list of differentially expressed genes (DEGs) identified in Dias et al., 2020, Guibentif et al., 2021; Gouti et al., 2017; the top 350 genes of Table 5 from Guibentif et al., 2021. For the human gene list, we computed the list of DEG in the NMP cluster compared to the pluripotent stem cell cluster and took the 350 top genes from the Diaz-Cuadros et al., 2020 study. For the list identified in this study, the genes that were kept are those that have a false discovery rate (FDR) > 0.05. To maintain a comparable number of genes, we decided to take only the top 350 genes when more than 1000 genes had an FDR > 0.05 The comparison table was done by using http://www.molbiotools.com/listcompare. For each analysis, we provide the matrix with the number of genes that are shared between two gene lists. We also give the list of the shared items between all the lists and the gene list that intersect between two gene lists.
- https://cdn.elifesciences.org/articles/64819/elife-64819-supp5-v1.xlsx
-
Transparent reporting form
- https://cdn.elifesciences.org/articles/64819/elife-64819-transrepform-v1.docx
Download links
A two-part list of links to download the article, or parts of the article, in various formats.
Downloads (link to download the article as PDF)
Open citations (links to open the citations from this article in various online reference manager services)
Cite this article (links to download the citations from this article in formats compatible with various reference manager tools)
Dynamics of primitive streak regression controls the fate of neuromesodermal progenitors in the chicken embryo
eLife 10:e64819.
https://doi.org/10.7554/eLife.64819


