Deleting Mecp2 from the cerebellum rather than its neuronal subtypes causes a delay in motor learning in mice
- Jan and Dan Duncan Neurological Research Institute, Texas Children’s Hospital, United States
- Program in Developmental Biology, Baylor College of Medicine, United States
- Medical Scientist Training Program, Baylor College of Medicine, United States
- Department of Human and Molecular Genetics, Baylor College of Medicine, United States
- Howard Hughes Medical Institute, Baylor College of Medicine, United States
- Department of Neuroscience, Baylor College of Medicine, United States
- Department of Pathology and Immunology, Baylor College of Medicine, United States
- Department of Neurology, Baylor College of Medicine, United States
- Department of Pediatrics, Baylor College of Medicine, United States
Figures
Figure 1
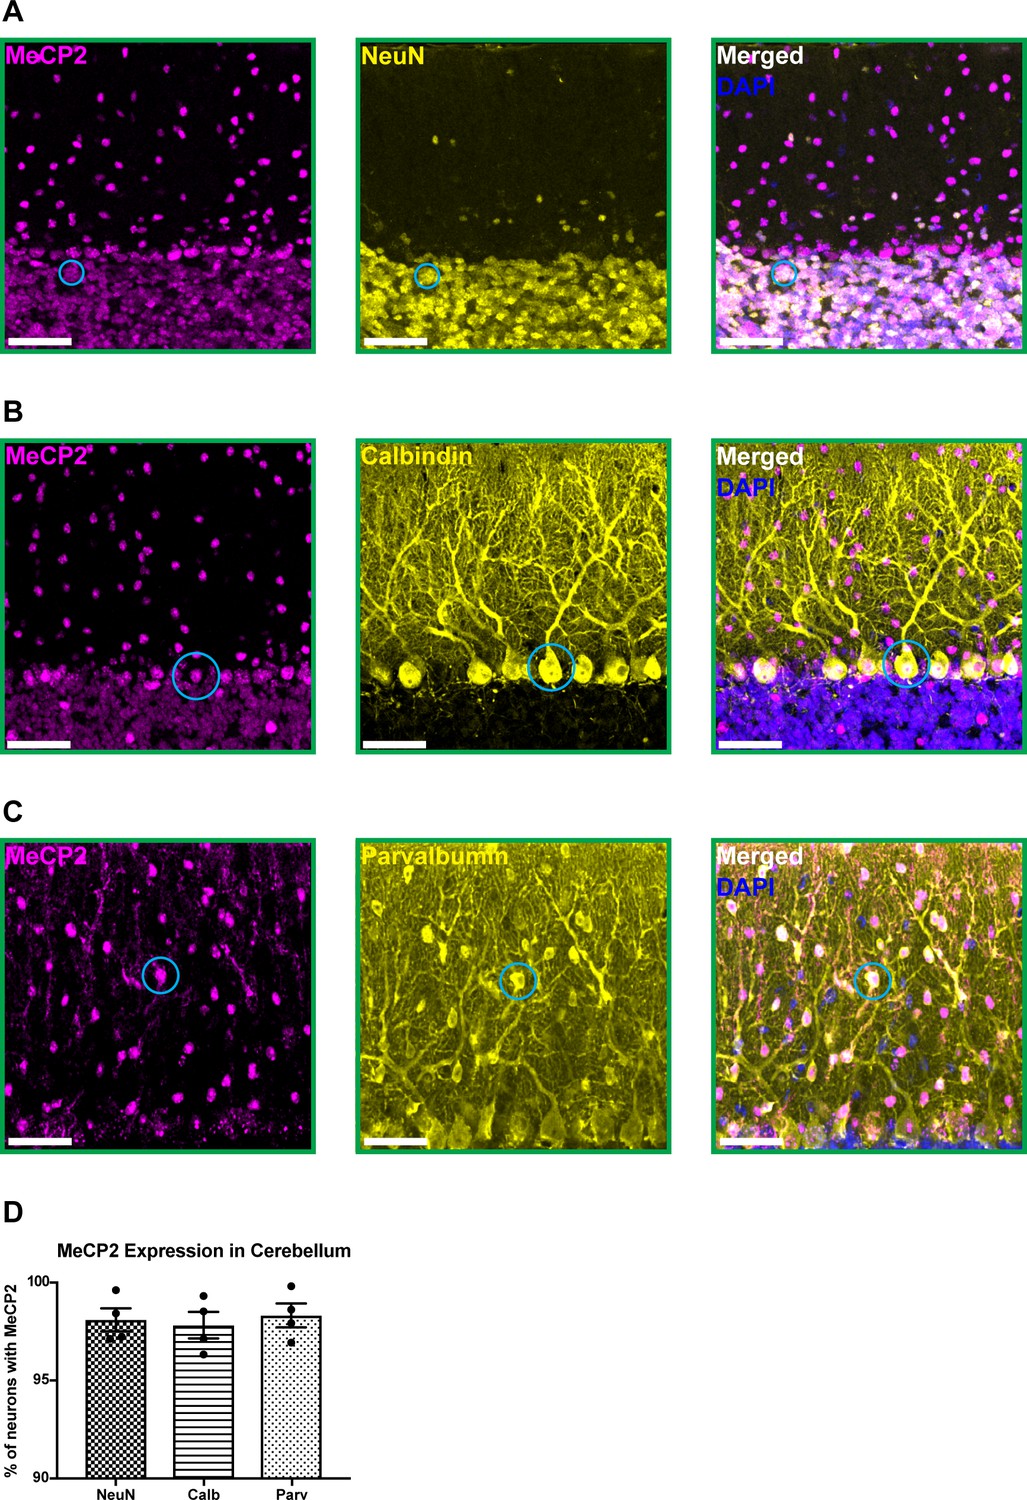
MeCP2 is expressed in cerebellar neurons of 6-month-old wild-type mice.
(A–C) MeCP2 (magenta) staining in NeuN+ neurons (yellow) in the granular layer (A: solid cyan circle), Calbindin+ neurons (yellow) in the Purkinje cell layer (B: solid cyan circle), and Parvalbumin+ neurons (yellow) in the molecular layer (C: solid cyan circle). Scale bar, 25 µm. (D) Quantification of the percentage of NeuN+, Calbindin+, and Parvalbumin+ neurons that express MeCP2. N = 4 biologically independent mice per group. Data are presented as mean ± s.e.m.
-
Figure 1—source data 1
Related to Figure 1.
- https://cdn.elifesciences.org/articles/64833/elife-64833-fig1-data1-v1.xlsx
Figure 2 with 3 supplements
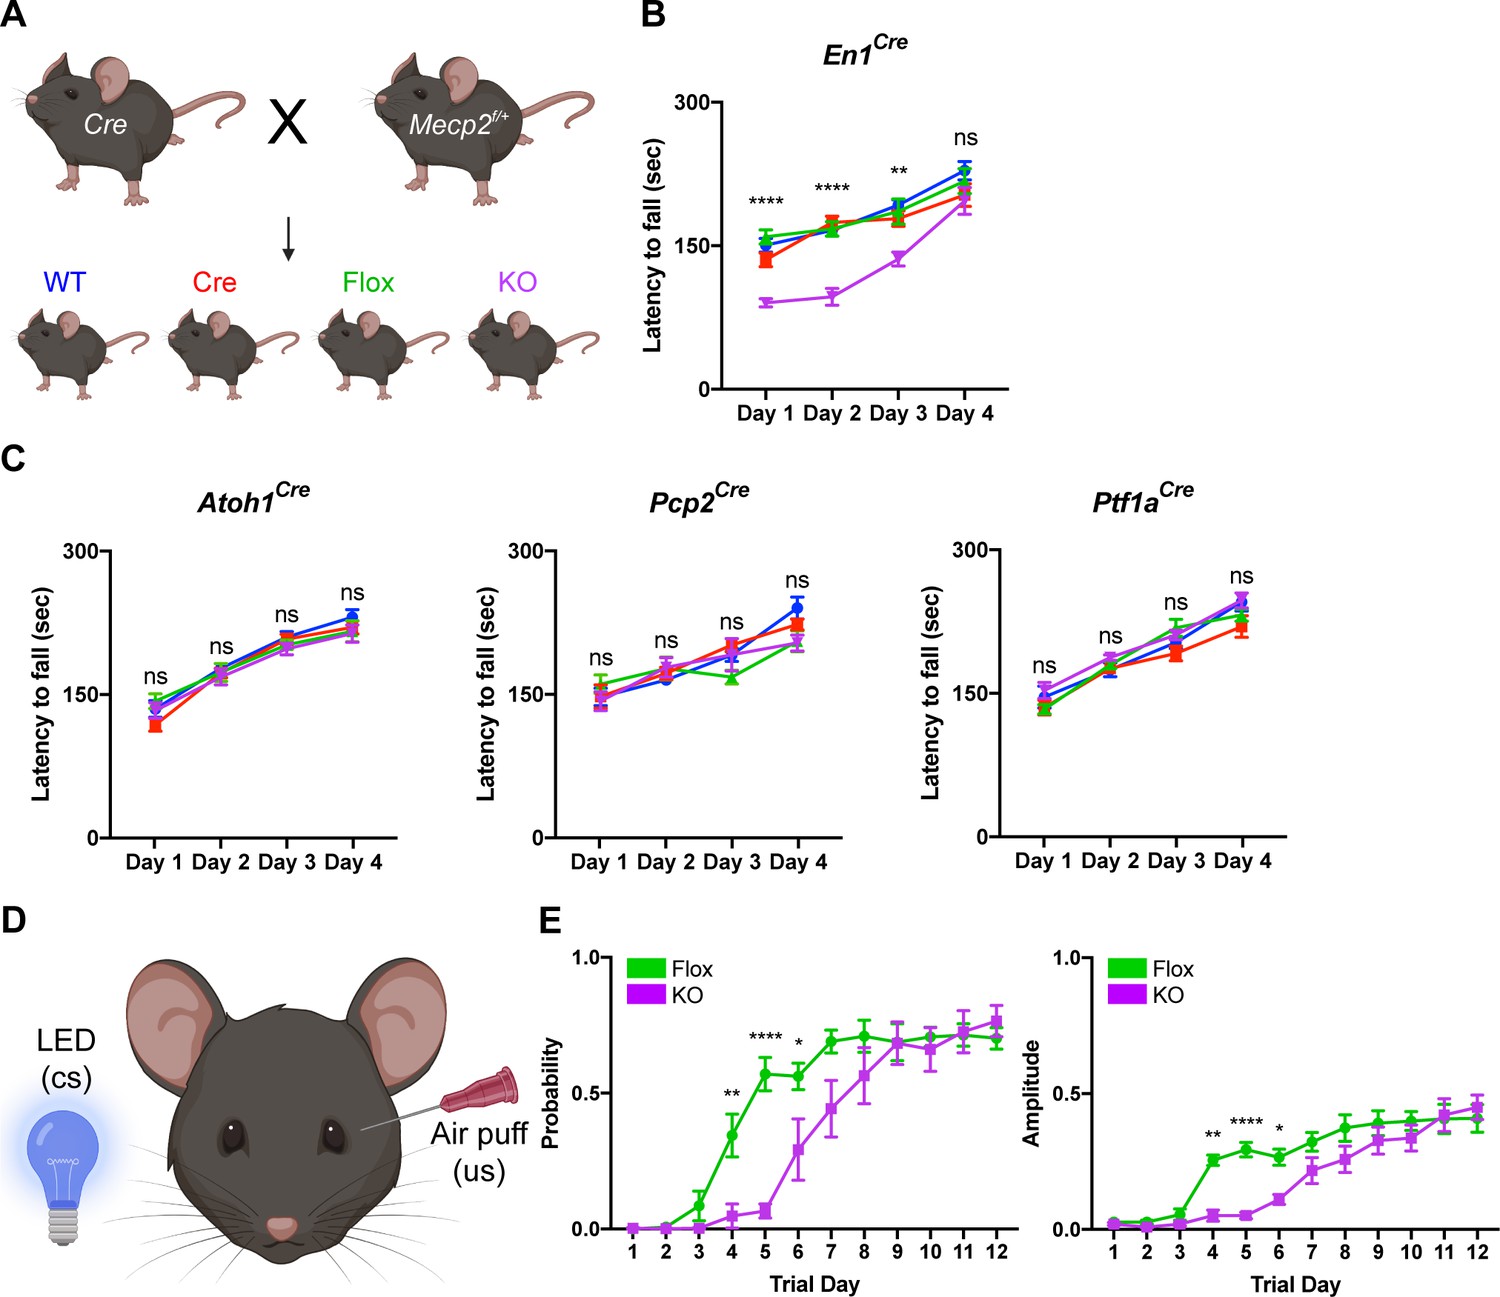
Deleting Mecp2 from the cerebellum, but not its neuronal subtypes, causes motor learning deficits in 6-month-old mice.
(A) Breeding scheme to generate WT, Cre, Flox, and KO mice. (B) Latency to fall on the rotarod over four training days in the En1Cre group. (C) Latency to fall on the rotarod over four training days in mice lacking Mecp2 in the granule cells (Atoh1Cre), Purkinje cells (Pcp2Cre), and Purkinje cells and molecular layer interneurons (Ptf1aCre). (D) Schematic of eyeblink conditioning that pairs an LED light (conditioned stimulus, cs) with an air puff (unconditioned stimulus, us) to generate an anticipatory eyelid closure (conditioned response) before the air puff. (E) Response probability and amplitude of eyelid closure over 12 training days in Flox and KO mice. N = 8–17 biologically independent mice per group. Data are presented as mean ± s.e.m. Statistical significance was determined by two-way ANOVA with Tukey’s multiple comparisons test. ns (p>0.05), *(p<0.05), **(p<0.01), ****(p<0.0001).
-
Figure 2—source data 1
Related to Figure 2.
- https://cdn.elifesciences.org/articles/64833/elife-64833-fig2-data1-v1.xlsx
Figure 2—figure supplement 1
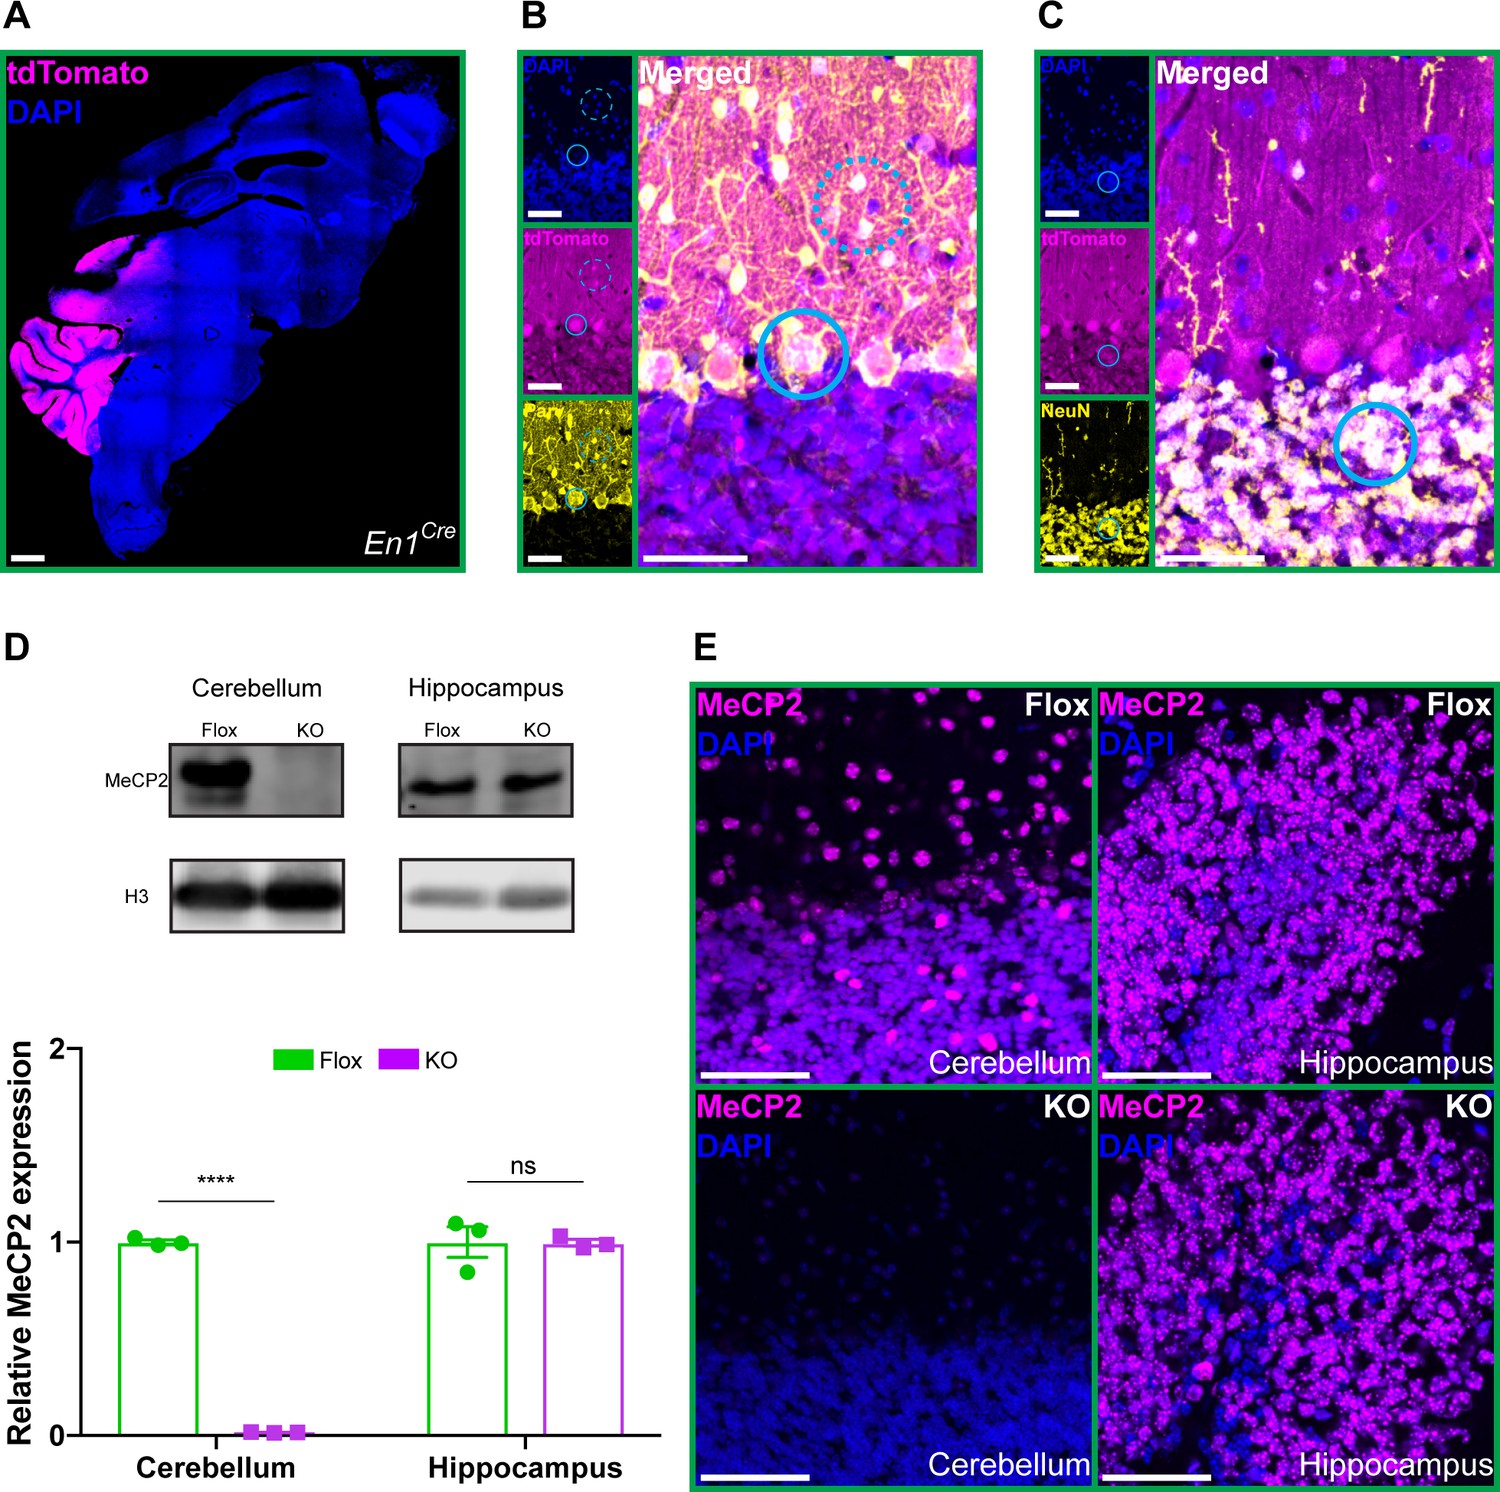
Deletion of Mecp2 from the cerebellum.
(A) En1Cre expression was determined by the pattern of tdTomato (magenta) in En1Cre;Rosa26lsl-tdTomato reporter mice. Scale bar, 1 mm. (B) Immunostaining showing co-expression of tdTomato (magenta) with Parvalbumin (yellow), a marker of Purkinje cells (solid cyan circle), and molecular layer interneurons (dashed cyan circle). Scale bar, 25 µm. (C) Immunostaining showing co-expression of tdTomato (magenta) with NeuN (yellow), a marker of granule cells (solid cyan circle). Scale bar, 25 µm. (D) Quantification of MeCP2 protein levels normalized to Histone H3 in the cerebellum and hippocampus of Flox and KO mice. (E) Immunostaining of MeCP2 (magenta) in the cerebellum and hippocampus of Flox and KO mice. Scale bar, 50 µm. N = 3 biologically independent mice per group. Data are presented as mean ± s.e.m. Statistical significance was determined by two-tailed, unpaired student’s t-test. ns (p>0.05), ****(p<0.0001).
-
Figure 2—figure supplement 1—source data 1
Related to Figure 2—figure supplement 1.
- https://cdn.elifesciences.org/articles/64833/elife-64833-fig2-figsupp1-data1-v1.xlsx
Figure 2—figure supplement 2
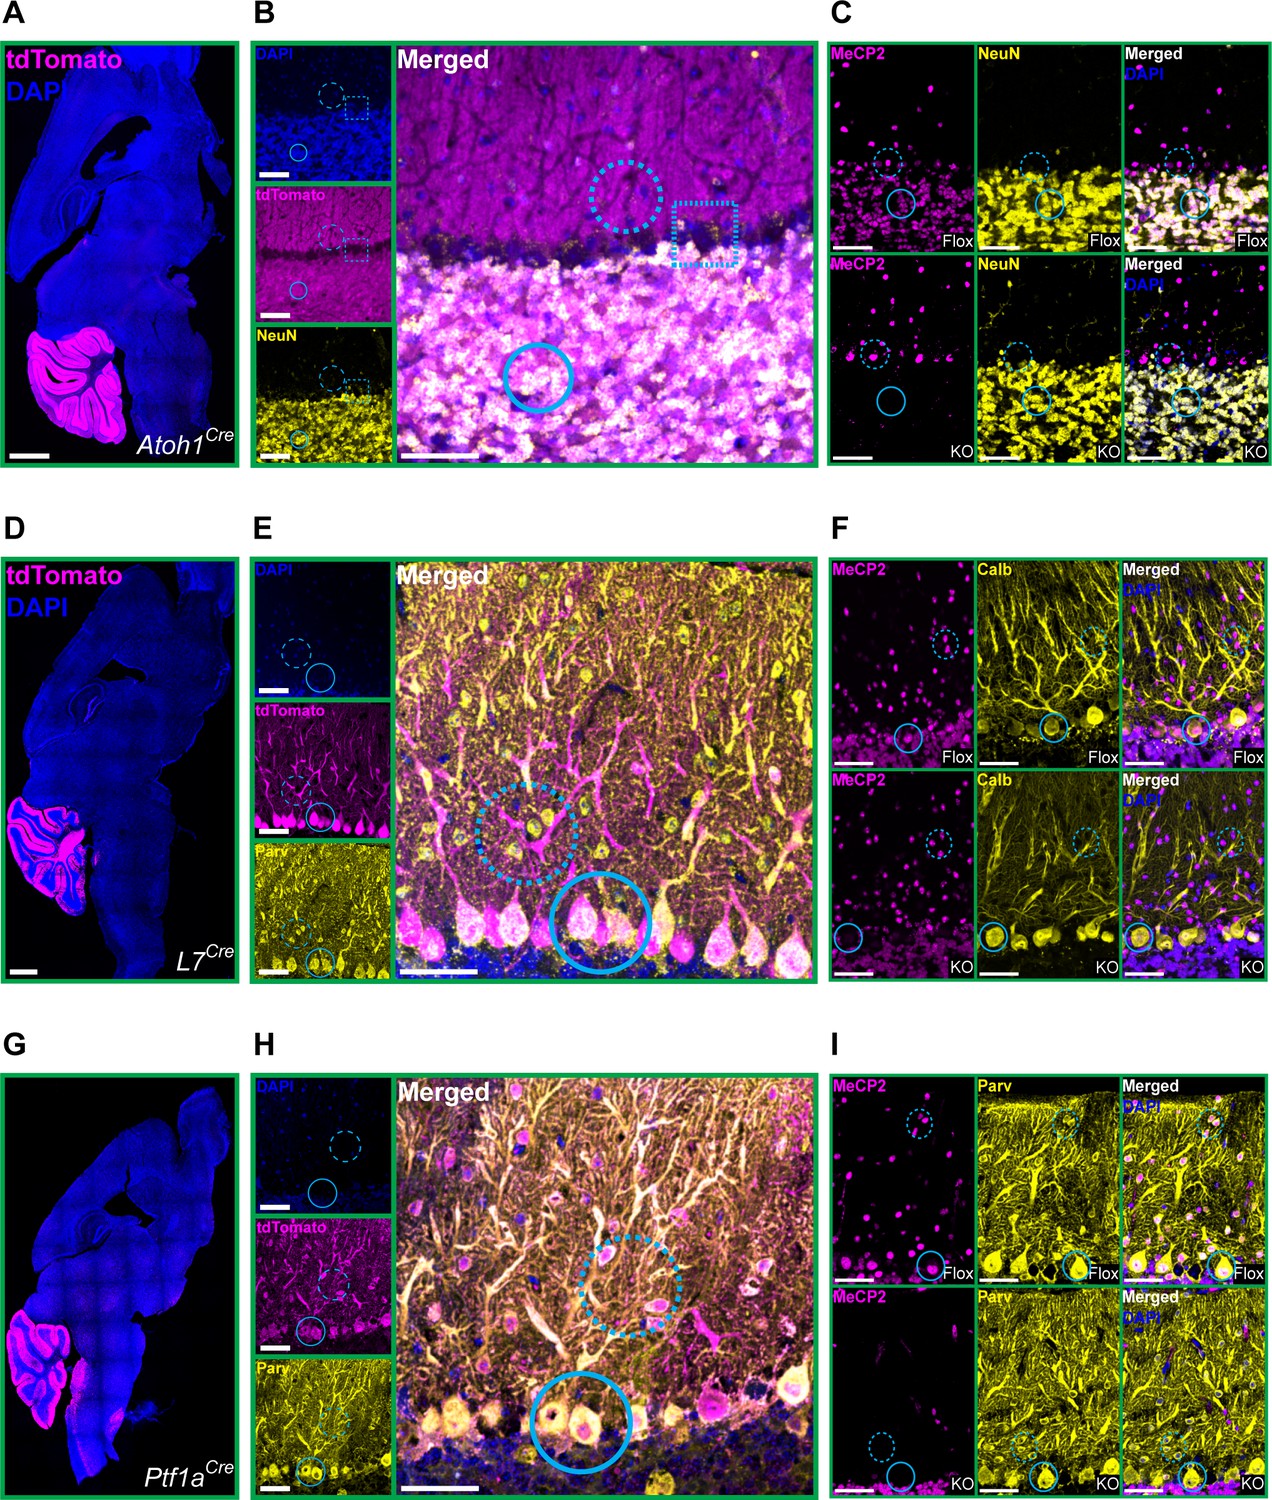
Cre expression and Mecp2 deletion in cerebellar neuron subtypes.
(A) Atoh1Cre expression was determined by the pattern of tdTomato (magenta) in Atoh1Cre;Rosa26lsl-tdTomato reporter mice. Scale bar, 1 mm. (B) Immunostaining in Atoh1Cre;Rosa26lsl-tdTomato reporter mice showing co-expression of tdTomato (magenta) with NeuN (yellow), a marker of granule cells (solid cyan circle), but not in cells of the Purkinje layer (dashed cyan square) or molecular layer (dashed cyan circle). Scale bar, 25 µm. (C) Immunostaining of MeCP2 (magenta) and NeuN (yellow) in the cerebellum showing the absence of MeCP2 in granule cells of KO mice (solid cyan circle), but not in cells of the Purkinje layer (dashed cyan circle). Scale bar, 25 µm. (D) Pcp2Cre expression was determined by the pattern of tdTomato (magenta) in Pcp2Cre;Rosa26lsl-tdTomato reporter mice. Scale bar, 1 mm. (E) Immunostaining in Pcp2Cre;Rosa26lsl-tdTomato reporter mice showing co-expression of tdTomato (magenta) with Parvalbumin (yellow) in the Purkinje cell layer (solid cyan circle), but not the molecular layer (dashed cyan circle). Scale bar, 25 µm. (F) Immunostaining of MeCP2 (magenta) and Calbindin (yellow) in the cerebellum showing the absence of MeCP2 in Purkinje cells of KO mice (solid cyan circle), but not in molecular layer interneurons (dashed cyan circle). Scale bar, 25 µm. (G) Ptf1aCre expression was determined by the pattern of tdTomato (magenta) in Ptf1aCre;Rosa26lsl-tdTomato reporter mice. Scale bar, 1 mm. (H) Immunostaining in Ptf1aCre;Rosa26lsl-tdTomato reporter mice showing co-expression of tdTomato (magenta) with Parvalbumin (yellow) in the Purkinje layer (solid cyan circle) and molecular layer (dashed cyan circle). Scale bar, 25 µm. (I) Immunostaining of MeCP2 (magenta) and Parvalbumin (yellow) in the cerebellum showing the absence of MeCP2 in Purkinje cells (solid cyan circle) and molecular layer interneurons of KO mice (dashed cyan circle). Scale bar, 25 µm.
Figure 2—figure supplement 3
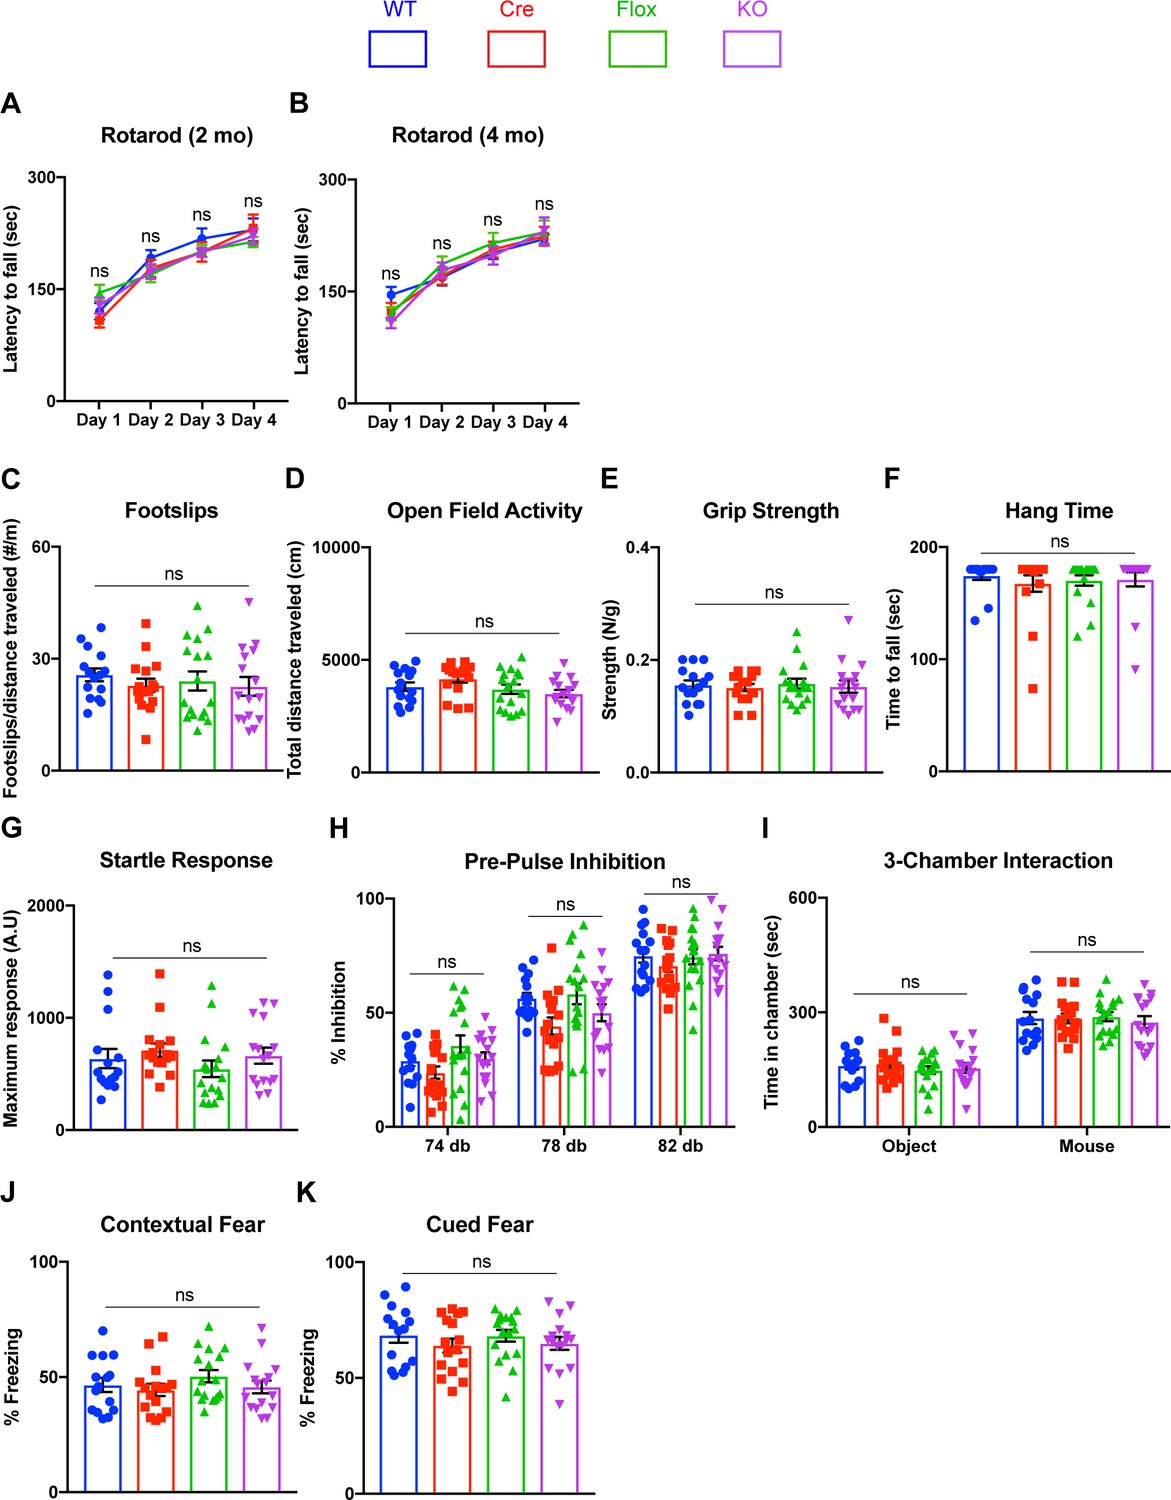
Deleting Mecp2 from the cerebellum does not cause other behavioral abnormalities.
(A) Latency to fall on the rotarod in 2-month-old mice. (B) Latency to fall on the rotarod in 4-month-old mice. A new cohort of WT, Cre, Flox, and KO mice was assessed for each time point. (C) Footslip count on the parallel rod assay normalized to total distance traveled. (D) Total distance traveled in the open-field assay. (E) Grip strength normalized to body weight. (F) Hang time on an inverted wire grid. (G) Maximum acoustic startle response to a 120 dB stimulus. (H) Pre-pulse inhibition to 74, 78, and 82 dB pre-pulses. (I) Interaction time in the three-chamber social interaction assay between a novel mouse or object. (J) Time spent freezing during contextual memory recall. (K) Time spent freezing during cued memory recall. N = 10–17 biologically independent mice per group. For (C–K), mice are 6 months old. Data are presented as mean ± s.e.m. Statistical significance was determined by one-way (C–G, J–K) or two-way ANOVA (A–B, H–I) with Tukey’s multiple comparisons test. ns (p>0.05).
-
Figure 2—figure supplement 3—source data 1
Related to Figure 2—figure supplement 3.
- https://cdn.elifesciences.org/articles/64833/elife-64833-fig2-figsupp3-data1-v1.xlsx
Figure 3
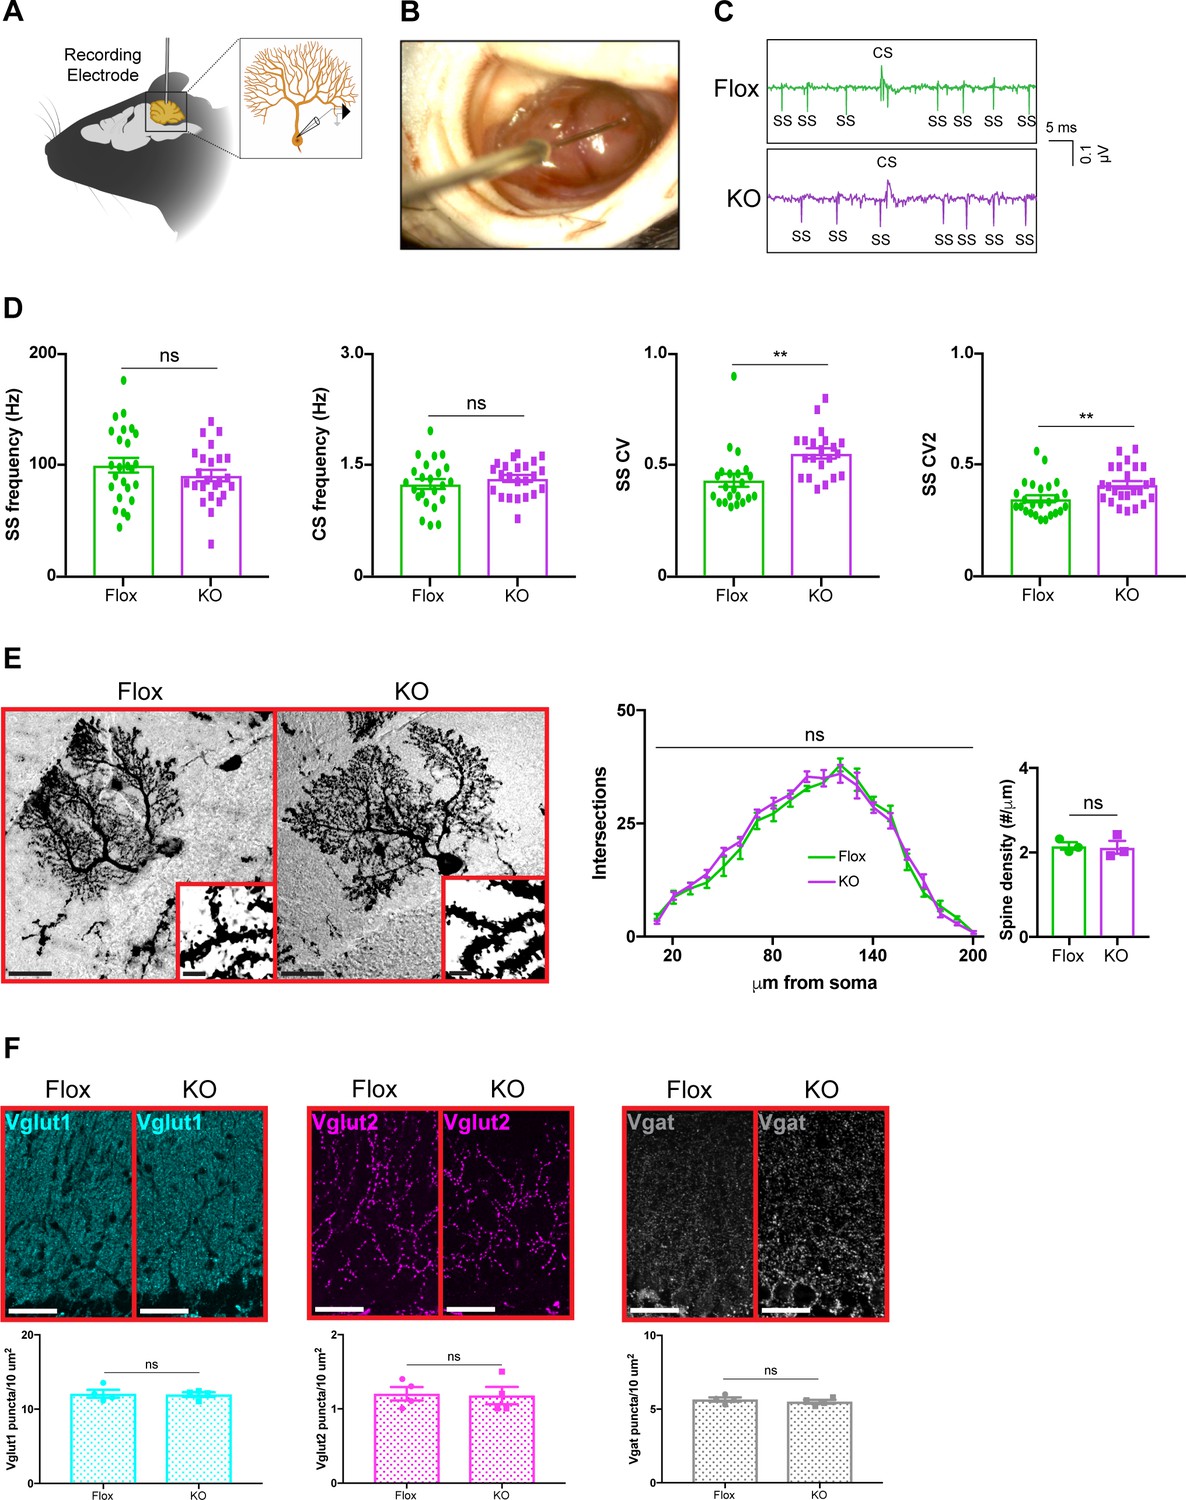
Purkinje cell firing rate is more irregular in cerebellar KO mice but is independent of overt morphological abnormalities.
(A) Schematic of in vivo extracellular recording of Purkinje cells. (B) Photograph of a recording electrode inside a surgically implanted recording chamber. (C) Representative traces of Purkinje cell firing in Flox and KO mice displaying simple spikes (ss) and complex spikes (cs). (D) Simple spike firing rate, complex spike firing rate, coefficient of variation (CV), and coefficient of variation 2 (CV2). Simple and complex spikes were differentiated by their characteristic waveforms during offline analysis. (E) Golgi stain of Purkinje cells in Flox and KO mice. Scale bar, 25 µm. Inner panel demonstrates dendritic spines on Purkinje cells. Scale bar, 5 µm. Sholl analysis and spine density quantification in Flox and KO mice. (F) Staining and quantification of Vglut1 (cyan), Vglut2 (magenta), and Vgat (gray) puncta density in the cerebellum of Flox and KO mice. Scale bar, 25 µm. For (D), 23–27 neurons were analyzed from three biologically independent mice per group. For (E), 10–15 neurons were analyzed from three biologically independent mice per group. For (F), N = 4 biologically independent mice per group. Data are presented as mean ± s.e.m. Statistical significance was determined by two-tailed, unpaired student’s t-test (D, F) and two-way ANOVA with Tukey’s multiple comparisons test (E). ns (p>0.05), **(p<0.01).
-
Figure 3—source data 1
Related to Figure 3.
- https://cdn.elifesciences.org/articles/64833/elife-64833-fig3-data1-v1.xlsx
Figure 4 with 2 supplements
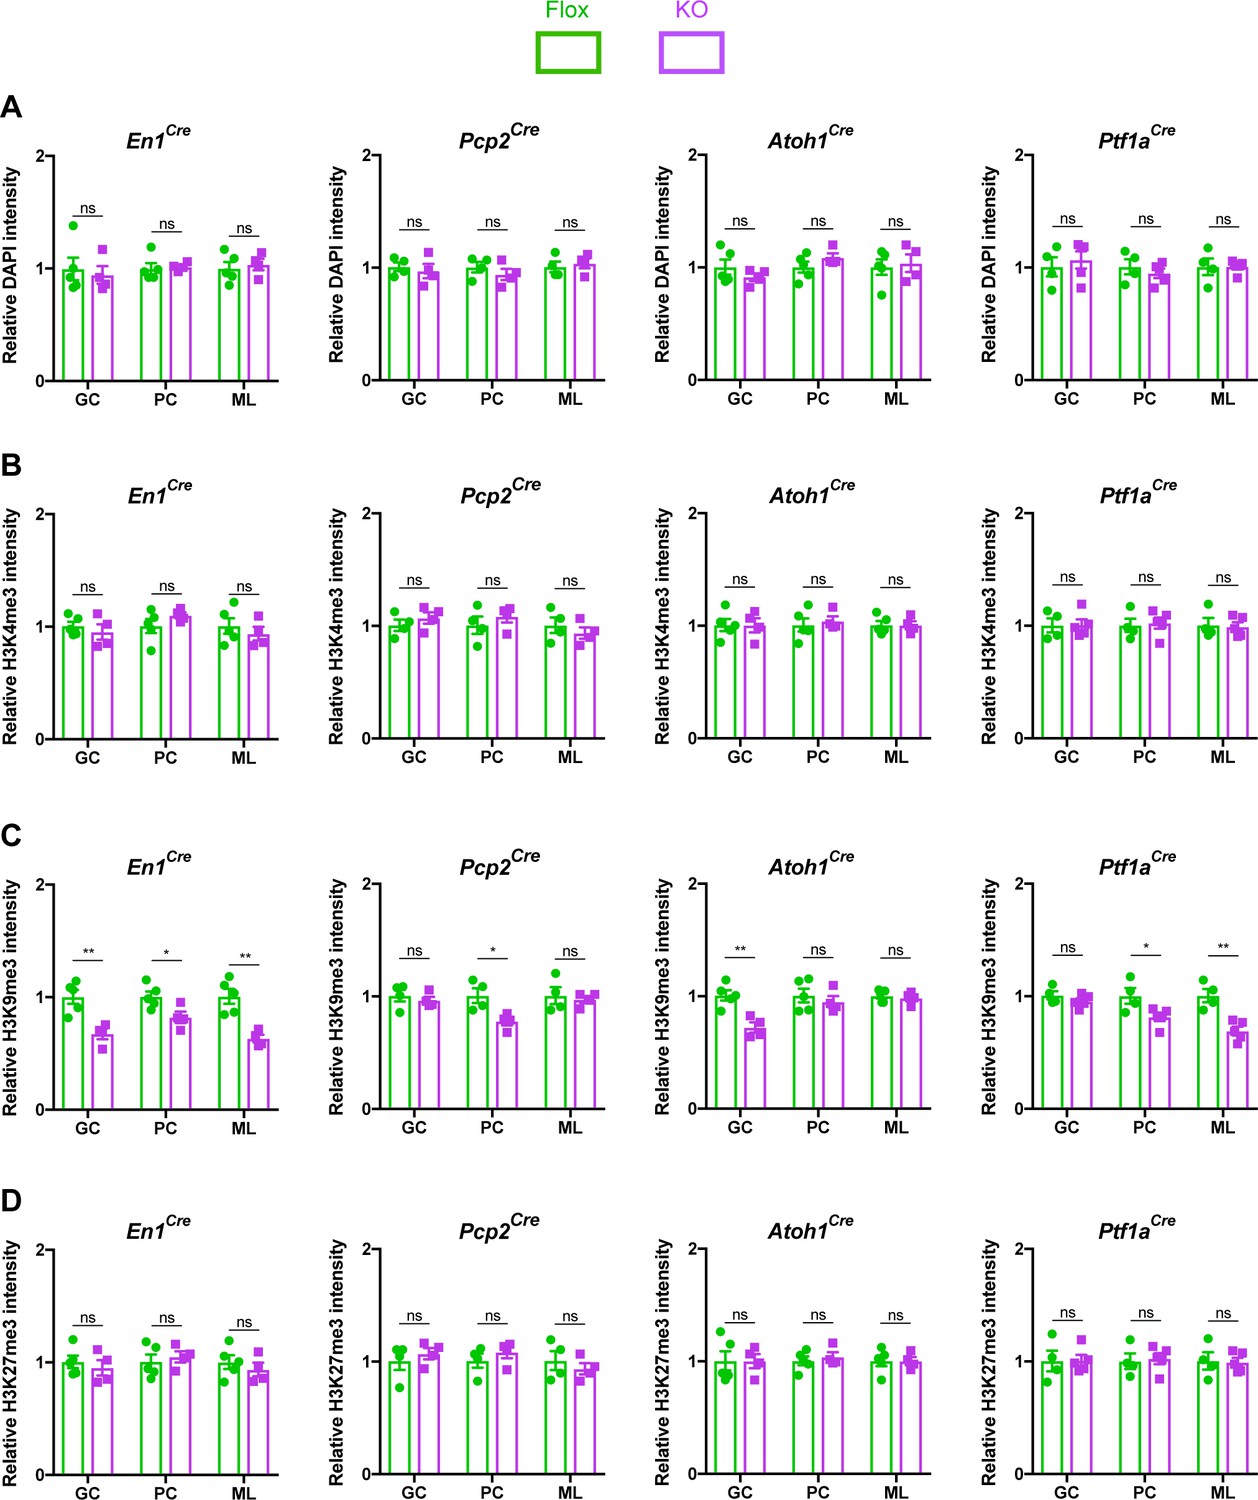
The loss of Mecp2 in cerebellar neurons disrupts histone methylation in heterochromatic foci.
The intensity of DAPI and histone methylation marks was measured in the heterochromatic foci of granule cells (GC), Purkinje cells (PC), and molecular layer interneurons (ML) in Flox and KO mice. (A) Normalized DAPI intensity in heterochromatic foci. (B) Normalized H3K4me3 intensity in heterochromatic foci. (C) Normalized H3K9me3 intensity in heterochromatic foci. (D) Normalized H3K27me3 intensity in heterochromatic foci. 15–20 neurons were analyzed per mouse. Data were normalized to the values of Flox mice. N = 4–5 biologically independent mice per group. Data are presented as mean ± s.e.m. Statistical significance was determined by two-tailed, unpaired student’s t-test. ns (p>0.05), *(p<0.05), **(p<0.01).
-
Figure 4—source data 1
Related to Figure 4.
- https://cdn.elifesciences.org/articles/64833/elife-64833-fig4-data1-v1.xlsx
Figure 4—figure supplement 1
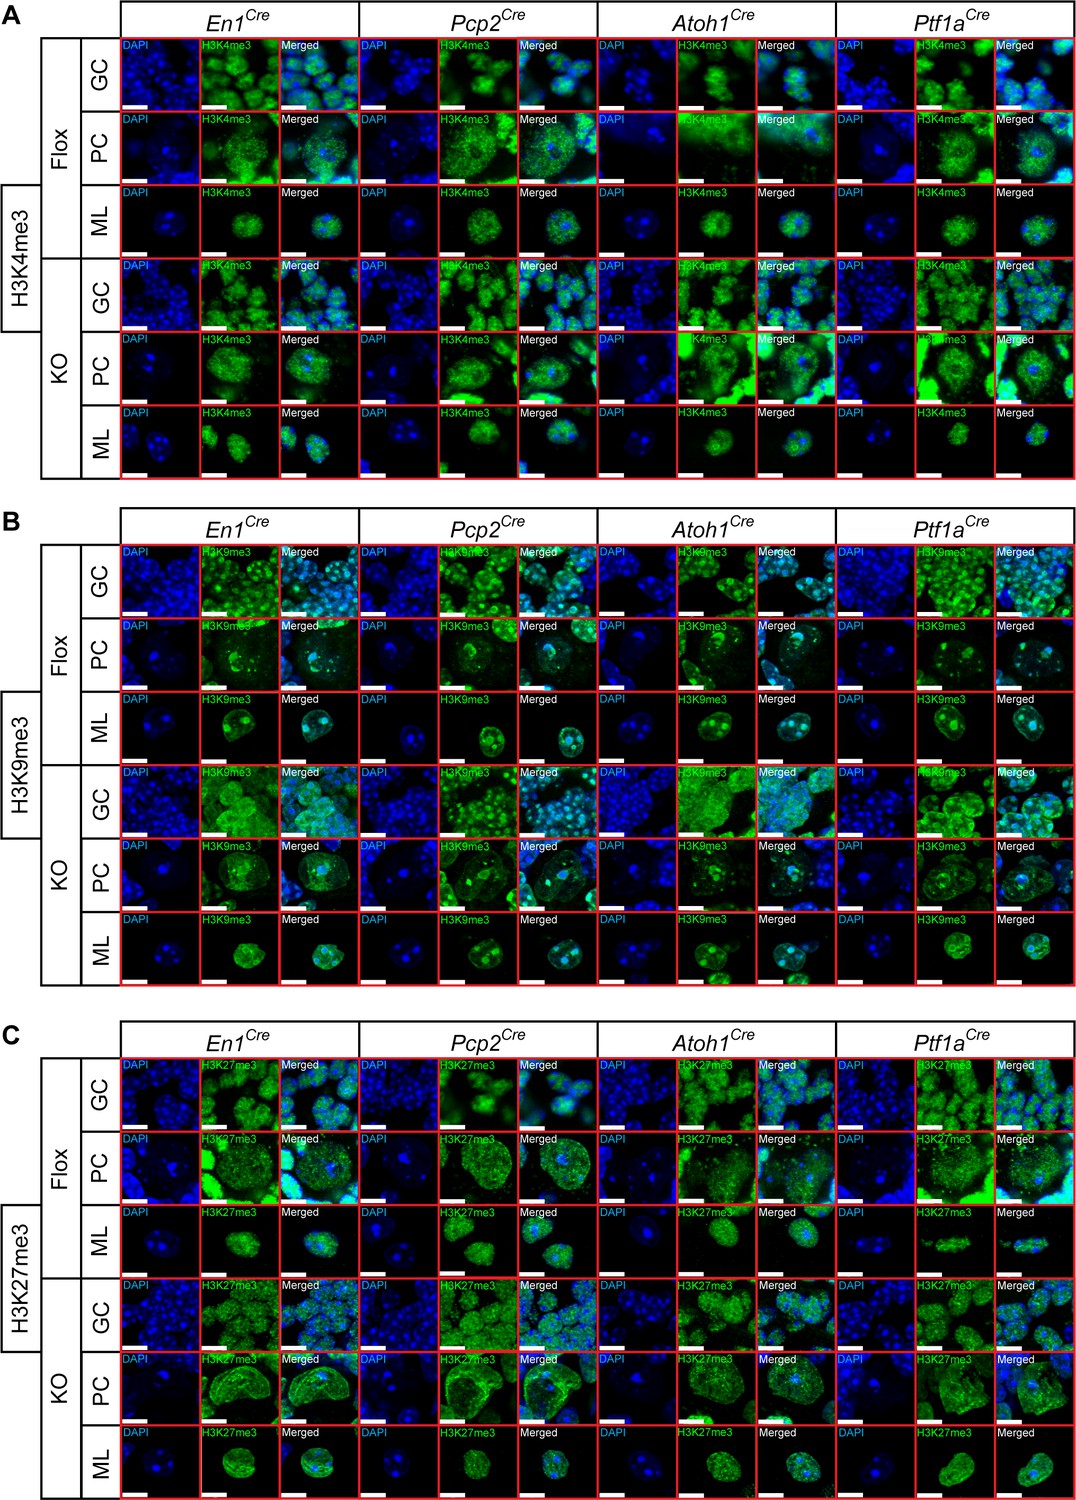
Heterochromatin architecture in mice lacking Mecp2 in cerebellar neurons.
(A) Representative images of cerebellar neurons in Flox and KO mice showing DAPI and H3K4me3. Scale bar, 5 µm. (B) Representative images of cerebellar neurons in Flox and KO mice showing DAPI and H3K9me3. Scale bar, 5 µm. (C) Representative images of cerebellar neurons in Flox and KO mice showing DAPI and H3K27me3. Scale bar, 5 µm.
Figure 4—figure supplement 2
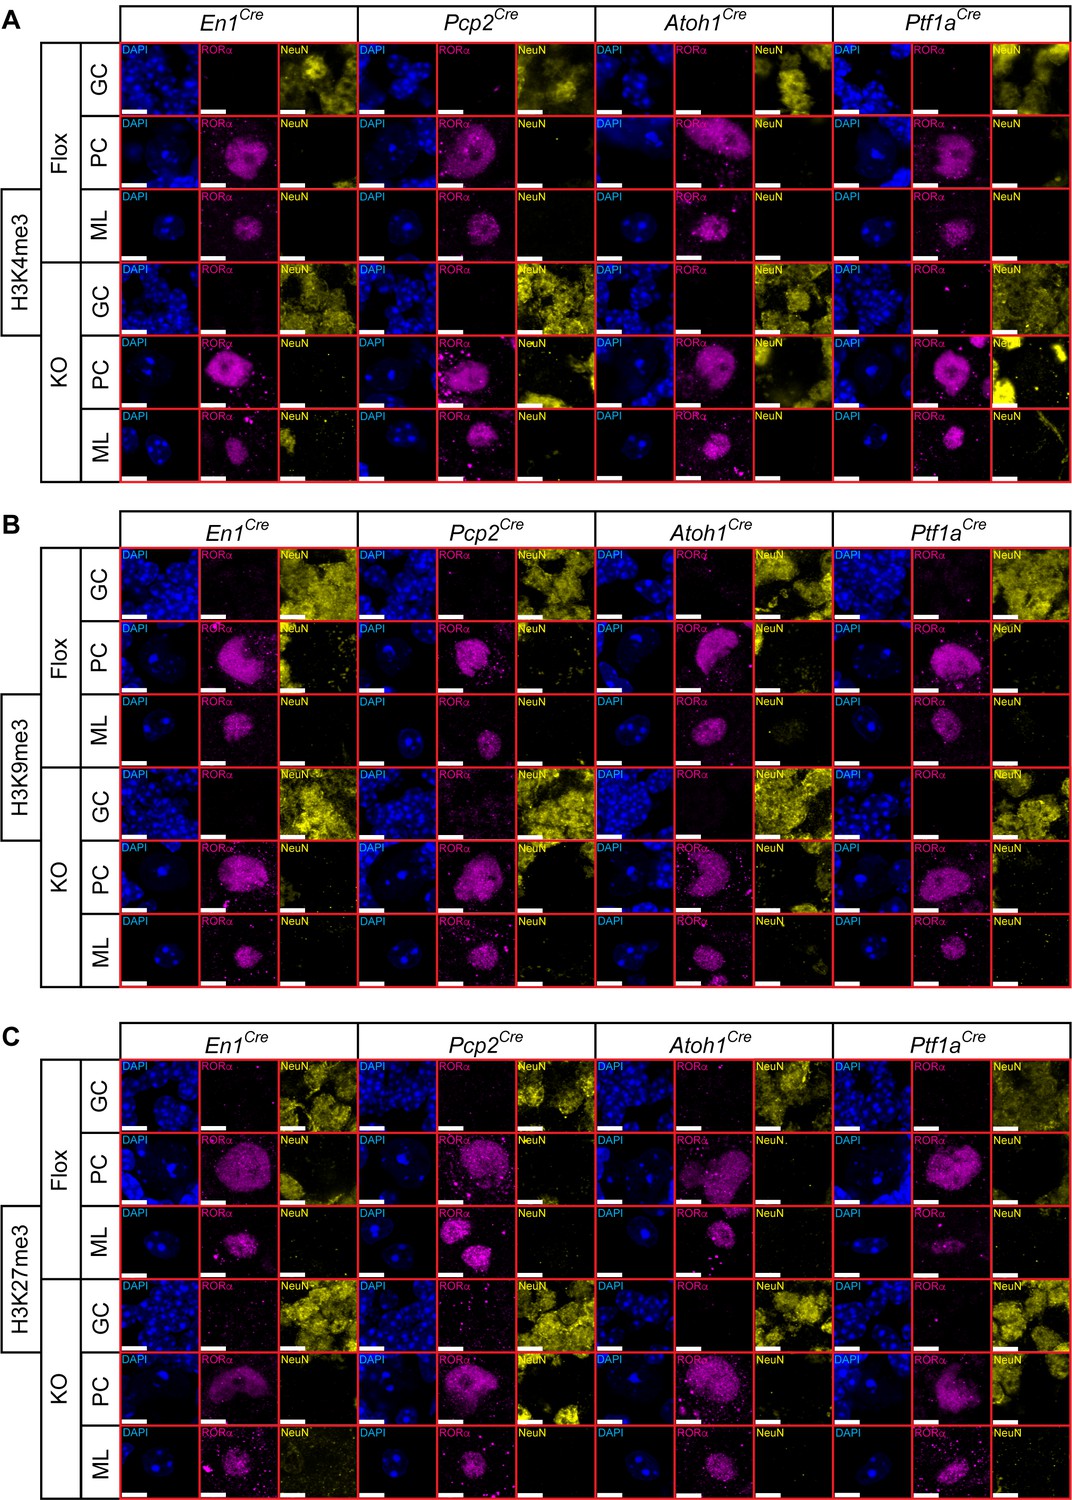
Cerebellar neurons were identified by the expression of RORα and NeuN.
(A) Neurons stained for H3K4me3 from Figure 4—figure supplement 1 were co-stained for RORα and NeuN to identify molecular layer interneurons (RORα), Purkinje cells (RORα), and granule cells (NeuN). Scale bar, 5 µm. (B) Neurons stained for H3K9me3 from Figure 4—figure supplement 1 were co-stained for RORα and NeuN to identify molecular layer interneurons (RORα), Purkinje cells (RORα), and granule cells (NeuN). Scale bar, 5 µm. (C) Neurons stained for H3K27me3 from Figure 4—figure supplement 1 were co-stained for RORα and NeuN to identify molecular layer interneurons (RORα), Purkinje cells (RORα), and granule cells (NeuN). Scale bar, 5 µm.
Tables
Key resources table
| Reagent type (species) or resource | Designation | Source or reference | Identifiers | Additional information |
|---|---|---|---|---|
| Antibody | Rabbit polyclonal anti-Histone H3 | Abcam | RRID:AB_302613 Cat# ab1791 | 1:20,000 |
| Antibody | Rabbit monoclonal anti-MeCP2 | Cell Signaling Technologies | RRID:AB_2143849 Cat# 3456 | 1:1000 |
| Antibody | Mouse monoclonal anti-MeCP2 | Abcam | RRID:AB_881466 Cat# ab50005 | 1:500 |
| Antibody | Mouse monoclonal anti-NeuN | Millipore Sigma | RRID:AB_2298772 Cat# MAB377 | 1:250 |
| Antibody | Mouse monoclonal anti-Calbinin-D28K | Swant | RRID:AB_10000347 Cat# 300 | 1:10,000 |
| Antibody | Rabbit polyclonal anti-Parvalbumin | Swant | RRID:AB_2631173 Cat# PV27 | 1:1000 |
| Antibody | Rabbit polyclonal anti-Vglut1 | Synaptic Systems | RRID:AB_887877 Cat# 135 302 | 1:1000 |
| Antibody | Guinea pig polyclonal anti-Vglut2 | Synaptic Systems | RRID:AB_887884 Cat# 135 404 | 1:1000 |
| Antibody | Guinea pig polyclonal anti-Vgat | Synaptic Systems | RRID:AB_1106810 Cat# 131 005 | 1:1000 |
| Antibody | Rabbit polyclonal anti-histone H3 (tri methyl K4) | Cell Signaling Technologies | RRID:AB_2616028 Cat# 9751 | 1:500 |
| Antibody | Rabbit polyclonal anti-histone H3 (tri methyl K9) | Abcam | RRID:AB_306848 Cat# ab8898 | 1:500 |
| Antibody | Rabbit polyclonal anti-histone H3 (tri methyl K27) | Millipore Sigma | RRID:AB_310624 Cat# 07–449 | 1:500 |
| Antibody | Goat polyclonal anti-RORα | Santa Cruz Biotechnology | RRID:AB_655755 Cat# sc-6062 | 1:250 |
| Antibody | Goat anti-mouse IgG Alexa Fluor 488 | Thermo Fischer | RRID:AB_2534069 Cat# A-11001 | 1:500 |
| Antibody | Goat anti-guinea pig IgG Alexa Fluor 555 | Thermo Fischer | RRID:AB_2535856 Cat# A-21435 | 1:500 |
| Antibody | Goat anti-rabbit IgG Alexa Fluor 647 | Thermo Fischer | RRID:AB_2535812 Cat# A-21244 | 1:500 |
| Antibody | Donkey anti-rabbit IgG Alexa Fluor 488 | Thermo Fischer | RRID:AB_2535792 Cat# A-21206 | 1:500 |
| Antibody | Donkey anti-goat IgG Alexa Fluor 555 | Thermo Fischer | RRID:AB_2535853 Cat# A-21432 | 1:500 |
| Antibody | Donkey anti-mouse IgG Alexa Fluor 647 | Thermo Fischer | RRID:AB_162542 Cat# A-31571 | 1:500 |
| Commercial assay, kit | Paraformaldehyde | Millipore Sigma | Cat# 158127 | |
| Commercial assay, kit | Pierce BCA Protein Assay | Thermo Fischer | Cat# 23225 | |
| Commercial assay, kit | FD Rapid Golgi Stain Kit | FD Neurotechnologies | Cat# PK401 | |
| Strain, strain background (Mus musculus) | (C57BL/6J) Rosa26lsl-tdTomato | The Jackson Laboratory | RRID: IMSR_JAX:007914 | |
| Strain, strain background (Mus musculus) | (C57BL/6J) En1Cre | The Jackson Laboratory | RRID: IMSR_JAX:007916 | |
| Strain, strain background (Mus musculus) | (C57BL/6J) Atoh1Cre | The Jackson Laboratory | RRID:IMSR_JAX:011104 | |
| Strain, strain background (Mus musculus) | (C57BL/6J) Pcp2Cre | The Jackson Laboratory | RRID:IMSR_JAX:004146 | |
| Strain, strain background (Mus musculus) | (C57BL/6J) Ptf1aCre | The Jackson Laboratory | RRID:IMSR_JAX:007909 | |
| Strain, strain background (Mus musculus) | (C57BL/6J) Mecp2flox/+ and Mecp2flox/flox | The Jackson Laboratory | RRID:IMSR_JAX:007177 | |
| Other | DAPI stain | Thermo Fischer | RRID:AB_2629482 Cat# D-1306 | |
| Other | Tissue-Tek Optimum Cutting Temperature Compound | Sakura | Cat# 4583 | |
| Other | Superfrost Plus microscope slides | Thermo Fischer | Cat# 12-550-15 | |
| Other | ProLong Gold Antifade mounting medium | Thermo Fischer | Cat# P10144 | |
| Other | NuPAGE LDS sample buffer | Thermo Fischer | Cat# NP0007 | |
| Other | NuPAGE Sample reducing agent | Thermo Fischer | Cat# NP0004 | |
| Other | 15-well NuPAGE 4–12% Bis–Tris Gel | Thermo Fischer | Cat# NP0336BOX | |
| Other | 15-well NuPAGE 4–12% Bis–Tris Gel | Thermo Fischer | Cat# NP0336BOX | |
| Other | PVDF blotting membrane | GE Healthcare Life Sciences | Cat# 10600021 | |
| Other | Odyssey TBS Blocking Buffer | LI-COR Biosciences | Cat# 927–50000 | |
| Software, algorithm | Spike2 | Cambridge Electronic Design | RRID:SCR_000903 | |
| Software, algorithm | MATLAB | Mathworks | RRID: SCR_001622 | |
| Software, algorithm | Image Studio Lite | LI-COR Biosciences | RRID:SCR_013715 | |
| Software, algorithm | ImageJ-Fiji | Other | RRID:SCR_002285 | |
| Software, algorithm | Neurolucida 360 | MBF Biosciences | RRID:SCR_016788 | |
| Software, algorithm | Neurolucida Explorer | MBF Biosciences | RRID:SCR_017348 | |
| Software, algorithm | Imaris | Bitplane | RRID:SCR_007370 | |
| Software, algorithm | Prism | GraphPad Software | RRID: SCR_002798 |
Additional files
-
Source data 1
Statistical analysis related to Figure 1, Figure 2, Figure 2—figure supplement 1, Figure 2—figure supplement 3, Figure 3, and Figure 4.
- https://cdn.elifesciences.org/articles/64833/elife-64833-data1-v1.xlsx
-
Transparent reporting form
- https://cdn.elifesciences.org/articles/64833/elife-64833-transrepform-v1.docx
Download links
A two-part list of links to download the article, or parts of the article, in various formats.
Downloads (link to download the article as PDF)
Open citations (links to open the citations from this article in various online reference manager services)
Cite this article (links to download the citations from this article in formats compatible with various reference manager tools)
Deleting Mecp2 from the cerebellum rather than its neuronal subtypes causes a delay in motor learning in mice
eLife 10:e64833.
https://doi.org/10.7554/eLife.64833


