Evolution of natural lifespan variation and molecular strategies of extended lifespan in yeast
- Department of Biology, Virginia Commonwealth University, United States
- Genetics, Genome Institute of Singapore, Agency for Science, Technology and Research (A*STAR), Singapore
- Department of Laboratory Medicine and Pathology, University of Washington, United States
- Department of Environmental and Occupational Health Sciences, University of Washington, United States
- Division of Genetics, Department of Medicine, Brigham and Women's Hospital, Harvard Medical School, United States
- Key Laboratory of Animal Ecology and Conservation Biology, Chinese Academy of Sciences, Institute of Zoology, China
- Department of Biology, University of Houston - Clear Lake, United States
- Department of Biology, University of Washington, United States
Figures
Figure 1 with 1 supplement
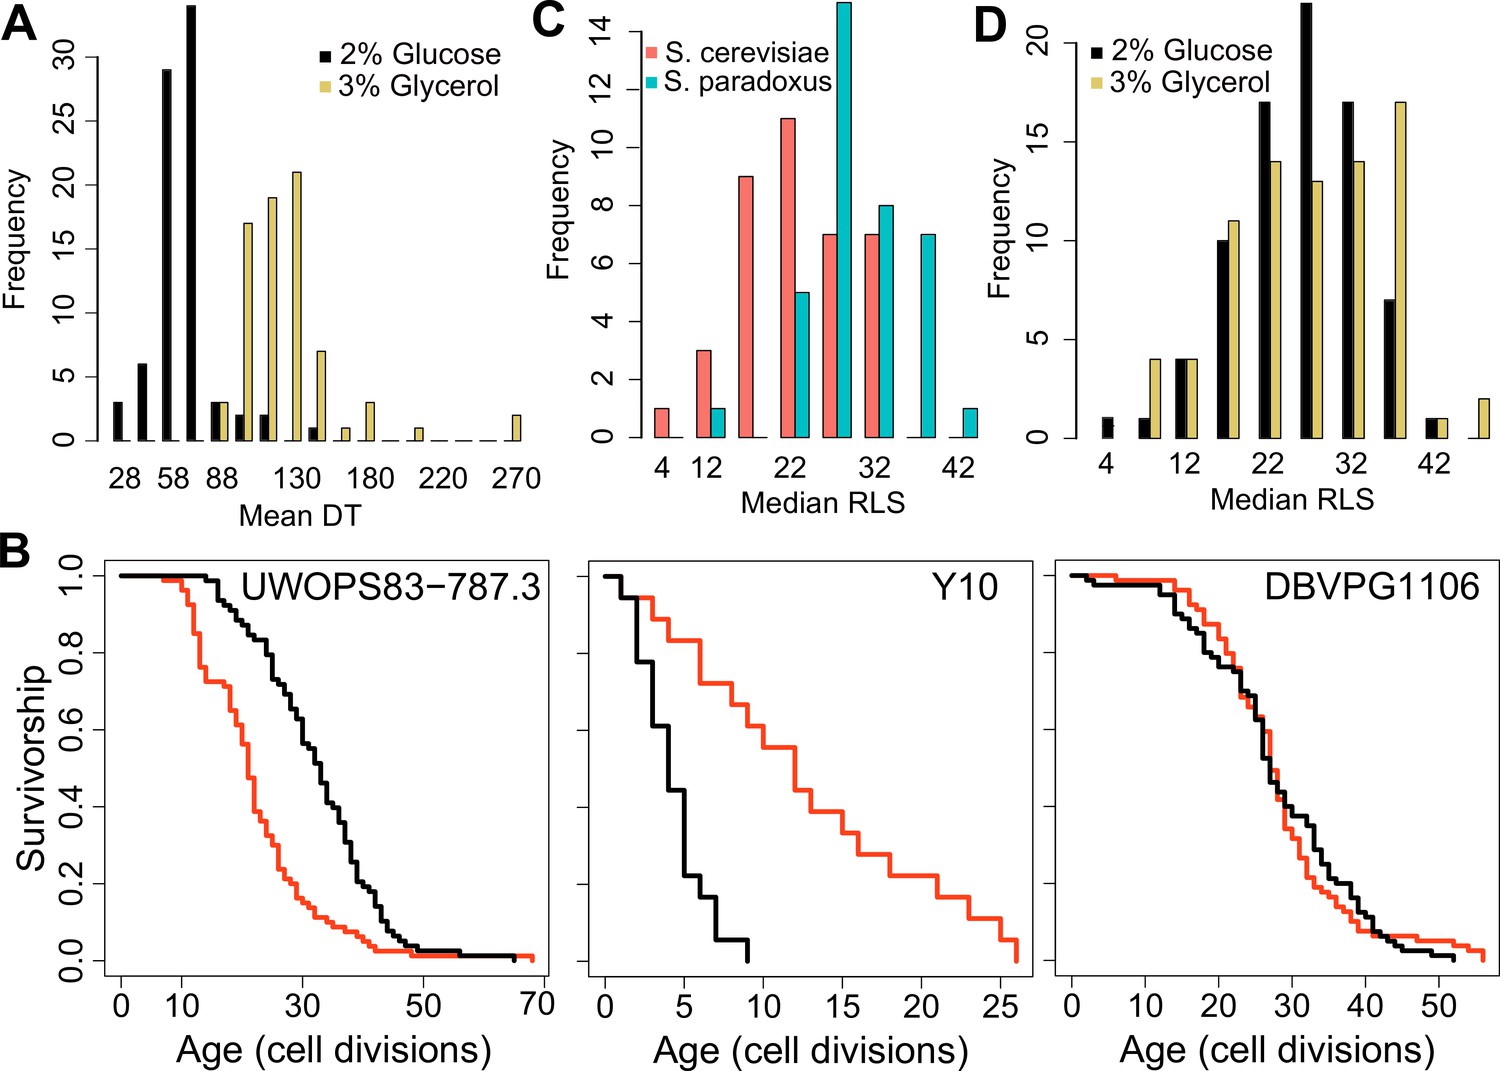
Doubling time and replicative lifespan of yeast wild isolates.
(A) Distribution of mean doubling time (DT, in minutes) on yeast peptone dextrose (YPD; 2 % glucose) and yeast peptone glycerol (YPG; 3 % glycerol). (B) Examples of lifespan curves for the selected strains. Black curve shows lifespan under YPD conditions, and red curve under YPG conditions. (C) Median replicative lifespan (RLS) distribution across S. cerevisiae (red) and S. paradoxus (turquoise) isolates grown in YPD. (D) Distribution of median RLS across different conditions. Source data are provided as Supplementary file 1.
Figure 1—figure supplement 1
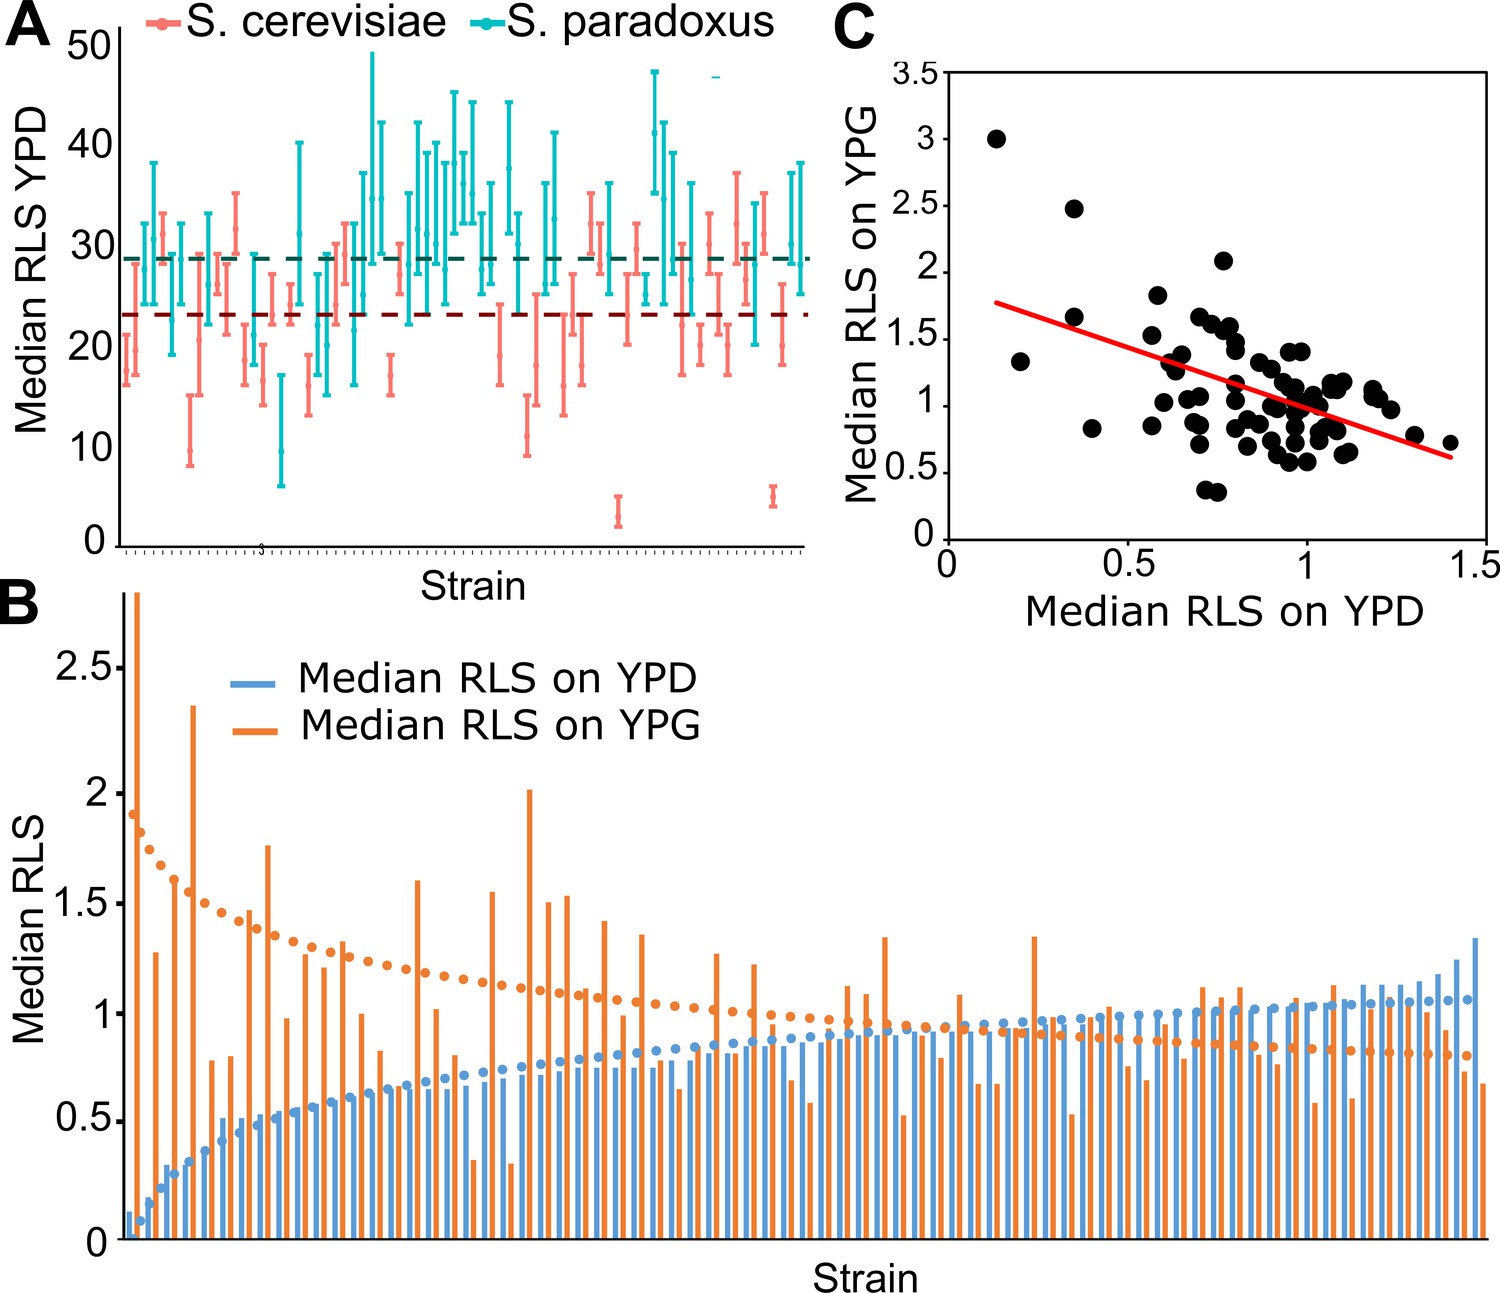
Replicative lifespan (RLS) phenotype across wild isolates.
(A) Median RLS (error bars are the 95% confidence interval [CI] of the median lifespan) distribution across S. cerevisiae and S. paradoxus isolates grown in yeast peptone dextrose (YPD). Dashed lines represent average median RLS of S. cerevisiae (red) and S. paradoxus strains (turquoise). (B) Median RLS changes in YPD (glucose – blue) and yeast peptone glycerol (YPG; glycerol – orange) across wild isolates normalized against laboratory diploid wild type (WT) strain, BY4743 (median RLS × strain/median RLS BY4743). Short-lived strains grown in YPD tend to have longer lifespan under YPG conditions, whereas long-lived strains grown in YPD tend to have shorter median RLS in YPG. (C) Significant negative correlation between median RLS YPD and median RLS YPG. (Corr. coefficient = −0.51, p < 0.0001).
Figure 2 with 3 supplements
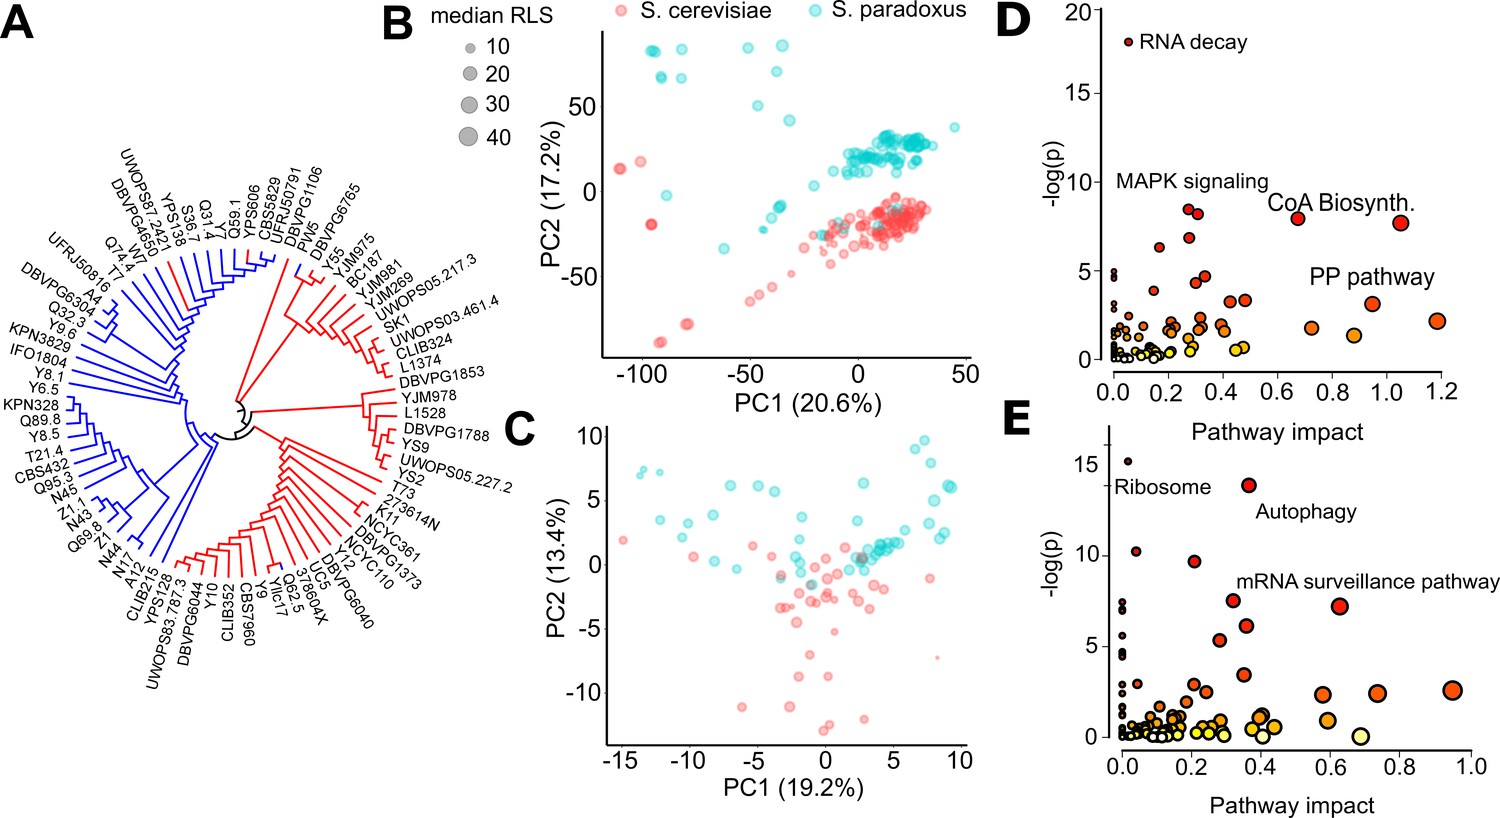
Endophenotypic variation across strains.
(A) Phylogenetic relationship based on the transcriptome data of 76 strains of 2 species. Principal component analysis (PCA) of (B) transcriptomics and (C) metabolomics. Percent variance explained by each principal component (PC) is shown in parentheses. Pathway enrichment analysis for combined top genes and metabolites contributing to (D) PC1 and (E) PC2. Some of the enriched Kyoto Encyclopedia of Genes and Genomes (KEGG) pathways are shown in each panel. Source data are provided as Supplementary file 3.
Figure 2—figure supplement 1
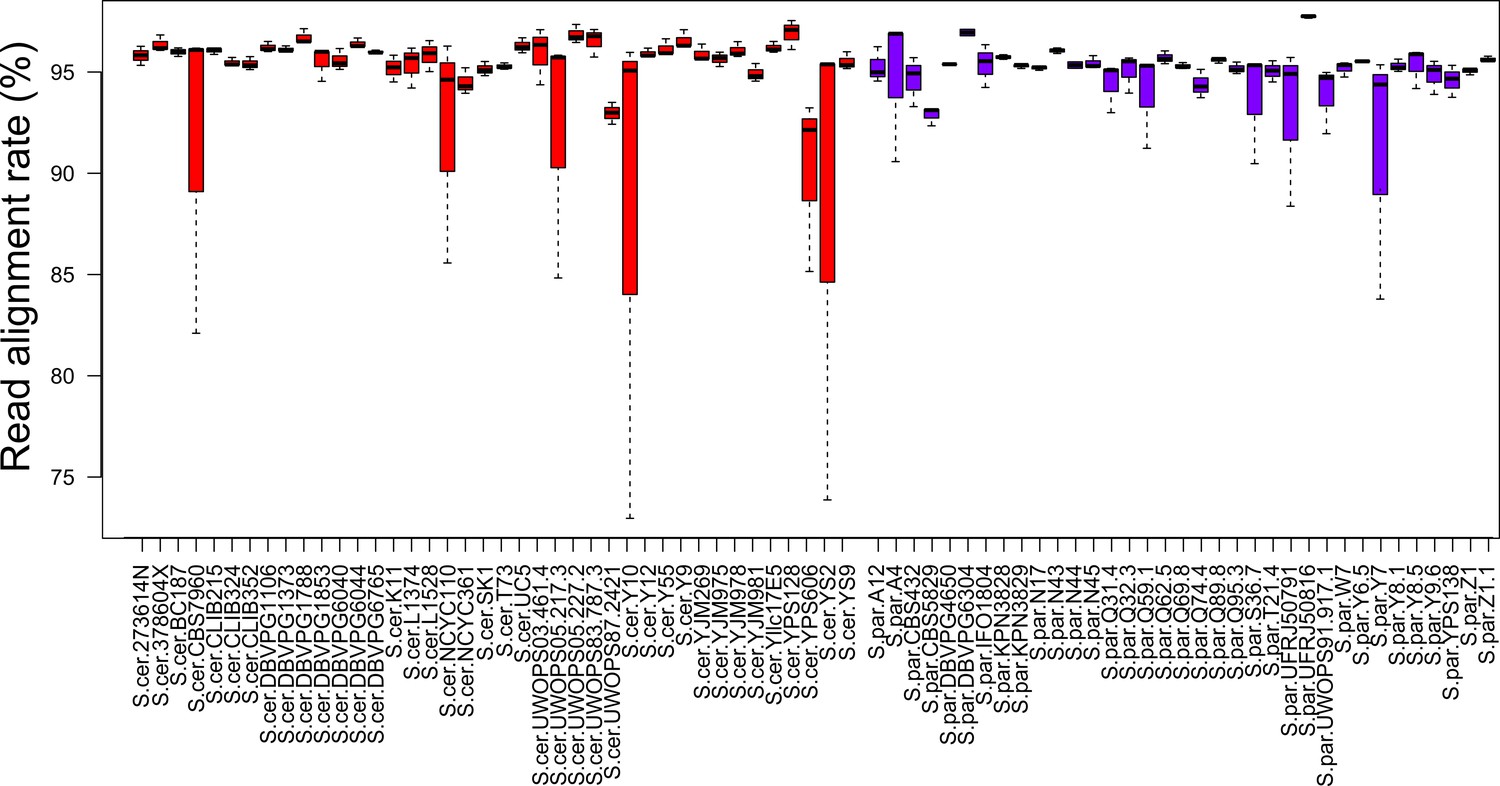
Read alignment rate for RNA-seq data.
RNA-seq reads were mapped to the pseudo genome using STAR aligner software and mean value of alignment rate (three replicates per strain) from STAR outputs are shown here. Error bars show standard error of mean. Red bars indicate alignment rates for S. cerevisiae strains and purple bars indicate alignment rate for S. paradoxus strains.
Figure 2—figure supplement 2
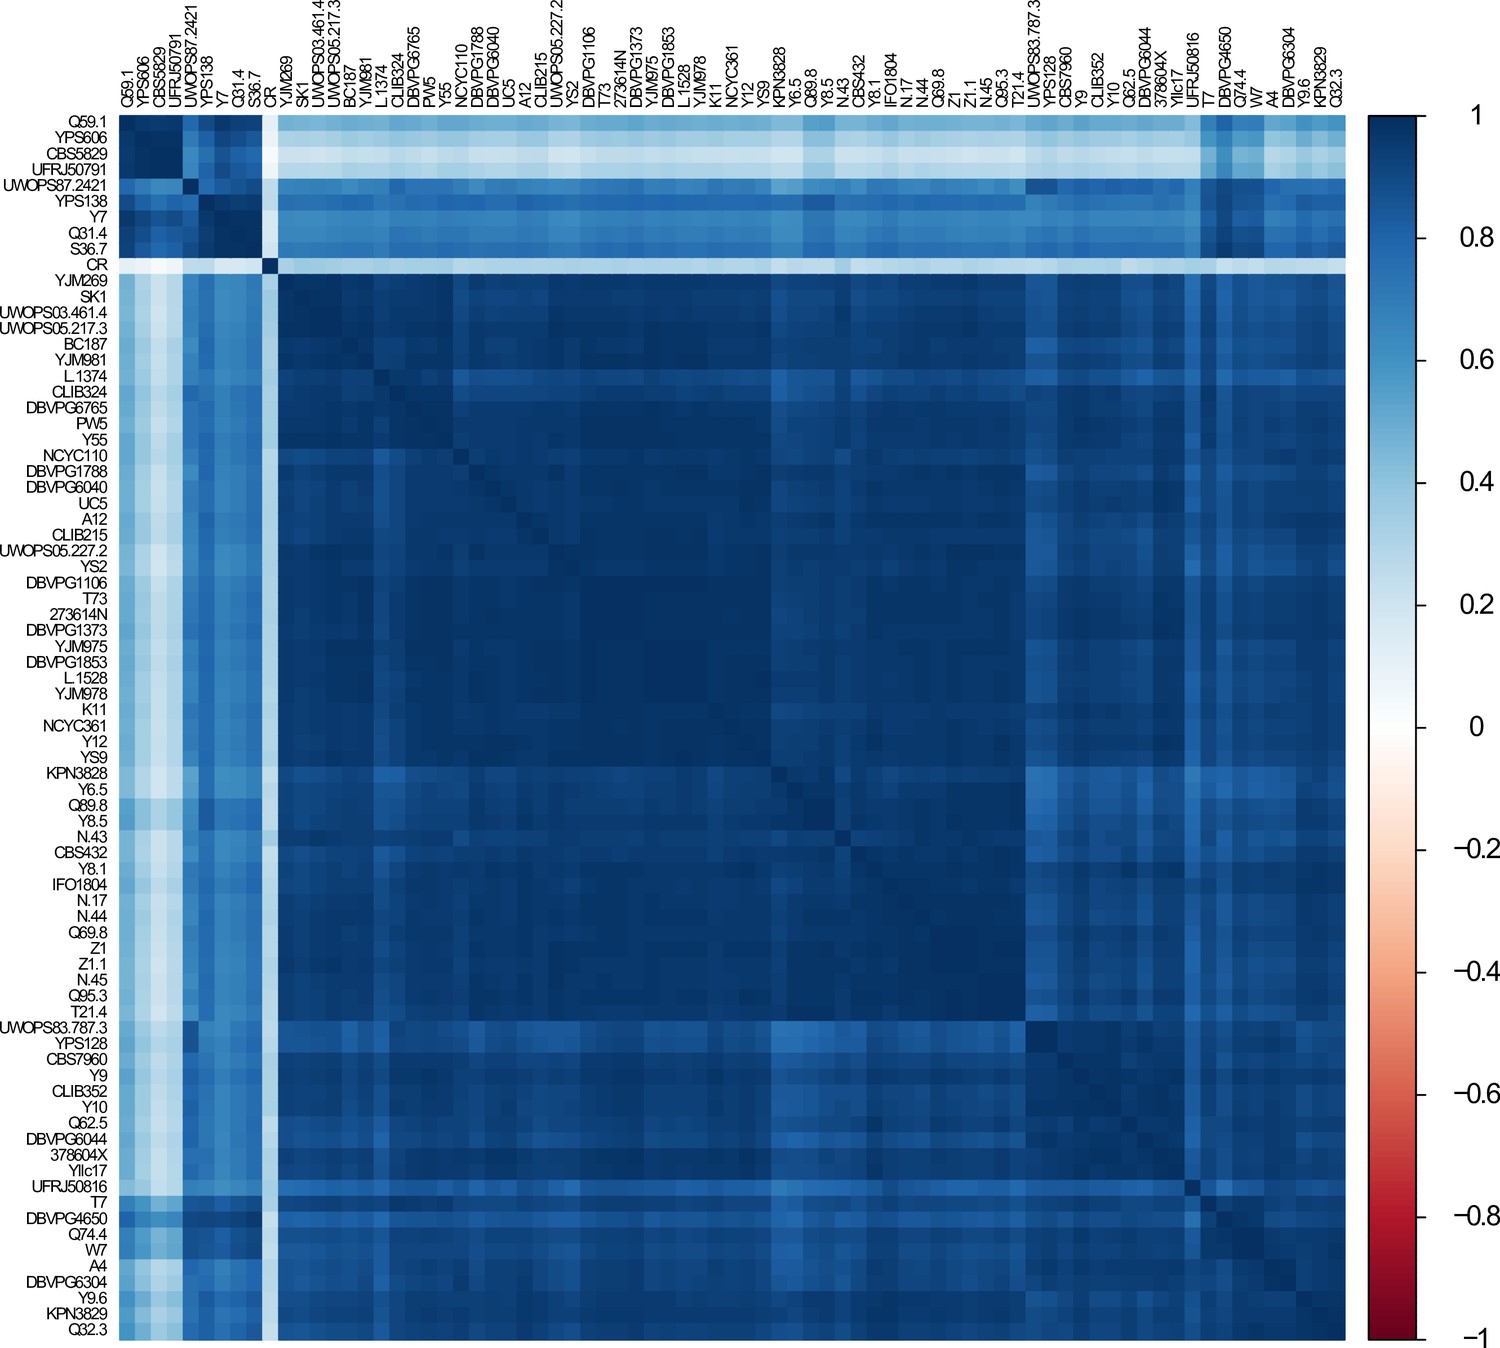
Correlation of genome-wide transcript levels across wild isolates.
Heatmap shows pairwise, 1 − Pearson correlation matrix of gene expression data across wild isolates. Caloric restriction (CR) data were obtained from NCBI GEO (SRA: SRX403444) and placed into the analysis.
Figure 2—figure supplement 3
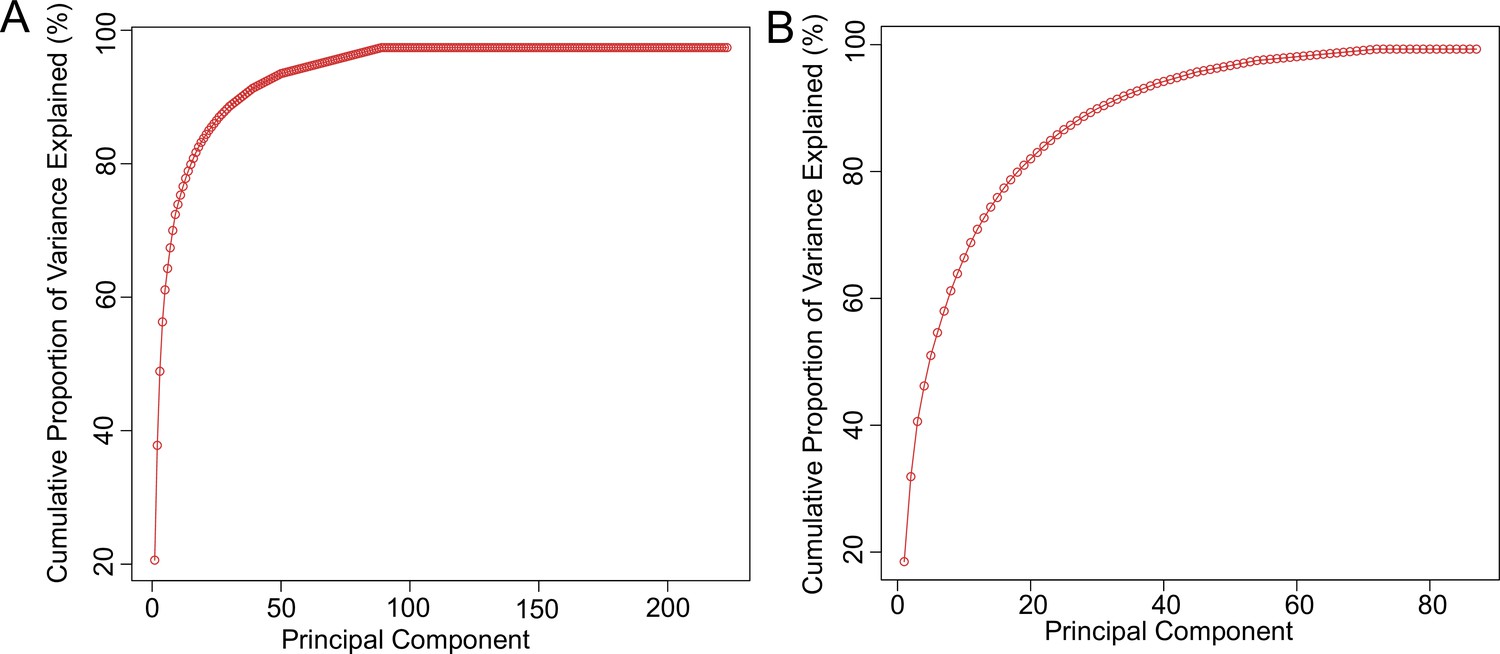
Principal component analysis.
Graphs show cumulative percentage of variance explained by principal components for (A) genes and (B) metabolites.
Figure 3
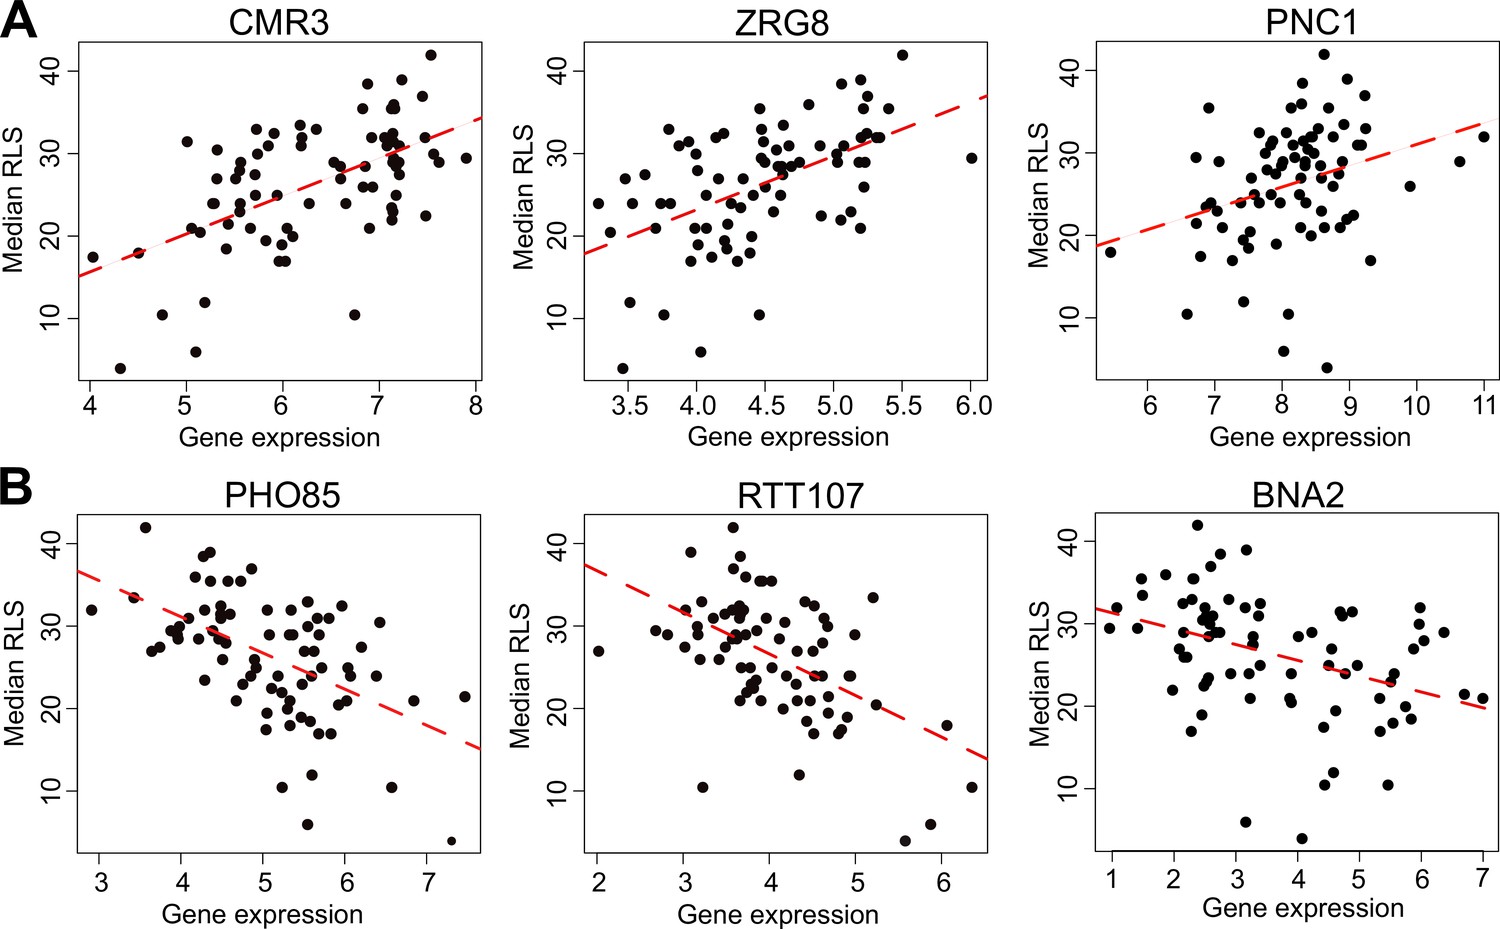
Selected genes whose expression correlates with median replicative lifespan (RLS).
(A) Gene expression level (log2-cpm) of CMR3, ZRG8, and PNC1 positively correlates with median RLS. (B) Transcript abundance of PHO85, RTT107, and BNA2 negatively correlates with median RLS. Regression slope p values can be found in Supplementary file 2, which is also the source data file for these analyses.
Figure 4 with 1 supplement
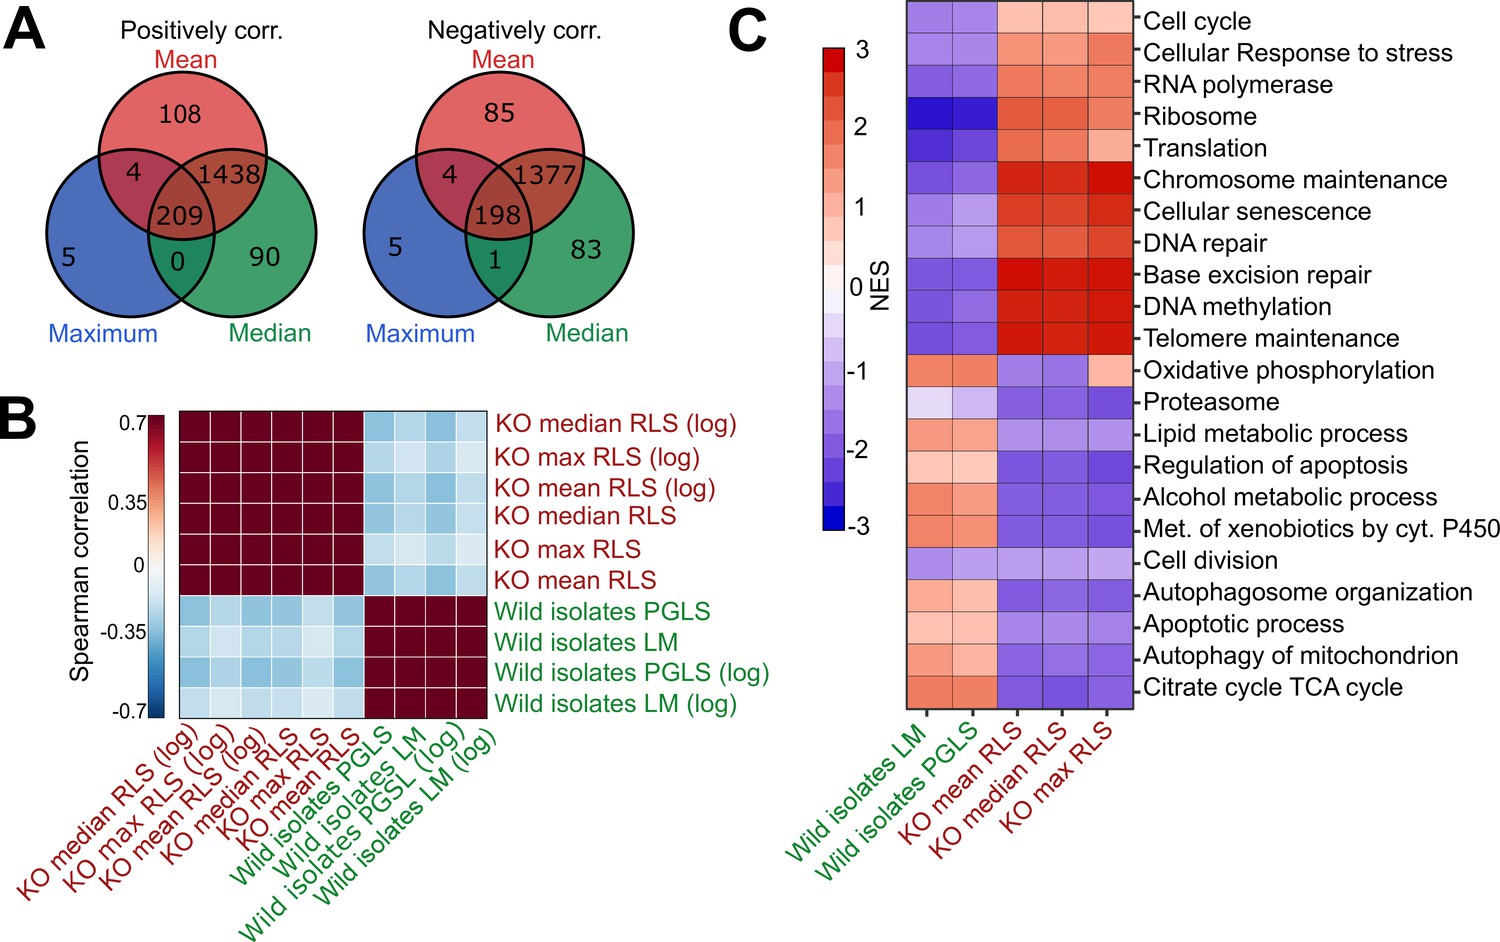
Comparative analysis of lab yeast knockout (KO) and wild isolates.
(A) Significant genes (padj < 0.05) associated with maximum, median, and mean replicative lifespan (RLS; or log maximum, median, and mean) across deletion strains based on transcriptomics data obtained from 1376 KO strains. Genes positively and negatively associated with RLS (upregulated and downregulated, respectively) are significantly shared across different metrics of RLS (Fisher’s exact test, p < 0.05). (B) Denoised correlation matrix of gene expression effects across single-gene deletion strains (KO), and those that we measure across the wild isolates that are associated with RLS. Correlation coefficient is calculated using union of top 1000 statistically significant genes for each pair of signatures with Spearman method. LM: linear model; PGLS: phylogenetic regression least squares. (C) Functional enrichment of genes associated with RLS across deletion and natural strains. Cells are colored based on normalized enrichment score (NES). Supplementary files 1 and 2 are provided as source data files for these analyses.
Figure 4—figure supplement 1
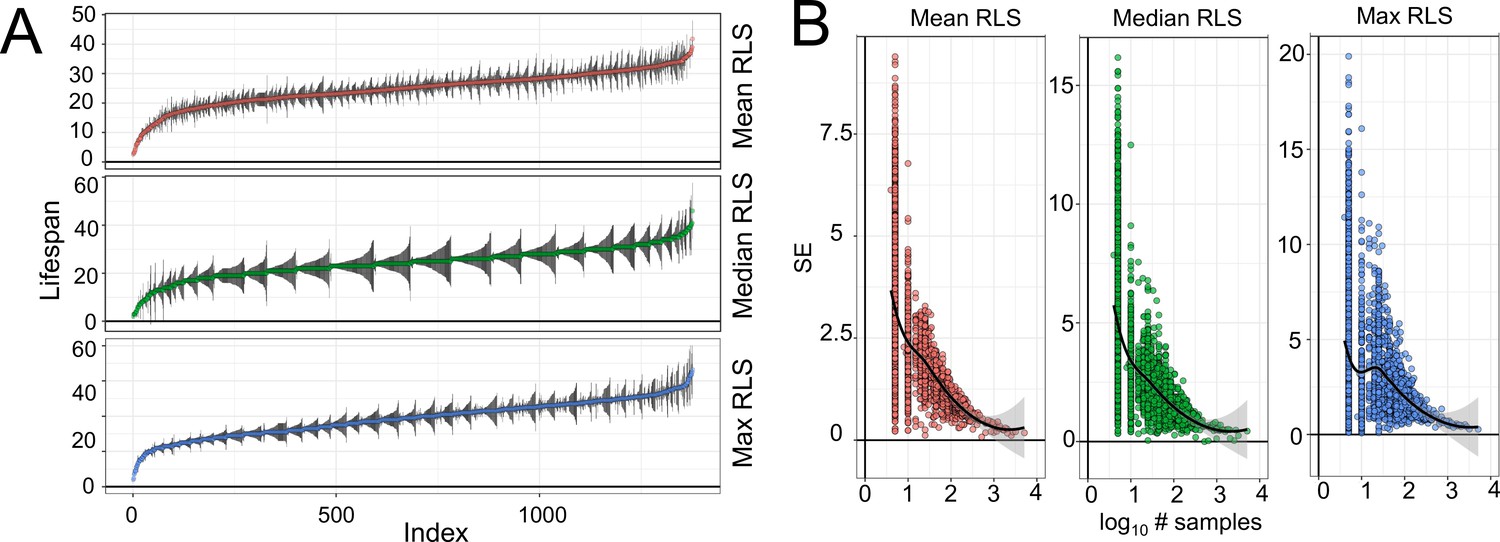
Replicative lifespan (RLS) phenotype of yeast knockout strains.
(A) Distribution of mean, median, and maximum RLS across deletion strains with measured gene expression profile. RLS are sorted from the smallest to the greatest value. Black lines represent standard errors of the RLS estimates for corresponding strains. (B) Dependence of standard error of RLS estimate on the number of strains used for evaluation of deletion mutant lifespan. Raw RLS values are provided in Supplementary file 1.
Figure 5 with 1 supplement

Selected metabolites correlating with median replicative lifespan (RLS).
(A) Abundance (liquid chromatography–mass spectrometry [LC–MS] counts) of lactate, tryptophan (Trp), and hydroxyisobutyrate that positively correlate, and (B) abundance of quinolinic acid, lysine (Lys), and NAD that negatively correlate with median RLS. Regression slope p values can be found in Supplementary file 2. This file is also provided as a source data file for these analyses.
Figure 5—figure supplement 1
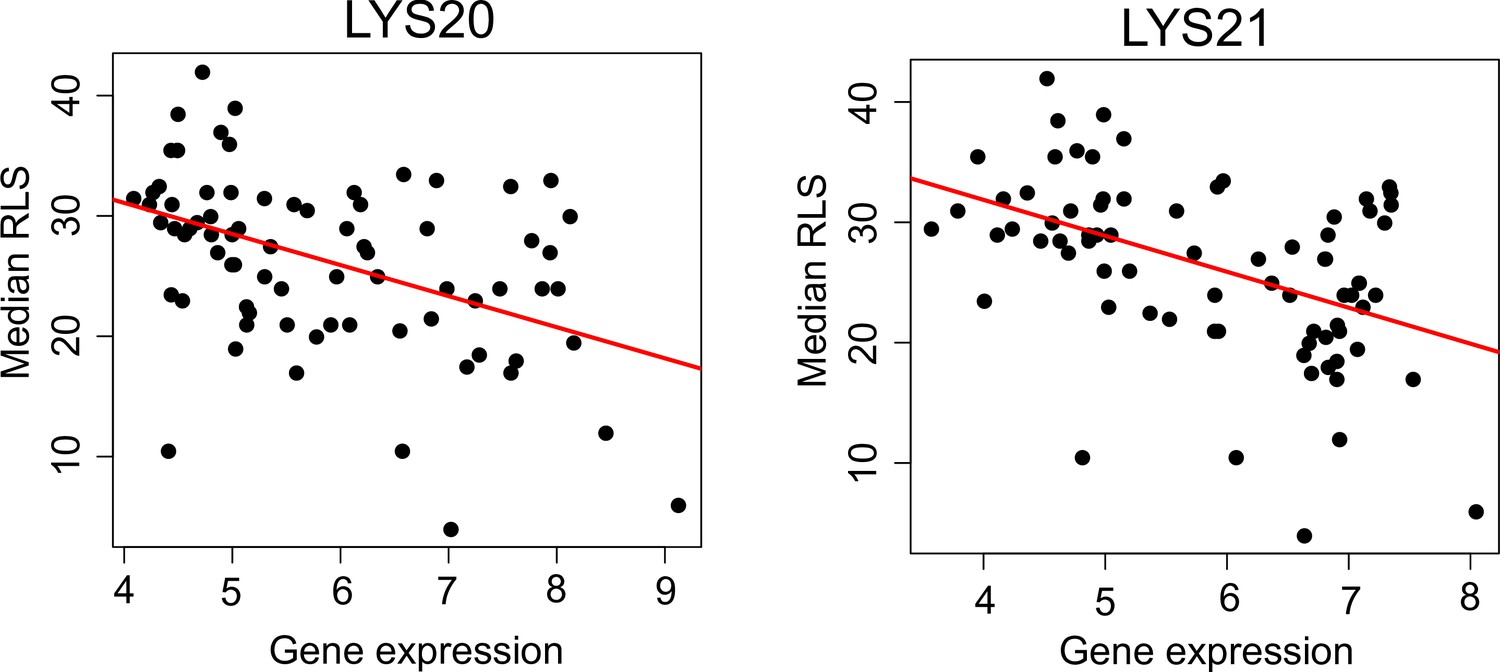
Correlation of LYS20 and LYS21 genes with median replicative lifespan (RLS).
Gene expression level (log2-cpm) of LYS20 and LYS21 negatively correlates with median RLS. Regression slope p values can be found in Supplementary file 2.
Figure 6 with 4 supplements
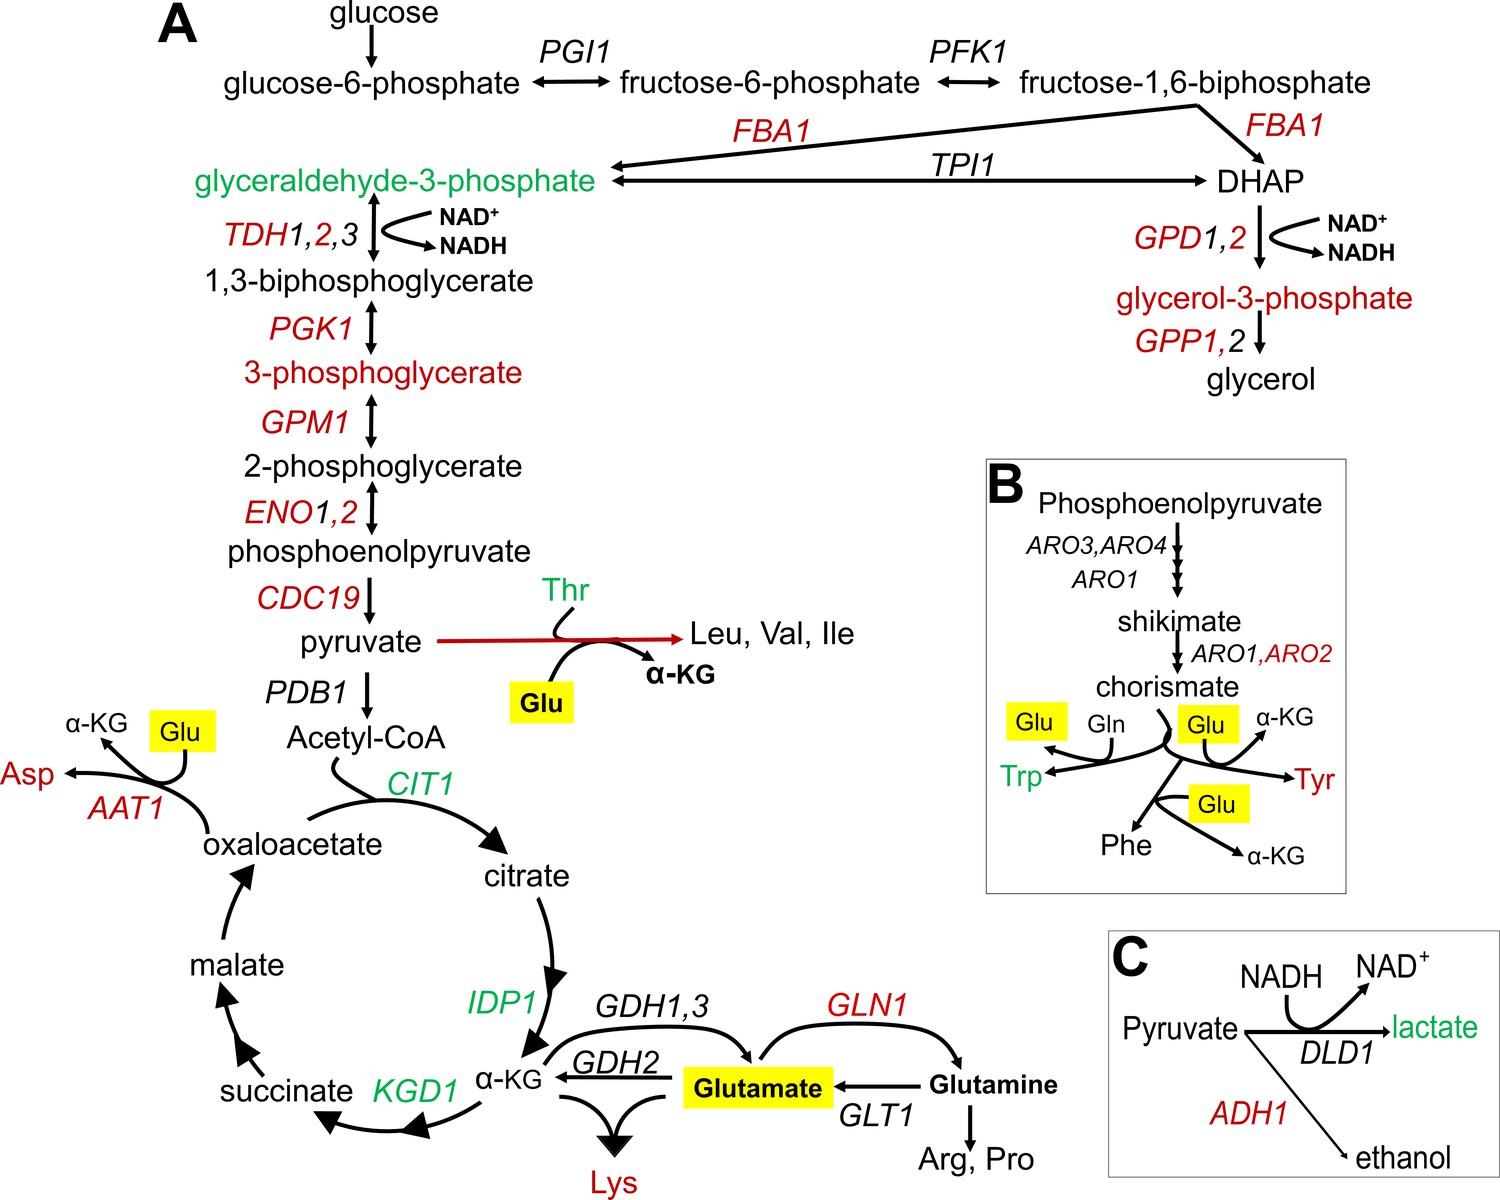
Summary of metabolic changes associated with replicative lifespan (RLS).
(A) Summary depiction of genes and metabolites from the interconnected glycolytic pathway, TCA cycle and amino acid metabolism that are found to be associated with RLS. Associated genes are colored in red (negatively associated with RLS) or green (positively associated with RLS). Depiction of (B) shikimate pathway and (C) lactate and ethanol biosynthetic pathways are shown with the same color code representation. Glutamate is highlighted in yellow.
Figure 6—figure supplement 1
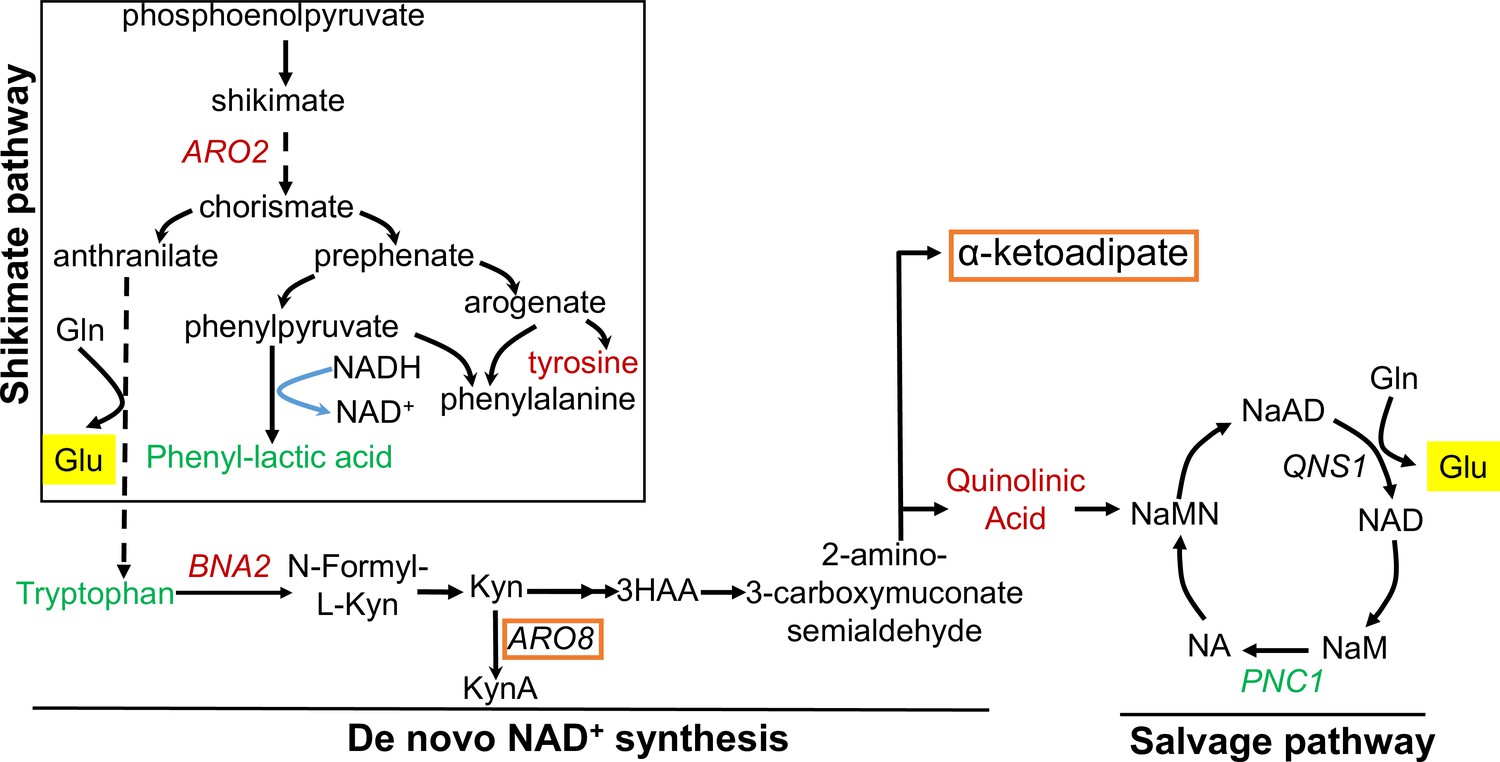
Genes and metabolites from shikimate, kynurenine, and salvage pathways associated with replicative lifespan (RLS).
Genes and metabolites from each pathway that are found to be associated with RLS are colored with red (negatively associated with RLS) or green (positively associated with RLS). Genes and metabolites that are known to be involved in lysine metabolism are highlighted in orange box, and glutamate is highlighted in yellow.
Figure 6—figure supplement 2
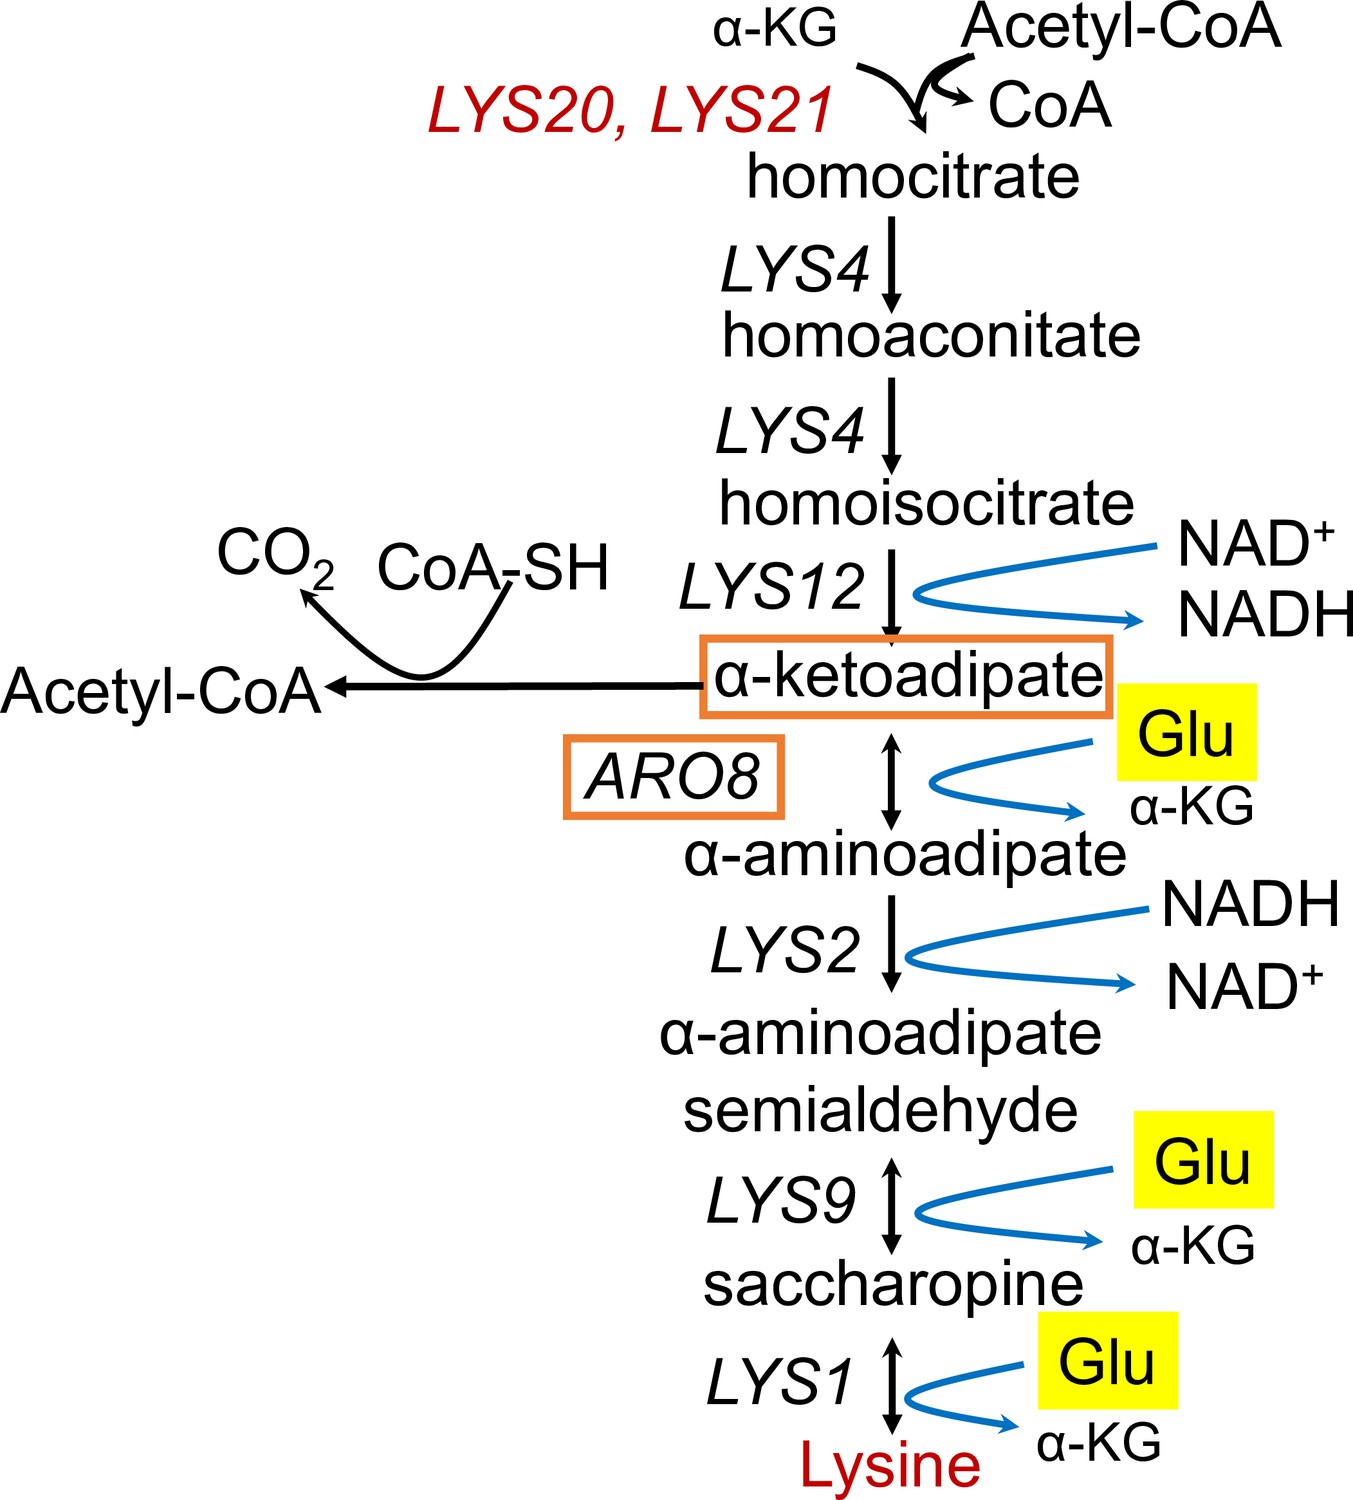
Lysine biosynthesis and replicative lifespan (RLS).
Genes and metabolites from the lysine biosynthetic pathway that are found to be negatively associated with RLS are colored in red. Genes and metabolites that are known to be involved in tryptophan metabolism are highlighted with orange boxes, and glutamate is highlighted in yellow.
Figure 6—figure supplement 3
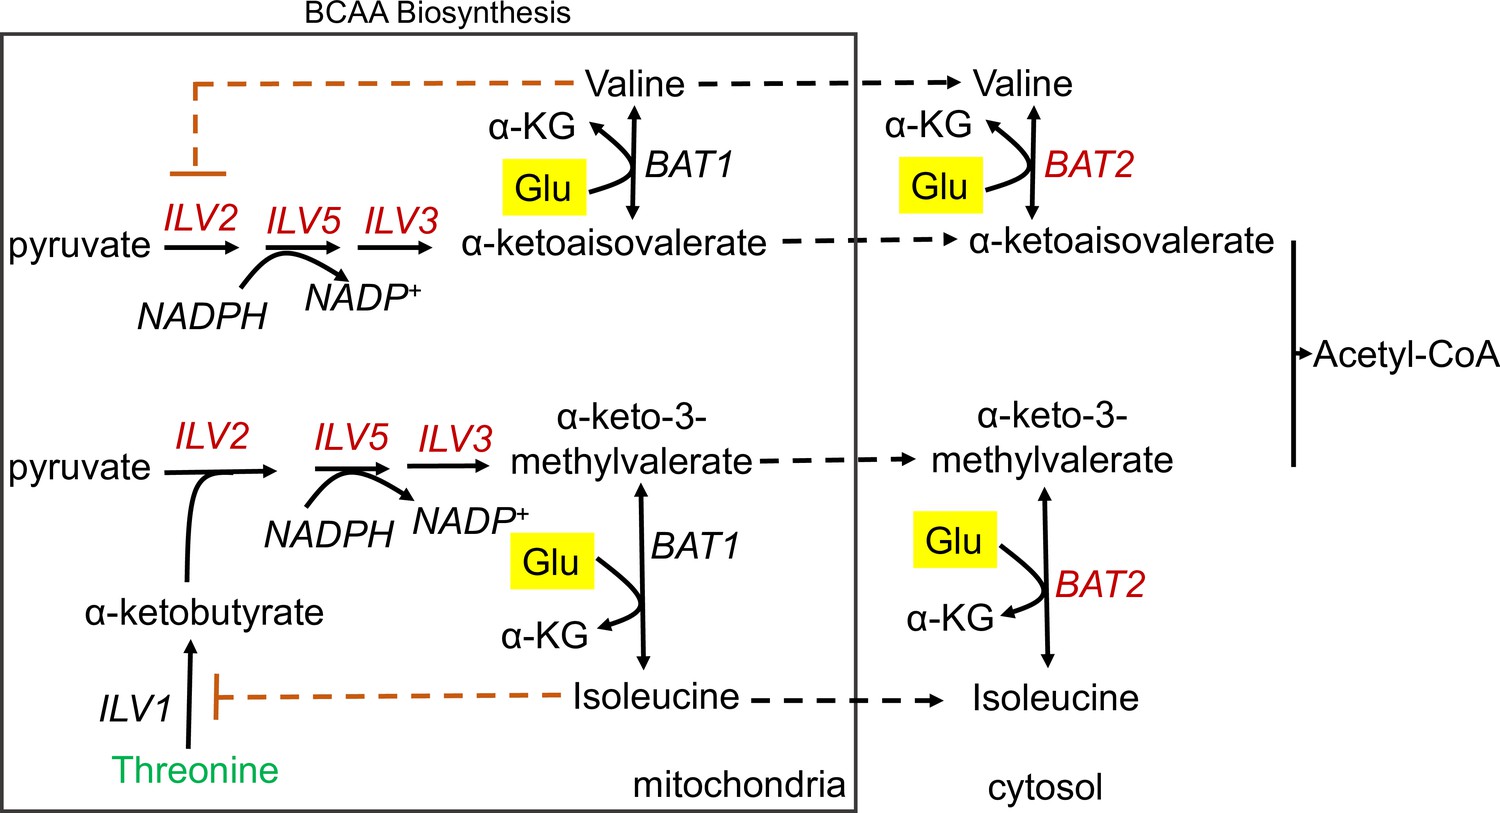
Genes from the branched chain amino acid (BCAA) metabolic pathway are negatively associated with replicative lifespan (RLS).
Genes involved in BCAA biosynthesis that are found to be negatively associated with RLS are colored in red. Threonine (positively associated with RLS) catabolism, is shown in green, and contributes to the BCAA biosynthesis. Glutamate is highlighted in yellow.
Figure 6—figure supplement 4
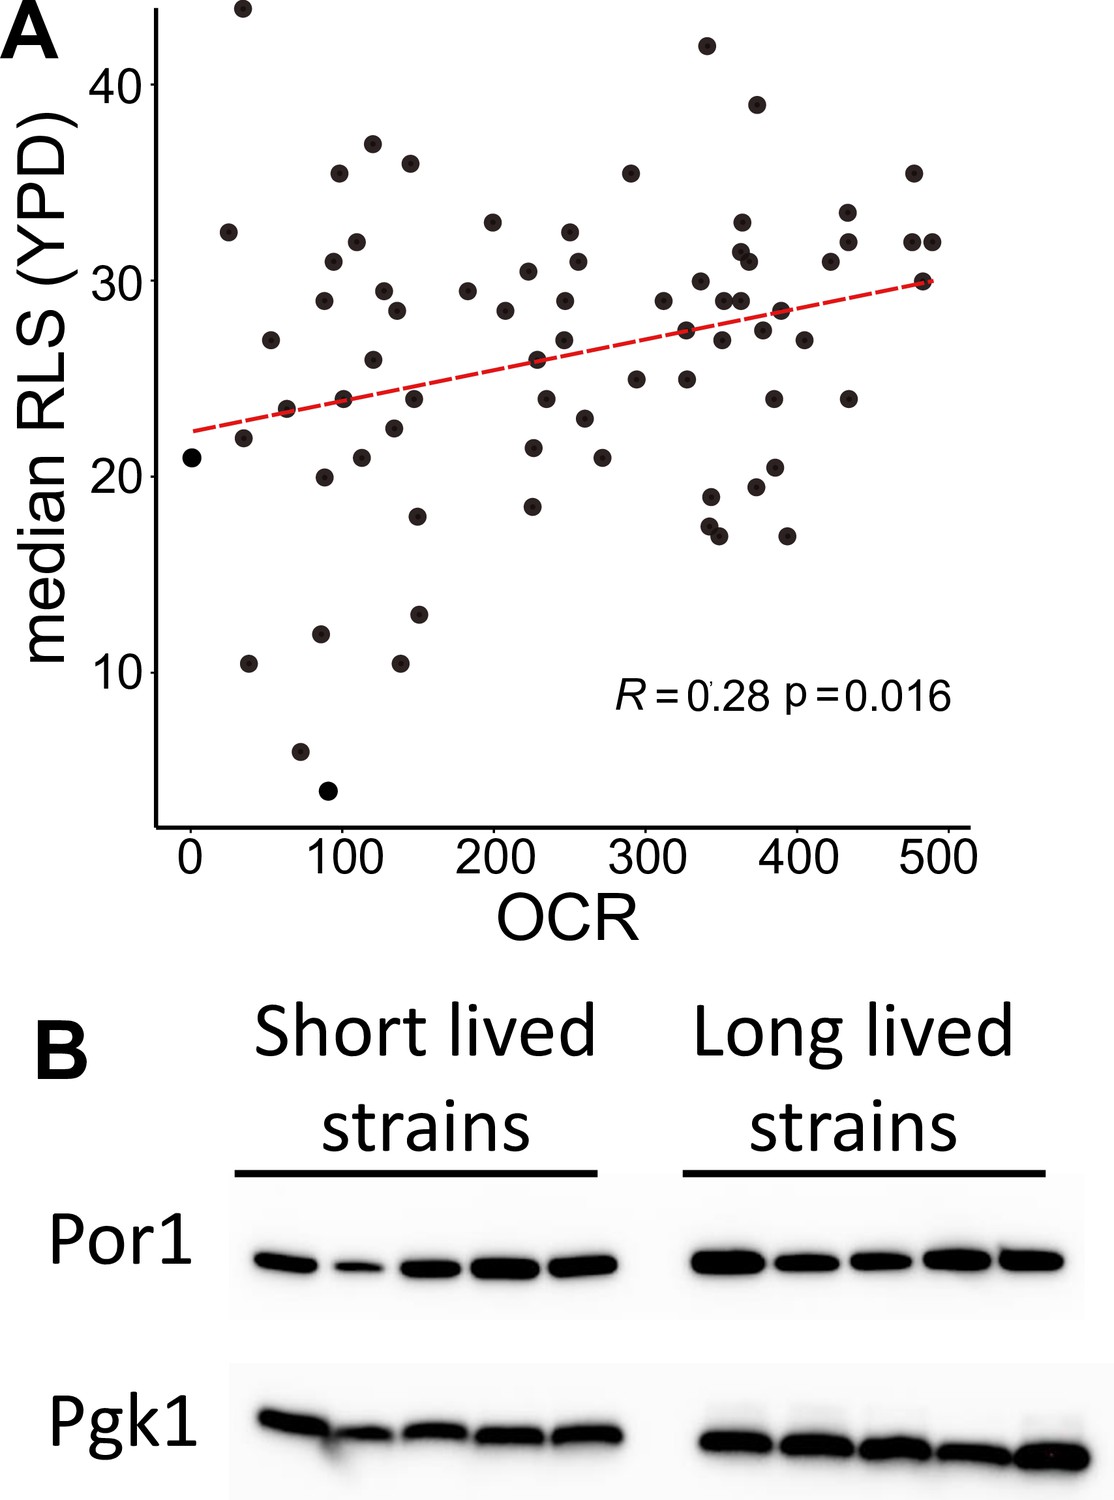
Association of mitochondrial respiration with median replicative lifespan (RLS).
(A) Spearman correlation between median RLS and oxygen consumption rate (OCR; pmol/min). (B) Western blot analysis for mitochondrial protein abundance across the strain. Similar expression of mitochondrial porin Por1 (voltage-dependent anion channel) was verified with western blotting. Pgk1 is used as internal loading control. Raw images are also provided as source file.
-
Figure 6—figure supplement 4—source data 1
Raw western Blot images are provided as source data.
- https://cdn.elifesciences.org/articles/64860/elife-64860-fig6-figsupp4-data1-v2.zip
Figure 7
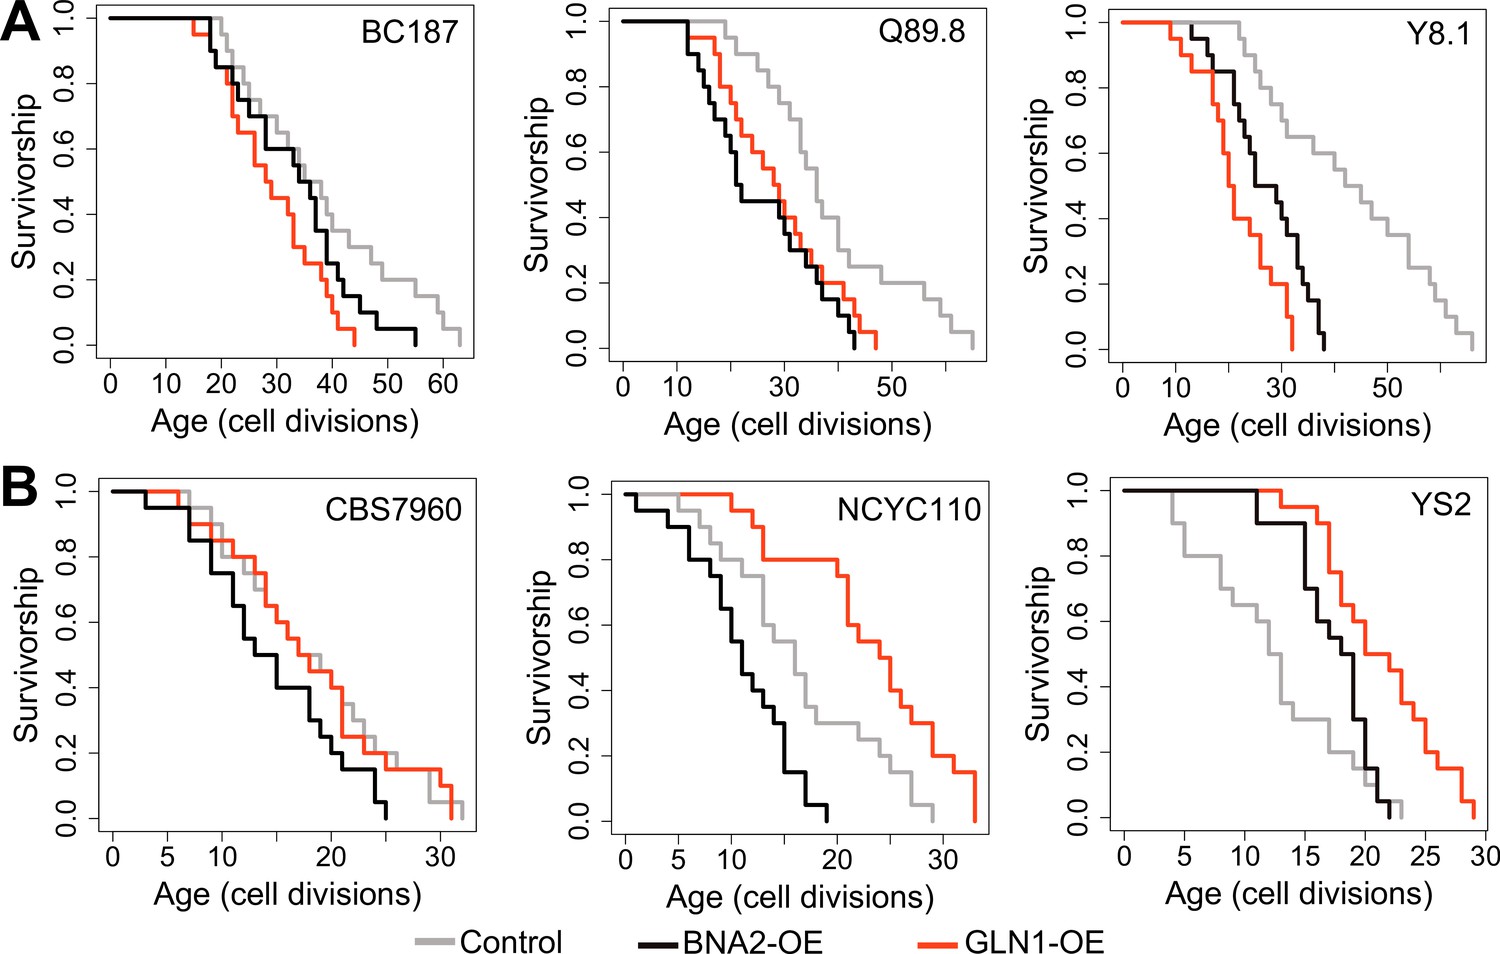
Replicative lifespan (RLS) effect of GLN1 and BNA2 overexpression in selected long- and short-lived strains.
Lifespan curves for control (gray), BNA2 (black), and GLN1 (red) overexpression in (A) long- and (B) short-lived strains. Lifespan data and significance of lifespan changes can be found in Supplementary file 1.
Figure 8 with 1 supplement
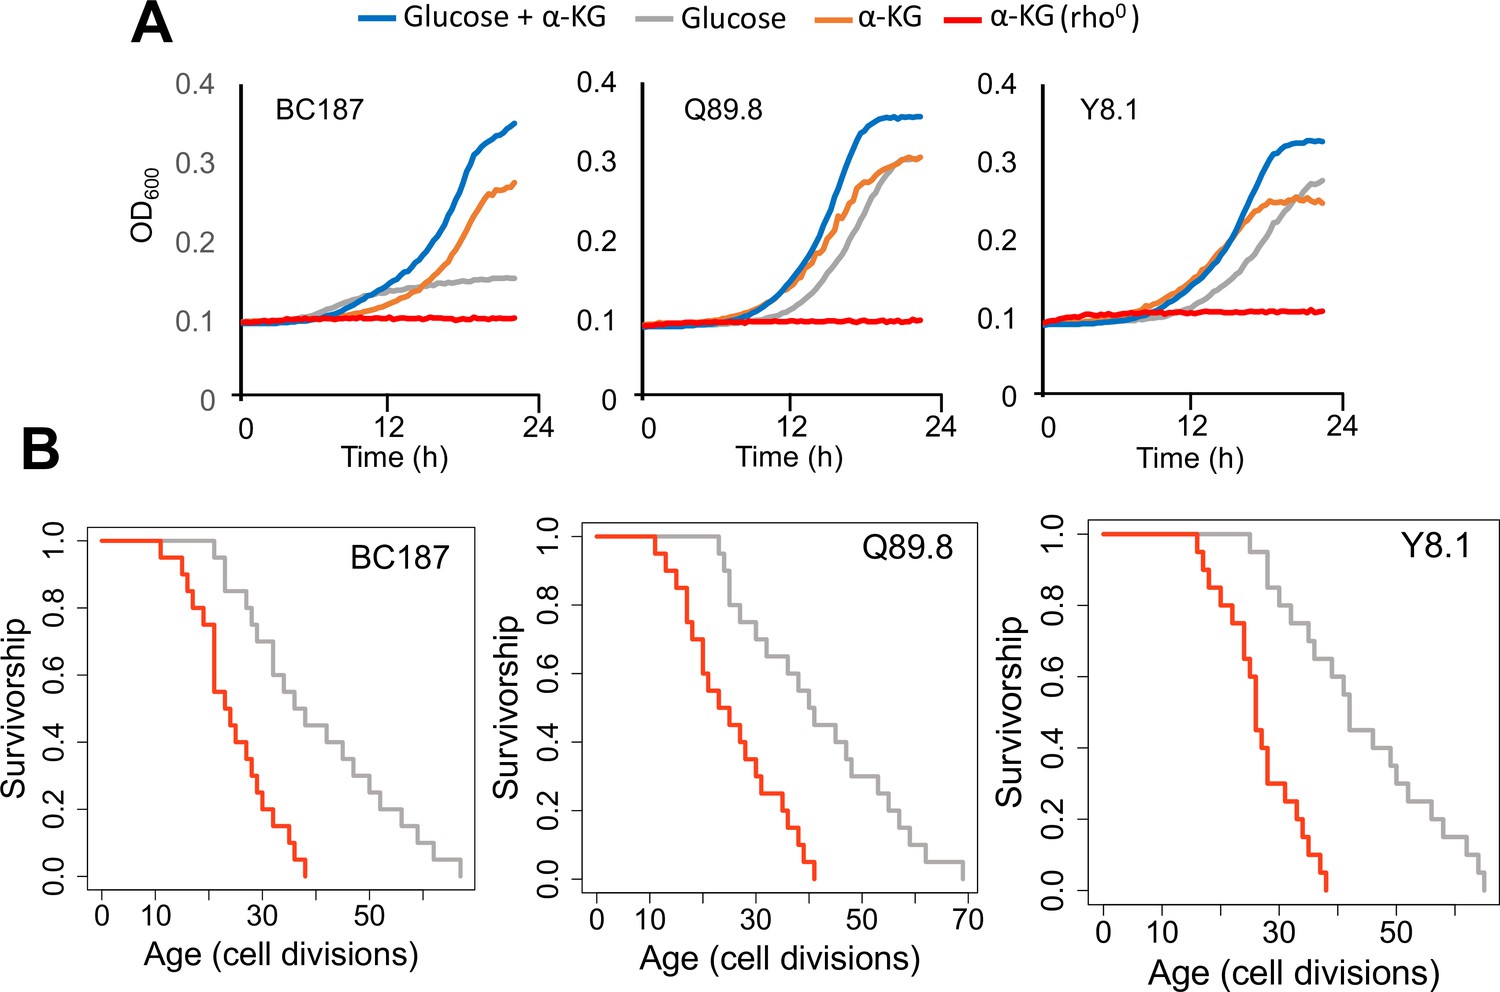
Growth properties of long-lived trains in medium supplemented with alpha-ketoglutarate (α-KG) and effect of mitochondrial DNA (mtDNA) elimination on α-KG utilization and replicative lifespan (RLS).
(A) The growth of three long-lived strain was further supported with α-KG supplementation (10 g/l). However, strains lost the ability of α-KG utilization upon mtDNA elimination (red). Growth data of OD600 measurement can be found in Supplementary file 1. (B) Elimination of mtDNA significant reduced RLS in all three long-lived strains. Lifespan data and significance of lifespan changes can be found in Supplementary file 1.
Figure 8—figure supplement 1
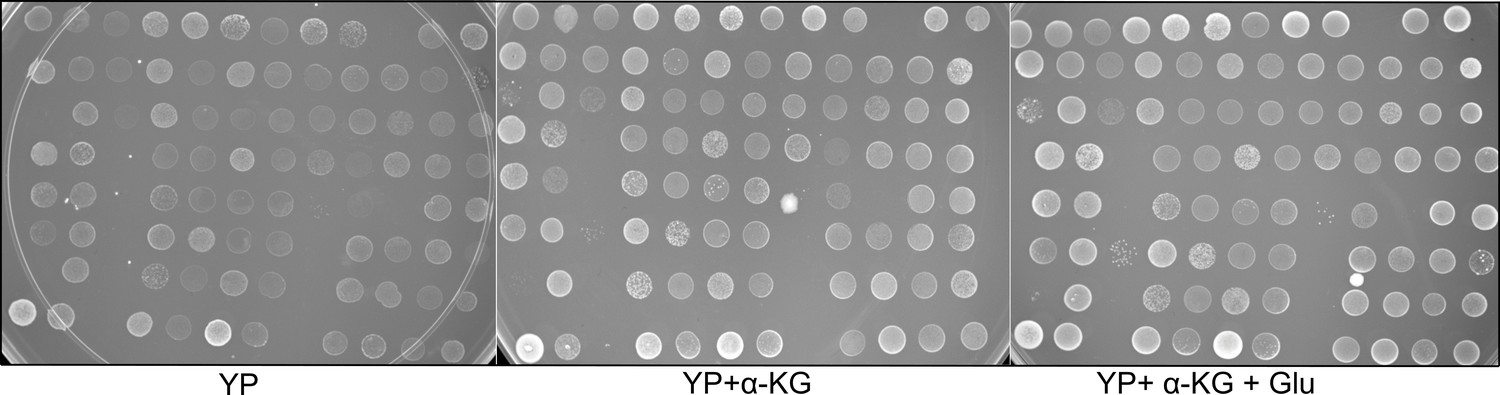
Effect of alpha-ketoglutarate (α-KG) on growth.
Spot assay for wild isolates on medium containing YP (yeast extract and peptone), YP supplemented with α-KG (10 g/l), and YP supplemented with both α-KG (10 g/l) and glucose (0.02%). Each spot represents one of the strain. Plates were incubated at 30 °C and pictured after 3 days.
Additional files
-
Supplementary file 1
Strain list, used in this study and their replicative lifespan along with doubling time are listed.
This file also includes replicative lifespan of the laboratory KO strains, analyzed in this study.
- https://cdn.elifesciences.org/articles/64860/elife-64860-supp1-v2.xlsx
-
Supplementary file 2
File includes raw and normalized counts from RNA-seq.
Normalized metabolite count is also included. Results from phylogenetic generalized least square (PGLS) analysis from both datasets along with statistical values are listed for natural isolates. Similarly, genes associated with RLS (mean, median, and maximum) of KO strains along with statistical values are also listed. This file also includes result GSE enrichment terms with statistical values for natural isolates and KO strains.
- https://cdn.elifesciences.org/articles/64860/elife-64860-supp2-v2.xlsx
-
Supplementary file 3
PCA loadings for normalized RNA-seq and metabolomics datasets.
- https://cdn.elifesciences.org/articles/64860/elife-64860-supp3-v2.xlsx
-
Supplementary file 4
List of yeast longevity genes from GenAge database.
Identified set of CR-related genes from our analysis is also listed.
- https://cdn.elifesciences.org/articles/64860/elife-64860-supp4-v2.xlsx
-
Supplementary file 5
Values for oxygen consumption rate (OCR) measurement across the strains.
- https://cdn.elifesciences.org/articles/64860/elife-64860-supp5-v2.xlsx
-
Transparent reporting form
- https://cdn.elifesciences.org/articles/64860/elife-64860-transrepform1-v2.docx
Download links
A two-part list of links to download the article, or parts of the article, in various formats.
Downloads (link to download the article as PDF)
Open citations (links to open the citations from this article in various online reference manager services)
Cite this article (links to download the citations from this article in formats compatible with various reference manager tools)
Evolution of natural lifespan variation and molecular strategies of extended lifespan in yeast
eLife 10:e64860.
https://doi.org/10.7554/eLife.64860


