7,8-Dihydroxyflavone modulates bone formation and resorption and ameliorates ovariectomy-induced osteoporosis
- Department of Food Science and Nutrition, College of Biosystems Engineering and Food Science, Zhejiang Key Laboratory for Agro-Food Processing; Zhejiang Engineering Center for Food Technology and Equipment, Zhejiang University, China
- Department of Pathology and Laboratory Medicine, Emory University School of Medicine, United States
Figures
Figure 1 with 1 supplement
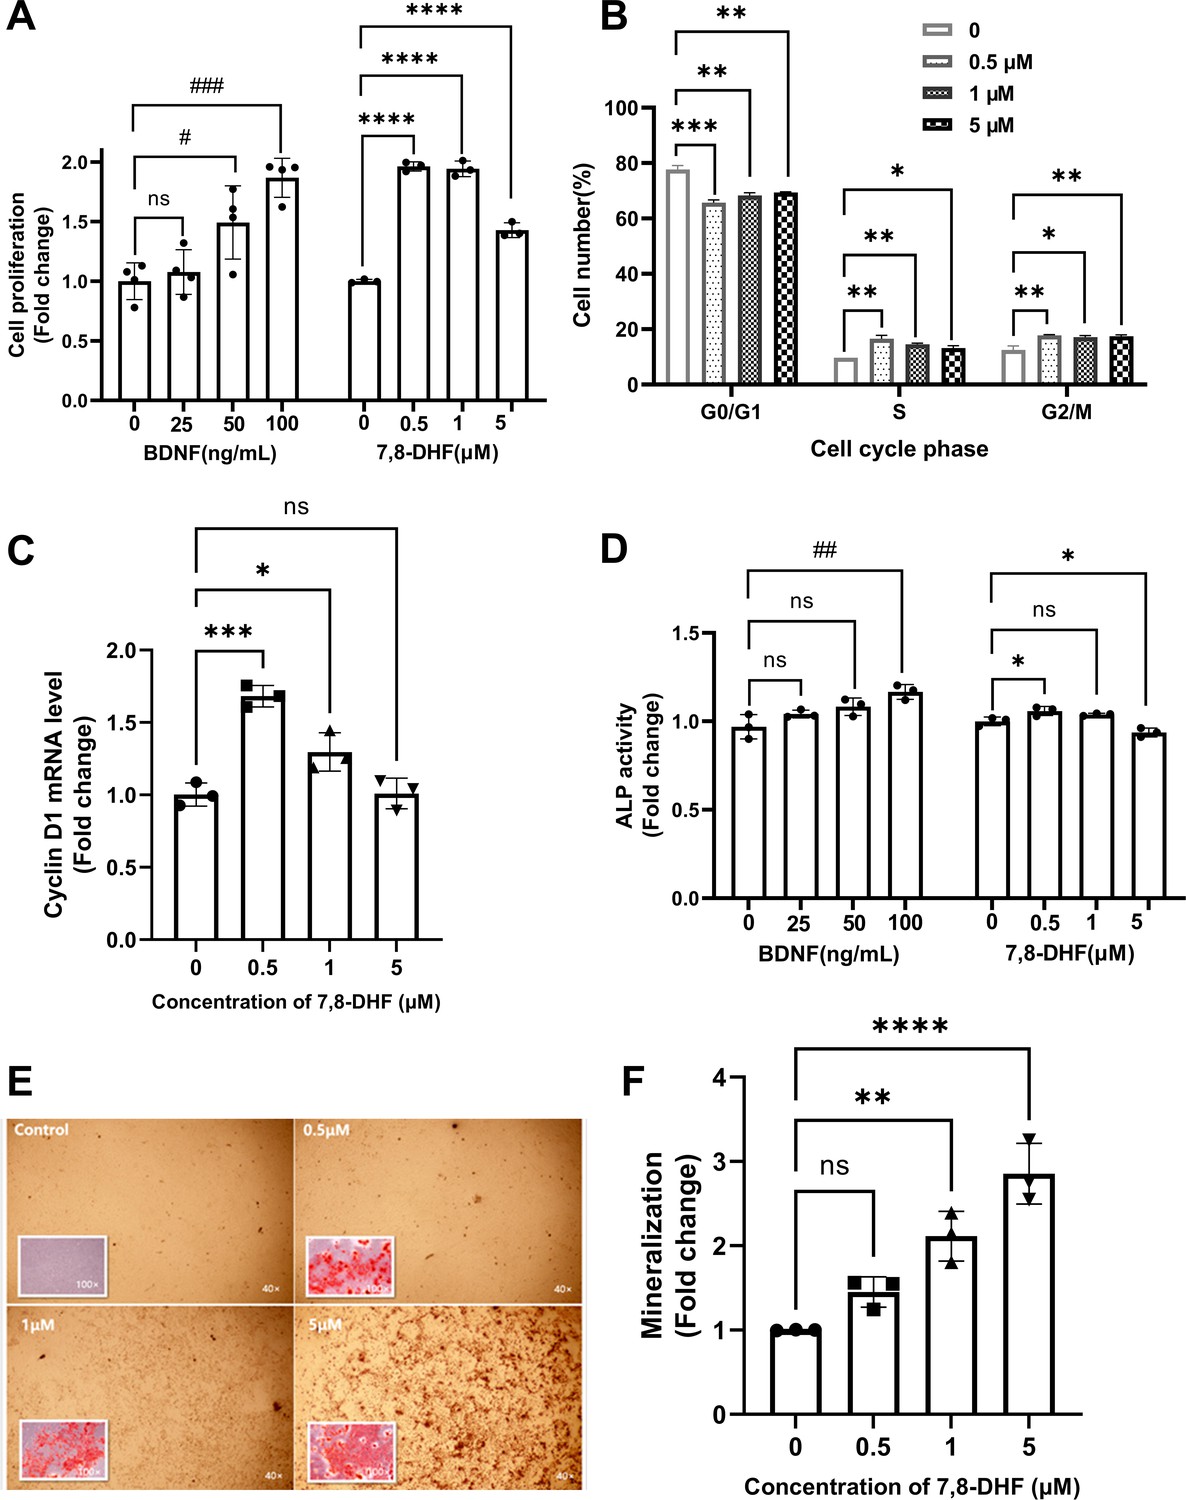
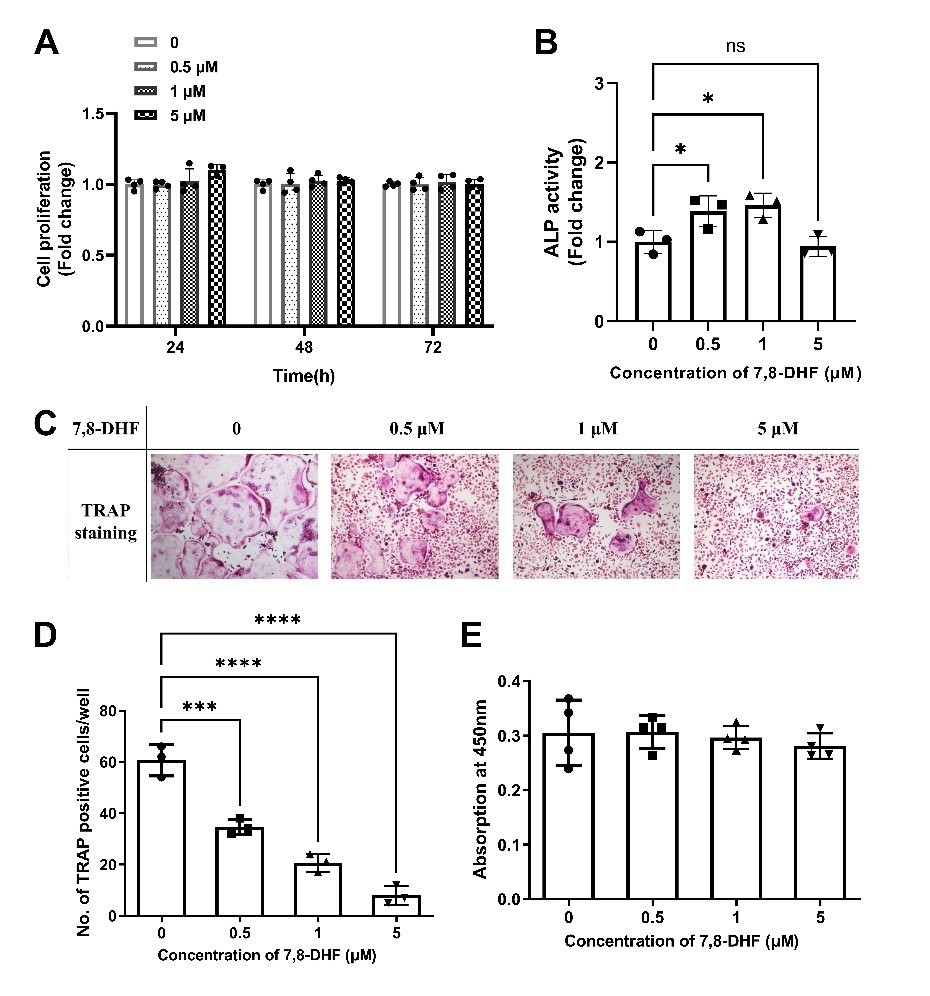
7,8-Dihydroxyflavone (7,8-DHF) promoted proliferation and differentiation of MC3T3-E1 osteoprogenitor cells.
(A) The effect of brain-derived neurotrophic factor (BDNF) or 7,8-DHF on the proliferation of MC3T3-E1 cells after treatment for 48 hr. (B) The percentage of MC3T3-E1 cells in each cell cycle phase treated with 7,8-DHF for 24 hr. Source file of gate parameters and regions chosen in the Modfit LT software for flow cytometry modeling was available in Figure 1—source data 1. (C) The effect of 7,8-DHF on the mRNA expression level of cyclin D1 was detected by quantitative real-time PCR (qRT-PCR). Results were normalized to the reference gene GAPDH. (D) The effect of BDNF or 7,8-DHF on the alkaline phosphatase (ALP) activity of MC3T3-E1 cells. Results were normalized with total protein quantity. Alizarin red S staining (magnification: 40× or 100×) (E) and quantitative analysis of the extent of mineralization (F) of MC3T3-E1 cells cultured with 7,8-DHF for 21 days. Source files of the full raw unedited micrographs were available in Figure 1—source data 2. All results were expressed as mean ± SD. (A-F: n = 3–4; #p < 0.05, ##p < 0.01, ###p < 0.001, ns: not significant, BDNF-treated groups, one-way analysis of variance [ANOVA]; *p < 0.05, **p < 0.01, ***p < 0.001, ****p < 0.0001, ns: not significant, 7,8-DHF-treated groups, one-way ANOVA).
-
Figure 1—source data 1
Gate parameters and regions chosen in the Modfit LT software for flow cytometry modeling.
- https://cdn.elifesciences.org/articles/64872/elife-64872-fig1-data1-v2.pdf
-
Figure 1—source data 2
The original files of the full raw unedited micrographs used in Figure 1E.
The folder named ‘40×’ contains the images at a magnification of 40. The folder named ‘100×’ contains the images at a magnification of 100.
- https://cdn.elifesciences.org/articles/64872/elife-64872-fig1-data2-v2.zip
Figure 1—figure supplement 1
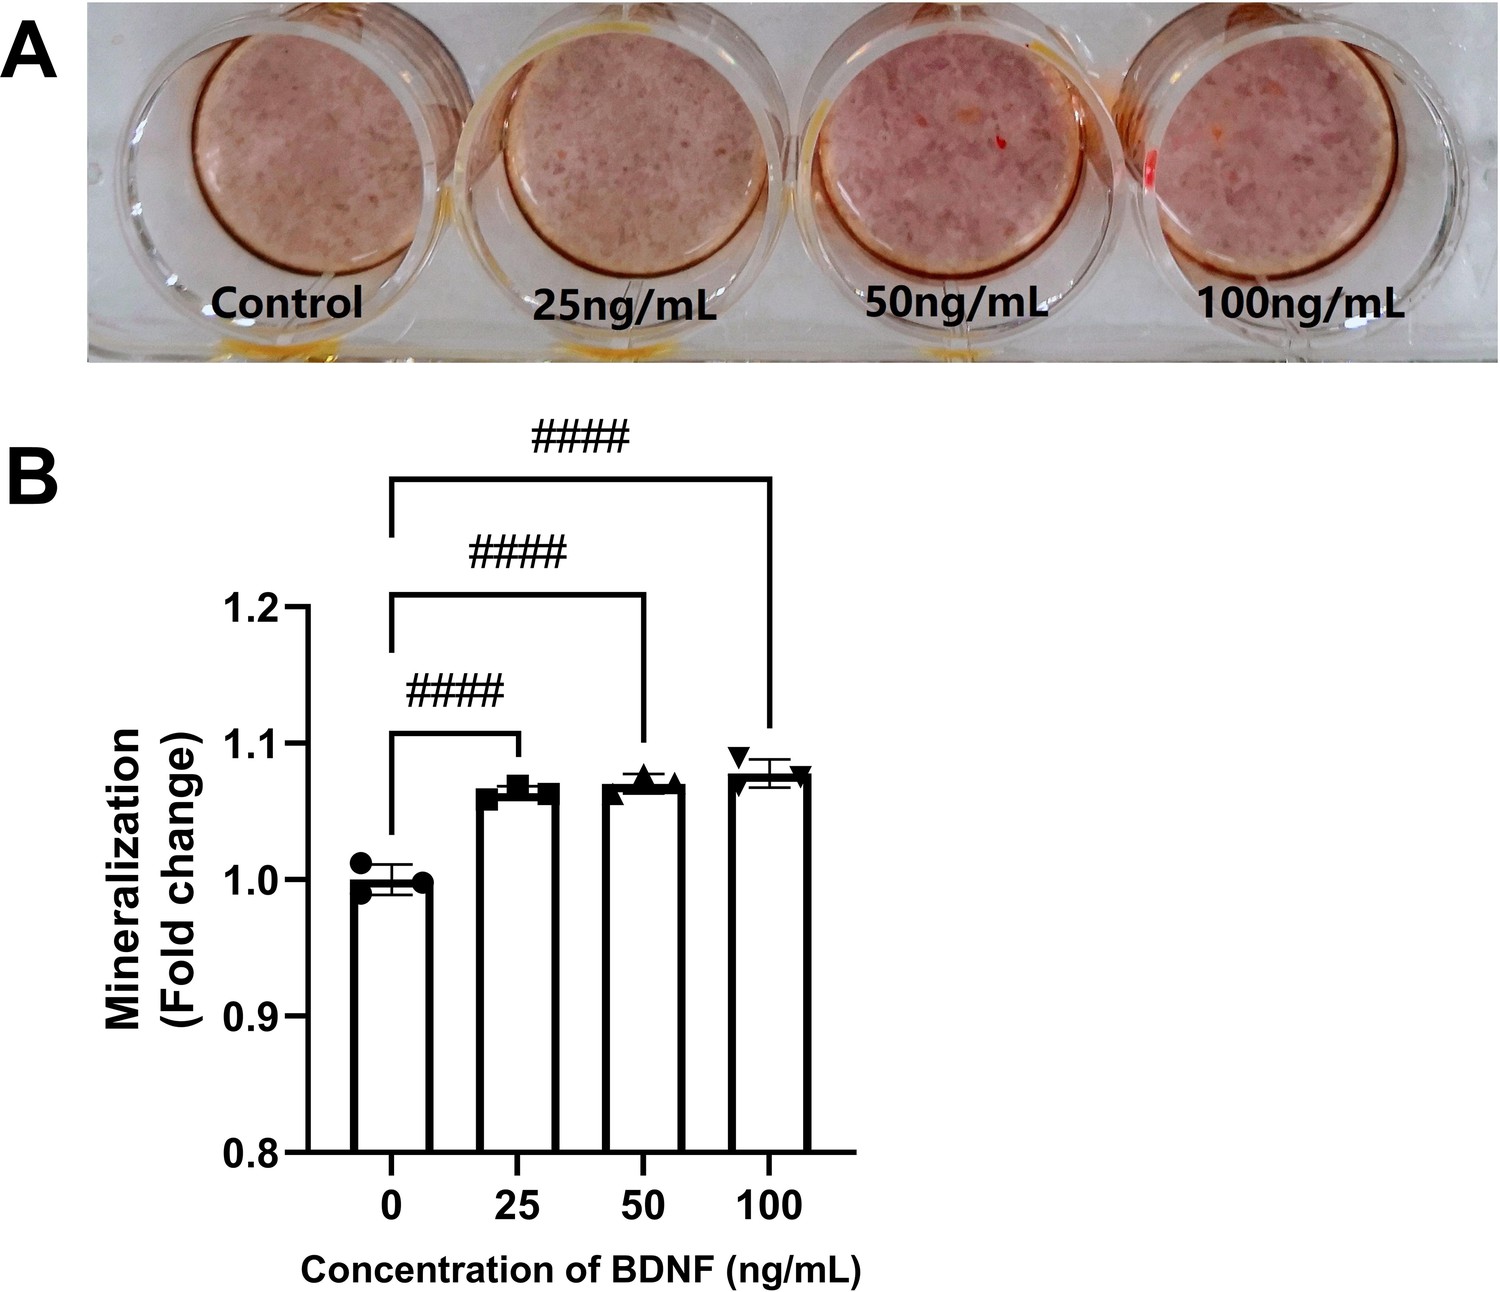
Brain-derived neurotrophic factor (BDNF) promoted mineralization of MC3T3-E1 osteoprogenitor cells.
Alizarin red S staining (A) and quantitative analysis of the extent of mineralization (B) of MC3T3-E1 cells cultured with BDNF for 21 days. All results were expressed as mean ± SD (A, B: n = 3; ####p < 0.0001, one-way analysis of variance [ANOVA]).
Figure 2 with 2 supplements
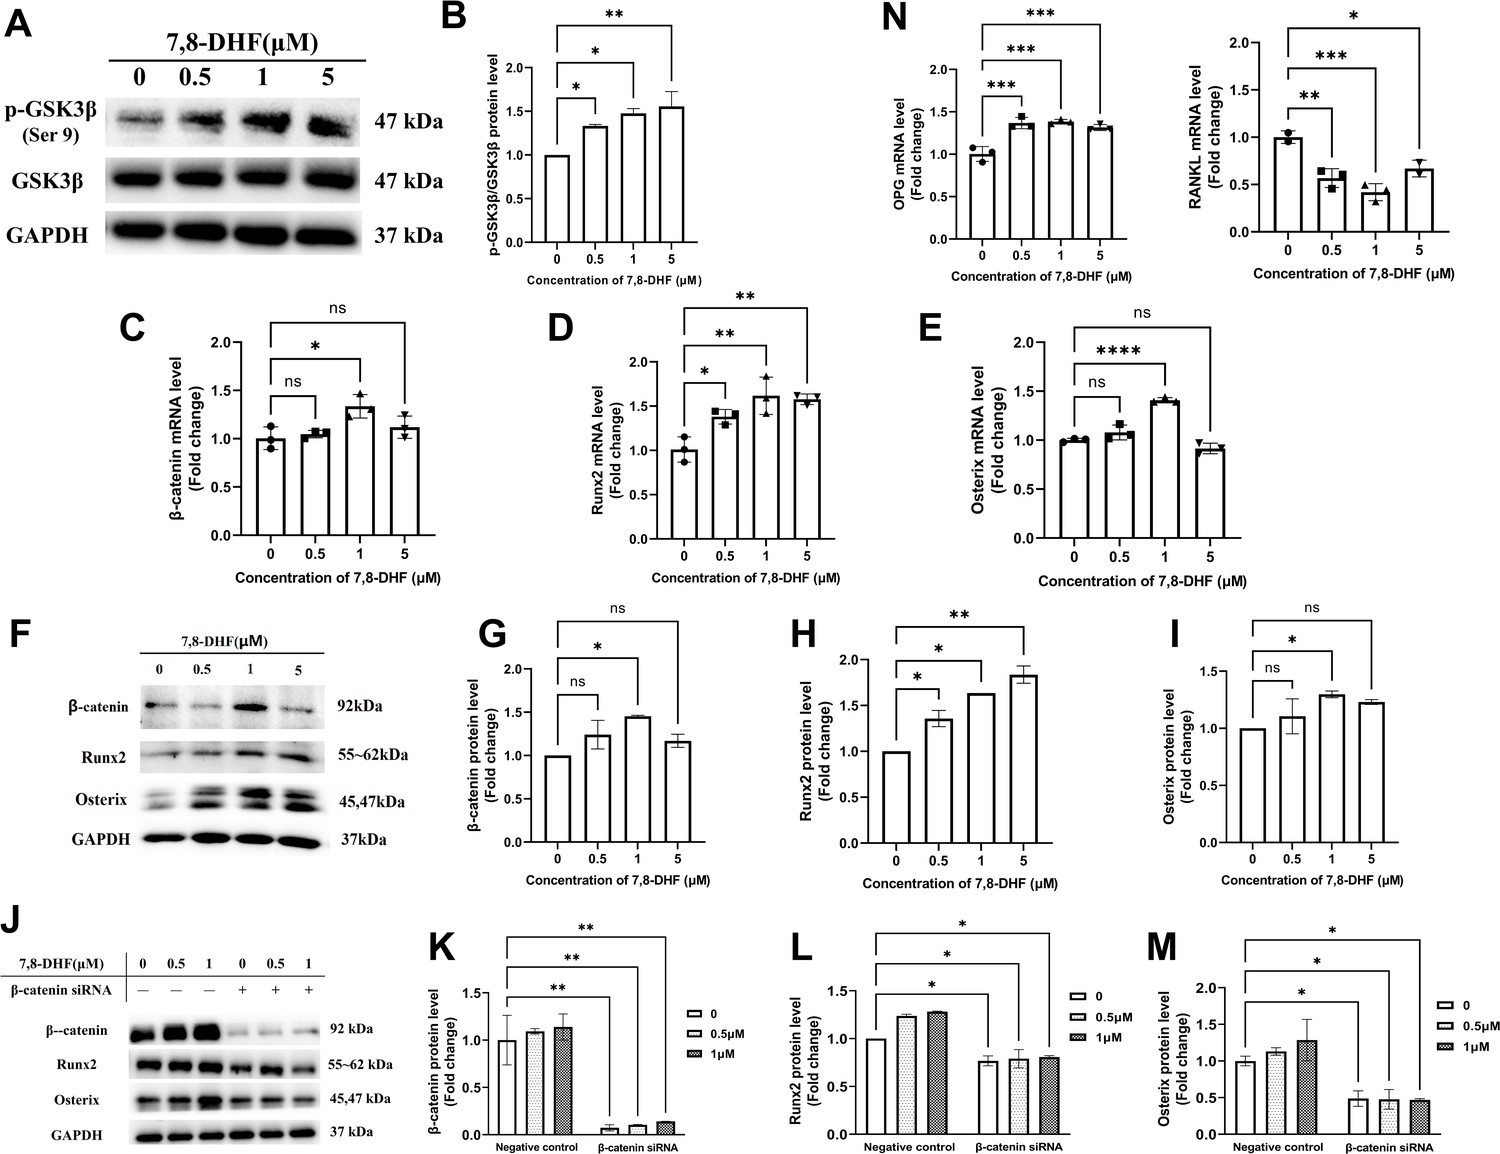
7,8-Dihydroxyflavone (7,8-DHF) promoted osteogenesis via osteoblast-related signaling pathways.
MC3T3-E1 cells were treated with or without 7,8-DHF for 3 days. The mRNA level was evaluated by quantitative real-time PCR (qRT-PCR) and the protein level was detected by western blot. GAPDH was used as an internal control. (A) The protein levels of p-GSK3β and GSK3β. (B) Quantification of the p-GSK3β band intensities normalized to total GSK3β band intensities in each case. (C-E) The mRNA levels of β-catenin, Runx2, and Osterix. (F-I) The protein levels of β-catenin, Runx2, and Osterix. The expression levels of target proteins in the 0 μM group were normalized to 1. (J-K) β-Catenin knockdown by siRNA was performed in MC3T3-E1 cells with or without 7,8-DHF treatment. The protein levels of β-catenin, Runx2, and Osterix. The expression levels of target proteins in the 0 μM of negative control group were normalized to 1. Representative images from three independent experiments are shown in (A, F, J). Source files of the full raw unedited blots and blots with the relevant bands labeled were provided in Figure 2—source data 1. (N) The mRNA levels of osteoprotegerin (OPG) and receptor activator of nuclear factor-κB ligand (RANKL). All results were expressed as mean ± SD (A-N: n = 3; *p < 0.05, **p < 0.01, ***p < 0.001, ****p < 0.0001, ns: not significant; A-I, N: one-way analysis of variance [ANOVA]; J-M: two-way ANOVA).
-
Figure 2—source data 1
The original files of the full raw unedited blots and blots with the relevant bands labeled in Figure 2A, F and J.
- https://cdn.elifesciences.org/articles/64872/elife-64872-fig2-data1-v2.zip
Figure 2—figure supplement 1
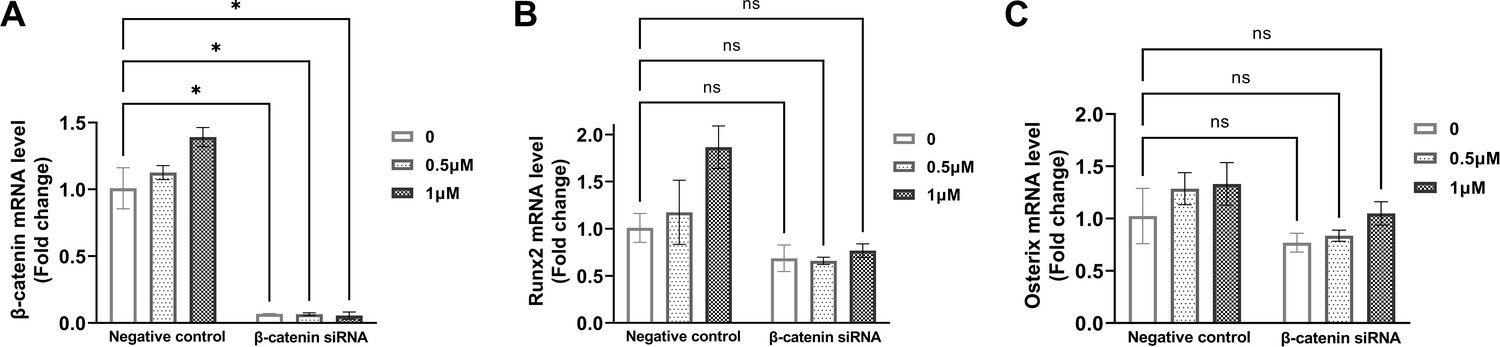
β-Catenin knockdown by siRNA was performed in MC3T3-E1 cells with or without 7,8-dihydroxyflavone (7,8-DHF) treatment.
The mRNA levels of β-catenin (A), Runx2 (B), and Osterix were evaluated by quantitative real-time PCR (qRT-PCR) and GAPDH was used as an internal control. All results were expressed as mean ± SD (A-C: n = 3; *p < 0.05, ns: not significant; two-way analysis of variance [ANOVA]).
Figure 2—figure supplement 2
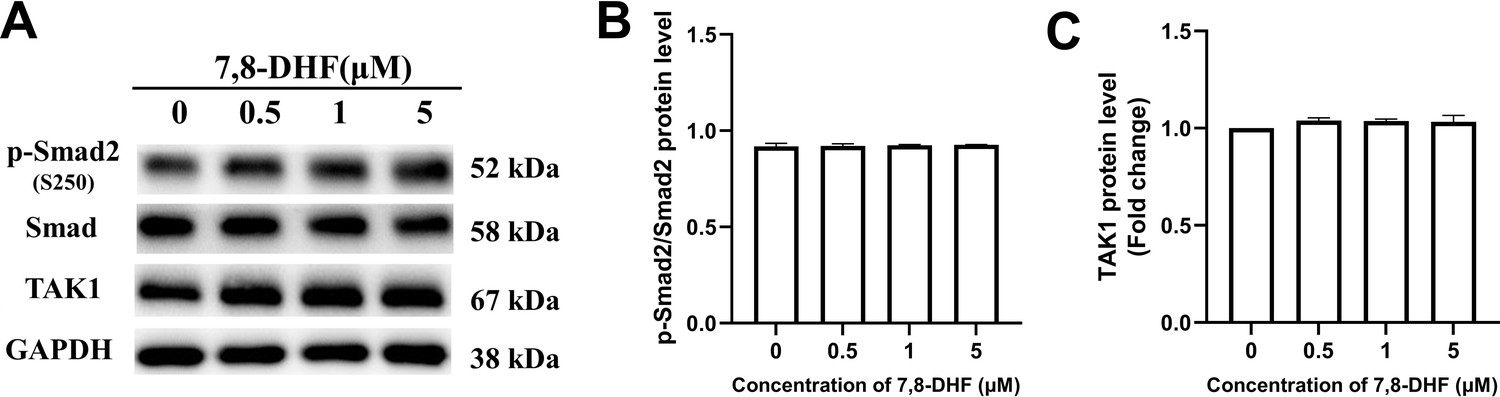
7,8-Dihydroxyflavone (7,8-DHF) had no obvious influence on Smad2 and TAK1.
The protein level was detected by western blot and GAPDH was used as an internal control. (A) Representative images from three independent experiments were shown. (B) Quantification of the p-Smad2 band intensities normalized to total Smad2 band intensities in each case. (C) The protein levels of TAK1. All results were expressed as mean ± SD (A-C: n = 3; one-way analysis of variance [ANOVA]). Source files of the full raw unedited blots and blots with the relevant bands labeled were provided in Figure 2—figure supplement 2—source data 1.
-
Figure 2—figure supplement 2—source data 1
The original files of the full raw unedited blots and blots with the relevant bands labeled in Figure 2—figure supplement 2A.
The individual file name containing ‘(labeled)’ is blot with the relevant bands labeled by a red outline.
- https://cdn.elifesciences.org/articles/64872/elife-64872-fig2-figsupp2-data1-v2.zip
Figure 3
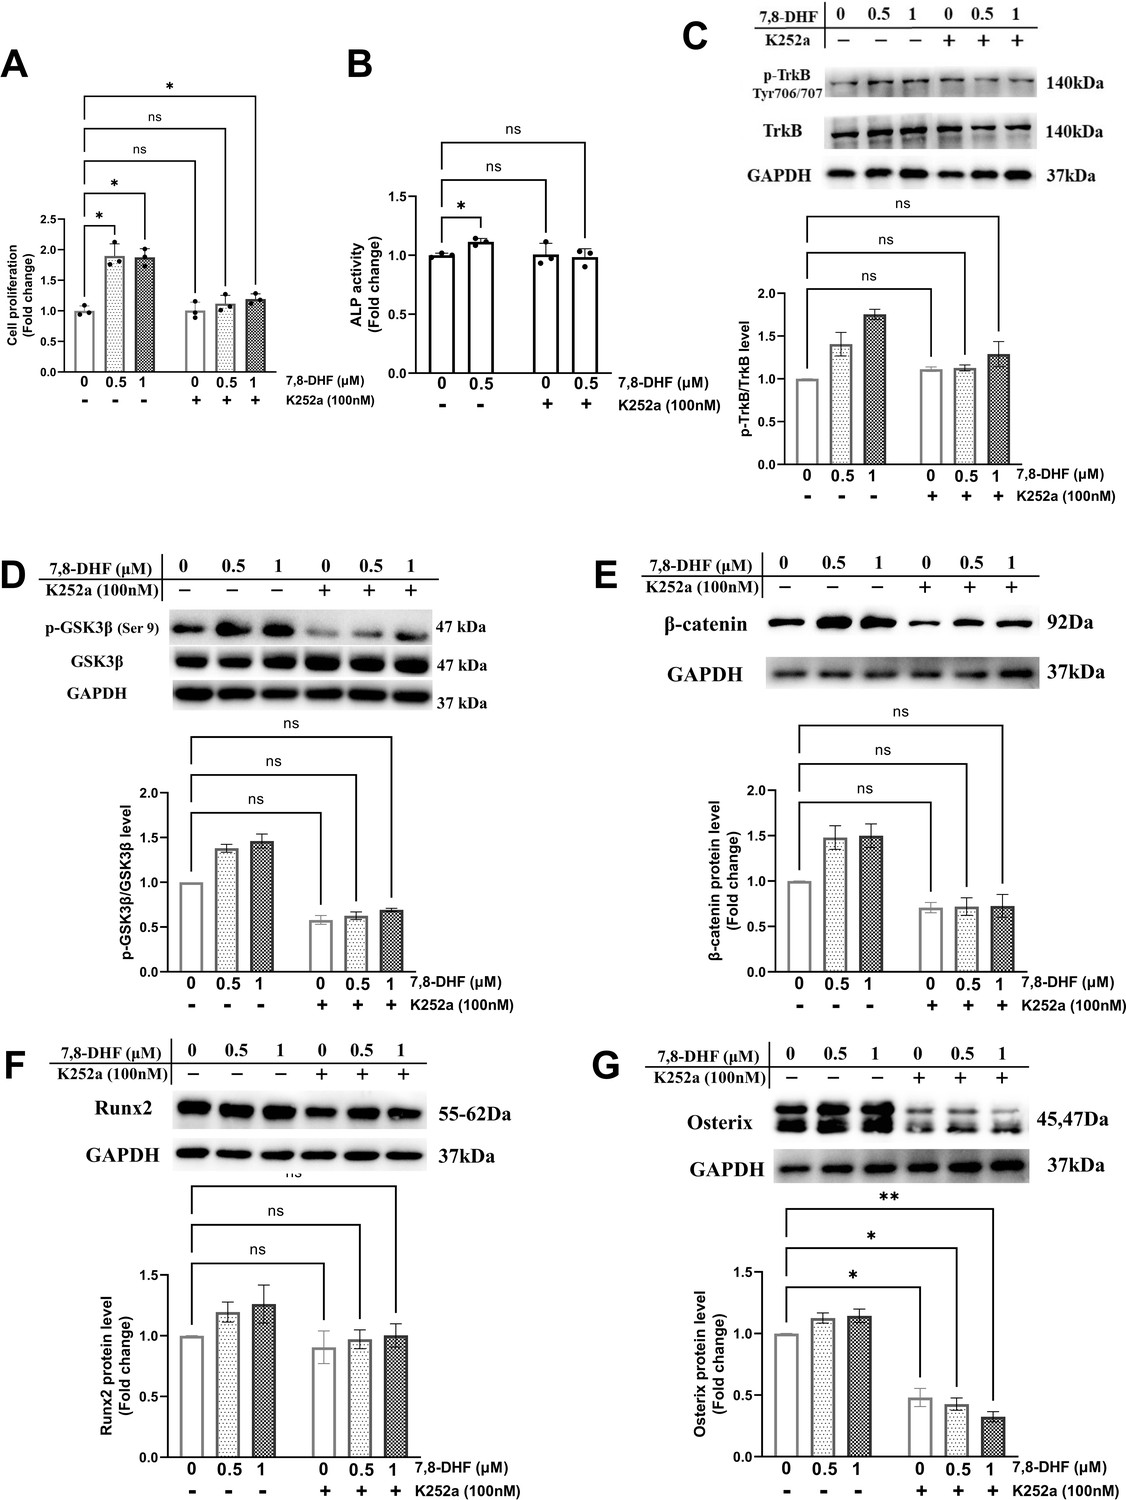
Chemical inhibition of TrkB blocked 7,8-dihydroxyflavone (7,8-DHF)-mediated osteogenesis.
MC3T3-E1 cells were incubated with or without K252a (100 nM) for 1 hr followed by 7,8-DHF (0.5 μM or 1 μM). (A) K252a suppressed 7,8-DHF-induced proliferation of MC3T3-E1 cells after treatment for 48 hr. (B) K252a suppressed 7,8-DHF-elevated alkaline phosphatase (ALP) activity of MC3T3-E1 cells. (C, D) K252a inhibited 7,8-DHF-induced TrkB phosphorylation in MC3T3-E1 cells. Representative images from three independent experiments are shown in (C). (E-G) K252a inhibited 7,8-DHF-induced activation of Wnt/β-catenin signaling pathway in MC3T3-E1 cells. Representative images from three independent experiments are shown. The expression levels of target proteins in the control group (0 μM 7,8-DHF, without K252a) were normalized to 1. Source files of the full raw unedited blots and blots with the relevant bands labeled were provided in Figure 3—source data 1. All results were expressed as mean ± SD (A-G: n = 3, *p < 0.05, **p < 0.01, ns: not significant, two-way analysis of variance [ANOVA]).
-
Figure 3—source data 1
The original files of the full raw unedited blots and blots with the relevant bands labeled in Figure 3C–G.
- https://cdn.elifesciences.org/articles/64872/elife-64872-fig3-data1-v2.zip
Figure 4

7,8-Dihydroxyflavone (7,8-DHF) inhibited receptor activator of nuclear factor-κB ligand (RANKL)-induced osteoclastogenesis.
(A) Representative images of tartrate-resistant acid phosphatase (TRAP)-positive multinucleated osteoclasts after the treatment with brain-derived neurotrophic factor (BDNF) or 7,8-DHF for 5 days (magnification: 100×, scale bar: 200 μm). Source files of micrographs used for the quantitative analysis are available in Figure 4—source data 1. (B) The average number of TRAP-positive multinucleated (nuclei ≥ 3) cells per cell. (C) The effects of BDNF or 7,8-DHF on the cytoactive of RAW264.7 cells. (D) The mRNA level of c-fos. Results were normalized to the reference gene GAPDH. (E–G) The protein levels of matrix metalloprotein-9 (MMP-9) and Adamts5. GAPDH was used as an internal control. The expression levels of target proteins in the 0 μM group were normalized to 1. Representative images from three independent experiments are shown in (E). Source files of the full raw unedited blots and blots with the relevant bands labeled were provided in Figure 4—source data 2. All results were expressed as mean ± SD (B, D, F, G: n = 3, C: n=4; #p < 0.05, ##p < 0.01, ###p < 0.001, ####p < 0.0001, ns: not significant, BDNF-treated groups, one-way analysis of variance [ANOVA]; *p < 0.05, **p < 0.01, ***p < 0.001, ****p < 0.0001, ns: not significant, 7,8-DHF-treated groups, one-way ANOVA).
-
Figure 4—source data 1
Micrographs used for the quantitative analysis in tartrate-resistant acid phosphatase (TRAP) staining.
The folder named ‘7,8-DHF’ contains micrographs of cells with or without 7,8-DHF treatment (individual files are named by the concentration of 7,8-DHF). The folder named ‘BDNF’ contains micrographs of cells with or without BDNF treatment (individual files are named by the concentration of BDNF).
- https://cdn.elifesciences.org/articles/64872/elife-64872-fig4-data1-v2.zip
-
Figure 4—source data 2
The original files of the full raw unedited blots and blots with the relevant bands labeled in Figure 4E.
The individual file name containing ‘(labeled)’ is blot with the relevant bands labeled by a red outline.
- https://cdn.elifesciences.org/articles/64872/elife-64872-fig4-data2-v2.zip
Figure 5
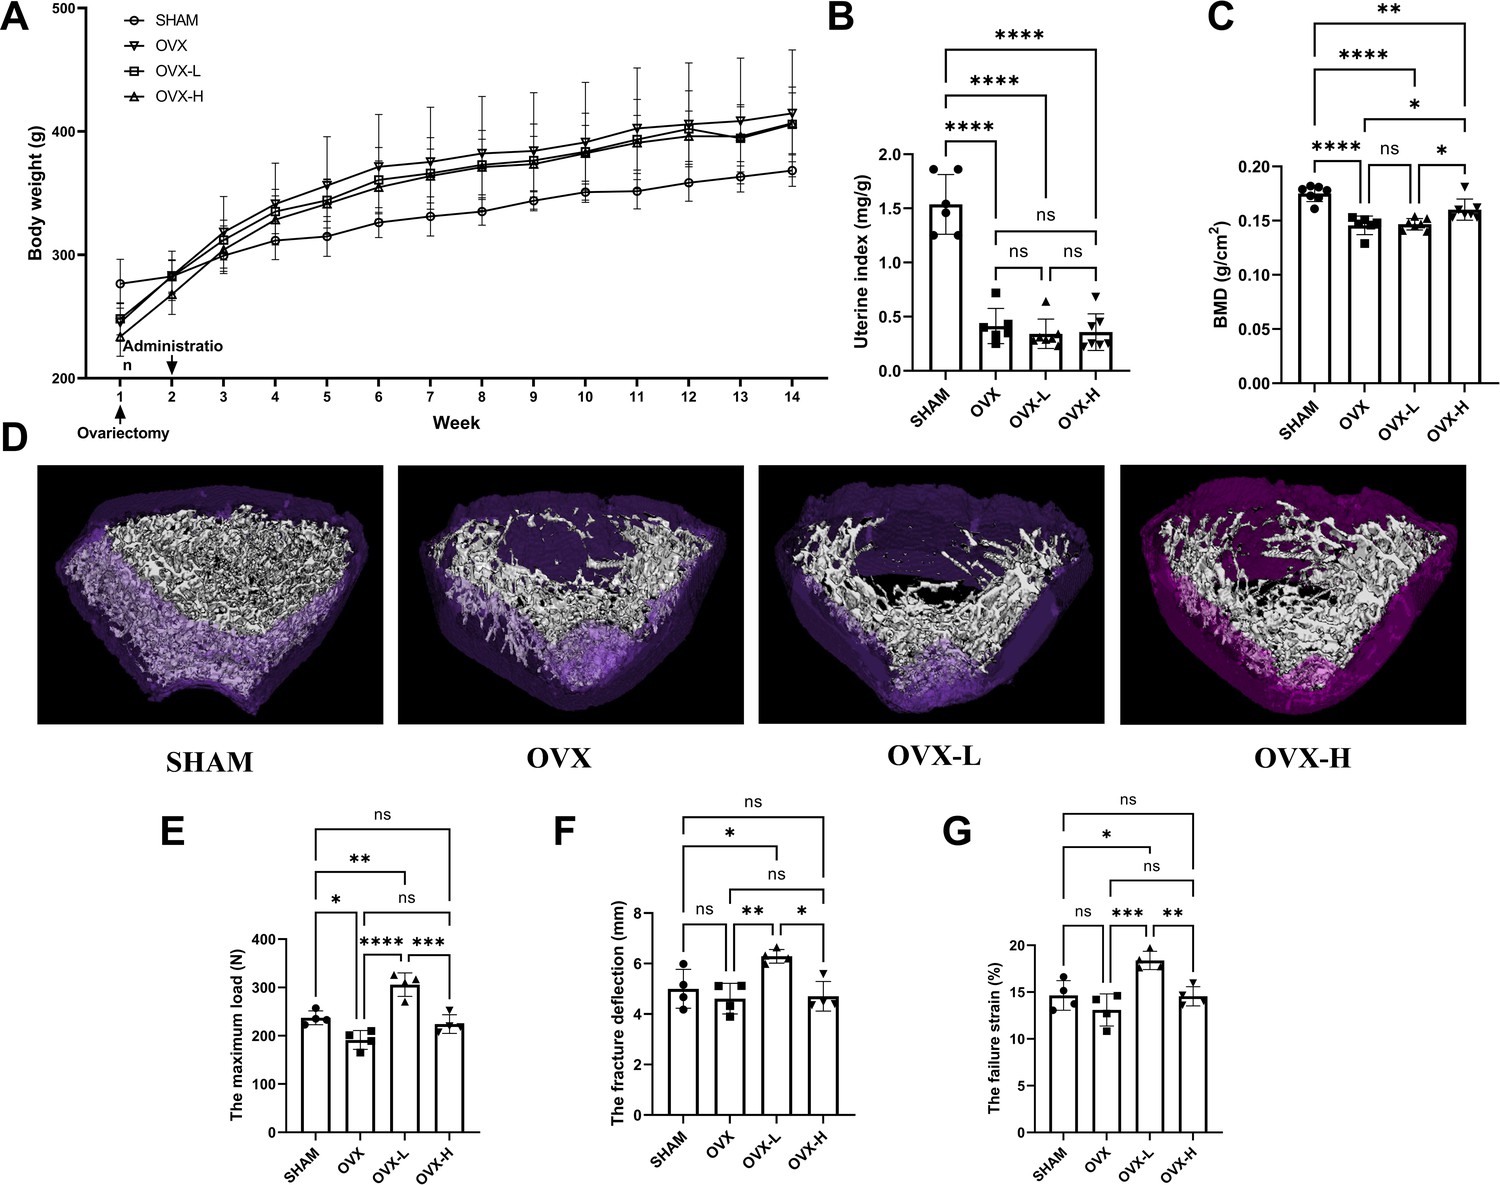
7,8-Dihydroxyflavone (7,8-DHF) alleviated osteoporosis phenotypes and enhanced mechanical properties in ovariectomy (OVX) rats.
(A) The body weights of all rats were recorded weekly during the experimental period. Source file of the weight record was available in Figure 5—source data 1. (B) Uteruses were isolated and weighed after euthanized. The uterine index was represented as uterus weight divided by body weight. Results were expressed as mean ± SD. (C) The bone mineral density (BMD) in left femur of rats by dual-energy X-ray absorptiometry (DXA). Results were expressed as mean ± SD (A-C: n = 6–7, *p < 0.05, **p < 0.01, ****p < 0.0001, ns: not significant, one-way analysis of variance [ANOVA]). (D) Representative micro-CT images from each group: three-dimensional (3D) architecture of trabecular bone within the distal metaphyseal femur region. Source files of the raw unedited images of proximal growth plate, trabecular structure, and cortical structure were available in Figure 5—source data 2. (E–G) Right femurs were isolated and subjected to a compression test for biomechanical property analysis. The maximum load (E), the fracture deflection (F) and the fracture strain (G) were evaluated for each group. Results were expressed as mean ± SD. All results were expressed as mean ± SD (n = 4, *p < 0.05, **p < 0.01, ***p < 0.001, ****p < 0.0001, ns: not significant, one-way ANOVA).
-
Figure 5—source data 1
Weight record of the experimental rat in each group.
The body weight of the rats was recorded weekly during the experimental period.
- https://cdn.elifesciences.org/articles/64872/elife-64872-fig5-data1-v2.xlsx
-
Figure 5—source data 2
Images of proximal growth plate, trabecular structure, and cortical structure.
The folders named ‘SHAM’, ‘OVX’, ‘OVX-L’, and ‘OVX-H’ contain the original images in Figure 5D.
- https://cdn.elifesciences.org/articles/64872/elife-64872-fig5-data2-v2.zip
Figure 6
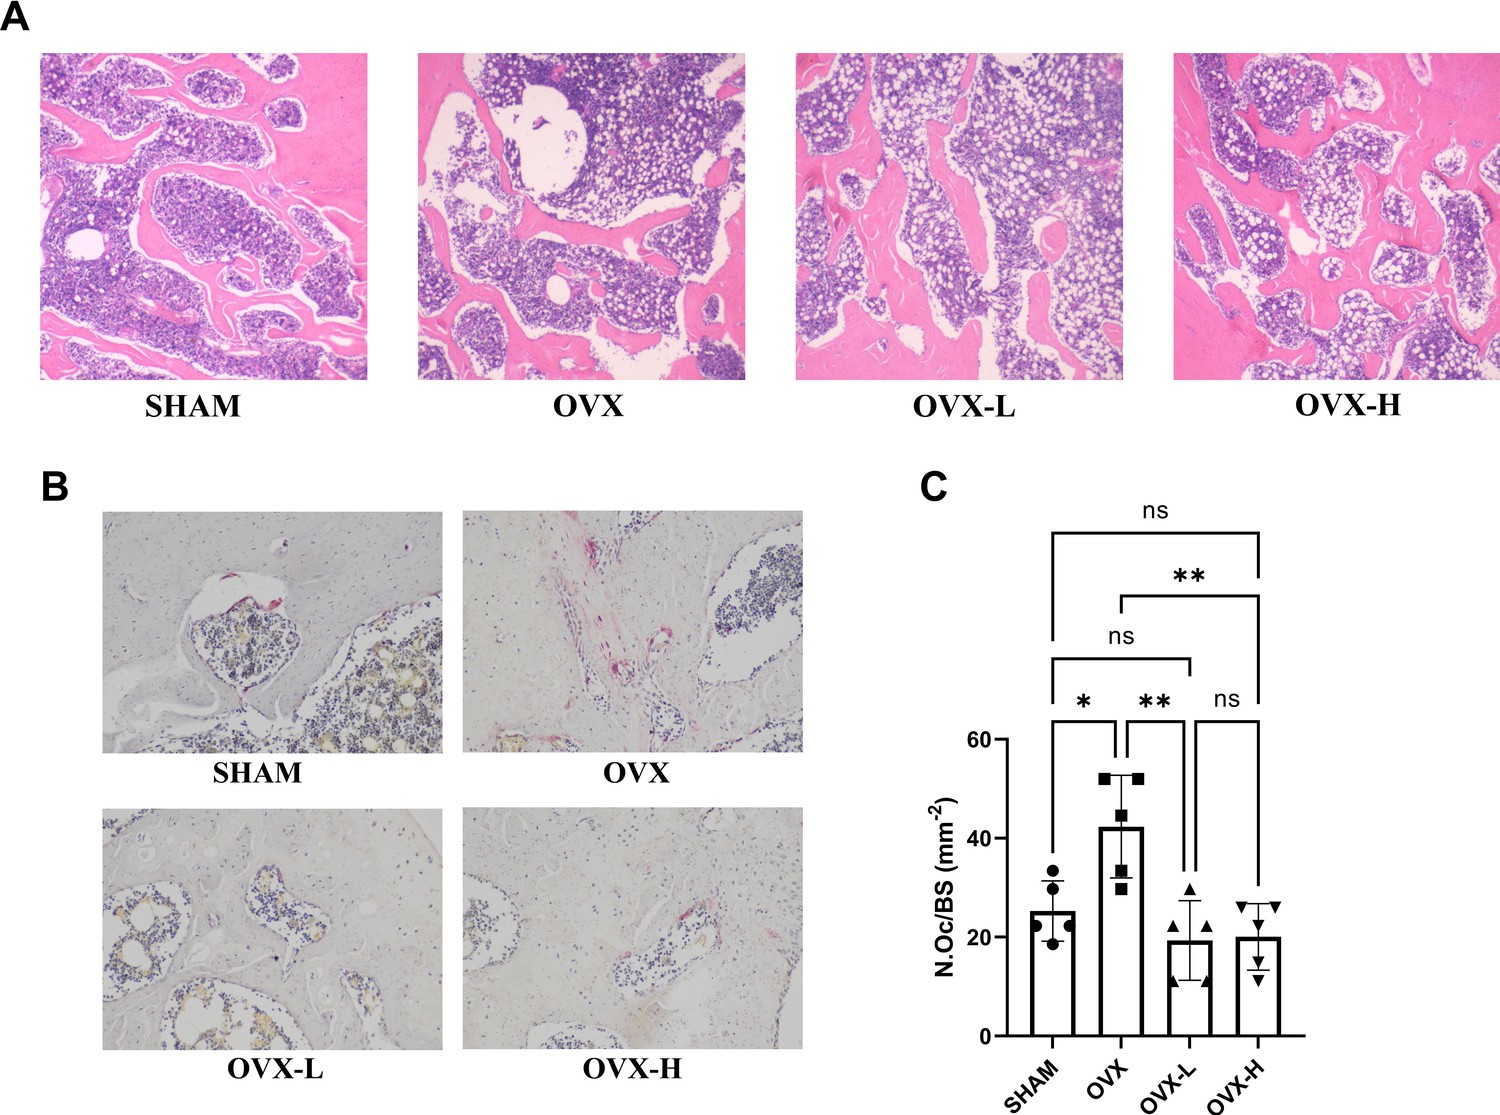
7,8-Dihydroxyflavone (7,8-DHF) improved bone remodeling in ovariectomy (OVX) rat.
(A) Representative images of left femurs sections stained with H&E. (B) Representative images of tartrate-resistant acid phosphatase (TRAP)-stained decalcified left femurs sections. Source files of micrographs used for the quantitative analysis are available in Figure 6—source data 1. (C) Quantitative statistics of osteoclast number per bone surface (N.Oc/BS). Results were expressed as mean ± SD (n = 5, *p < 0.05, **p < 0.01, ns: not significant, one-way analysis of variance [ANOVA]).
-
Figure 6—source data 1
Micrographs used for the quantitative analysis in tartrate-resistant acid phosphatase (TRAP) staining.
The folders named ‘SHAM’, ‘OVX’, ‘OVX-L’, and ‘OVX-H’ contain micrographs of ‘SHAM’, ‘OVX’, ‘OVX-L’, and ‘OVX-H’ groups, respectively.
- https://cdn.elifesciences.org/articles/64872/elife-64872-fig6-data1-v2.zip
Figure 7
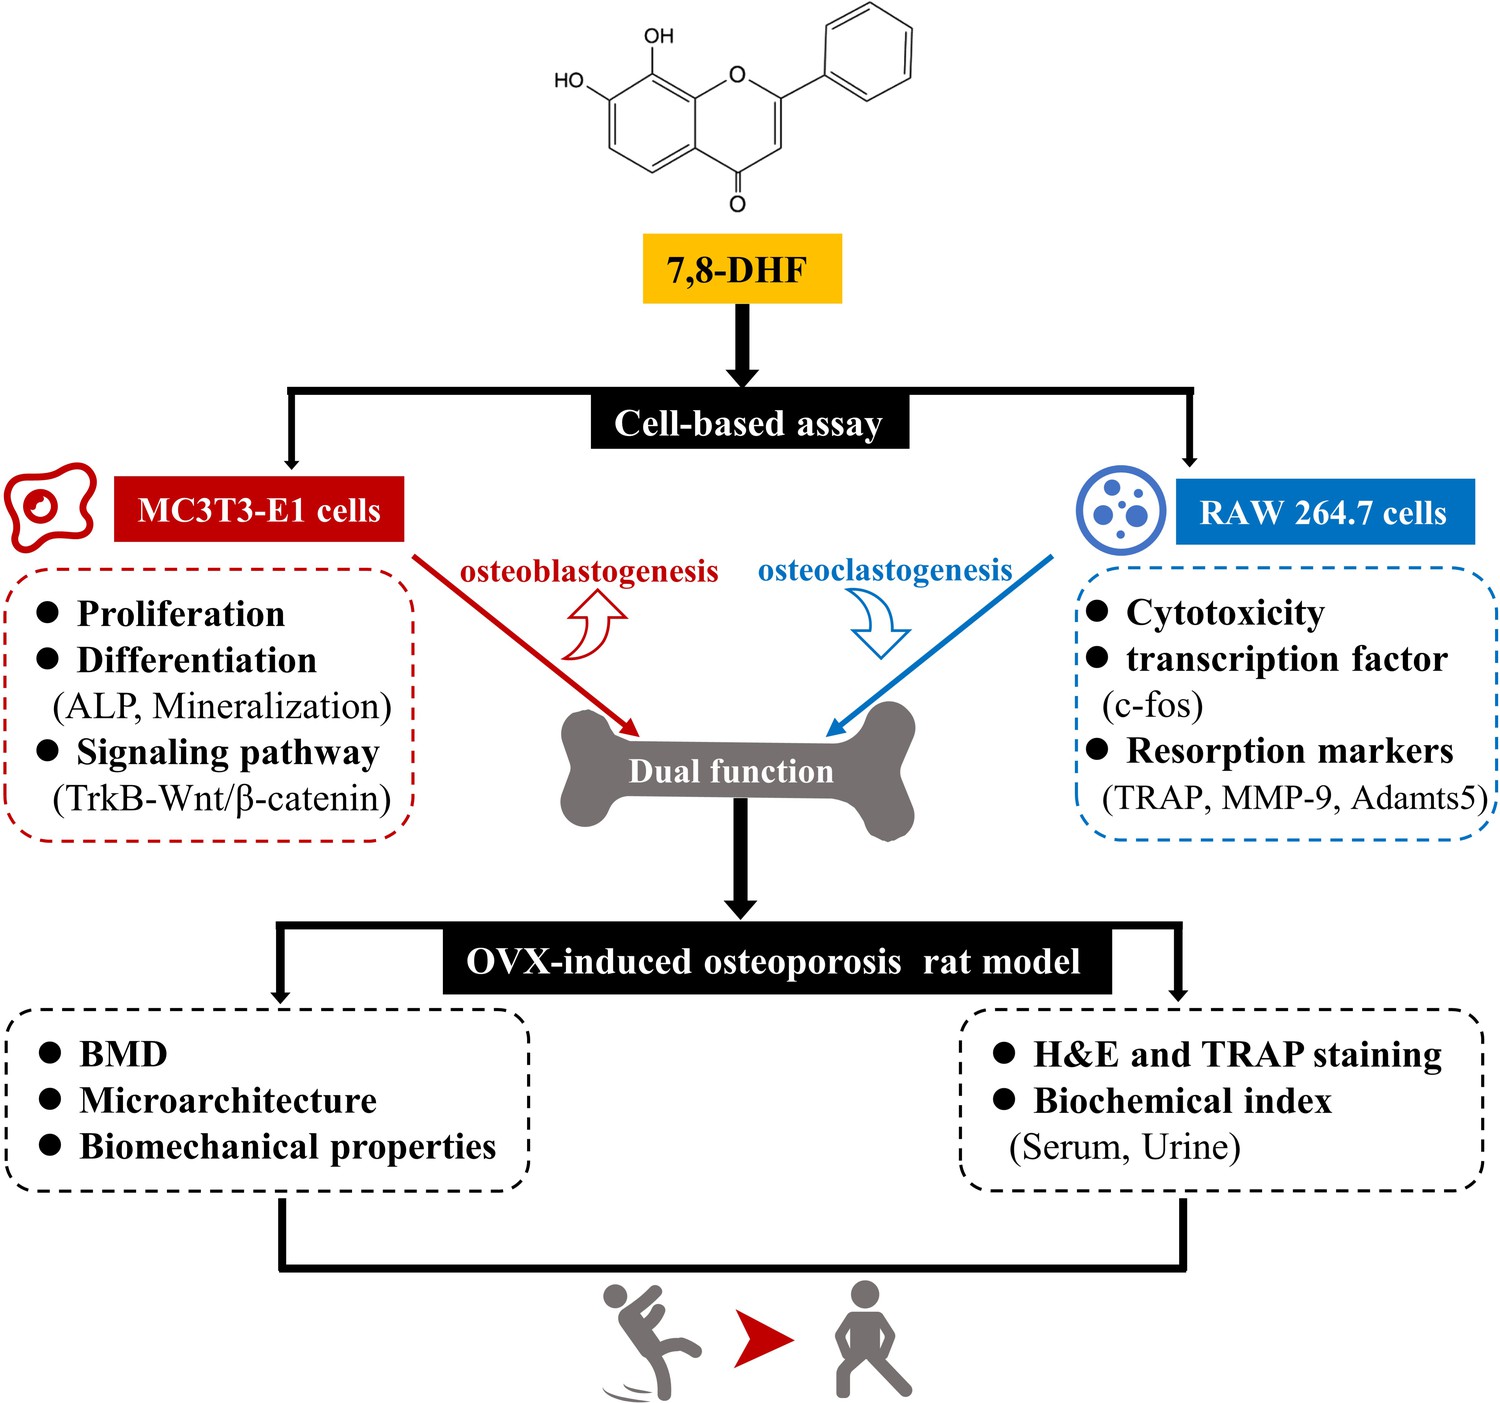
7,8-Dihydroxyflavone (7,8-DHF) exerts dual regulation of bone remodeling.
7,8-DHF promotes osteoblastic proliferation and differentiation through the TrkB-Wnt/β-catenin signaling pathway and inhibits osteoclastogenesis at the same time in vitro. Furthermore, 7,8-DHF improves bone mass, trabecular microarchitecture, tibial biomechanical properties, and bone biochemical indexes in vivo as indicated in an ovariectomy (OVX)-induced osteoporosis rat model.
Author response image 1
7,8-DHF promoted osteogenic differentiation of BMSCs and inhibited osteoclastic differentiation of BMMs.
(A) The effect of 7,8-DHF on the proliferation of BMSCs after treatment for 24, 48 and 72 h. (B) The effect of 7,8-DHF on the ALP activity of BMSCs. Results were normalized with total protein quantity. (C) Representative images of TRAP-positive multinucleated osteoclasts after the treatment with 7,8-DHF for 5 d. (magnification: 100×, scale bar: 200 μm) (D)The average number of TRAP-positive multinucleated (nuclei ≥ 3) cells per cell. (D) The effects of 7,8-DHF on the cytoactive of BMMs. All results were expressed as mean ± SD. (A, E: n = 4; B-D: n = 3; *p < 0.05, **p < 0.01, ***p < 0.001, ****p < 0.0001, ns: not significant, one-way ANOVA).
Author response image 2
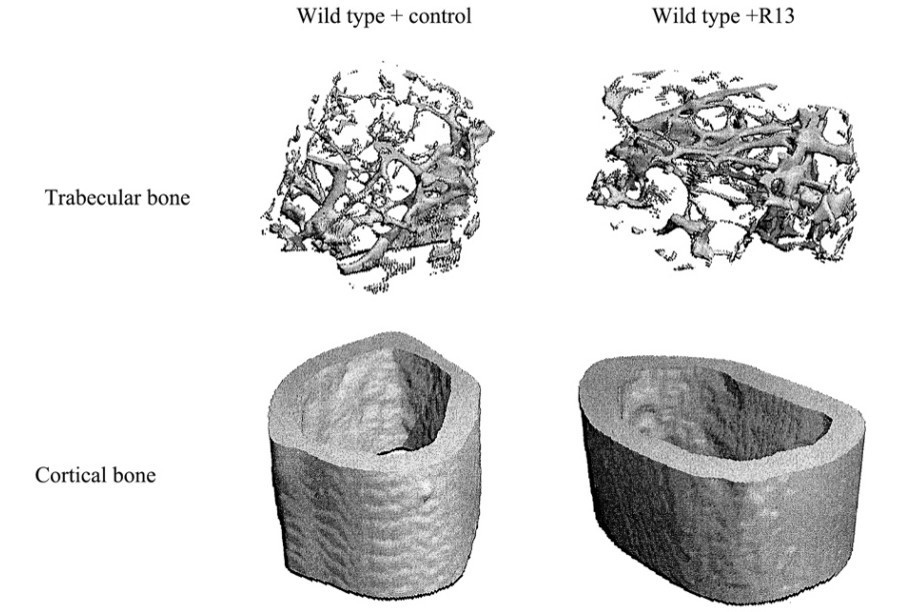
Representative samples were reconstructed in 3D to generate visual representations of trabecular and cortical structure.
Tables
Table 1
The levels of bone biochemical indexes.
| Group | S-Ca (mmol/L) | U-Ca/Cr | FSH (mIU/mL) | E2 (pg/mL) | ALP (U/L) | BGP (ng/mL) |
|---|---|---|---|---|---|---|
| SHAM | 2.63±0.08a | 0.54±0.07b | 13.72±0.89 | 57.31±21.24 | 26.74±4.73a | 2.54±0.27ab |
| OVX | 2.49±0.08b | 1.29±0.49a | 14.24±0.70 | 50.64±6.45 | 47.03±10.49c | 2.48±0.22a |
| OVX-L | 2.42±0.04b | 0.42±0.19b | 13.98±1.59 | 58.28±19.49 | 43.58±4.07bc | 2.46±0.33a |
| OVX-H | 2.47±0.04b | 0.36±0.13b | 13.65±2.34 | 61.88±17.33 | 37.57±3.76b | 2.93±0.28b |
-
S-Ca: serum calcium; U-Ca/Cr: urine calcium/creatinine; FSH: follicle-stimulating hormone; E2: estradiol; ALP: alkaline phosphatase; BGP: bone gal protein. Results were presented as mean ± SD (n=6–7. Data with different letters in each group were significantly different at p<0.05).
Key resources table
| Reagent type (species) or resource | Designation | Source or reference | Identifiers | Additional information |
|---|---|---|---|---|
| Cell line (Mus musculus) | MC3T3-E1 Subclone 14 | The Cell Bank of the Chinese Academy of Sciences | Cat #:GNM15 RRID:CVCL_5437 | |
| Cell line (Mus musculus) | RAW 264.7 | The Cell Bank of the Chinese Academy of Sciences | Cat #:SCSP-5036 RRID:CVCL_0493 | |
| Peptide, recombinant protein | BDNF | PeproTech | Cat #:450–02 | |
| Peptide, recombinant protein | RANKL | R and D Systems | Cat #:462-TEC-010 | |
| Chemical compound, drug | 7,8- Dihydroxyflavone; 7,8-DHF | Tokyo Chemical Industry | Cat #:D1916 | |
| Chemical compound, drug | Ascorbic acid | Aladdin | Cat #:A103539 | |
| Chemical compound, drug | β-Glycerophosphate disodium salt hydrate | Sigma-Aldrich | Cat #:G9422 | |
| Chemical compound, drug | Dexamethasone | Sigma-Aldrich | Cat #:D4902 | |
| Chemical compound, drug | K252a | Cell Signaling | Cat #:12754 | |
| Antibody | Rabbit monoclonal anti-GSK3β | Huabio | Cat #:ET1607-71 | WB: 1:1000 |
| Antibody | Rabbit monoclonal anti-p-GSK3β (Ser 9) | Huabio | Cat #:ET1607-60 | WB: 1:1000 |
| Antibody | Rabbit monoclonal anti-β-catenin | Abcam | Cat # ab32572 | WB: 1:5000 |
| Antibody | Rabbit monoclonal anti-Osterix | Abcam | Cat #:ab209484 | WB: 1:1000 |
| Antibody | Rabbit monoclonal anti-Runx2 | Cell Signaling | Cat #:12556 | WB: 1:1000 |
| Antibody | Rabbit monoclonal anti-Smad2 | Huabio | Cat #:ET1604-22 | WB: 1:1000 |
| Antibody | Rabbit monoclonal anti-p-Smad2 (S250) | Huabio | Cat #:ET1612-32 | WB: 1:1000 |
| Antibody | Rabbit monoclonal anti-TAK1 | Huabio | Cat #:ET1705-14 | WB: 1:1000 |
| Antibody | Rabbit polyclonal anti-TrkB | Affinity | Cat #:AF6461 | WB: 1:1000 |
| Antibody | Rabbit polyclonal anti-P-TrkB (Tyr706) | Affinity | Cat #:AF3461 | WB: 1:1000 |
| Antibody | Rabbit monoclonal anti-MMP-9 | Abcam | Cat #:ab228402 | WB: 1:1000 |
| Antibody | Rabbit polyclonal anti-Adamts5 | Huabio | Cat #:1903–32 | WB: 1:1000 |
| Antibody | Rabbit polyclonal anti-GAPDH | Proteintech | Cat #:10494–1-AP | WB: 1:5000 |
| Sequence-based reagent | qRT-PCR primers | This paper | See Supplementary file 1 | |
| Sequence-based reagent | siRNA | This paper | See Materials and methods, Small interfering RNA transfection section | |
| Commercial assay or kit | Cell Counting Kit-8; CCK-8 | Biosharp | Cat #:BS350A | |
| Commercial assay or kit | DNA Content Quantitation Assay (Cell Cycle) kit | Solarbio | Cat #:CA1510 | |
| Commercial assay or kit | BCA Protein Assay Kit | Solarbio | Cat #:PC0020 | |
| Commercial assay or kit | ALP assay kit | Nanjing Jiancheng | Cat #:A059-2 | |
| Commercial assay or kit | Alizarin Red S solution (1%, pH 4.2) | Solarbio | Cat #:G1452 | |
| Commercial assay or kit | Acid phosphatase, leukocyte (TRAP) kit | Sigma-Aldrich | Cat #:387A | |
| Commercial assay or kit | TRIzol Reagent | Invitrogen | Cat #:15596026 | |
| Commercial assay or kit | PrimeScript RT reagent Kit with gDNA Eraser | TaKara | Cat #:RR047A | |
| Commercial assay or kit | PowerUp SYBR Green Master Mix | Applied Biosystems | Cat #:A25742 | |
| Commercial assay or kit | Lipofectamine 3000 | Invitrogen | Cat #:L3000001 | |
| Commercial assay or kit | Rat FSH ELISA kit | Cusabio | Cat #:CSB-E06869r | |
| Commercial assay or kit | Rat E2 ELISA kit | Cusabio | Cat #:CSB-E05110r | |
| Commercial assay or kit | Rat BGP ELISA kit | Cusabio | Cat #:CSB-E05129r | |
| Software, algorithm | ModFit LT | Verity Software House (http://www.vsh.com/products/mflt/index.asp) | RRID:SCR_016106 | |
| Software, algorithm | ImageJ | ImageJ (http://imagej.nih.gov/ij/) | RRID:SCR_003070 | |
| Software, algorithm | GraphPad Prism | GraphPad (https://www.graphpad-prism.cn/) | RRID:SCR_002798 | Version 9 |
Additional files
-
Supplementary file 1
Sequences of primers used for quantitative real-time PCR (qRT-PCR).
- https://cdn.elifesciences.org/articles/64872/elife-64872-supp1-v2.docx
-
Transparent reporting form
- https://cdn.elifesciences.org/articles/64872/elife-64872-transrepform-v2.pdf
Download links
A two-part list of links to download the article, or parts of the article, in various formats.
Downloads (link to download the article as PDF)
Open citations (links to open the citations from this article in various online reference manager services)
Cite this article (links to download the citations from this article in formats compatible with various reference manager tools)
7,8-Dihydroxyflavone modulates bone formation and resorption and ameliorates ovariectomy-induced osteoporosis
eLife 10:e64872.
https://doi.org/10.7554/eLife.64872


