Single-cell and single-nucleus RNA-seq uncovers shared and distinct axes of variation in dorsal LGN neurons in mice, non-human primates, and humans
- Allen Institute for Brain Science, United States
- Department of Neurology, Columbia University Medical Center, United States
- Washington National Primate Research Center and Department of Physiology and Biophysics, University of Washington, United States
Figures
Figure 1 with 1 supplement
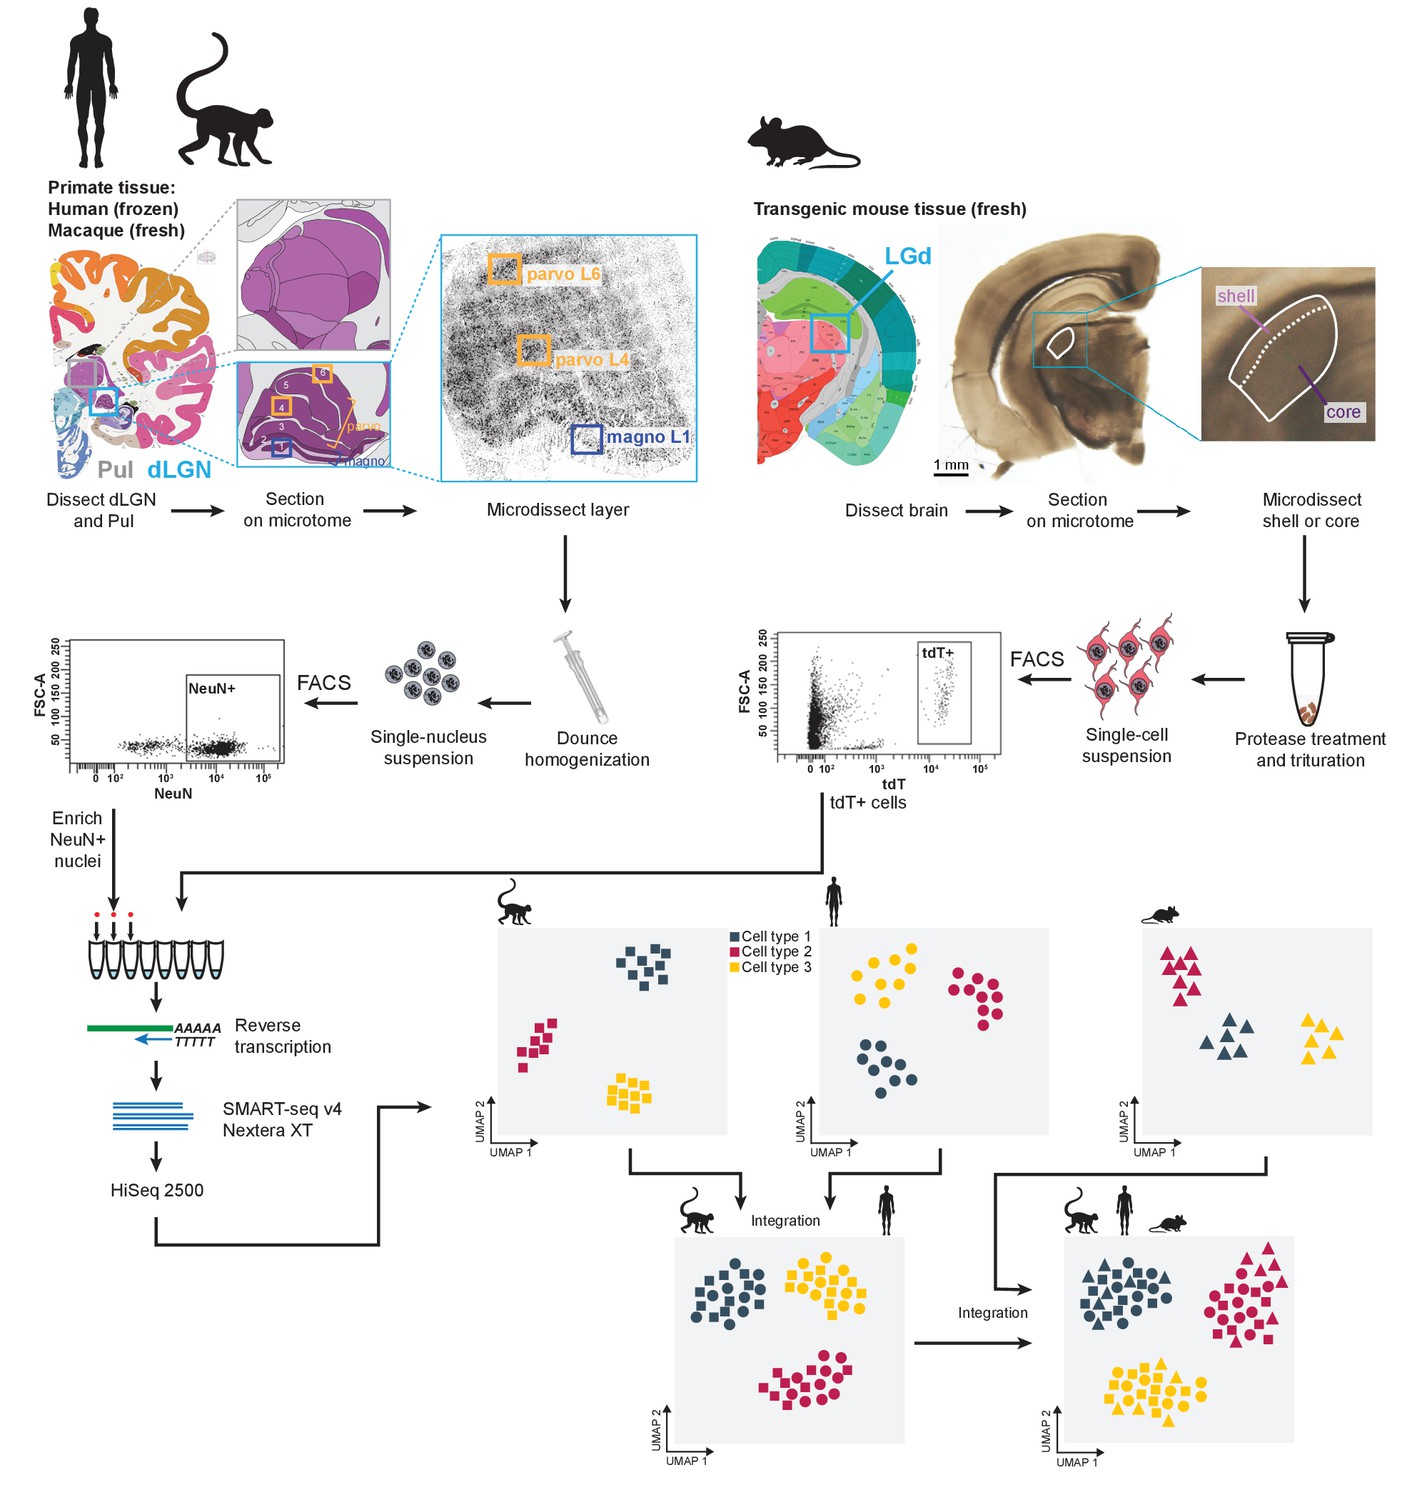
Experimental and data analysis workflow.
Dorsal lateral geniculate nucleus (dLGN) was dissected from postmortem human brain and acutely collected macaque and mouse brain according to the Allen Brain Atlas. Each sample was used to obtain single-cell or -nucleus suspensions. Individual cells or nuclei were sorted into eight-well strip PCR tubes by FACS and lysed. SMART-Seq v4 was used to reverse-transcribe and amplify full-length cDNAs. cDNAs were then tagmented by Nextera XT, PCR-amplified, and processed for Illumina sequencing. Initial clustering of single-cell or single-nucleus transcriptomes was performed independently for human, macaque and mouse. To further distinguish M and P types, the human data wereclustered with the macaque data. For cross-species comparison, macaque, human, and mouse data were co-clustered withSeurat v3.
Figure 1—figure supplement 1
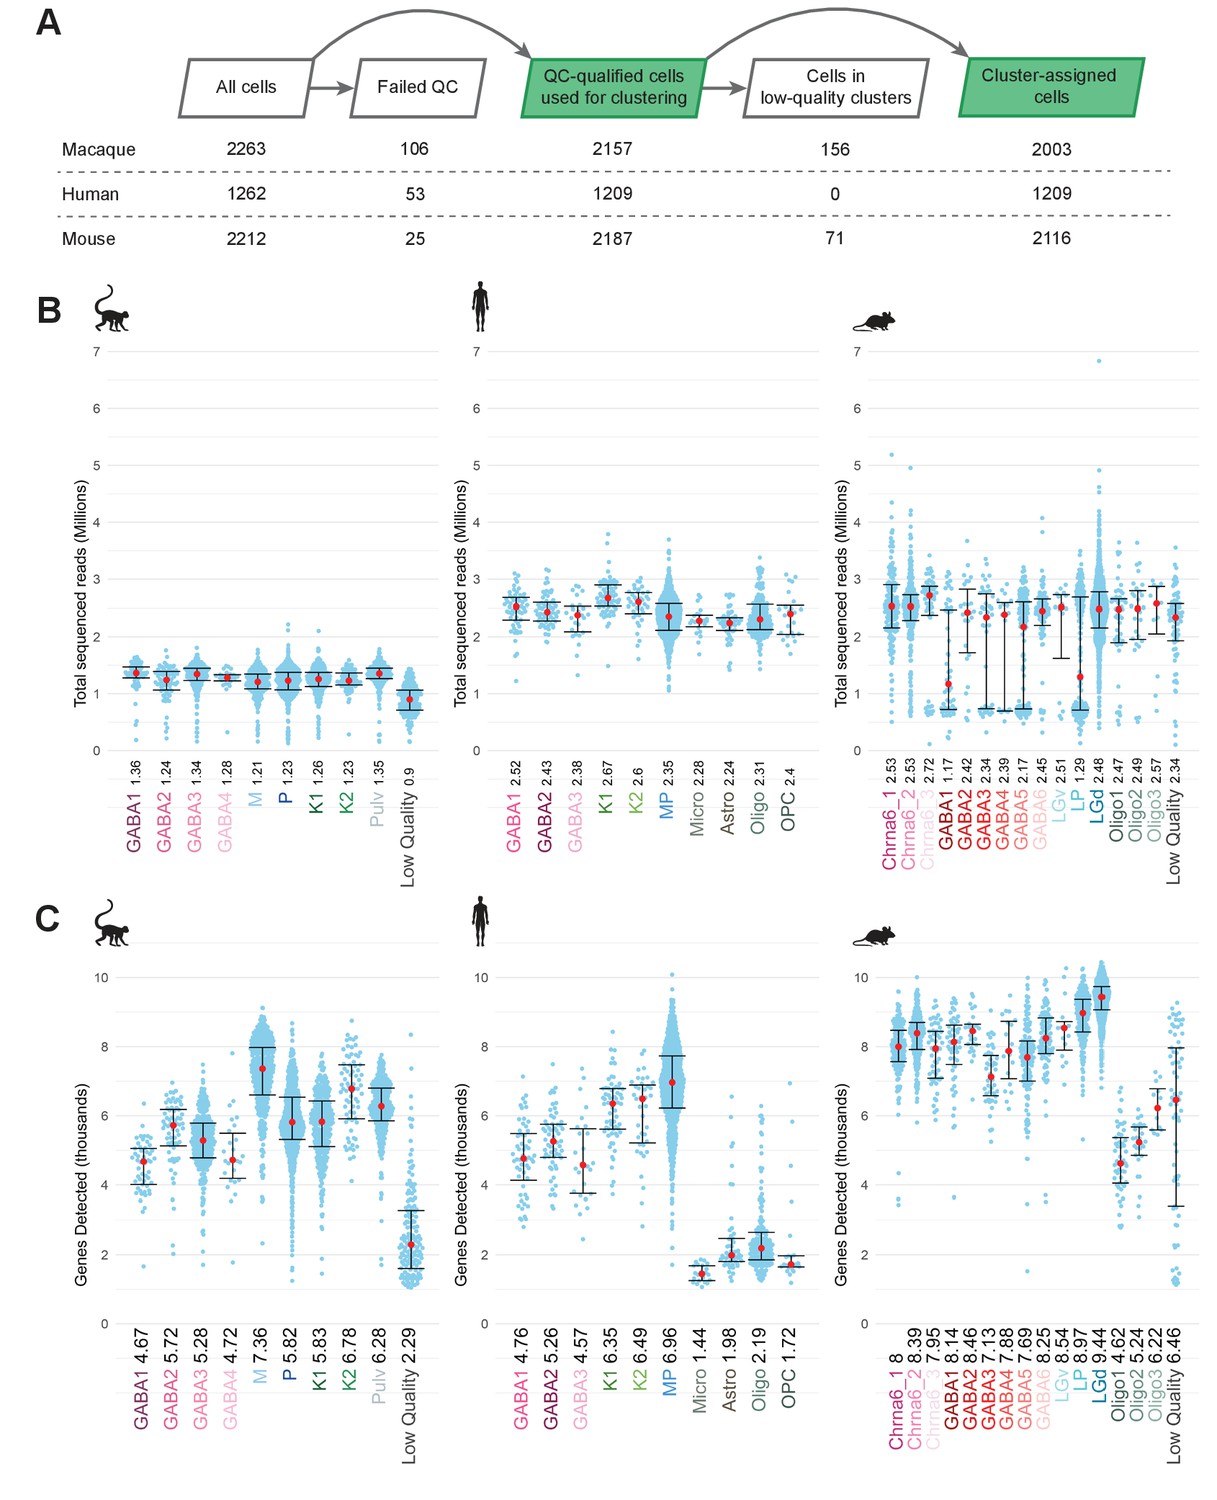
Total reads and gene detection rates in the datasets.
(A) The number of cells at each step in the sc/snRNA-seq data analysis pipeline for each species. (B) Sequencing depth for all cluster-assigned cells, grouped by transcriptomic cell type per species. Median values in millions of reads are noted adjacent to the cell-type label and plotted as red dots; whiskers denote 25th and 75th percentiles. (C) The number of detected genes grouped by transcriptomic type for each species. Median values in thousands of genes are noted adjacent to the cell-type label and plotted as red dots; whiskers denote 25th and 75th percentiles.
Figure 2 with 1 supplement
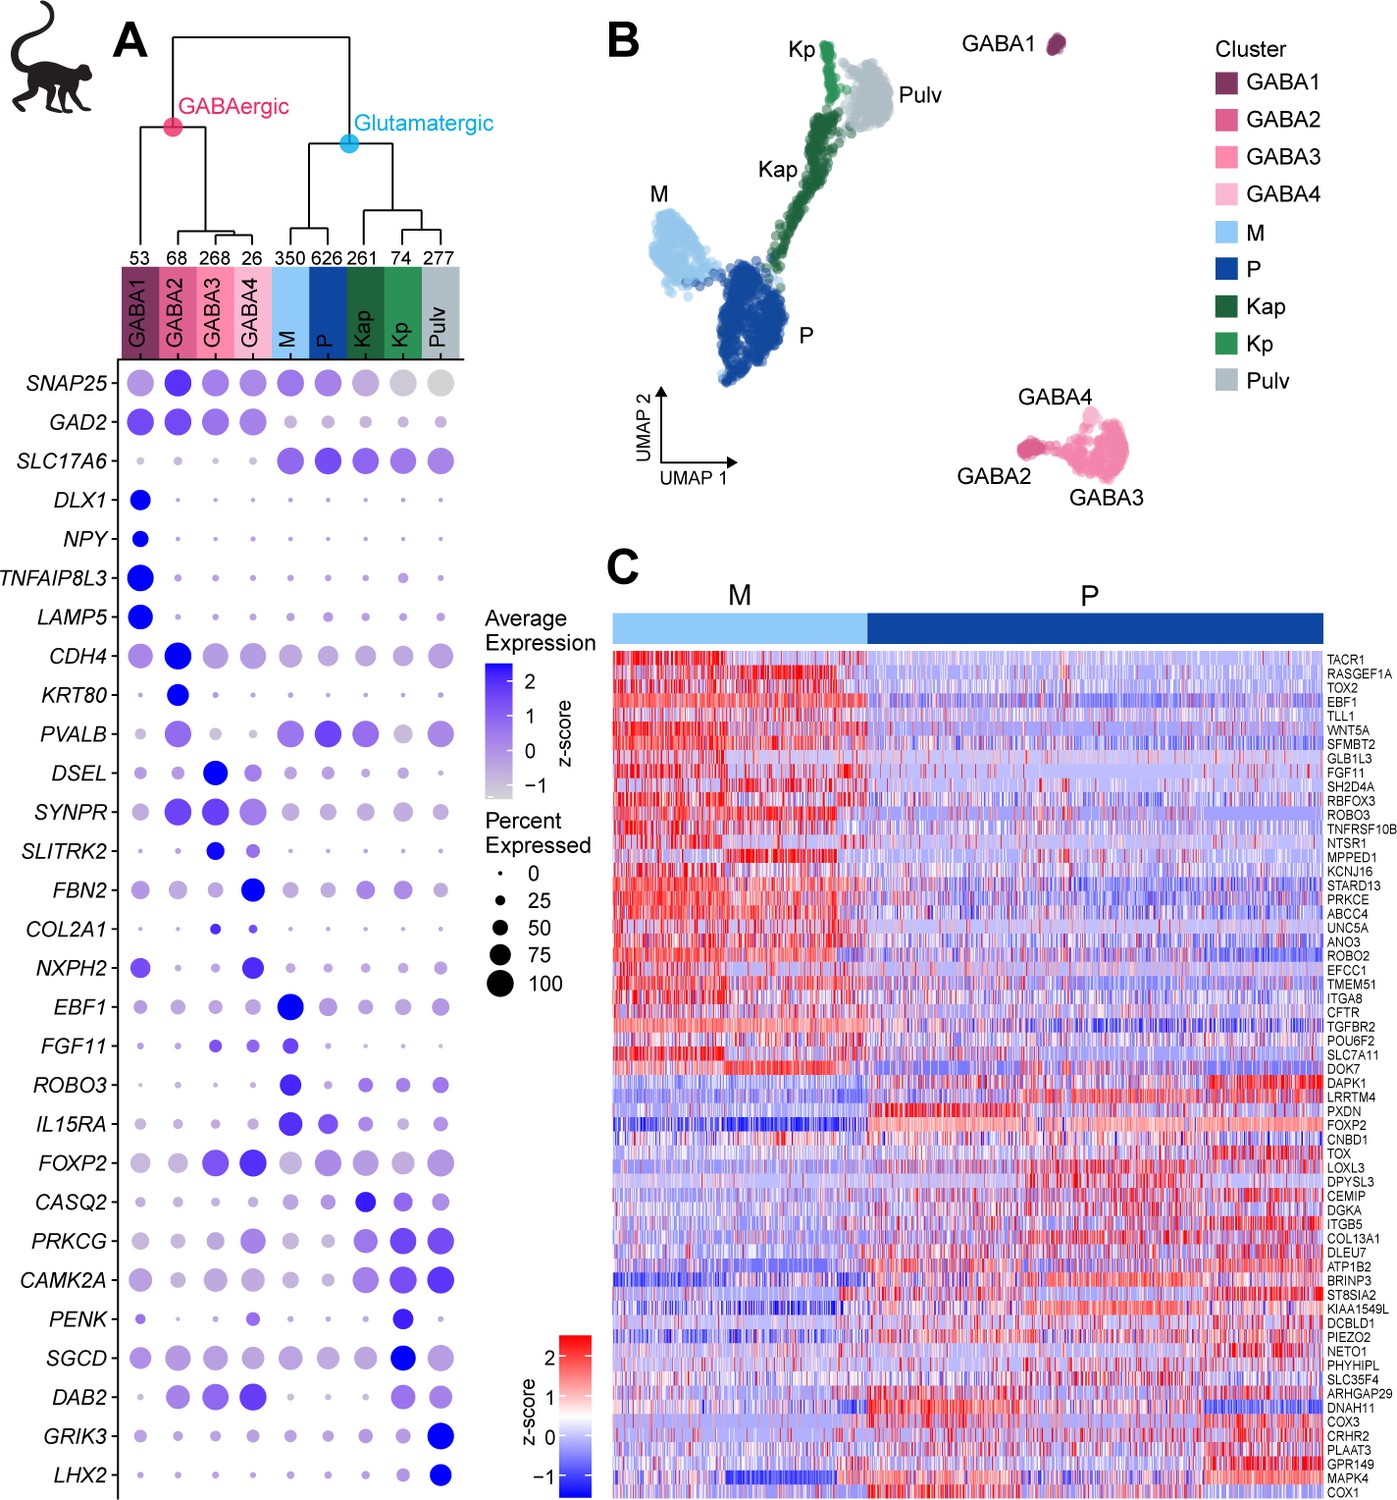
Neuronal cell-type taxonomy of macaque dorsal lateral geniculate nucleus (dLGN) and pulvinar by snRNA-seq.
(A) Top: Neuronal cell-type taxonomy based on median cluster gene expression of 2000 differentially expressed genes in 2003 nuclei from three donors across two macaque species. Known marker genes and dissection location were used to assign molecular cluster identity. Numbers of nuclei in each cluster are indicated at the bottom of the dendrogram. Bottom: gene expression dot plot showing the relative expression of marker genes (y-axis) across all clusters (x-axis). The color intensity of the dots represents the average expression level, whereas the size of the dot represents the proportion of cells expressing the gene. (B) UMAP representation of macaque dLGN neurons colored by cluster. (C) Heatmap of RNA-seq expression z-scores computed for the top 60 differentially expressed genes expressed (p adj<0.05, log2(fold change) > 1) between the M and P clusters. Each column in the heatmap is an individual nucleus.
Figure 2—figure supplement 1
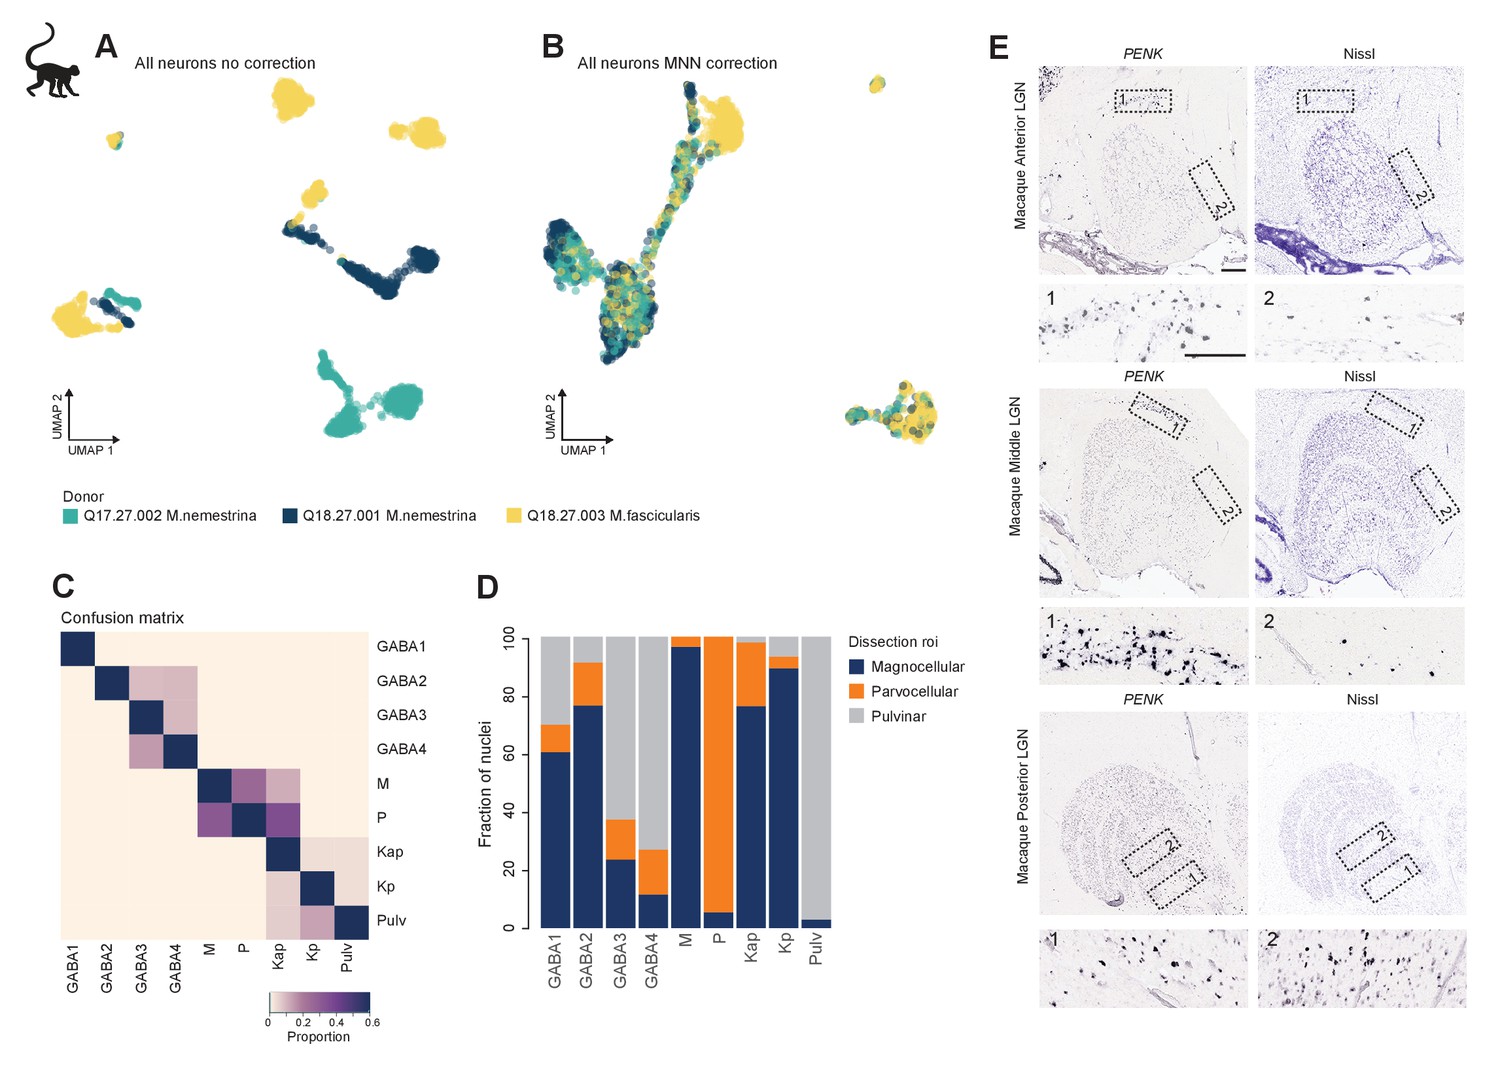
Donor-effect correction and cell type localization in macaque dorsal lateral geniculate nucleus (dLGN) cells.
(A, B) UMAP representation of 2003 macaque dLGN neurons colored by donor without correction (A) and after fastMNN correction of donor effects (B). (C) Confusion matrix showing cluster membership validation for the nine macaque cell types. Validation of cluster membership was performed as described previously (Tasic et al., 2016). (D) Bar plot representing the fraction of cells derived from a dissection ROI per cluster. (E) Confirmation of Kp marker gene PENK expression in K layers, across three anterior to posterior areas of macaque dLGN by chromogenic single-molecule RNA in situ hybridization. We also find and PENK+ cells in the white matter just dorsal to anterior dLGN.
Figure 3 with 2 supplements
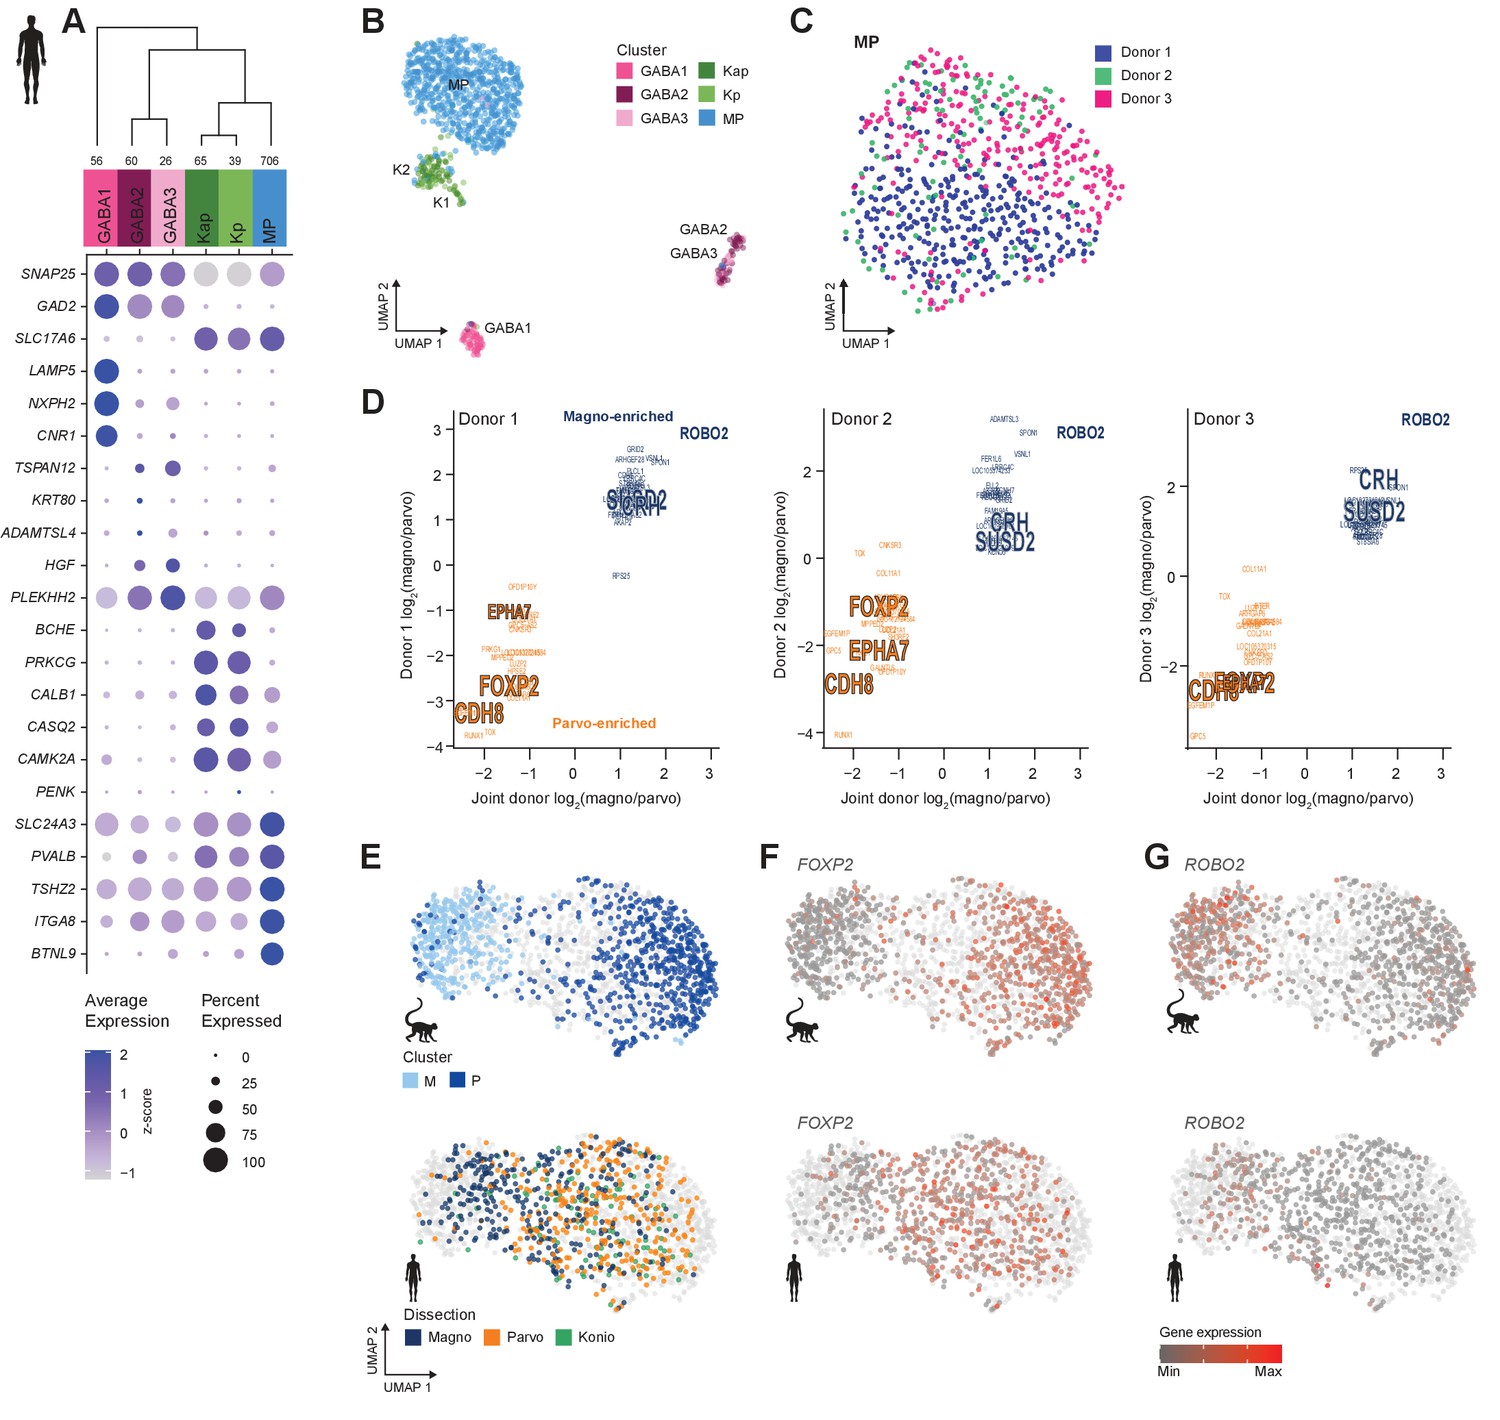
Neuronal cell-type taxonomy of human dorsal lateral geniculate nucleus (dLGN) by snRNA-seq.
(A) Top: Cell-type taxonomy based on median cluster gene expression of 2000 differentially expressed genes and 946 nuclei from three donors. Known marker genes were used for cluster identity assignment. Numbers of nuclei in each cluster are indicated at the bottom of the dendrogram. Bottom: gene expression dot plot showing the relative expression of marker genes (y-axis) across all clusters (x-axis). (B) UMAP representation of human dLGN neurons colored by cluster. (C) UMAP representation of neurons within the MP cluster, colored by donor. (D) 32 single-nucleus marker genes show consistent enrichment between M and P dissections in three donors. Select marker genes that are differentially expressed (p adj<0.05, log2(fold change) > 1) are highlighted. (E) UMAP representation of joint analysis of human MP and macaque M and P nuclei using canonical correlation analysis (CCA). The macaque nuclei are labeled based on cluster identity defined by the macaque snRNA-seq clusteranalysis, whereas the human nuclei within the MP cluster are labeled by dissection ROI. (F, G) UMAP representation, as in panel (G), showing expression of the P marker FOXP2 (F) or the M marker ROBO2 in the macaque and human MP clusters (G).
Figure 3—figure supplement 1
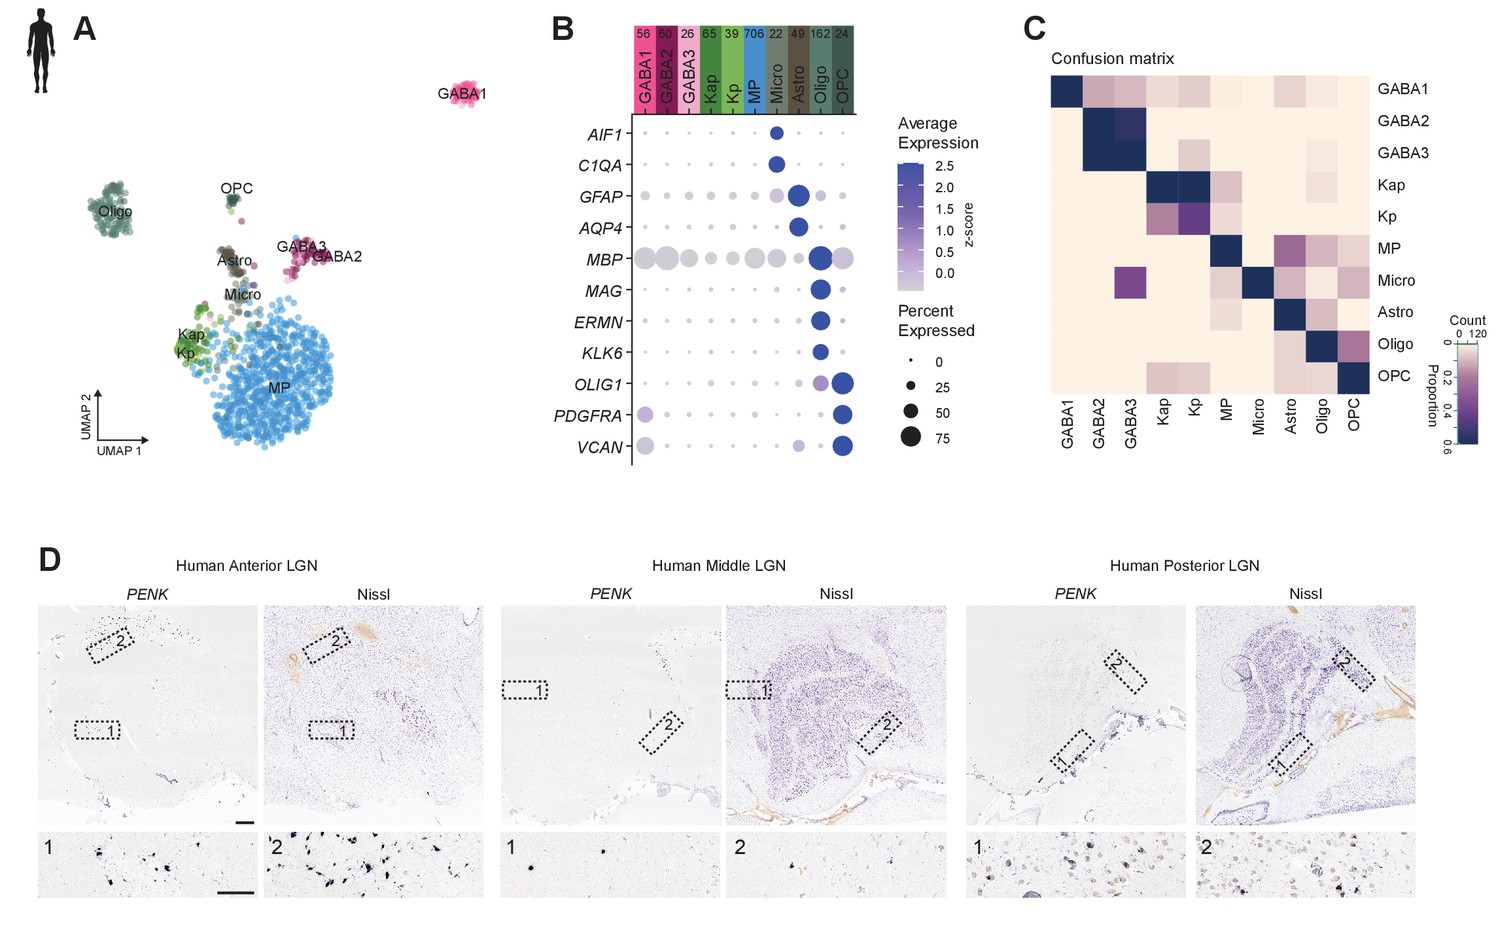
Neuronal and non-neuronal cell types of human dLGN and marker gene expressionconfirmation.
(A) UMAP representation of all neuronal and non-neuronal nuclei from human dorsal lateral geniculate nucleus (dLGN) nuclei,, colored by cluster.
(B) Gene expression dot plot showing the relative expression of non-neuronal marker genes (y-axis) across all clusters (x-axis). (C) Confusion matrix showing cluster membership validation for the 10 human cell types. (D) Confirmation of Kp marker gene PENK expression in K layers, across three anterior to posterior areas of human dLGN by chromogenic single-molecule RNA in situ hybridization, as well as in the white matter dorsal to dLGN.
Figure 3—figure supplement 2
Marker gene expression in M and P neurons in human dorsal lateral geniculate nucleus (dLGN).
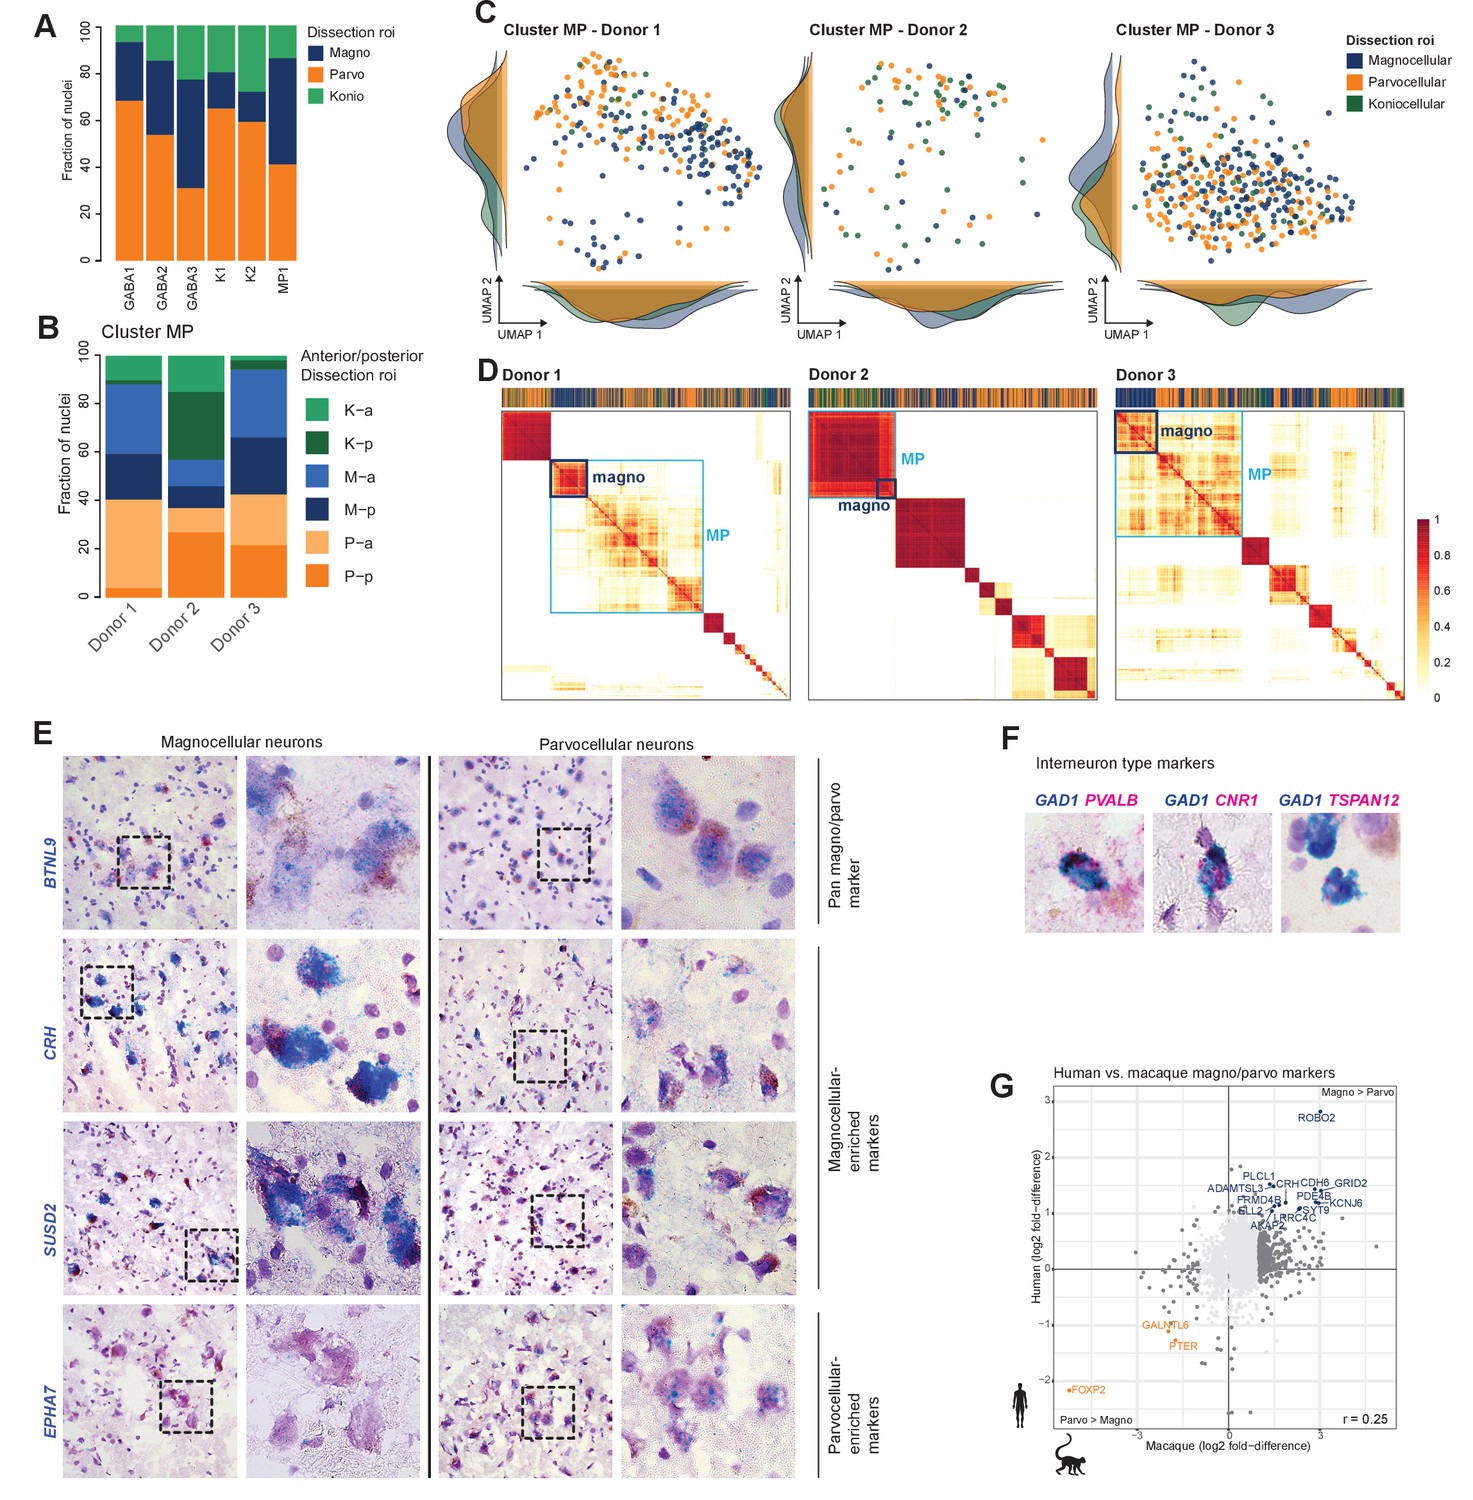
(A) Bar plot representing fraction of cells derived from a dissection region of interest (ROI) per cluster. (B) Distribution of dissection ROI per donor within the MP cluster. K: koniocellular; M: magnocellular; P: parvocellular; a: anterior; p: posterior. (C) The MP cluster UMAP shown in Figure 3D was split by donor and colored by dissection ROI. (D) Co-clustering diagrams for three independent donors depicting M nuclei enrichment within the MP cluster for each of the donors. Co-clustering matrices show the proportion of clustering iterations (100 total) in which each pair of nuclei was assigned to the same cluster (Bakken et al., 2018). The matrices were reordered by Ward’s hierarchical clustering and represented as heatmaps with coherent clusters ordered as squares along the diagonal. The row and column order of nuclei is the same for all heatmaps. The light blue box denotes the MP cluster, and the dark blue box highlights neurons derived from M dissections. (E, F) Confirmation of select marker gene expression in human dLGN by chromogenic single-molecule RNA in situ hybridization by RNAscope. Based on transcriptomic clustering, the M and P cells are grouped together in cluster MP. We confirmed expression of the pan-M/P marker gene BTNL9. Within MP, we identified a M-P gradient (Figure 3E, C, D). We verified expression for M marker genes CRH and SUSD2 and P marker gene EPHA7. Representative images are shown (E). Representative images of the pan-GABAergic marker GAD1 and specific cluster markers (F). (G) Scatter plot showing consistent single-cell marker gene expression between M and P dissections in macaque and human. Select marker genes are highlighted.
Figure 4 with 1 supplement
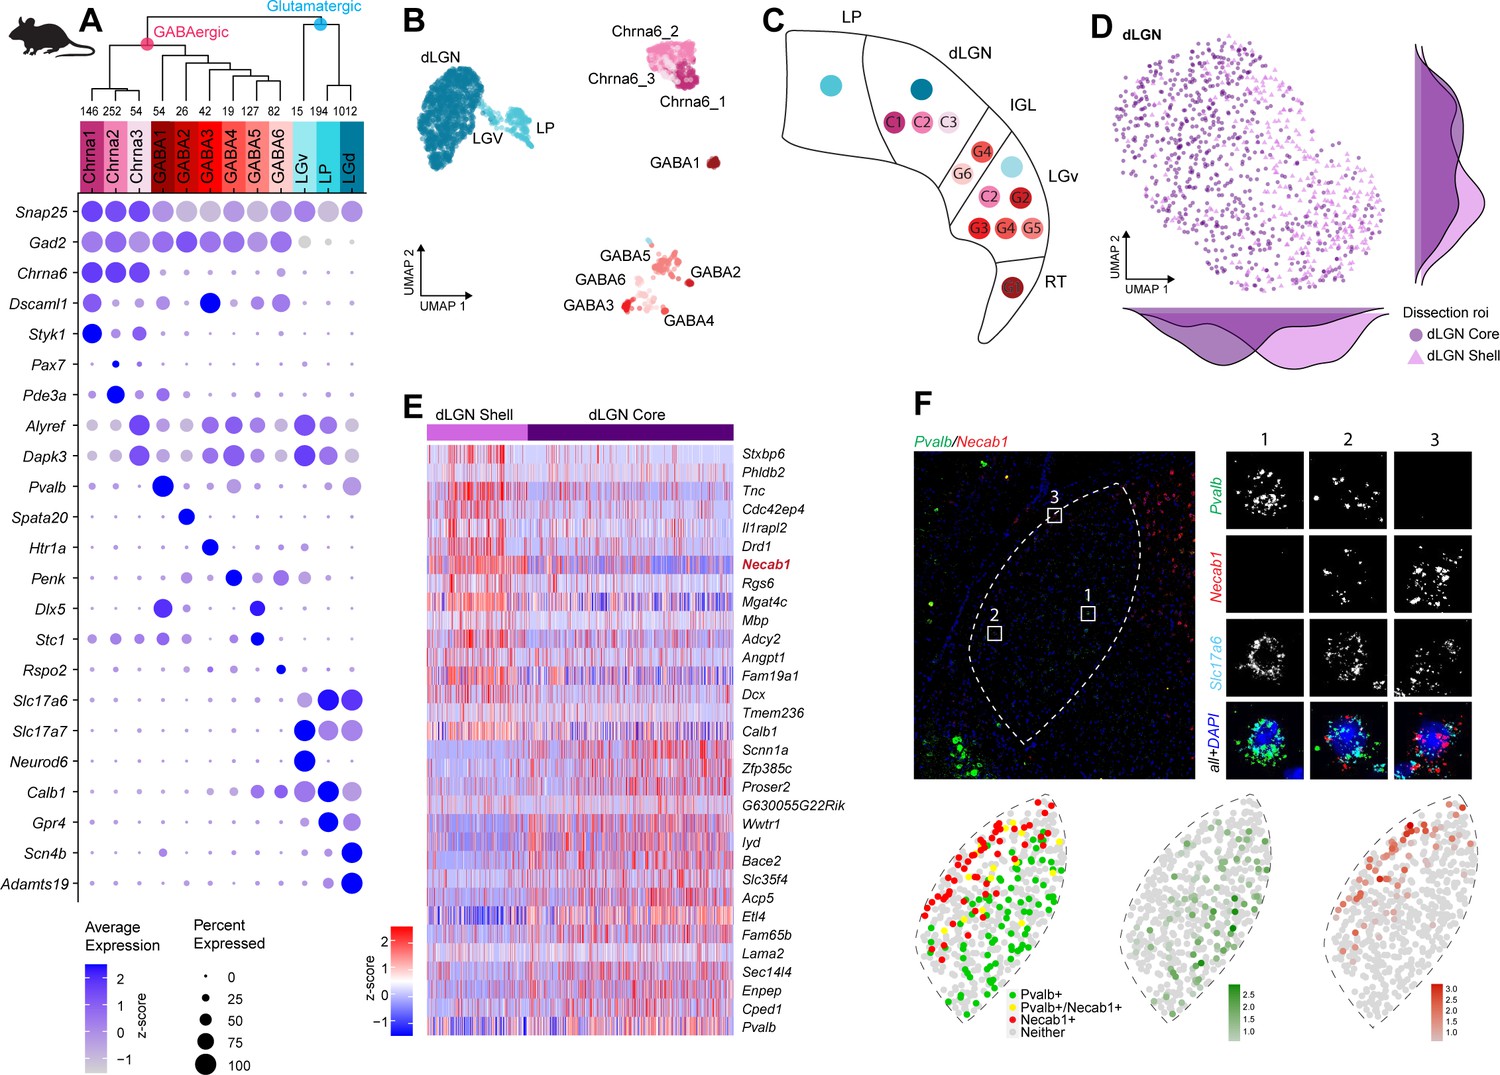
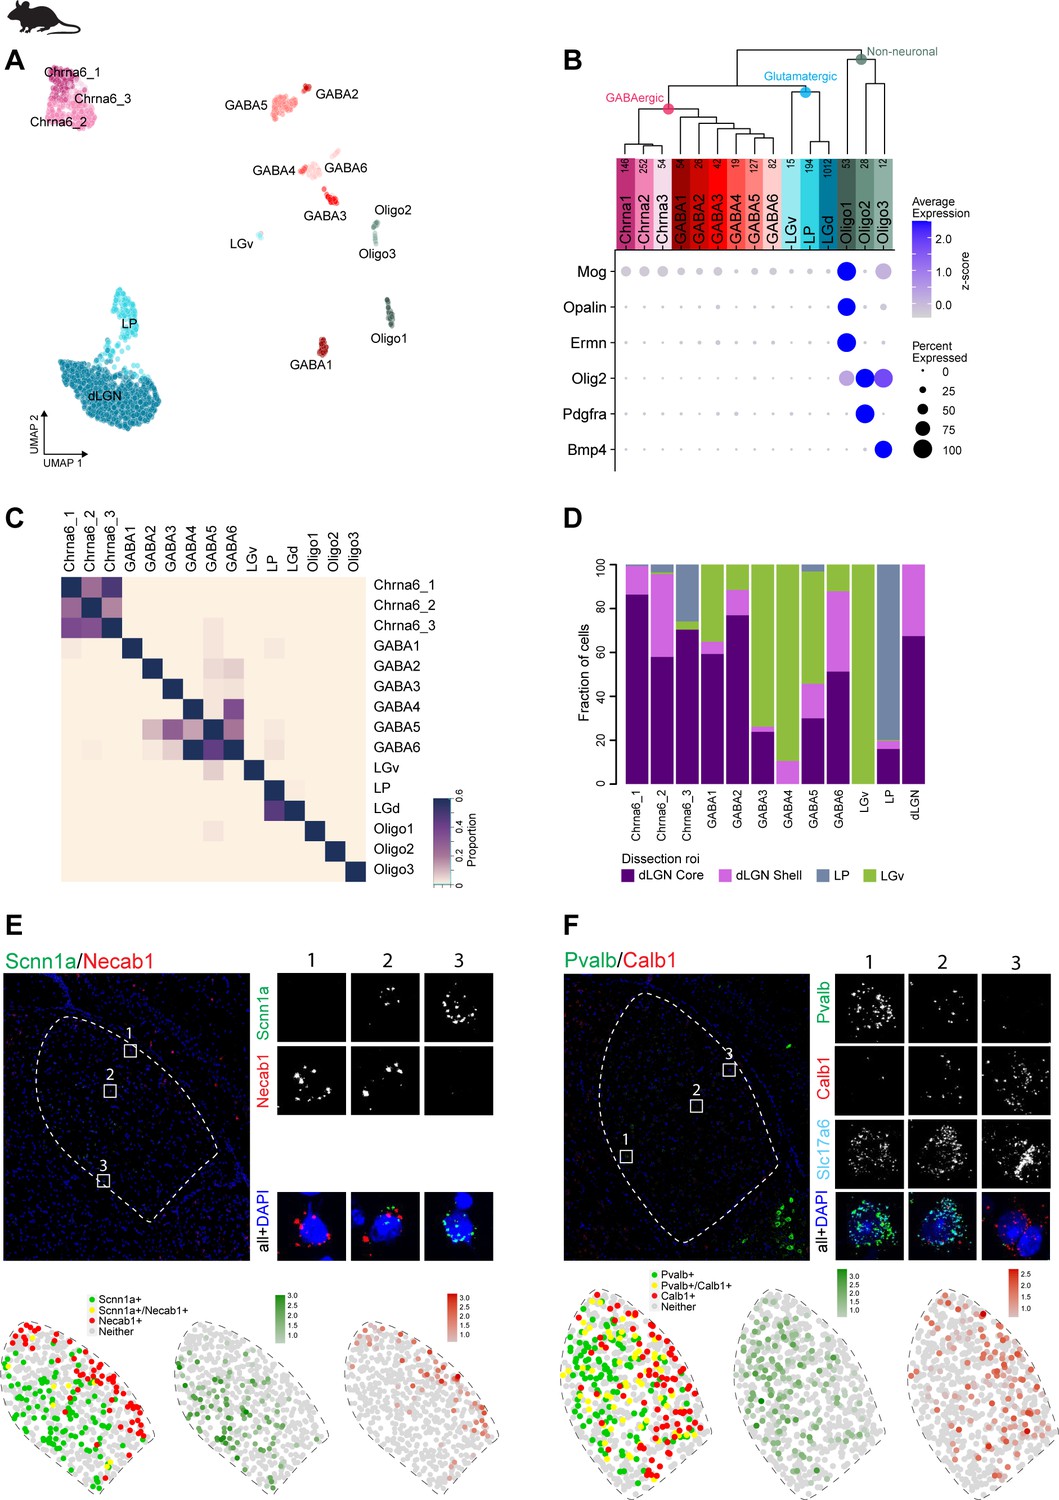
Neuronal cell-type taxonomy of mouse dorsal lateral geniculate nucleus (dLGN) and nearby regions by scRNA-seq.
(A) Top: hierarchical taxonomy based on median cluster gene expression of >2000 differentially expressed genes and 2020 cells. Known and newly discovered marker genes were used to assign molecular cluster identity. Bottom: gene expression dot plot showing the relative expression of marker genes (y-axis) across all clusters (x-axis). (B) UMAP representation of mouse dLGN neurons colored by cluster. (C) Schematic representation of the relevant thalamic nuclei in the mouse brain with colored dots representing cell types identified in this study. Based on cell-type-specific marker expression and using the Allen Brain Atlas in situ hybridization (ISH) data, the anatomical location of cell types could be determined. (D) UMAP representation of neurons from the dLGN cluster colored by dissection ROI. The density plot in the margin shows the distribution of cells dissected from mouse dLGN-core (dark purple) and mouse dLGN-shell (light purple) along the x- and y-axes. (E) Heatmap of RNA-seq expression z-scores computed for the top 30 differentially expressed genes expressed (p adj<0.05, log2(fold change) > 1) between cells obtained from dLGN shell and core dissections belonging to dLGN cluster. The gene highlighted in red is confirmed by ISH in panel F. Each column in the heatmap is an individual sample. (F) Confirmation of differential expression of Pvalb and Necab1 between shell and core of mouse dLGN by single-molecule fluorescence ISH by RNAscope.
Figure 4—figure supplement 1
Marker gene expression in mouse dorsal lateral geniculate nucleus (dLGN).
(A) UMAP representation of all mouse dLGN nuclei, neuronal and non-neuronal nuclei, colored by cluster. (B) Gene expression dot plot showing the relative expression of non-neuronal marker genes (y-axis) across all clusters (x-axis). (C) Confusion matrix showing cluster membership validation for the 15 mouse cell types. (D) Bar plot representing fraction of cells derived from a dissection ROI per cluster. (E, F) Confirmation of select differential marker gene expression between shell and core of mouse dLGN by single-molecule fluorescence in situ hybridization (ISH) by RNAscope. ISH result showing spatially restricted expression of Scnna1 and Necab1 (E) and expression of Pvalb and Calb1 in mouse dLGN (F).
Figure 5 with 1 supplement
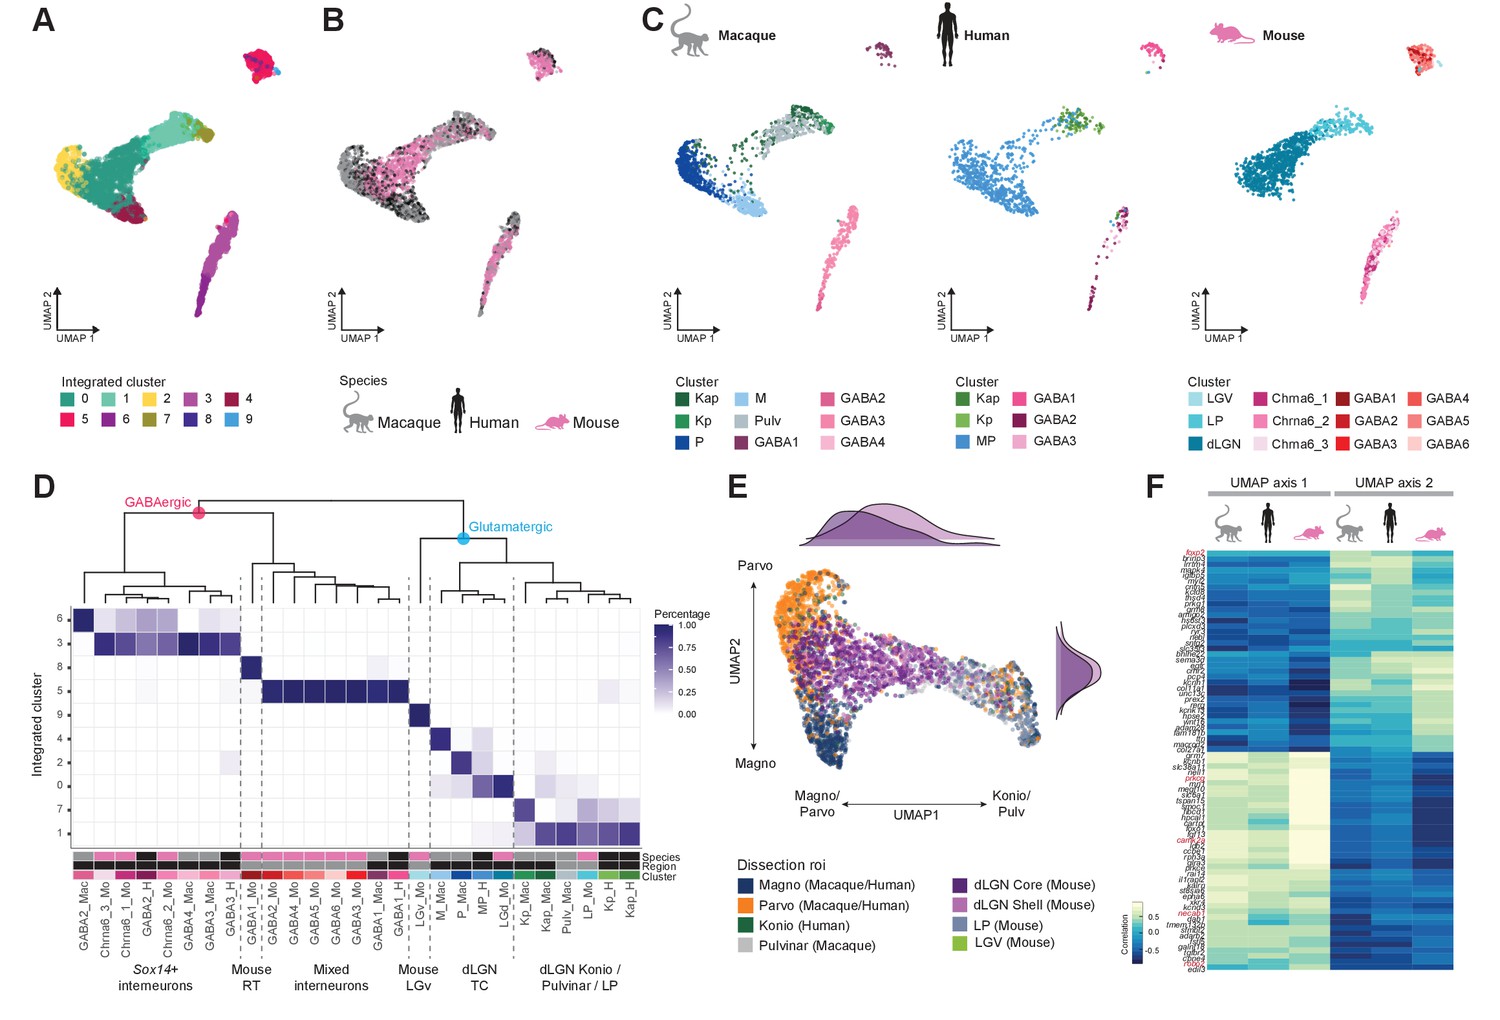
Cross-species integrative analysis.
(A–C) All 4978 neurons from macaque, human, and mouse were integrated using Seurat v3. UMAP representation of the integrative analysis colored by integrated cluster call (A), colored by species (B), or colored by species-independent cluster call (C). (D) Correspondence of species-specific clustering and integrative clustering. The heatmap illustrates the proportion of the species-specific cell types contributing to the integrated cluster. The region color bar indicates the location of cell types in dorsal lateral geniculate nucleus (dLGN) (black) or in adjacent thalamic nuclei (gray). (E) Representation of glutamatergic neurons selected from UMAP as represented in panels (A) and (B) colored by dissection ROI. The density plot in the margin shows the distribution of cells dissected from mouse dLGN-core (dark purple) and mouse dLGN-shell (light purple) along the x- and y-axes. (F) Heatmap showing the Spearman correlation coefficient of the gene expression along the UMAP axes represented in panel (C) per species. For each axis, the top 30 genes are shown.
Figure 5—figure supplement 1
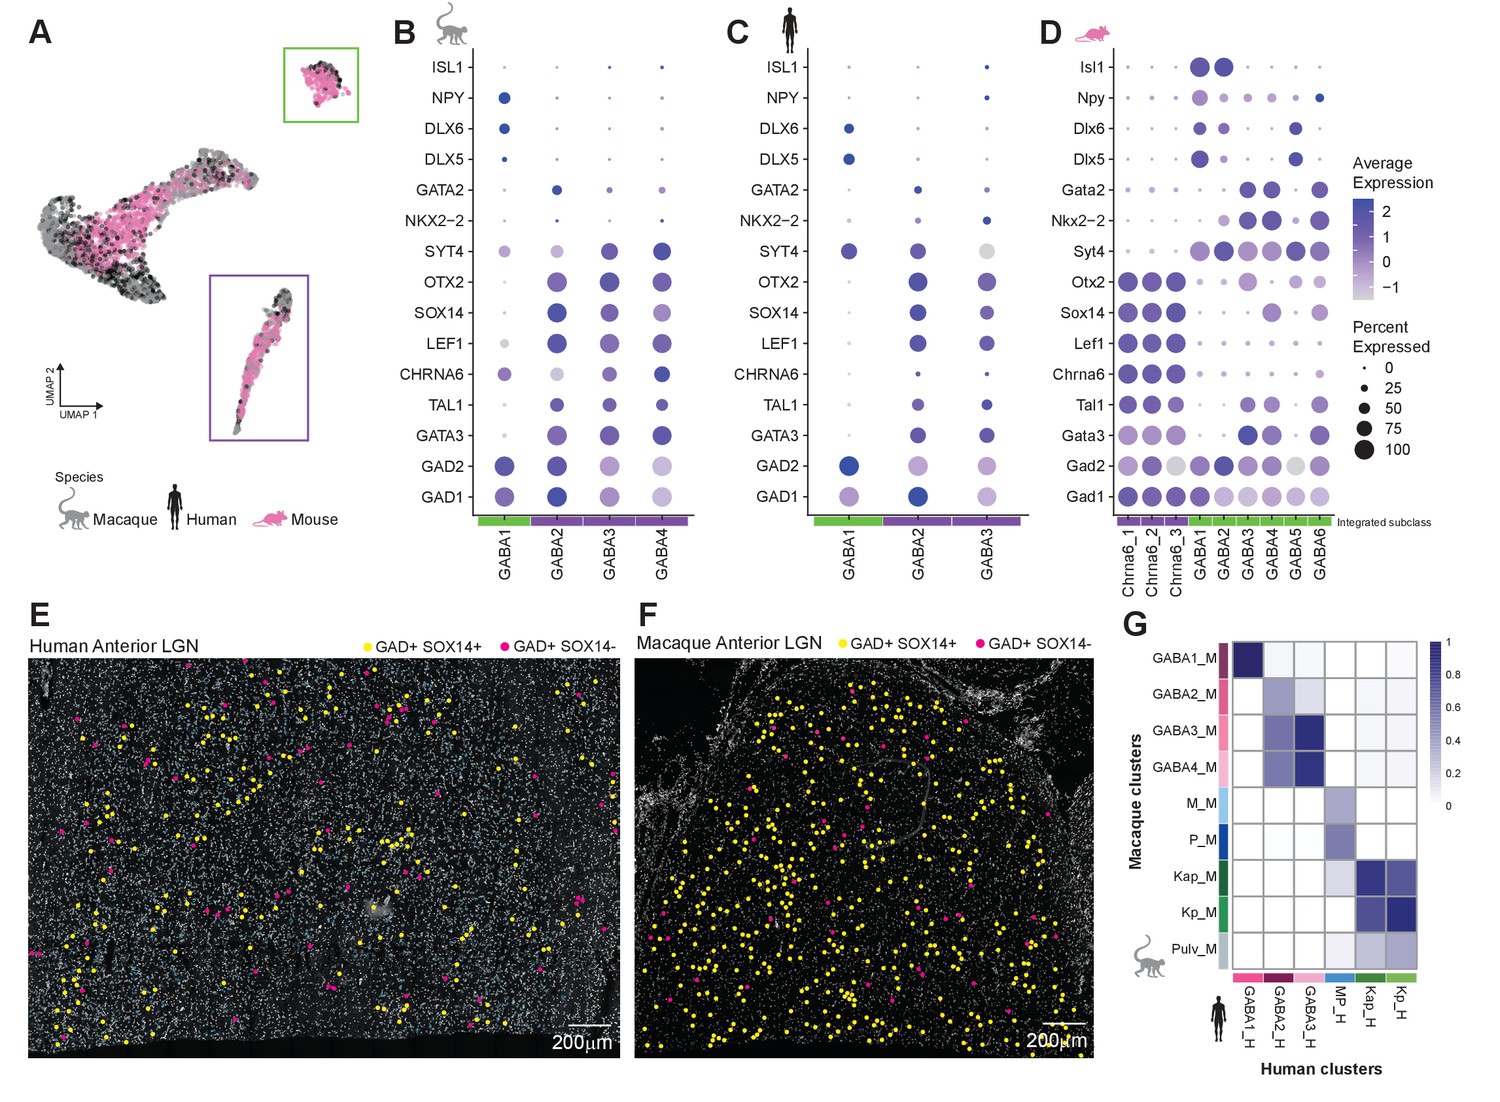
Cross-species comparison of GABAergic types.
(A) UMAP representation of the integrative analysis of all neurons across the three species. The GABAergic types are divided into two subclasses (denoted by green and purple boxes) containing cell types from all species. (B–D) Dot plot showing expression of key transcriptional regulators of the GABAergic lineage in macaque (B), human (C), and mouse (D) GABAergic types. The color intensity of the dots represents the average expression level, whereas the size of the dot represents the proportion of cells expressing the gene. (E, F) Confirmation of GABAergic SOX14-positive and SOX14-negative populations in human (E) and macaque (F) dorsal lateral geniculate nucleus (dLGN). (G) Integration of macaque and human neuronal clusters. The heatmap shows the proportion of human nuclei or macaque nuclei that co-cluster. Rows show macaque clusters and columns show human clusters.
Author response image 1
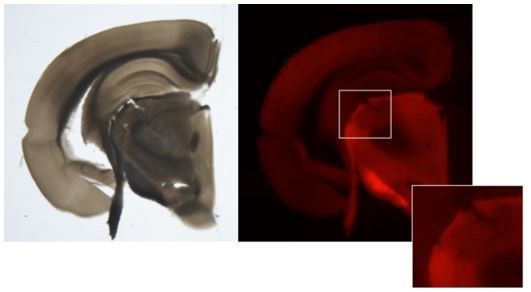
Example image of core and shell enriched dLGN dissections.
Author response image 2
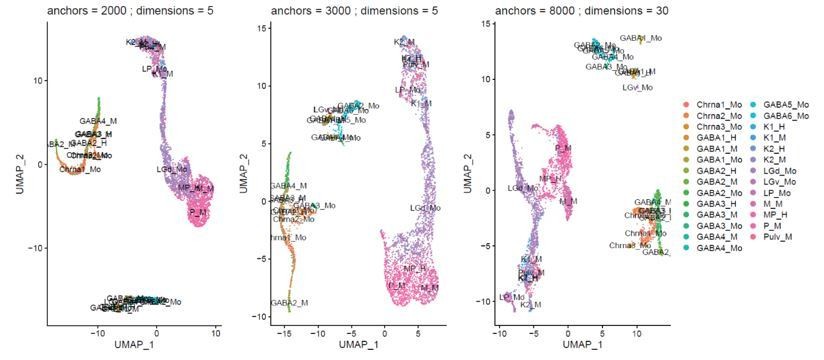
Example of the effect of varying cluster parameters on integration of the different species.
Author response image 3
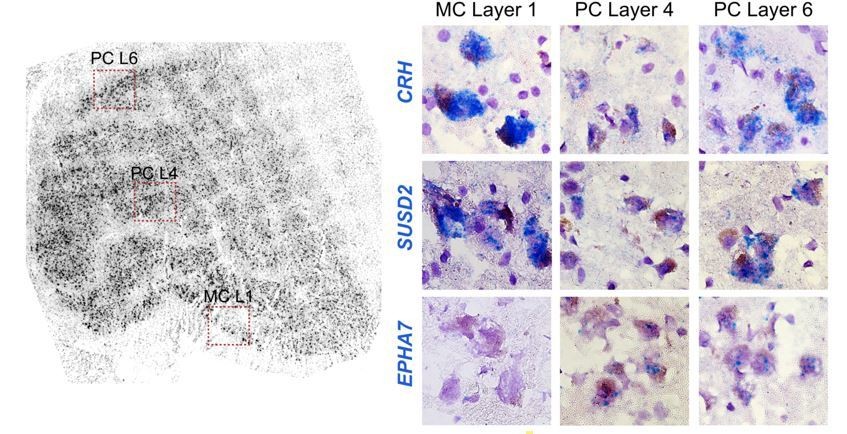
Example ISH panels showing the magnocellular-enriched genes CRH and SUSD2 with lower, but present expression in the parvocellular layer.
Tables
Key resources table
| Reagent type (species) or resource | Designation | Source or reference | Identifiers | Additional information |
|---|---|---|---|---|
| Strain, strain background (Mus musculus) | Mouse: B6.Cg-Gt(ROSA)26Sortm14(CAG-tdTomato)Hze/J, Ai14(RCL-tdT) | The Jackson Laboratory | RRID:IMSR_JAX:007914 | |
| Strain, strain background (Mus musculus) | Mouse: B6J.Cg-Gad2tm2(cre)Zjh/MwarJ, Gad2-IRES-Cre | The Jackson Laboratory | RRID:IMSR_JAX:028867 | |
| Strain, strain background (Mus musculus) | Mouse: B6J.129S6(FVB)-Slc17a6tm2(cre)Lowl/MwarJ, Slc17a6-IRES-Cre | The Jackson Laboratory | RRID:IMSR_JAX:028863 | |
| Strain, strain background (Mus musculus) | Mouse: B6J.129S6(FVB)-Slc32a1tm2(cre)Lowl/MwarJ, Slc32a1-IRES-Cre | The Jackson Laboratory | RRID:IMSR_JAX:028862 | |
| Strain, strain background (Mus musculus) | Mouse: B6;129S-Snap25tm2.1(cre)Hze/J, Snap25-IRES2-Cre | The Jackson Laboratory | RRID:IMSR_JAX:023525 | |
| Commercial assay or kit | SMART-Seq v4 Ultra Low Input RNA Kit for Sequencing | Takara | 634894 | |
| Commercial assay or kit | RNAscope Multiplex Fluorescent V2 Assay | Advanced Cell Diagnostics | 323100 | |
| Commercial assay or kit | RNAscope 2.5 HD Duplex Assay Kit | Advanced Cell Diagnostics | 322435 | |
| Software, algorithm | STAR 2.5.3 | PMID:23104886 | RRID:SCR_004463 | |
| Software, algorithm | Seurat | PMID:29608179 | PMID:29608179 | |
| Software, algorithm | fastMNN | PMID:29608177 | RRID:SCR_017351 | |
| Software, algorithm | ToppGene | PMID:19465376 | RRID:SCR_005726 |
Additional files
-
Supplementary file 1
Specimen annotations.
All specimens used in this study are listed with associated clustering, donor, and dissection annotations.
- https://cdn.elifesciences.org/articles/64875/elife-64875-supp1-v1.zip
-
Supplementary file 2
Donor-specific gene signatures in M vs. P neurons.
Result of differential gene expression analysis of M vs. P neurons in macaque and human dorsal lateral geniculate nucleus (dLGN) per donor.
- https://cdn.elifesciences.org/articles/64875/elife-64875-supp2-v1.xlsx
-
Supplementary file 3
Enrichment of Gene Ontology (GO) terms.
Results of GO enrichment analysis of the union of all differentially expressed genes across donors.
- https://cdn.elifesciences.org/articles/64875/elife-64875-supp3-v1.zip
-
Supplementary file 4
Cluster markers for dorsal lateral geniculate nucleus (dLGN) cell types in macaque, human, and mouse.
The table shows the top 20 differentially expressed genes between a given cluster and all other cell types.
- https://cdn.elifesciences.org/articles/64875/elife-64875-supp4-v1.xlsx
-
Supplementary file 5
Gene signatures in core vs. shell neurons.
Result of differential gene expression analysis of core vs. shell dissected mouse dorsal lateral geniculate nucleus (dLGN) neurons.
- https://cdn.elifesciences.org/articles/64875/elife-64875-supp5-v1.zip
-
Transparent reporting form
- https://cdn.elifesciences.org/articles/64875/elife-64875-transrepform-v1.docx
Download links
A two-part list of links to download the article, or parts of the article, in various formats.
Downloads (link to download the article as PDF)
Open citations (links to open the citations from this article in various online reference manager services)
Cite this article (links to download the citations from this article in formats compatible with various reference manager tools)
Single-cell and single-nucleus RNA-seq uncovers shared and distinct axes of variation in dorsal LGN neurons in mice, non-human primates, and humans
eLife 10:e64875.
https://doi.org/10.7554/eLife.64875


