Distinct population code for movement kinematics and changes of ongoing movements in human subthalamic nucleus
- Center for Neural Science, New York University, United States
- Department of Neurosurgery, Center for Neuromodulation, NYU Langone Health, United States
- Neuroscience Institute, NYU Langone Health, United States
- Department of Psychology, New York University, United States
Figures
Figure 1

Subjects completed cued single-step and multistep reaching movements during intra-operative recordings from STN.
(A) Subjects completed trials involving planned linear movements (Reach), planned two-step movements (Planned Turn), and trials initially cued as Reach trials with a later cue mid-movement to alter the trajectory (Impromptu Turn). Cursor sequence on the screen indicates movement trajectory. (B, C) Trials that met the accuracy criteria as a fraction of the total trials (B) and movement latency (C) were similar on all trial types. However, the time from the turn cue to the change in movement trajectory on Impromptu Turn trials (turn latency) was larger than the movement latency. (D) Example movement trajectories. Each line illustrates a sample trial. The fixation point is indicated by the most leftward point on each trajectory. Start positions are shifted horizontally and leftward trials are flipped horizontally to improve clarity and facilitate comparison of trials in the same group. (E) Mean movement trajectories across all subjects show successful completion of distinct movement plans across different trial types. Shading is SE. (F) Hierarchical clustering of movement trajectories reveals segregation of Reach trajectories from the Planned and Impromptu Turn trajectories. Ns and Nt indicate the number of subjects and the number of trials, respectively, across all panels.
Figure 2 with 2 supplements

Firing rates of STN units represent different task events and movement types.
(A–D) Raster plots (A, B) and corresponding PSTHs (C, D) of two example units. Neural responses are aligned to the fixation (Fix), instruction (Inst), movement onset (Move), turn onset (Turn), and feedback (Fdbk). Each point in (A, B) represents an action potential. Significant differences (p<0.1) between pairs of PSTHs within each unit are indicated by corresponding pairs of colored stars. S and U indicate subject and unit identities, respectively, and Nt indicates the total number of trials per unit. (E–H) Projections of population responses on the top four principal components reveals distinct response patterns associated with different task events and trial types. Ns, Nu, and Nt indicate the number of subjects, units, and trials, respectively. Stars indicate Holm–Bonferroni corrected p<0.001 for pairwise permutation tests. Shadings in C–H are SE. Because there was no turn onset on reach trials, we sampled from the distribution of turn onset times on turn trials to create the turn-aligned PSTHs for reach trials (see Materials and methods).
Figure 2—figure supplement 1
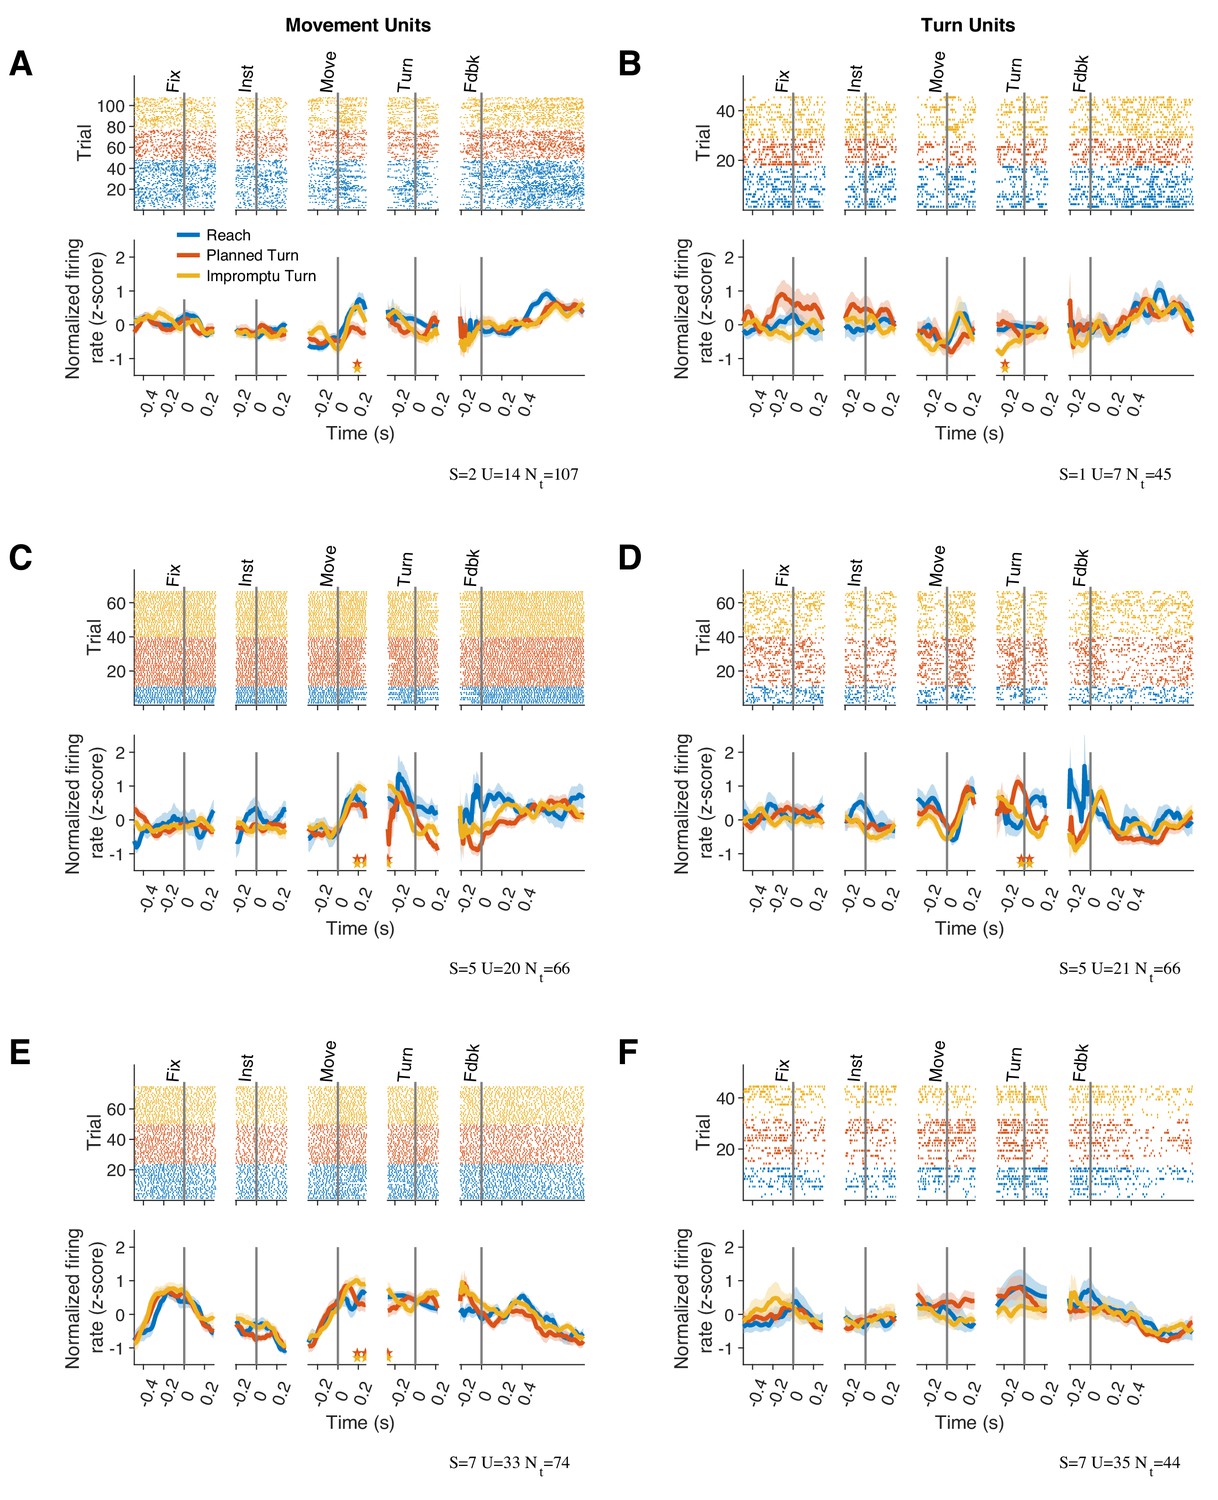
Sample units.
Raster plots and corresponding PSTHs of three example Movement Units (A, C, E) and three example Turn Units (B, D, F). Conventions are the same as in Figure 2A–D. Horizontal pairs of colored stars indicate times with significantly different firing rates for the corresponding pairs of trial types (p<0.1, cluster mass test). S and U indicate subject identity for each unit. Nt indicates the total number of trials for each unit.
Figure 2—figure supplement 2
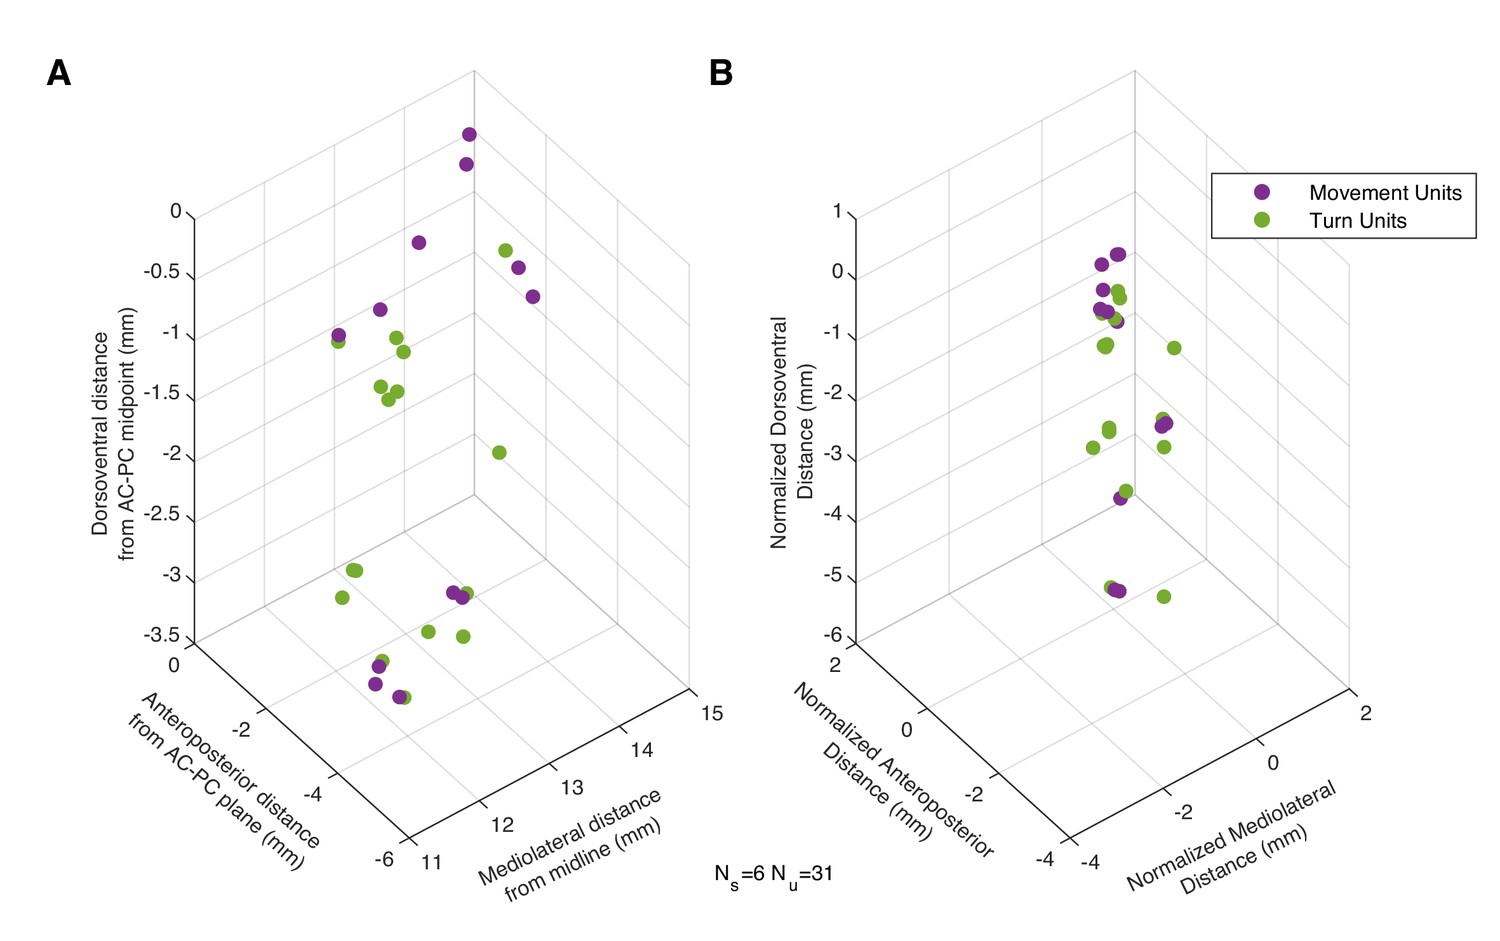
Unit locations.
The locations of all recorded units in AC-PC coordinates (A) and coordinates normalized to the electrophysiologic entry point of STN (Sharott et al., 2014) (B). Positive numbers are lateral, anterior, and superior on the x-, y-, and z-axes, respectively. Ns and Nu indicate the number of subjects and number of units represented. Coordinates were not available for eight units. Units recorded from the same location are offset a small distance for display purposes.
Figure 3 with 1 supplement
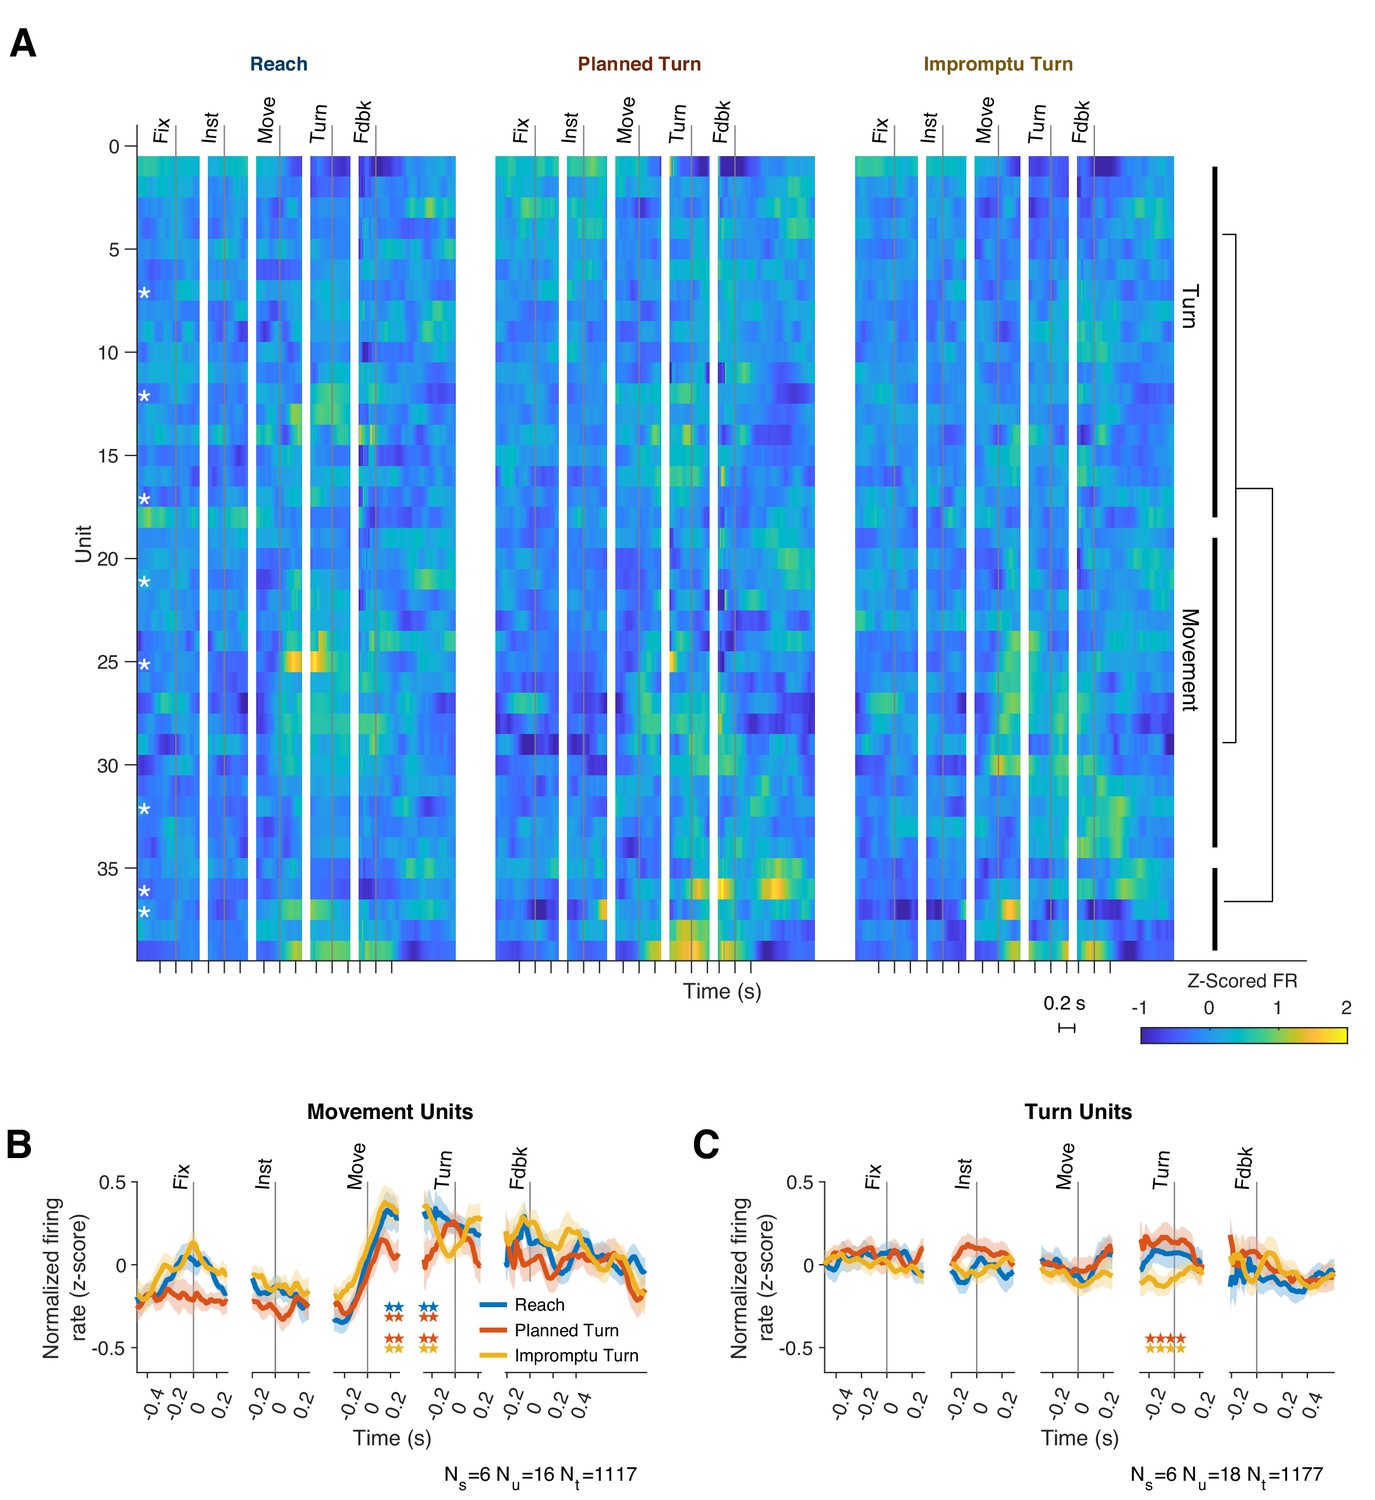
Two functional groups of neurons with distinct response dynamics.
(A) Normalized responses of all recorded units. Hierarchical clustering of responses revealed two dominant functional groups: Movement Units (41%) and Turn Units (46%). White asterisks indicate single units, which are not clustered together. Example units from each group are shown in Figure 2—figure supplement 1. (B, C) The mean PSTHs across the two functional groups. Horizontal pairs of colored stars indicate times with significantly different firing rates for the corresponding pairs of trial types (p<0.05, Holm–Bonferroni corrected linear mixed effect models). Ns, Nu, and Nt indicate the number of subjects, units, and trials represented.
Figure 3—figure supplement 1

Firing rate responses aligned to cues and movements.
Mean firing rates aligned to the go and turn cues (A, B) and to the movement and turn onsets (C, D) for Movement Units and Turn Units. Horizontal pairs of colored stars indicate times with significantly different firing rates for the corresponding pairs of trial types (p<0.05, Holm–Bonferroni corrected linear mixed effect models).
Figure 4 with 4 supplements
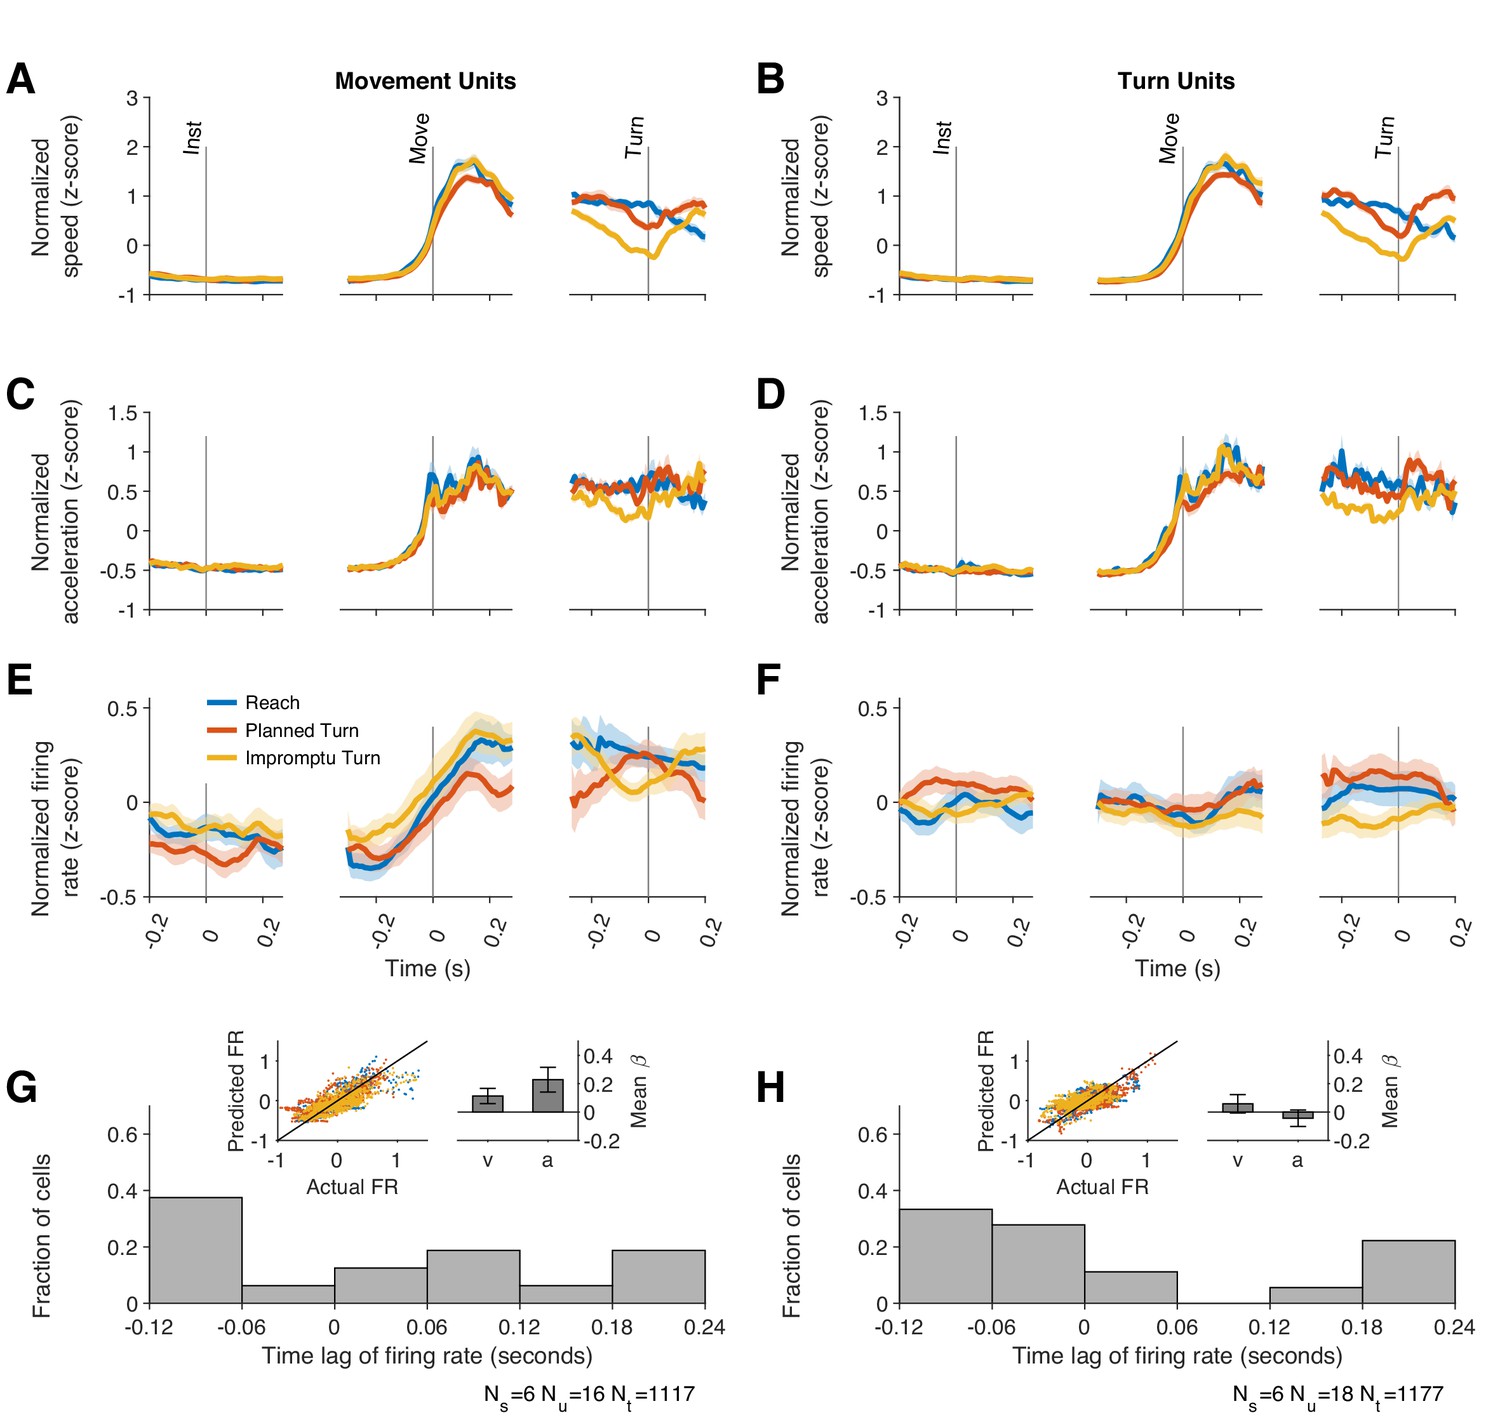
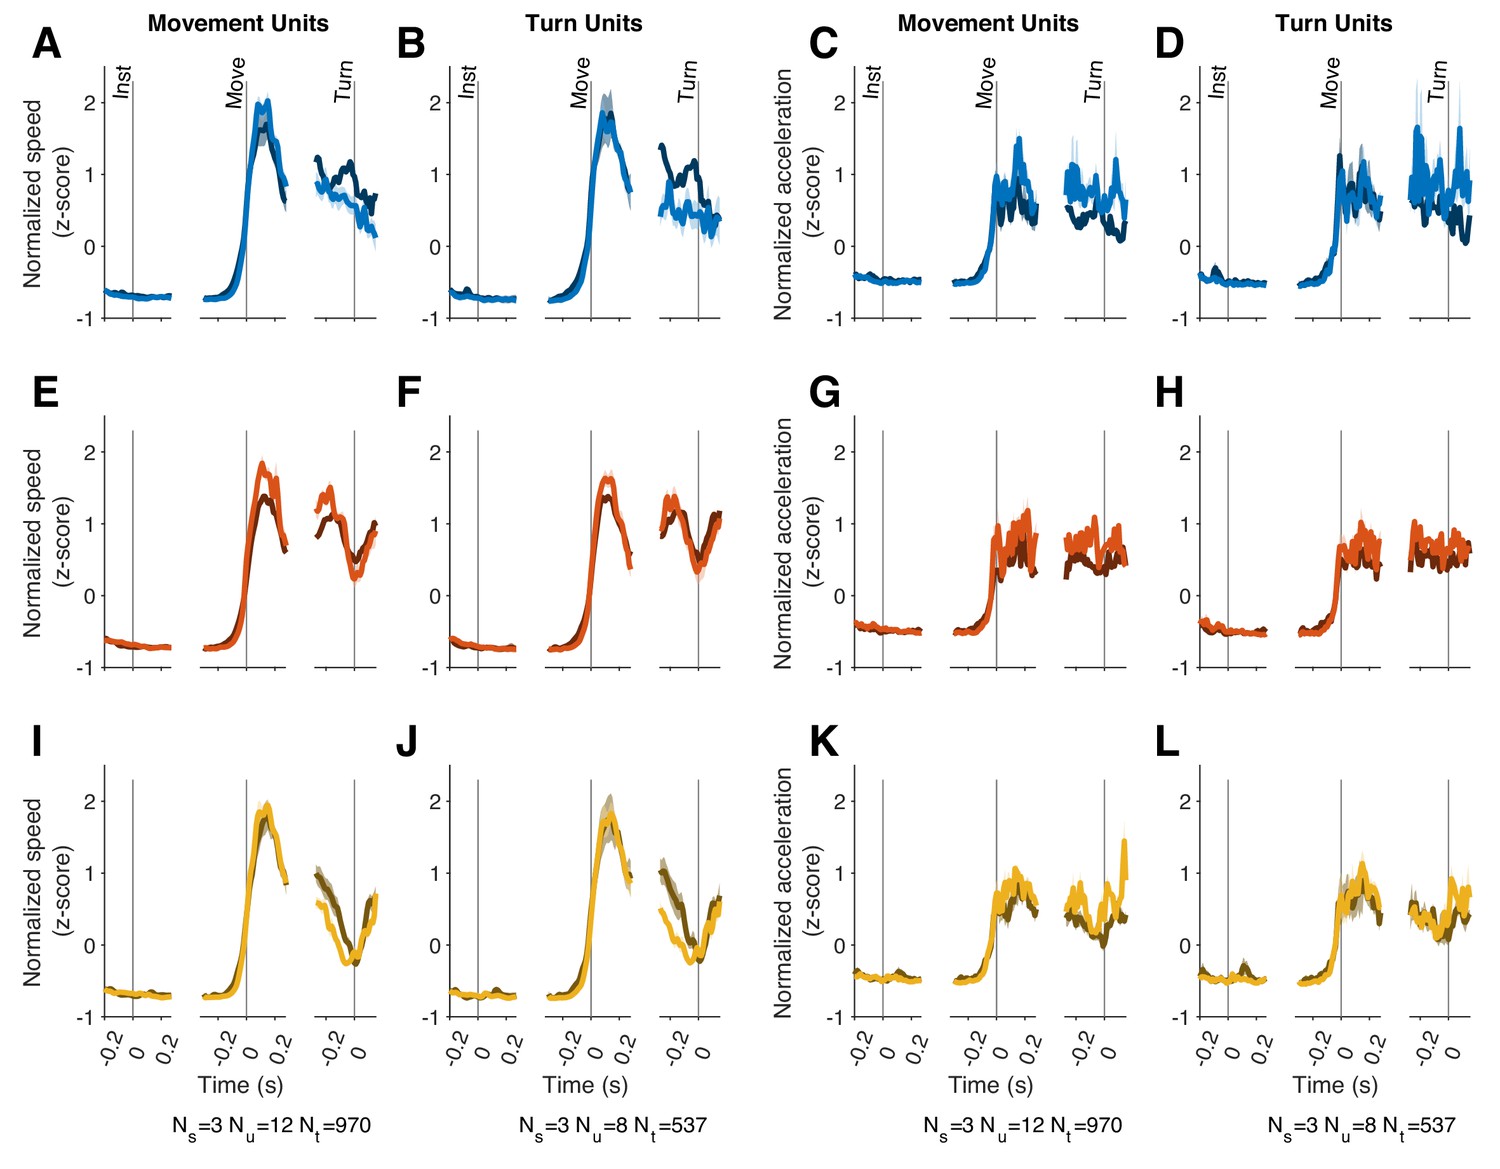
Firing rates of Movement Units reflect kinematic parameters of past, ongoing, and future movements.
(A, B) Average movement speed during recordings from Movement and Turn Units. Movement speed was z-scored across trials of each session before averaging across sessions. (C, D) Average movement acceleration. (E–F) Average firing rates of Movement and Turn Units aligned to task events. These panels are identical to those in Figure 3B–C and replicated here to facilitate comparison of firing rate dynamics with changes of movement speed and acceleration. Shading indicates SE in A–F. (G–H) The firing rate of each unit was modeled as a linear function of time-lagged speed and acceleration (Equation 12). The distributions of best-fitting time lags are shown across units. Positive lags indicate that firing rates predict future movement kinematics, and negative lags indicate that firing rates reflect past movement kinematics. Insets display the actual and predicted firing rates and the regression coefficients for speed and acceleration. Error bars are 95% confidence intervals.
Figure 4—figure supplement 1
Movement speed and acceleration.
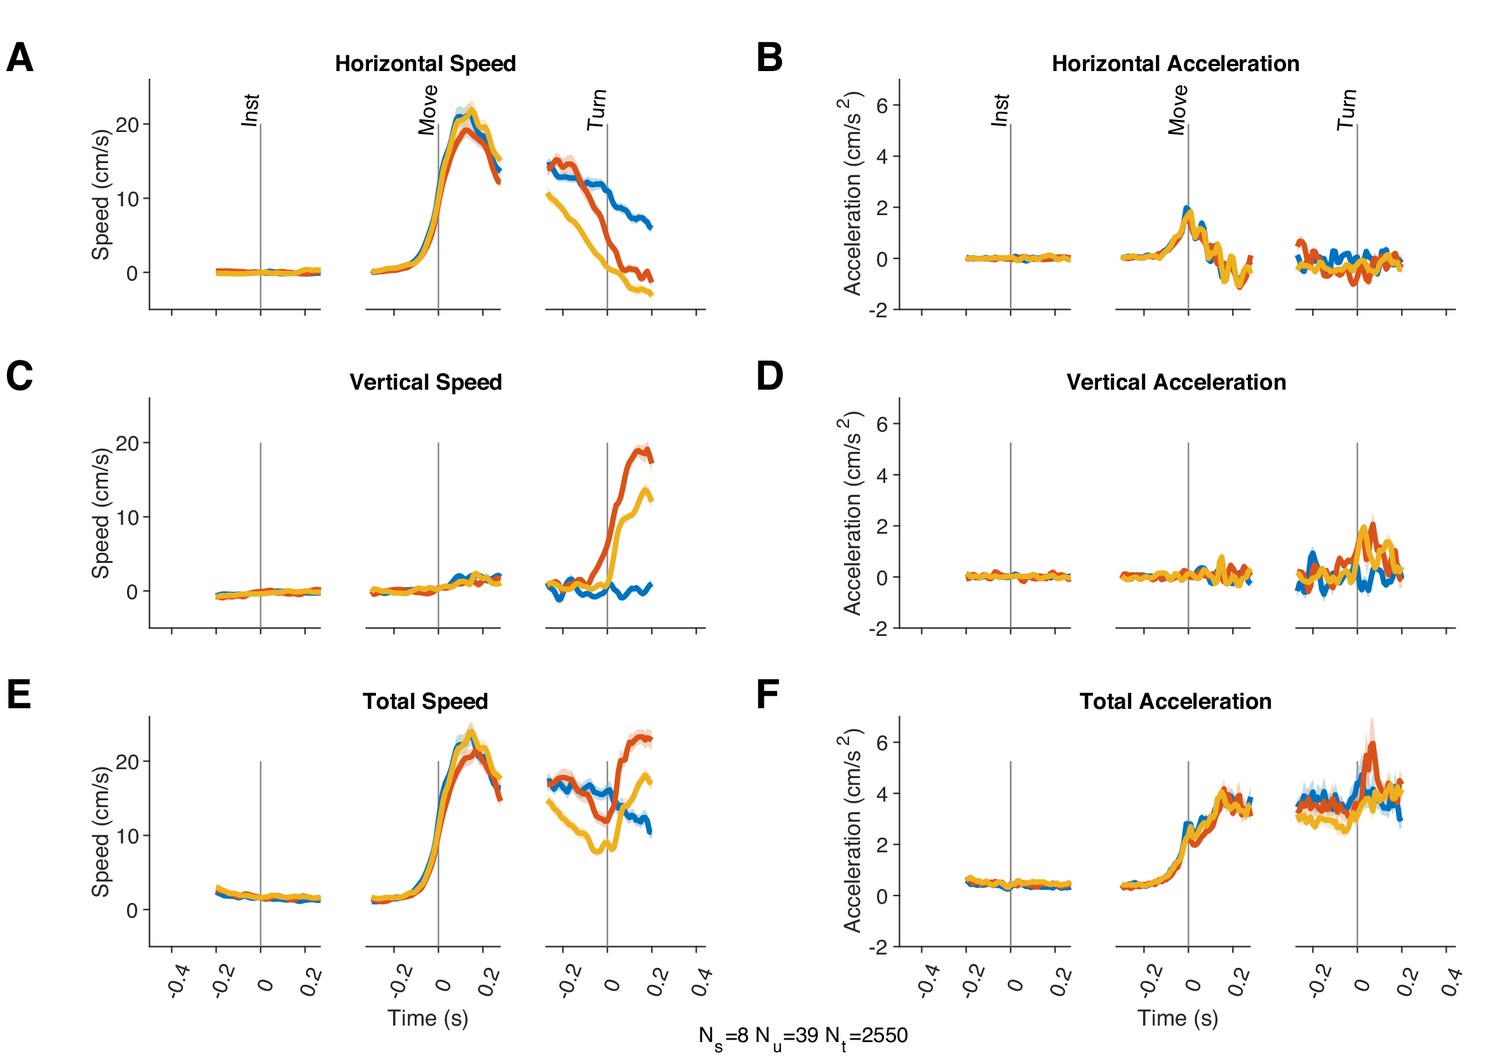
Mean speed (A,C,E) and acceleration (B,D,F) on different trial types across subjects. Total speed (E) is calculated as the Euclidean norm of the horizontal and vertical speed. Similarly, total acceleration (F) is calculated as the Euclidean norm of the horizontal and vertical acceleration. Shading indicates SE.
Figure 4—figure supplement 2
Kinematic model of firing rate responses.
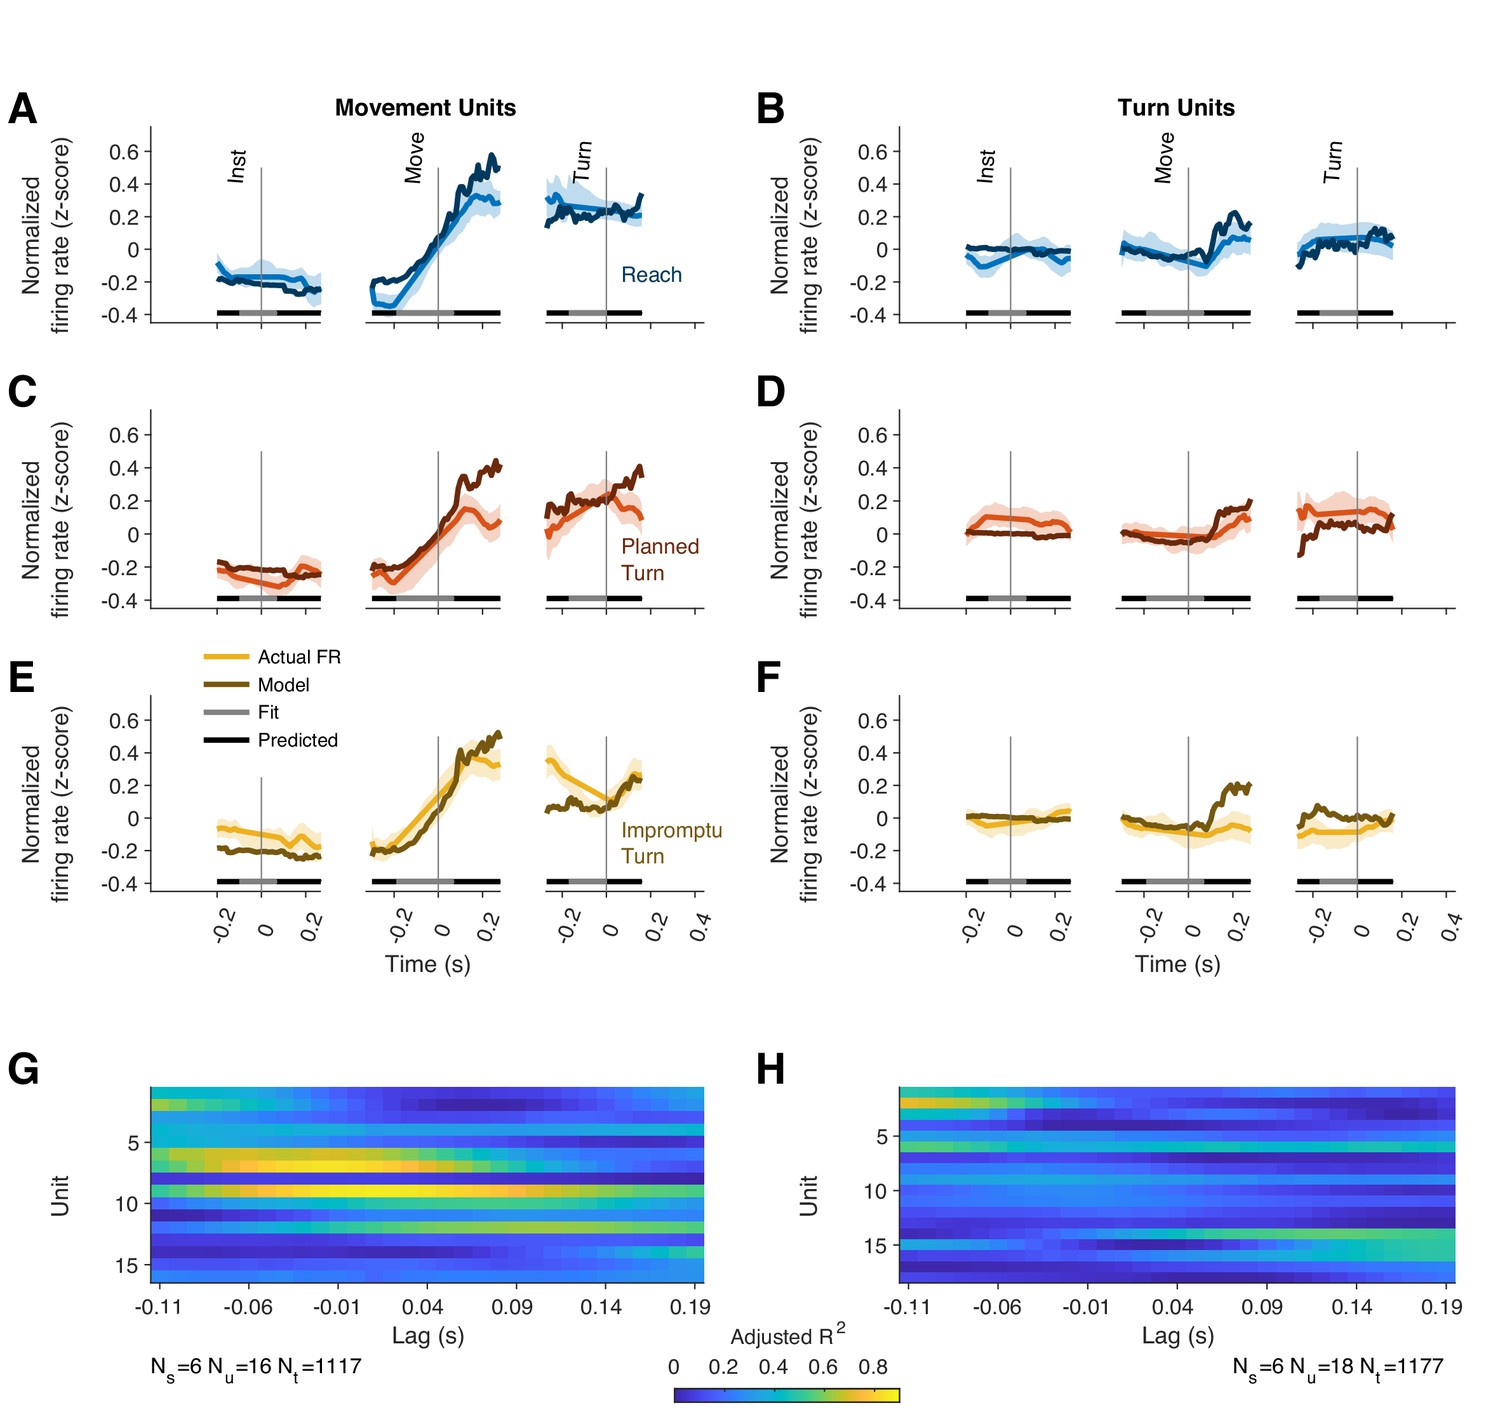
Firing rates were regressed on movement acceleration and speed. (A–F) The actual firing rates (light lines) and the model fits (dark lines) are shown for Reach (A, B), Planned Turn (C, D), and Impromptu Turn (E, F) trials. Regressions were performed on a fraction of data (time-points indicated by grey horizontal lines); out of sample firing rate predictions are shown (time points indicated by black horizontal lines). The model closely matches the data except for high predicted firing rates which correspond to high movement velocities and accelerations; this likely reflects a firing rate bound or non-linearity for fast movements that is not captured by our linear model. The fits were performed using time-lagged speed and acceleration with the lags optimized to achieve the best fit. The adjusted R2 of the fits with different time lags for different units are shown for Movement Units (G) and Turn Units (H). The highest adjusted R2 for each unit determined the best-fit time lags in Figure 4G and H.
Figure 4—figure supplement 3
Alternative models and model selection for Movement Units.
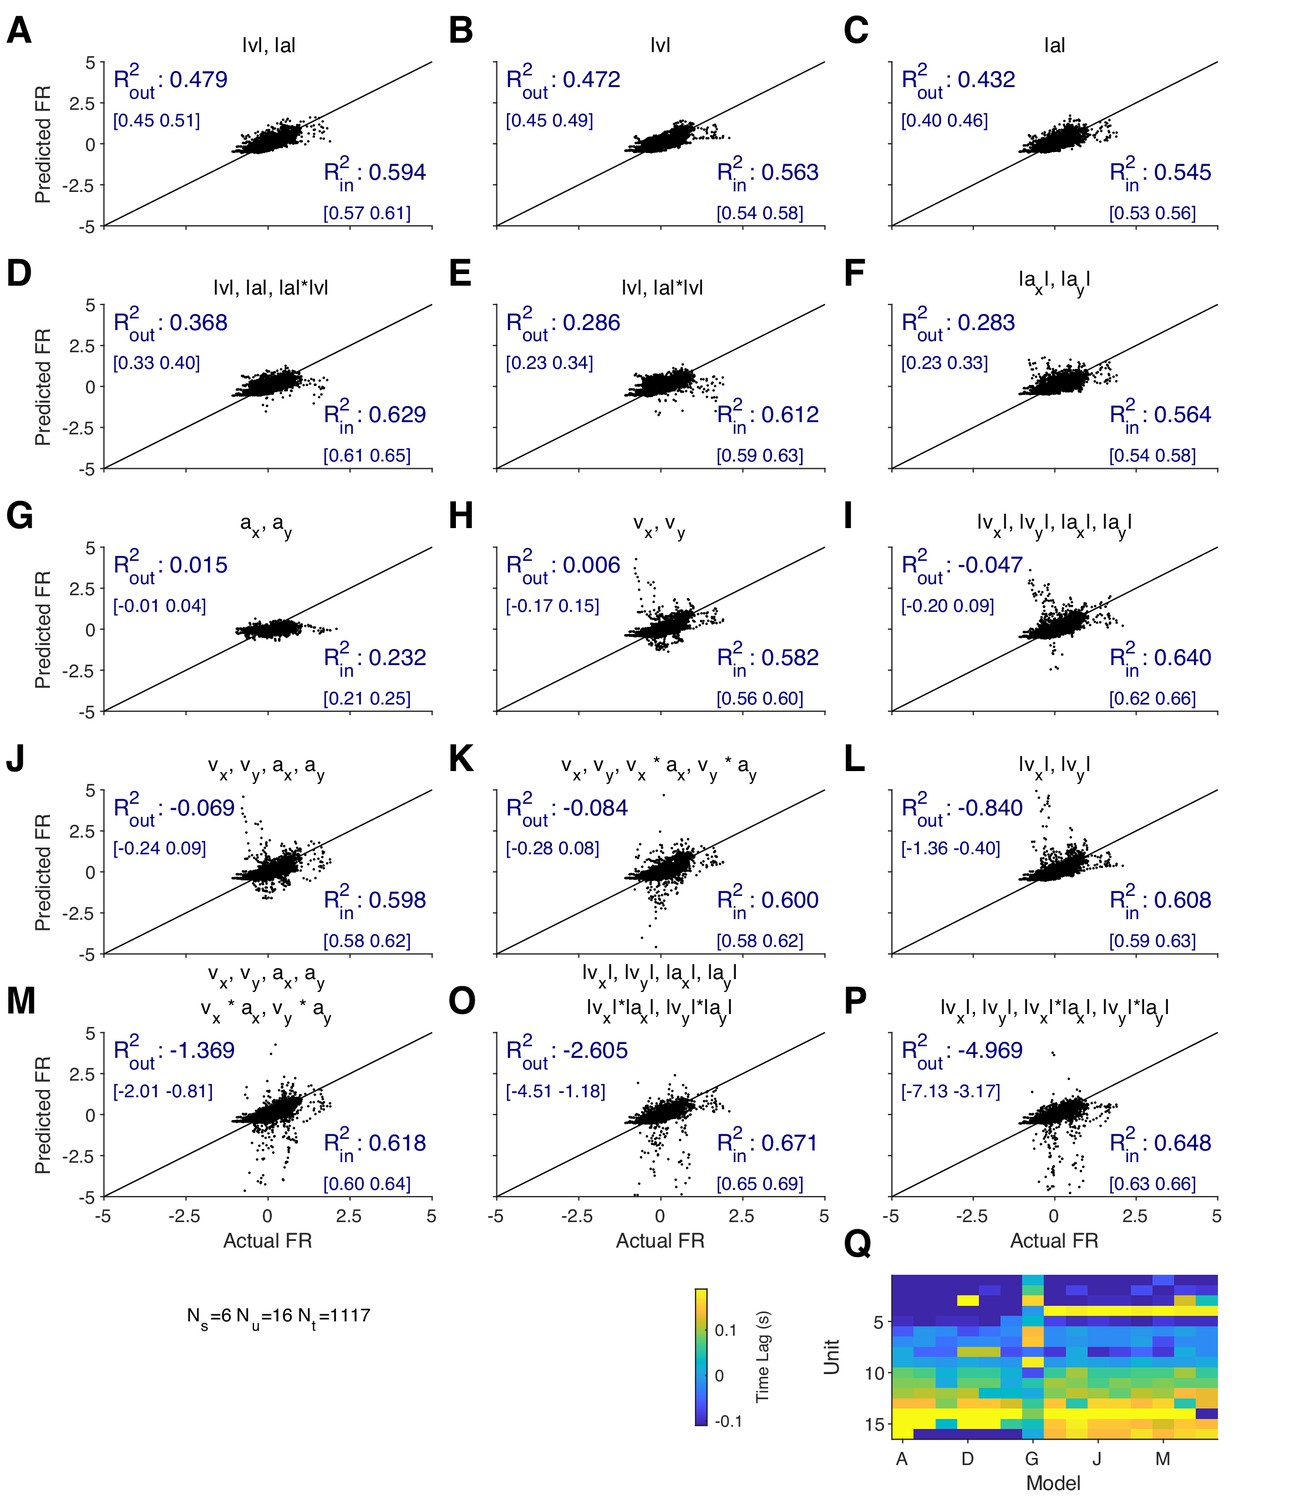
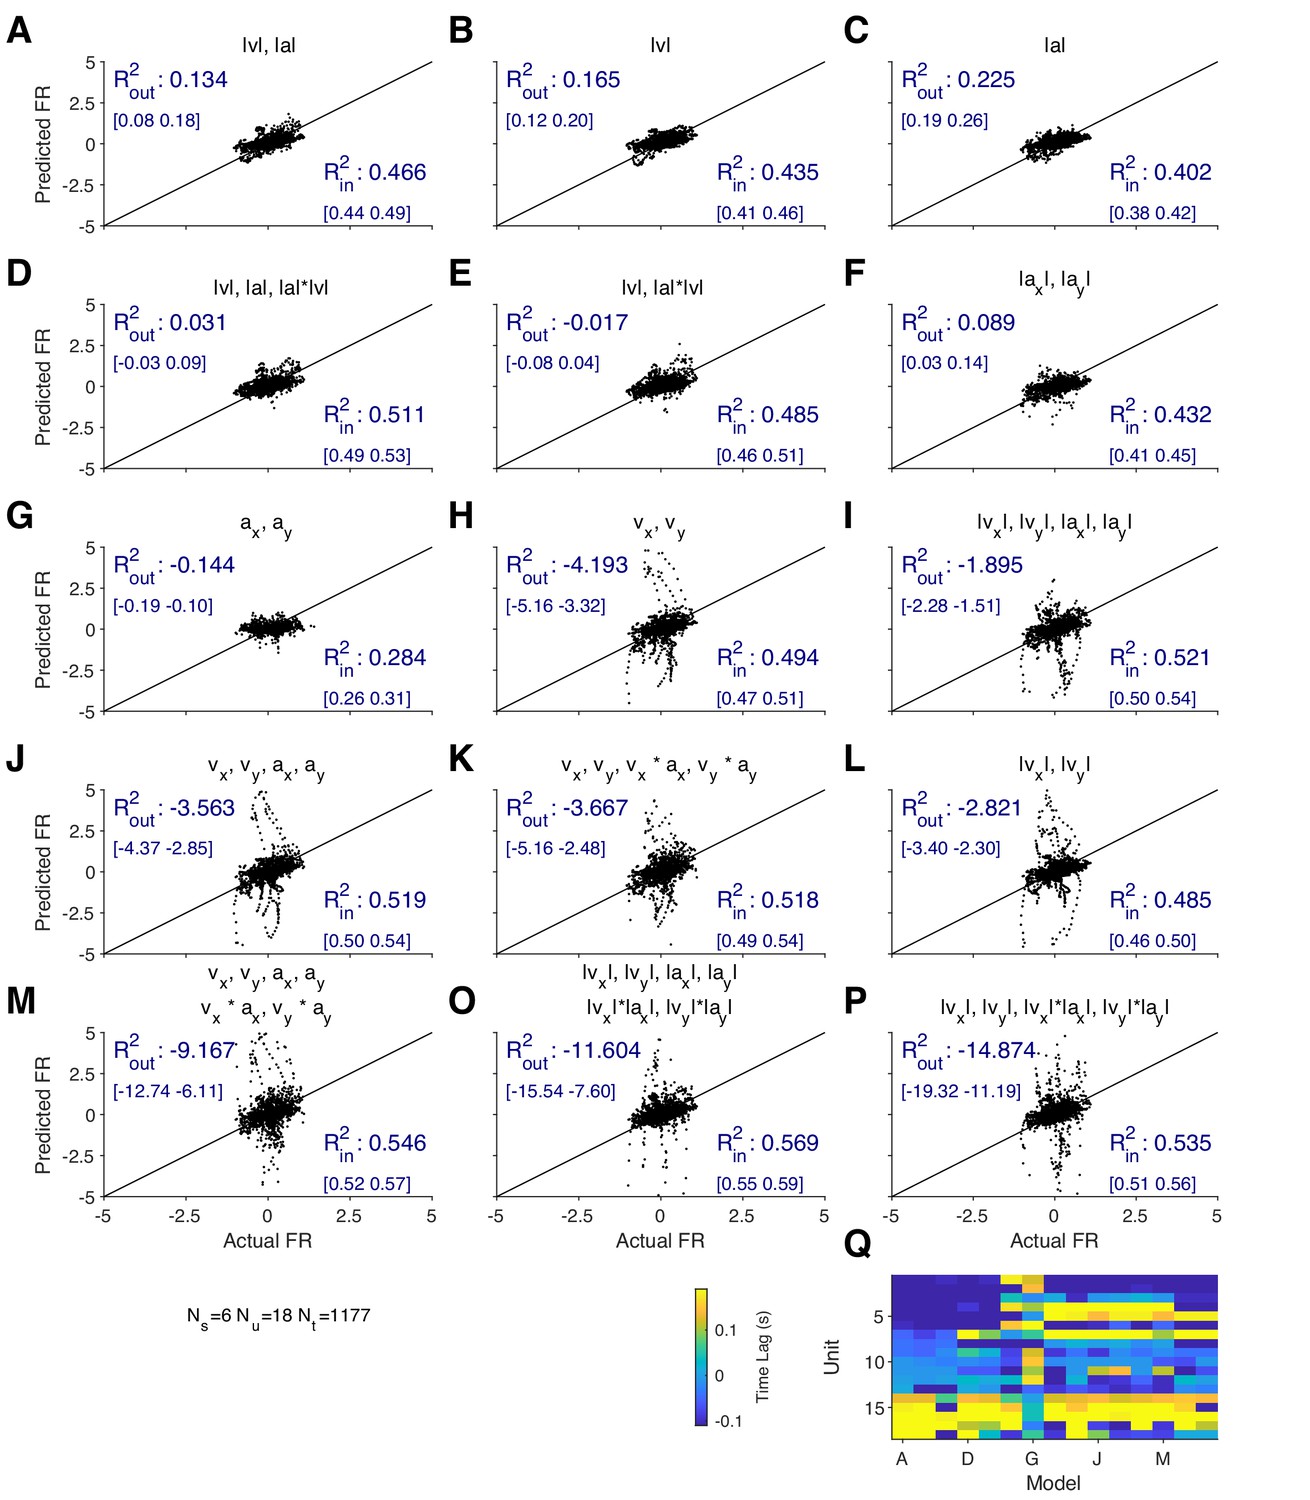
Total speed and acceleration provide a better explanation of the Movement Unit responses compared to more complex models with distinct parameters for different movement directions. (A–P) Titles of each panel indicate the parameters of each model. and indicate speed and acceleration, respectively. x and y subscripts indicate movement along the horizontal and vertical axes, respectively. indicates Euclidean norm, which equals the absolute value for one-dimensional variables (e.g., ) and the vector magnitude for two-dimensional variables (e.g., total speed). The models were trained on time points shared across all lags (grey lines in Figure 4—figure supplement 2) and tested on held-out times not included in training (dark lines in Figure 4—figure supplement 2). Training and testing are displayed for each model ( for in-sample, training data; for out-of-sample, test data). 95% confidence intervals are shown in brackets. Negative indicate residual variance that exceeds the variance of underlying data, indicating extremely poor model performance for test trials, likely due to overfitting the training data. (Q) The best-fitting time lags for each unit were similar across models. Columns correspond to models in panels A-P. Each row corresponds to a specific Movement Unit with units ordered by time lag of our chosen model (the best-fitting model containing total speed and acceleration, shown in panel A).
Figure 4—figure supplement 4
Alternative models and model selection for Turn Units.
Turn Unit firing rates have some correlation with total speed and acceleration. Figure format (A-Q) as in Figure 4—figure supplement 3.
Figure 5 with 2 supplements
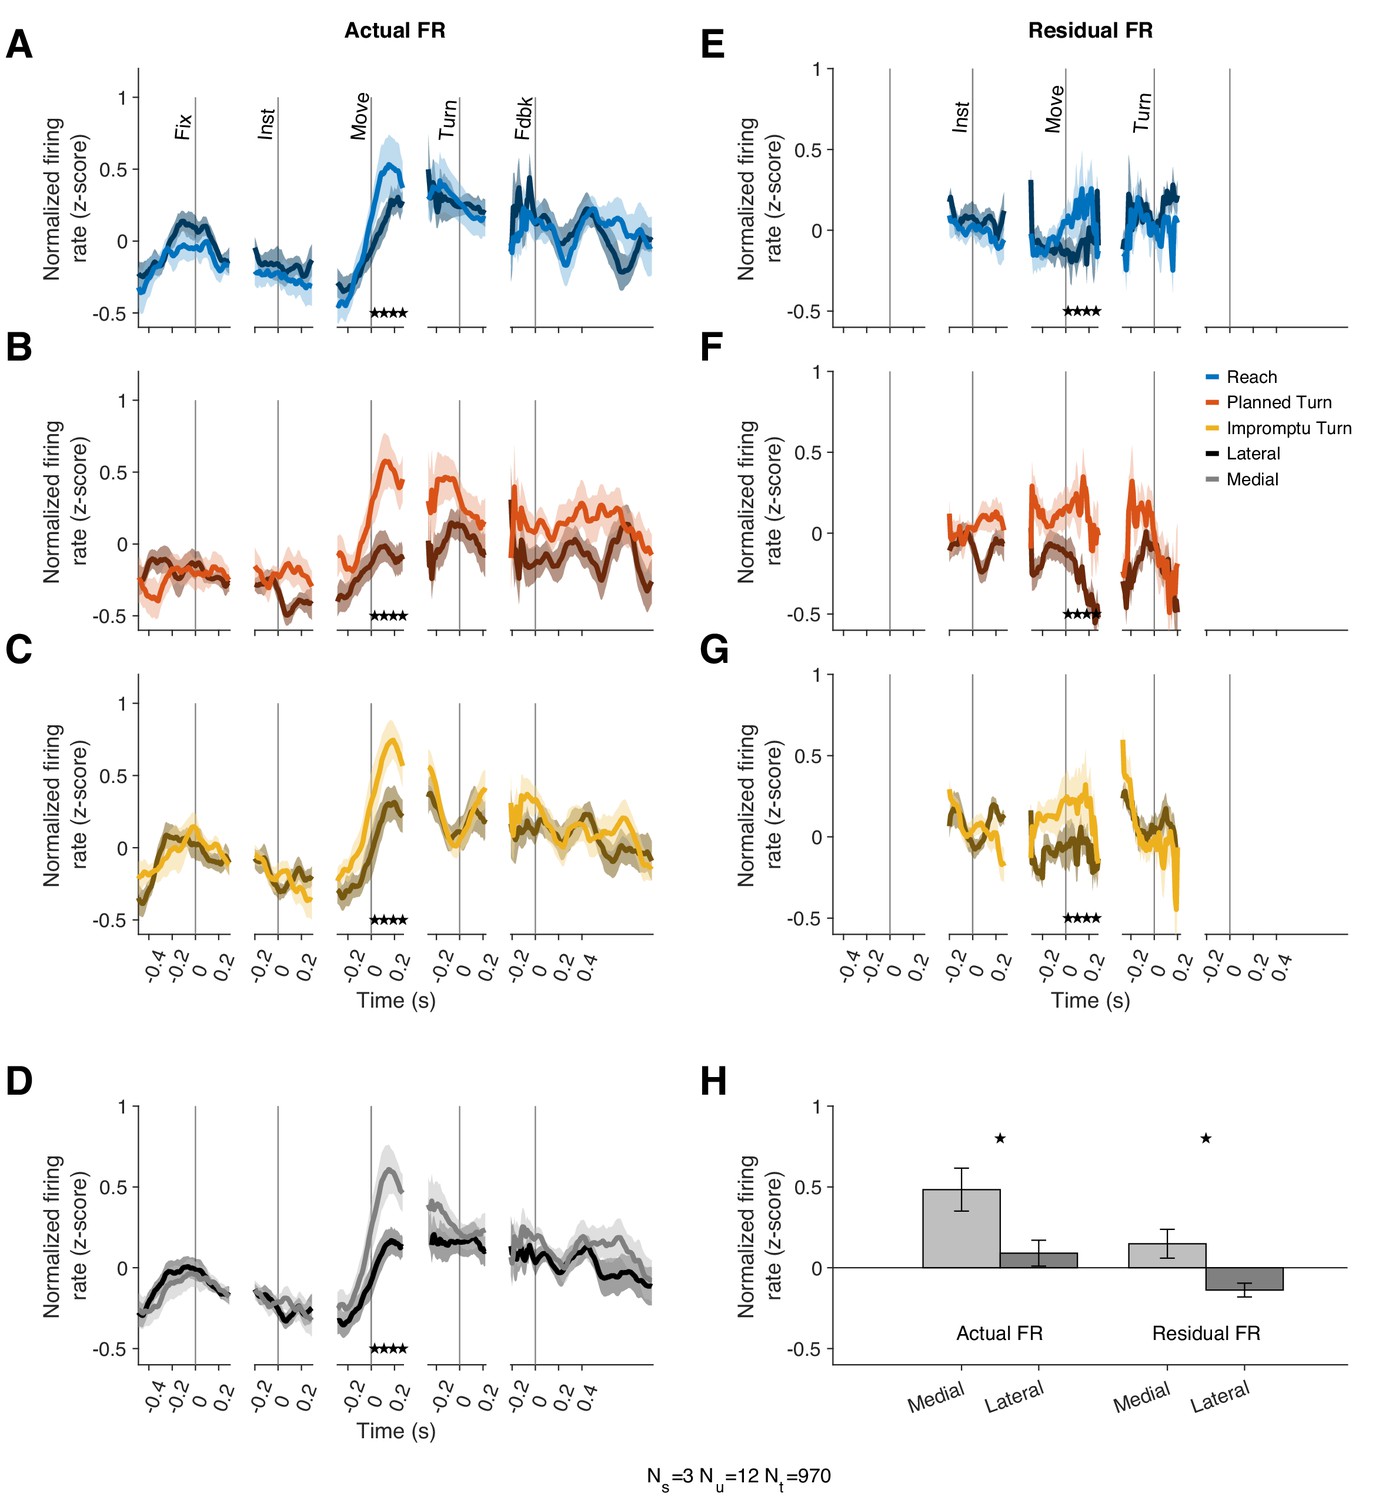
Movement Units have higher firing rates at the onset of medial movements.
(A–C) PSTHs separated by trial type and medial (lighter shades) vs lateral movements (darker shades). Stars denote times with statistically significant differences between medial and lateral movements. (D) Average PSTHs for medial and lateral movements across all trial types. (E–G) Residual firing rate PSTHs for different trial types after regressing out kinematic effects. (H) Average firing rates in a window starting 10 ms before and ending 270 ms after movement onset. Stars denote p<0.05 (linear mixed effect model). Error bars in all panels are SE.
Figure 5—figure supplement 1
Kinematics of medial and lateral trials.
Speed and acceleration are similar on medial (lighter color) compared to lateral trials. Speeds are plotted in the left two columns and accelerations in the right two columns. Rows represent Reach (A-D), Planned Turn (E-H), and Impromptu Turn (I-L) trials. Shading is SE.
Figure 5—figure supplement 2
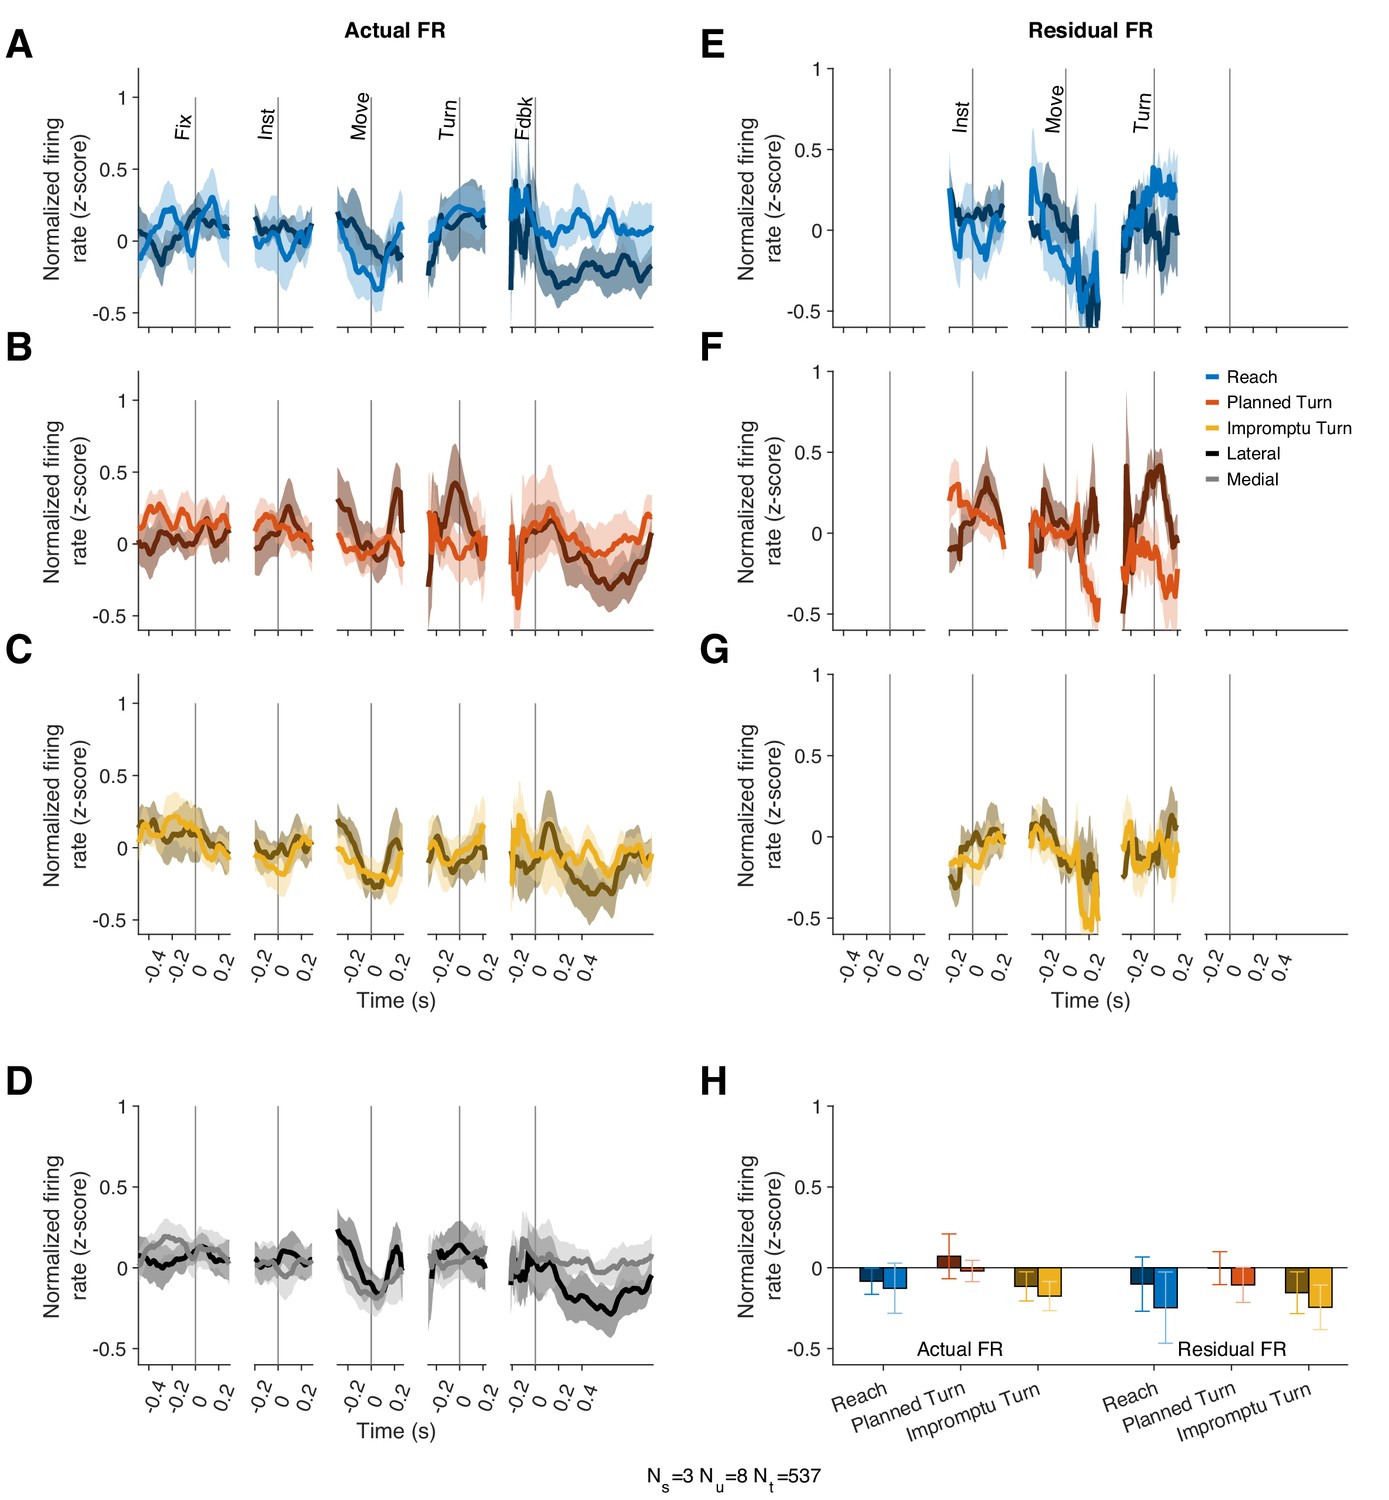
Turn units do not encode movement direction.
There were no significant differences between firing rates on medial and lateral trials on Turn Units (no significant clusters identified by cluster mass test). Figure panels (A-H) are data from Turn Units arranged analogously to Figure 5. Mean firing rates in (H) are across the same time interval as in Figure 5H.
Figure 6
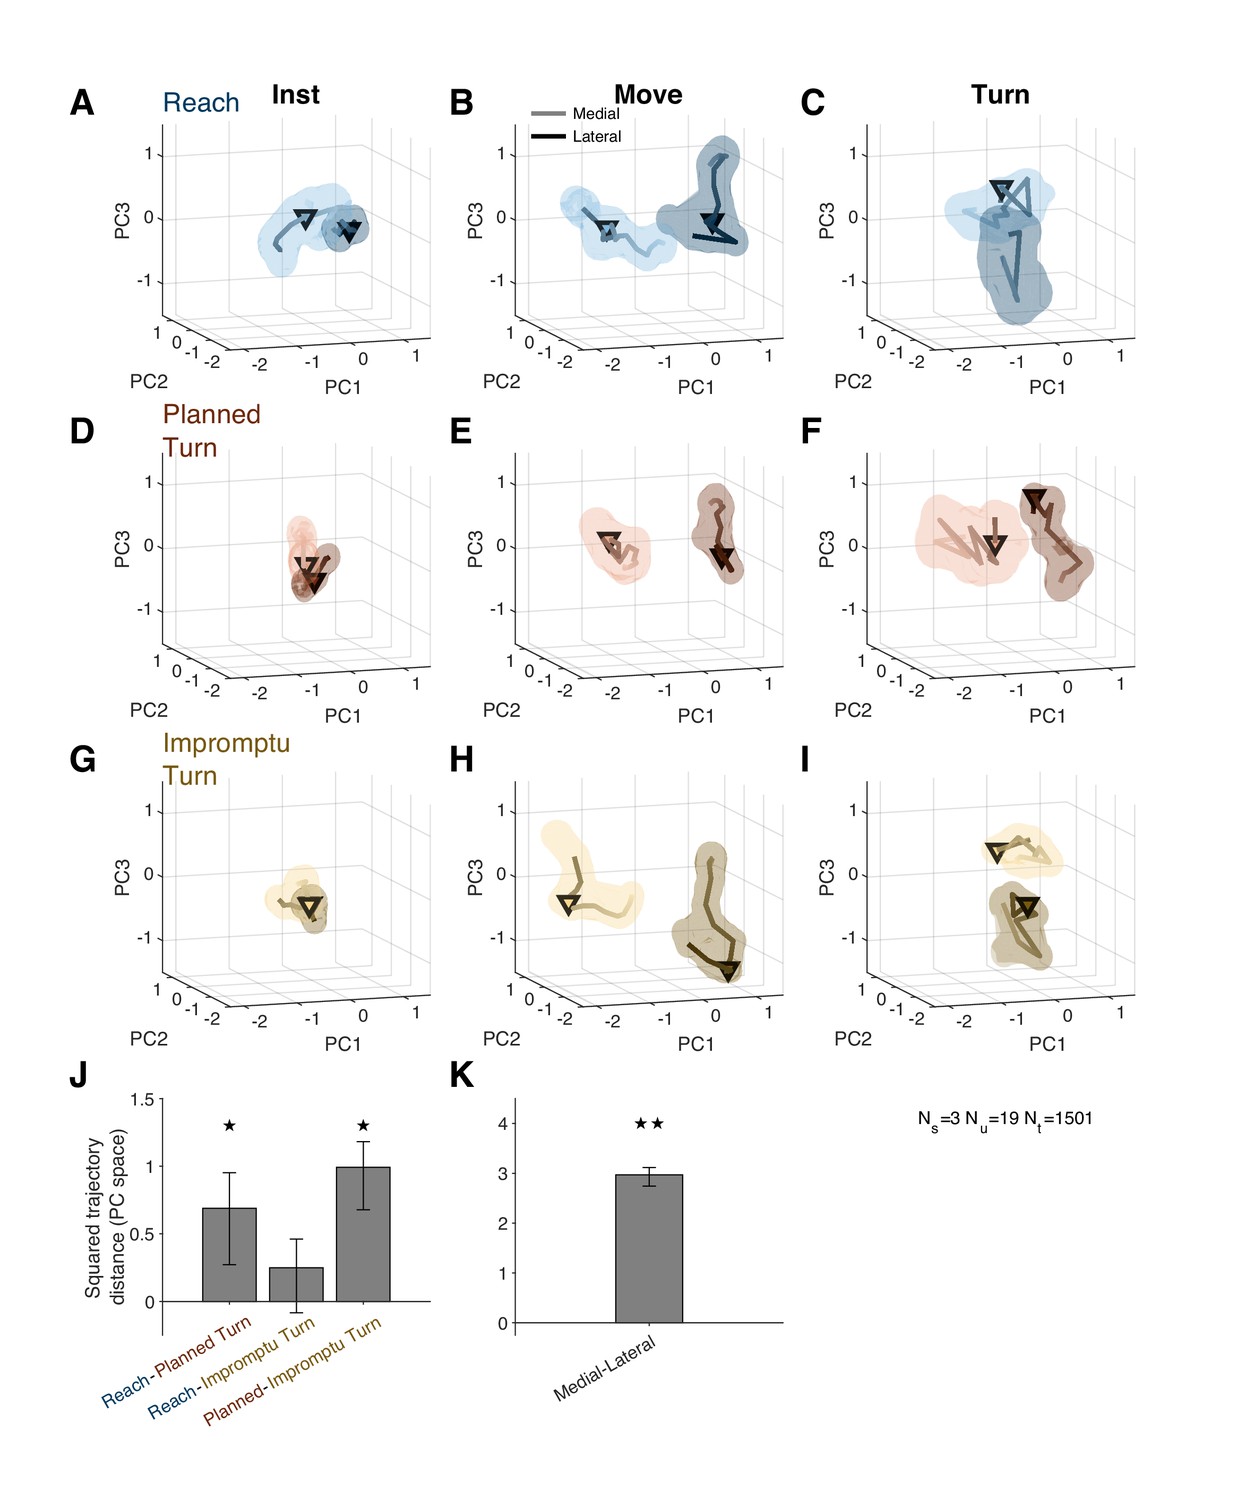
Distinct population response dynamics for different movement directions and trial types.
(A–I) Residual firing rate trajectories in 3D principal component space for different trial types and around different task events. Later times are indicated by darker colors. Pairs of trajectories in each panel correspond to medial and lateral trials. Triangles indicate alignment times: instruction (first column), movement onset (second column), and turn onset (third column). Shading indicates standard error. (J) Mean squared distance of trajectories of pairs of trial types around movement onset relative to that expected by chance. A distance equal to zero indicates that the difference is not distinct from chance. (K) Mean squared distance between medial and lateral trajectories around movement onset relative to that expected by chance. The distance is aggregated across all trial types. ★ and ★★ indicate p<0.05 and p<0.001, respectively (permutation test). Error bars are 95% confidence intervals.
Figure 7 with 1 supplement

STN units fire in synchrony with beta oscillations except during the movement phase of the task.
(A–F) Pairwise-phase consistency as a function of time and frequency for Reach (A, B), Planned Turn (C, D), and Impromptu Turn (E, F) trials shows decreased synchronization between spikes and LFP in the beta range around movement onset and turn onset. (G–H) Changes of PPC within the beta band aligned to task events. Shading indicates SE. There was no significant difference between trial types. (I, J) Box plots show the median and interquartile range of the beta band PPC across all trial types in the analysis windows for each task event. Whiskers indicate the range of the data excluding outliers, which are defined as more extreme than 1.5× IQR outside of the IQR (stars indicate PPC significantly different from 0, p<0.05, Holm–Bonferroni corrected Wilcoxon signed-rank test).
Figure 7—figure supplement 1
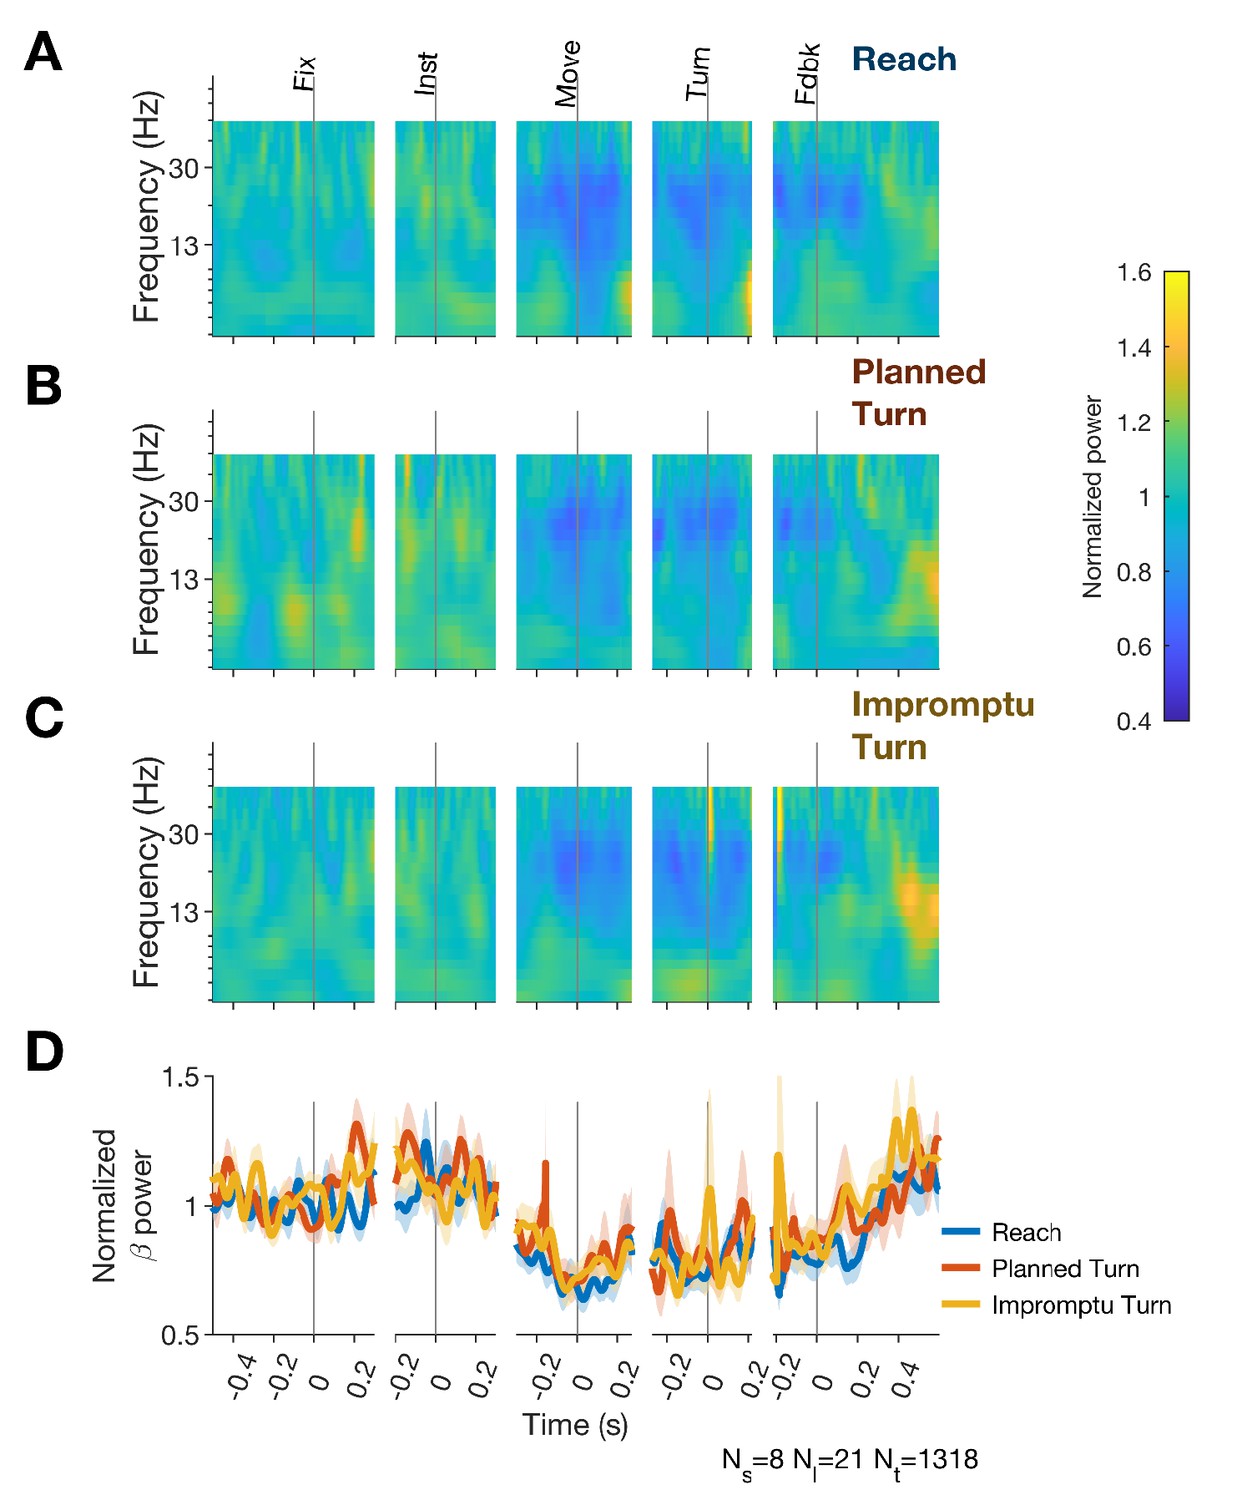
LFP responses.
Induced power spectrograms (A–C) and induced power in the beta range (D) aligned to task events are shown for different trial types. Induced power decreases from baseline beginning before movement onset and lasting until after feedback. There were no significant differences between trial types (no significant clusters identified by cluster mass test). Ns, Nl, and Nt indicate the number of subjects, recording locations, and trials.
Videos
Video 1
State space trajectories for firing rate displayed separately for Reach, Planned Turn, and Impromptu Turn trials.
Shading indicates standard error. PC2 distinguishes different trial types the least and is omitted from these plots for clarity. The first four principal components (including PC2) were included in statistical analysis of principal components data.
Video 2
State space trajectories for residual firing rate after removing the contribution of kinematics separated by trial type and direction (medial vs lateral).
Tables
Author response table 1
| Population Level Result | Fraction of Individual Units | p-value |
| Decreased firing rate of Movement Units on Planned Turn trials compared to Impromptu Turn trials, 140 ms after movement onset to 130 ms before turn onset (Figures 2B, 3B) | 0.38 (6/16) | 5.0 × 10⁻⁴(binomial test) |
| Decreased firing rate of Movement Units on Planned Turn trials compared to Reach trials 140 ms after movement onset to 130 ms before turn onset (Figure 2B, 3B) | 0.13(2/16) | 0.21(binomial test) |
| Decreased firing rate of Turn Units on Impromptu Turn trials compared to Planned Turn trials 240 ms before to 80 ms after turn onset (Figure 2D, 3C) | 0.33(6/18) | 0.0012(binomial test) |
| Decreased firing rate of Movement Units on lateral trials compared to medial trials 10 ms before to 270 ms after movement onset (Figure 5) | 0.67(8/12) | 1.7 × 10⁻⁷(binomial test) |
Author response table 2
| Figure | Unique subjects | Units | Trials |
| 1 | 8 | N/A | 913 |
| 2A,C (example unit) | 1 | 1 | 107 |
| 2B,D (example unit) | 1 | 1 | 45 |
| 2E-H | 8 | 39 | 2550 |
| 3A | 8 | 39 | 2550 |
| 3B | 6 | 16 | 1117 |
| 3C | 6 | 18 | 1177 |
| 4 A,C,E,G | 6 | 16 | 1117 |
| 4 B,D,F,G | 6 | 18 | 1177 |
| 5 | 3 | 12 | 970 |
| 6 | 3 | 19 | 1501 |
| 7 A,C,E,G,I | 6 | 16 | 1117 |
| 7 B,D,F,H,J | 6 | 18 | 1177 |
| 2 Supplement 1 (example units) | 4 | 6 | 402 |
| 2 Supplement 2 | 6 | 31 | N/A |
| 3 Supplement 1 A,C | 6 | 16 | 1117 |
| 3 Supplement 1 B,D | 6 | 18 | 1177 |
| 4 Supplement 1 | 8 | 39 | 2550 |
| 4 Supplement 2 A,C,E,G | 6 | 16 | 1117 |
| 4 Supplement 2 B,D,F,H | 6 | 18 | 1177 |
| 4 Supplement 3 | 6 | 16 | 1117 |
| 5 Supplement 1 A,C,E,G,I,K | 3 | 12 | 970 |
| 5 Supplement 2 B,D,F,H,J,L | 3 | 8 | 537 |
| 7 Supplement 1 | 8 | N/A | 1318 |
Additional files
-
Supplementary file 1
Subject demographics.
Demographic characteristics of all patients and the number of single units and multi-units recorded from each. Our conclusions do not change if subjects 1, 2, or seven who contributed relatively more units than others are removed from the dataset.
- https://cdn.elifesciences.org/articles/64893/elife-64893-supp1-v2.docx
-
Supplementary file 2
Unit characteristics.
Characteristics of all recorded units including the number of each trial type recorded, the classification by unit type, and the baseline firing rate (inter-trial interval). The median baseline firing rate of single- and multi-units was 32.9 Hz (IQR: 18.3–53.9) and 40.4 Hz (IQR: 20.7–82.6), respectively, suggesting that most spikes recorded from multi-units originate from one single unit. Twenty of these units had a sufficient number of left-sided and right-sided trials for independent PSTHs to be calculated for these conditions. Analyses of firing rates marginalized on trial direction (Figures 5 and 6, and Figure 5—figure supplement 2) use these units.
- https://cdn.elifesciences.org/articles/64893/elife-64893-supp2-v2.docx
-
Transparent reporting form
- https://cdn.elifesciences.org/articles/64893/elife-64893-transrepform1-v2.pdf
Download links
A two-part list of links to download the article, or parts of the article, in various formats.
Downloads (link to download the article as PDF)
Open citations (links to open the citations from this article in various online reference manager services)
Cite this article (links to download the citations from this article in formats compatible with various reference manager tools)
Distinct population code for movement kinematics and changes of ongoing movements in human subthalamic nucleus
eLife 10:e64893.
https://doi.org/10.7554/eLife.64893


