The Drosophila Nab2 RNA binding protein inhibits m6A methylation and male-specific splicing of Sex lethal transcript in female neuronal tissue
- Department of Biology, Emory University, United States
- Department of Cell Biology Emory University School of Medicine, United States
- Graduate Program in Genetics and Molecular Biology, Emory University, United States
- Graduate Program in Biochemistry, Cell and Developmental Biology, Emory University, United States
- Emory Institutional Research and Academic Career Development Award (IRACDA), Fellowships in Research and Science Teaching (FIRST) Postdoctoral Fellowship, United States
- Department of Biochemistry, Duke University School of Medicine, United States
- Department of Neurobiology, Duke University School of Medicine, United States
Figures
Figure 1 with 1 supplement
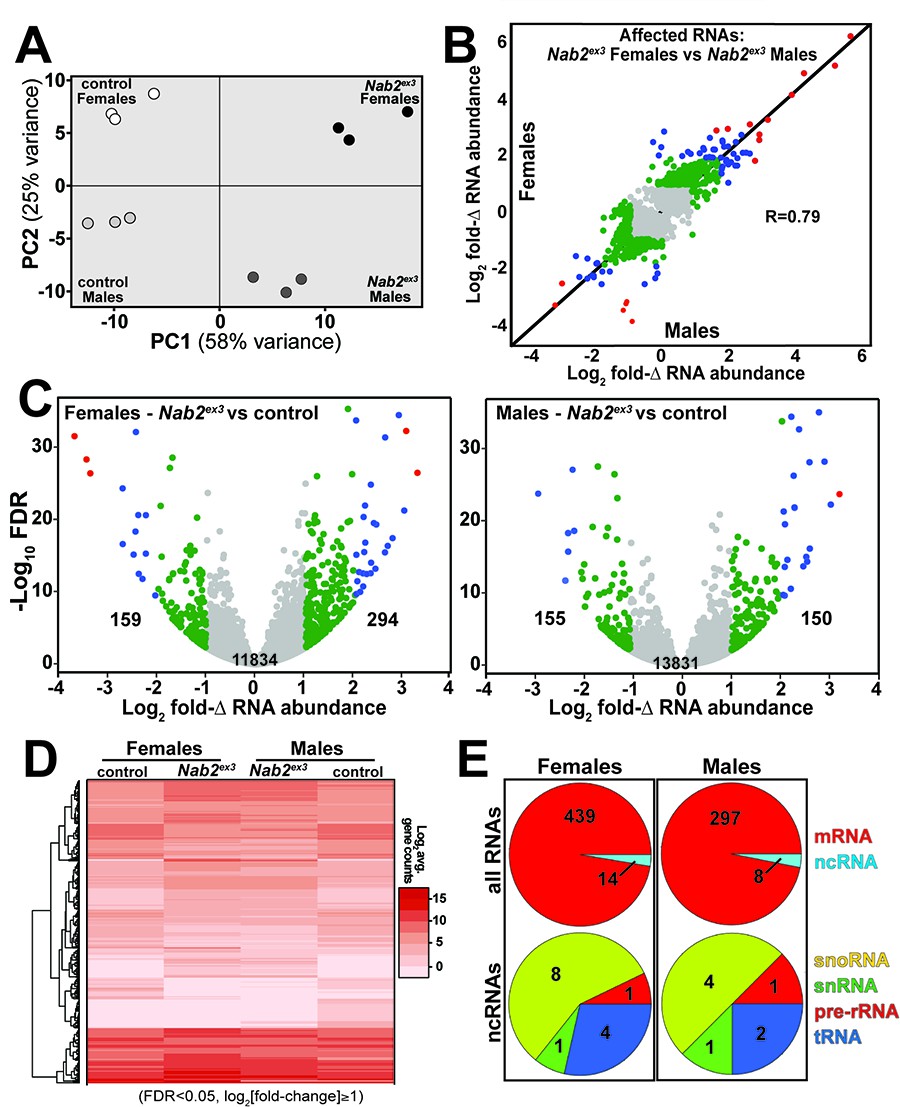
RNA sequencing detects effects of Nab2 loss on the head transcriptome.
(A) Principal component analysis (PCA) of RNA-seq data from three biological replicates of control and Nab2 mutant (Nab2ex3) male and female heads. (B) Correlation scatter plot of log2 fold change (Δ) in abundance of affected RNAs in males and females (log2 average gene counts: gray < 1, 1 ≤ green < 2, 2 ≤ blue < 3, red ≥ 3). (C) Volcano plots of fold-Δ in abundance vs. false discovery rate (FDR -log10) of affected RNAs in Nab2ex3 females and males (dot plot color coding as in B). Elevated (1), reduced (–1), and total RNAs are indicated. (D) Heatmap comparison of significantly changed gene counts (FDR < 0.05;|log2 fold-Δ| 1) in Nab2ex3 females and males vs. sex-matched controls. (E) Pie chart distribution of RNA classes among significantly affected RNAs detected in (C) and (D).
Figure 1—figure supplement 1
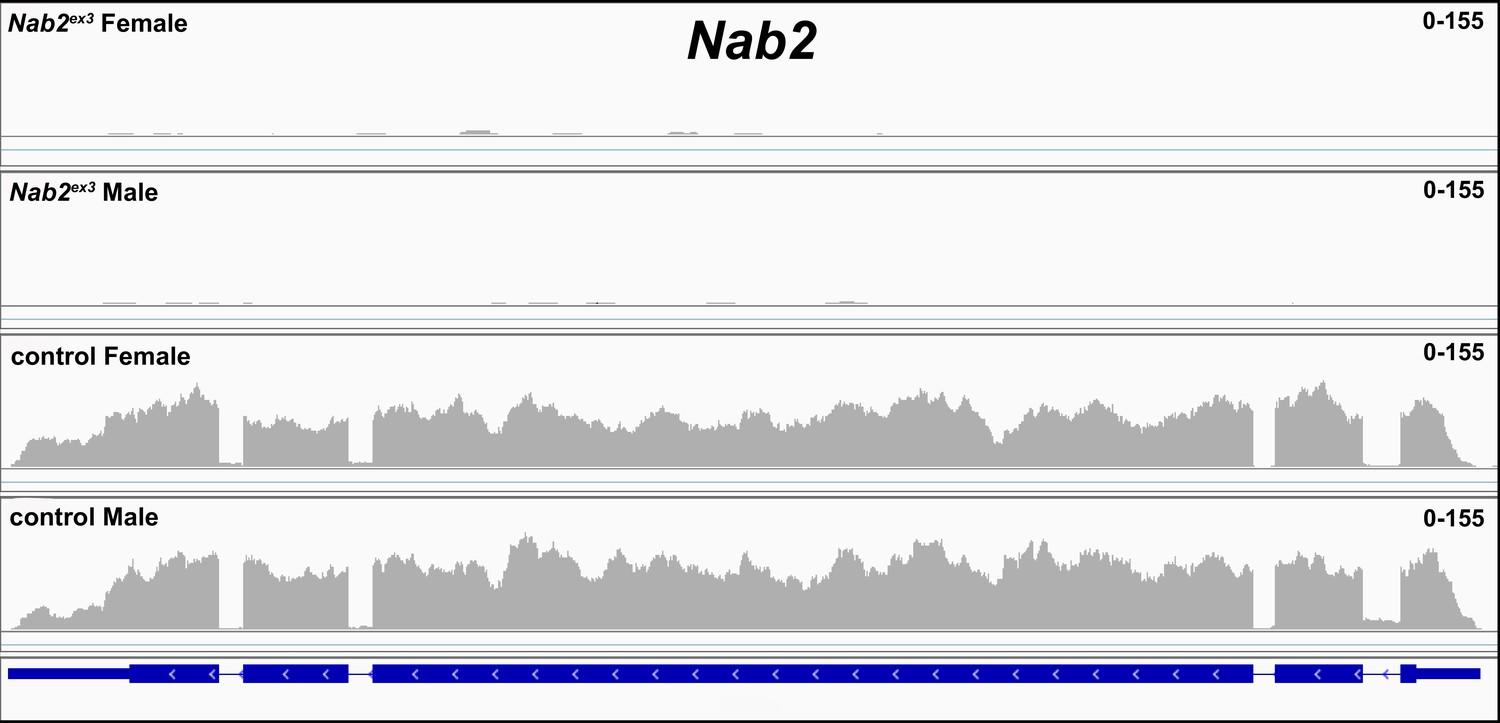
RNA sequencing reads across the Nab2 locus.
Integrative Genomics Viewer (IGV) image of RNA sequencing reads across the Nab2 locus in Nab2ex3 (top tracks) and control (Nab2pex41) adult female and male heads. Intron-exon structure is indicated at bottom. Read depth scale is indicated (0–155).
Figure 2 with 1 supplement
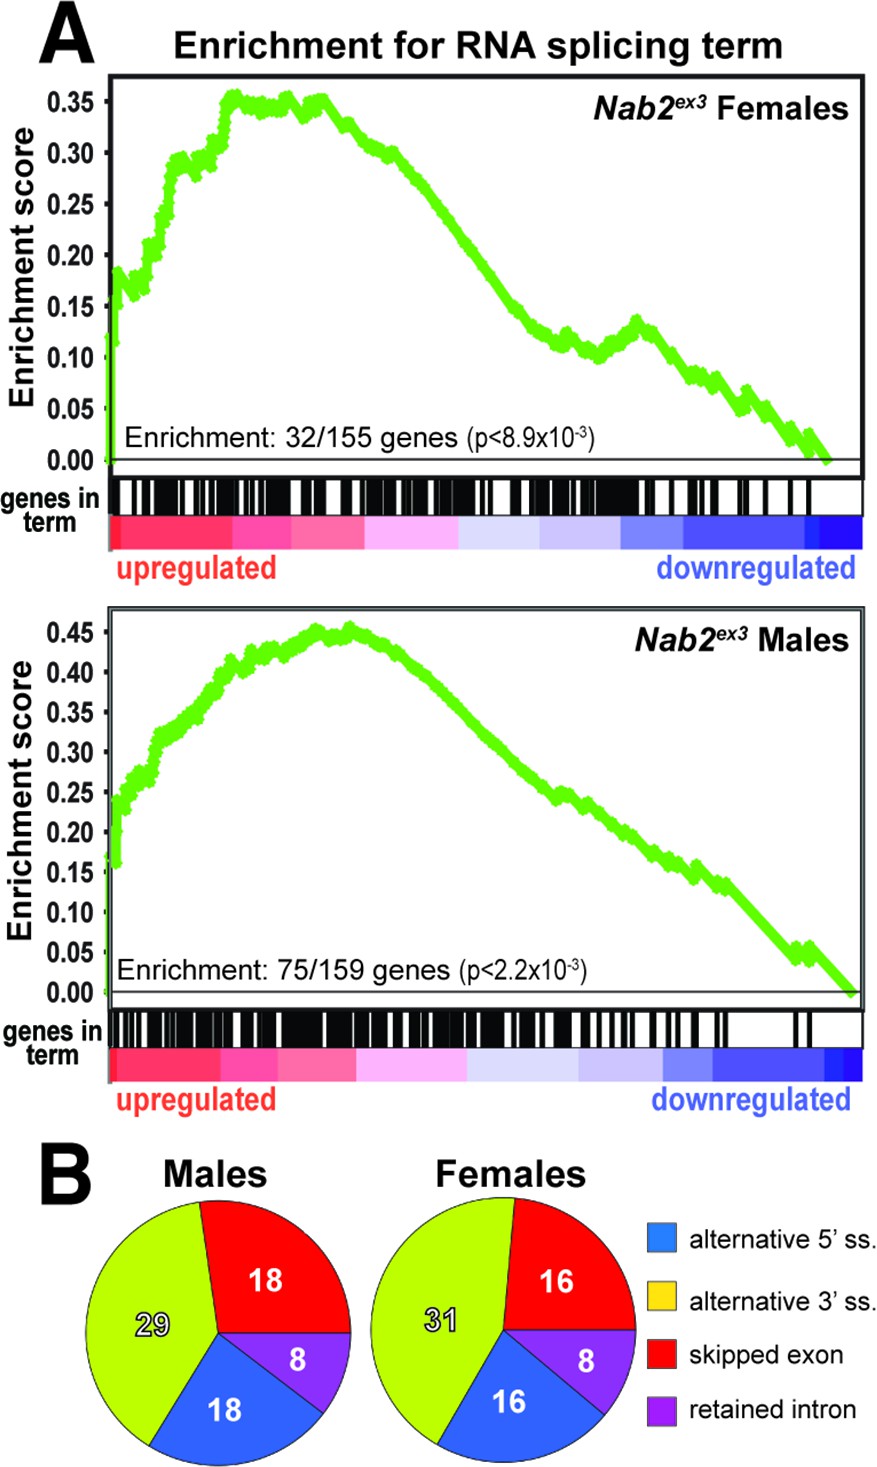
Significantly up-/downregulated RNAs in Nab2ex3 heads are enriched for predicated splicing factors.
(A) Gene Set Enrichment Analysis (GSEA) detects enrichment for the ‘RNA splicing’ Gene Ontology (GO) term in up- and downregulated gene sets in both female (top) and male (bottom) Nab2ex3 datasets. Gene enrichments are indicated with corresponding p-values. (B) Pie chart illustrating the distribution of previously annotated alternative splicing RNA splicing events that are significantly altered in Nab2ex3 mutant female and male heads (ss = splice site).
Figure 2—figure supplement 1
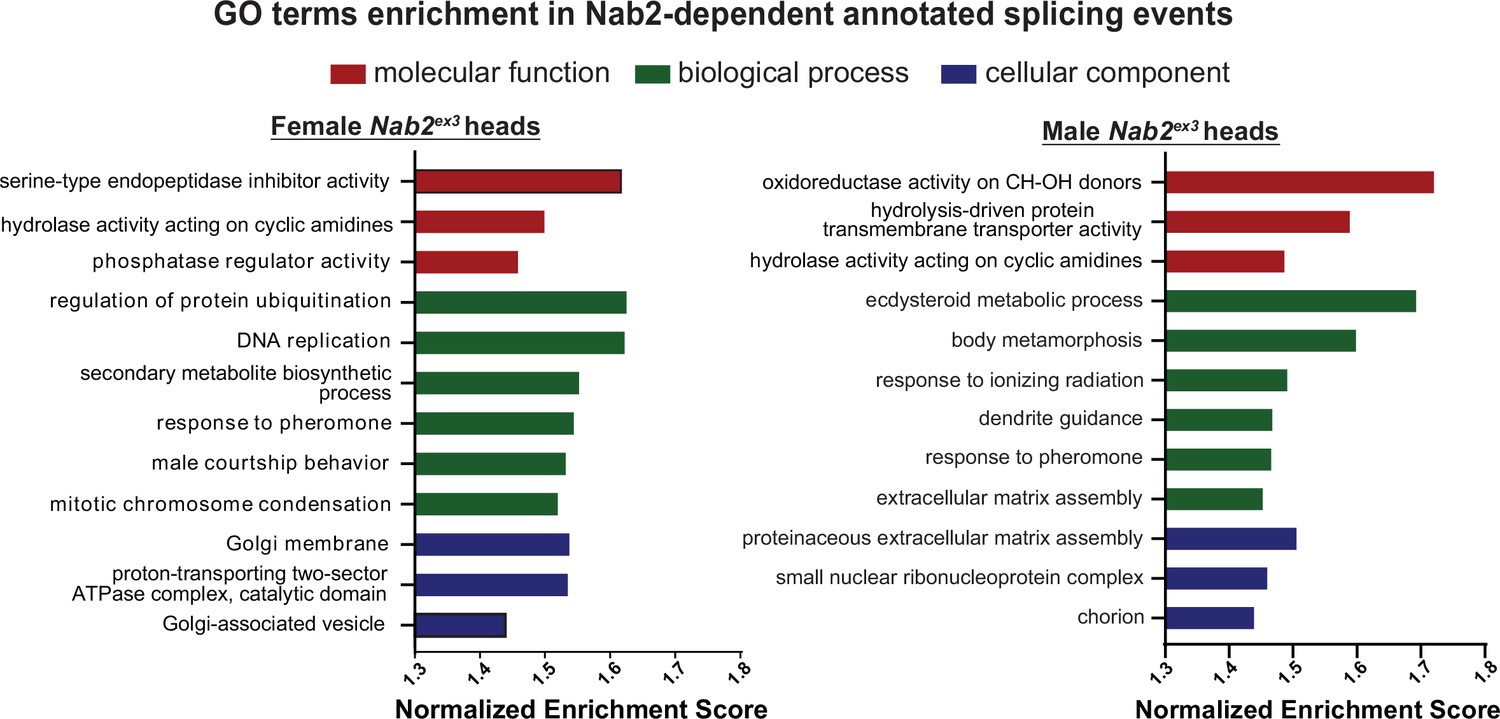
Gene Ontology (GO) term enrichment among Nab2-regulated alternative splicing events.
Chart illustrating GO terms enriched in the ‘molecular function,’ ‘biological process,’ and ‘cellular component’ categories among altered alternative splicing events detected by mixture of isoforms MISO in female and male Nab2ex3 head RNAs.
Figure 3 with 2 supplements
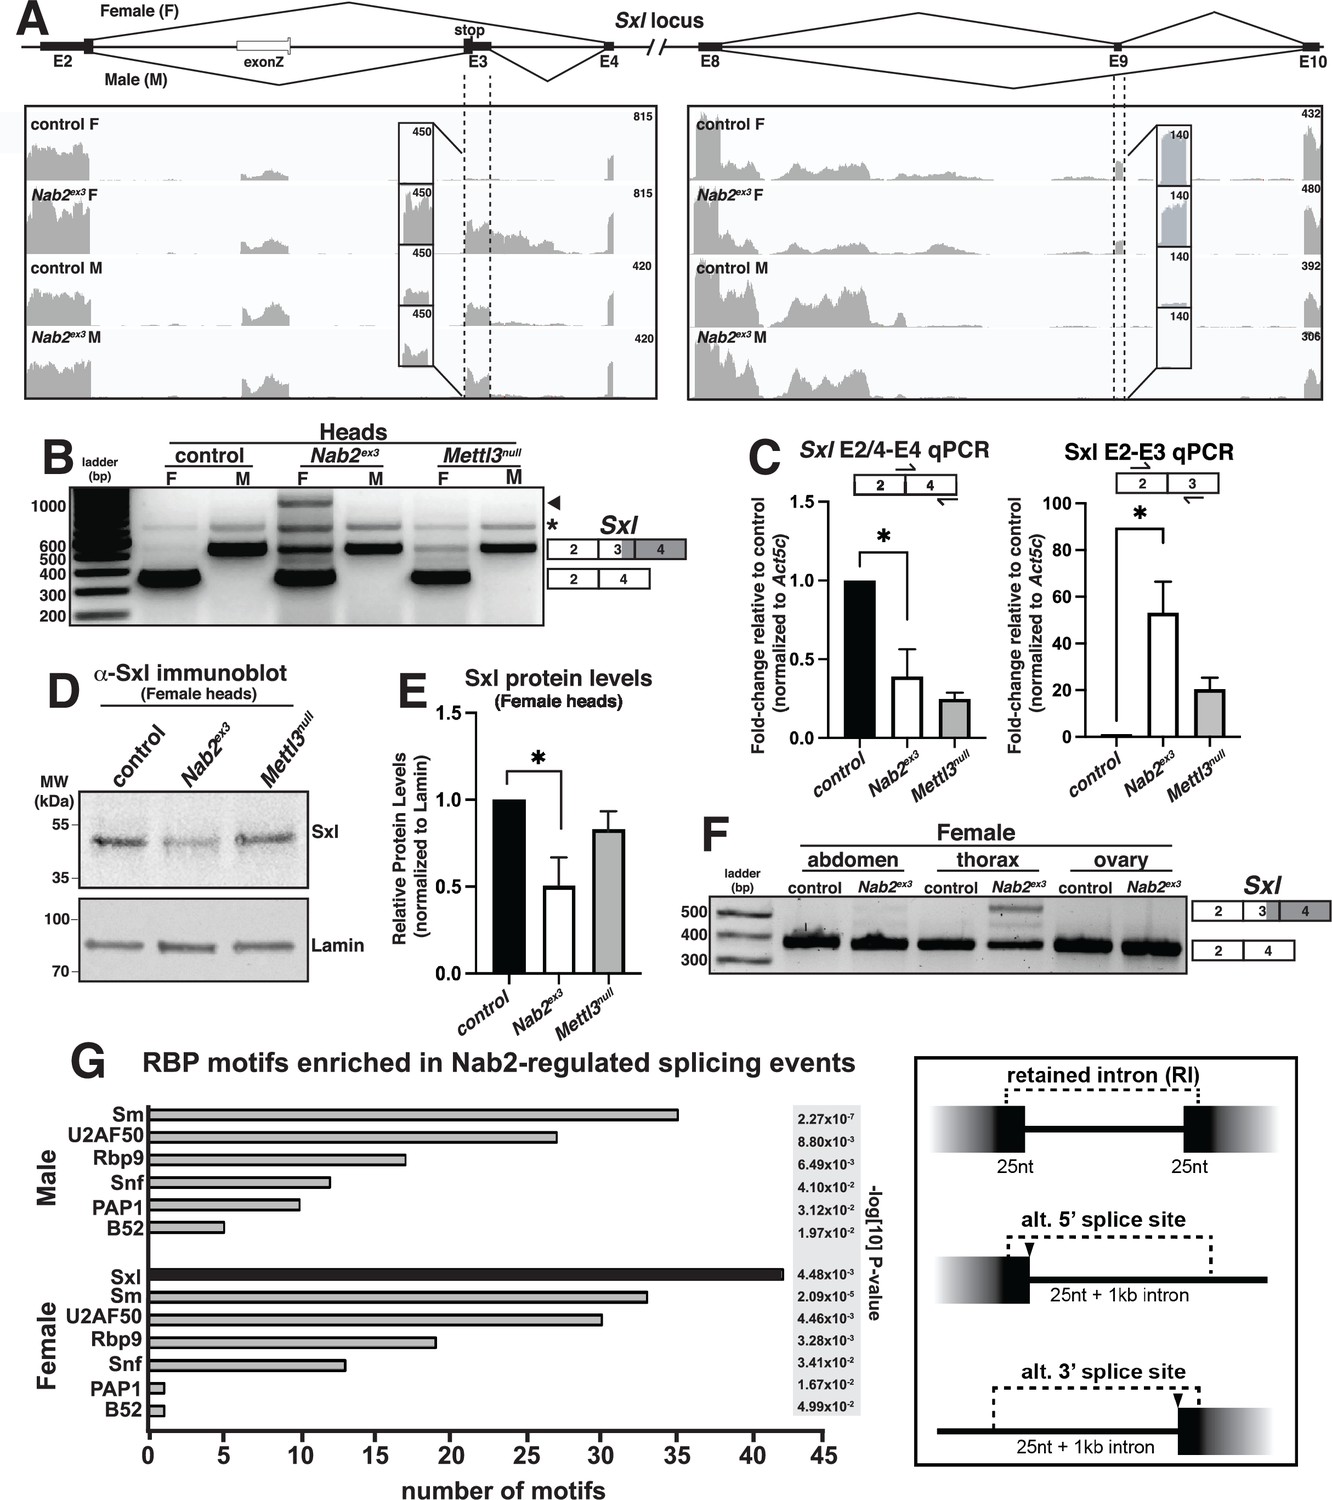
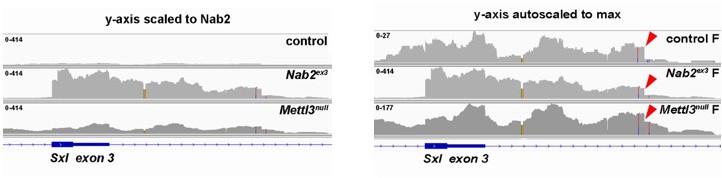
Sxl alternative splicing and protein levels are disrupted in Nab2ex3 female heads.
(A) Top panel: normal Sxl alternative splicing patterns across exon 2-4 and exon 8-10 regions in female (F) and male (M). Bottom panel: corresponding sequencing reads across the Sxl locus in the indicated sexes and genotypes. Dotted lines and boxed insets highlight exon 3 and exon 9 reads. (B) RT-PCR analysis of Sxl mRNA in control, Nab2ex3 and Mettl3null female (F) and male (M) heads. Exon 2-3-4 and exon 2-4 bands indicated. Arrowhead denotes exon 2-3-intron-4 product noted in text. Asterisk is nonspecific product. (C) RT-qPCR analysis of Sxl transcripts in adult female, control Nab2ex3, and Mettl3null heads using the indicated primer sets. Asterisk indicates results that are statistically significant at p-value<0.05. (D) Immunoblot of protein samples from control, Nab2ex3, and Mettl3null female heads. Antibody against female-specific Sxl protein isoform was used to detect Sxl in each sample. Lamin serves as a loading control. Molecular weights are given in kDa and indicated to the left. (E) Quantification of Sxl protein levels in (D) using ImageLab software. Protein levels are normalized to control, with the value for control set to 1.0. Asterisk indicates results that are statistically significant at p-value<0.05. (F) RT-PCR analysis of Sxl mRNA in adult female control and Nab2ex3 tissues with exon 2-3-4 and 2-4 bands indicated. (G) RNA binding protein (RBP) motif enrichment analysis detects predicted Sxl binding sites as the most frequent motif among Nab2-regulated splicing events in female heads. Other enriched motifs are similar between male and female heads. Regions used for motif analysis (retained introns, and alternative 5′ or 3′ splice sites plus flanking sequence) are described in the text and illustrated in the schematic to the right.
-
Figure 3—source data 1
Original agarose gel showing RT-PCR analysis of Sxl mRNA in the relevant genotypes in Figure 3B.
Shown as original (bottom) and inverted (top) grayscale.
- https://cdn.elifesciences.org/articles/64904/elife-64904-fig3-data1-v1.zip
-
Figure 3—source data 2
Original western blot of head lysates labeled in Figure 3D using anti-Sxl antibody.
Boxed areas correspond to regions shown in the main figure.
- https://cdn.elifesciences.org/articles/64904/elife-64904-fig3-data2-v1.zip
-
Figure 3—source data 3
Original western blot of head lysates labeled in Figure 3D using anti-Lamin antibody.
Boxed areas correspond to regions shown in the main figure.
- https://cdn.elifesciences.org/articles/64904/elife-64904-fig3-data3-v1.zip
-
Figure 3—source data 4
Raw agarose gel showing RT-PCR analysis of Sxl mRNA in the relevant genotypes and tissues shown in Figure 3F.
- https://cdn.elifesciences.org/articles/64904/elife-64904-fig3-data4-v1.zip
Figure 3—figure supplement 1
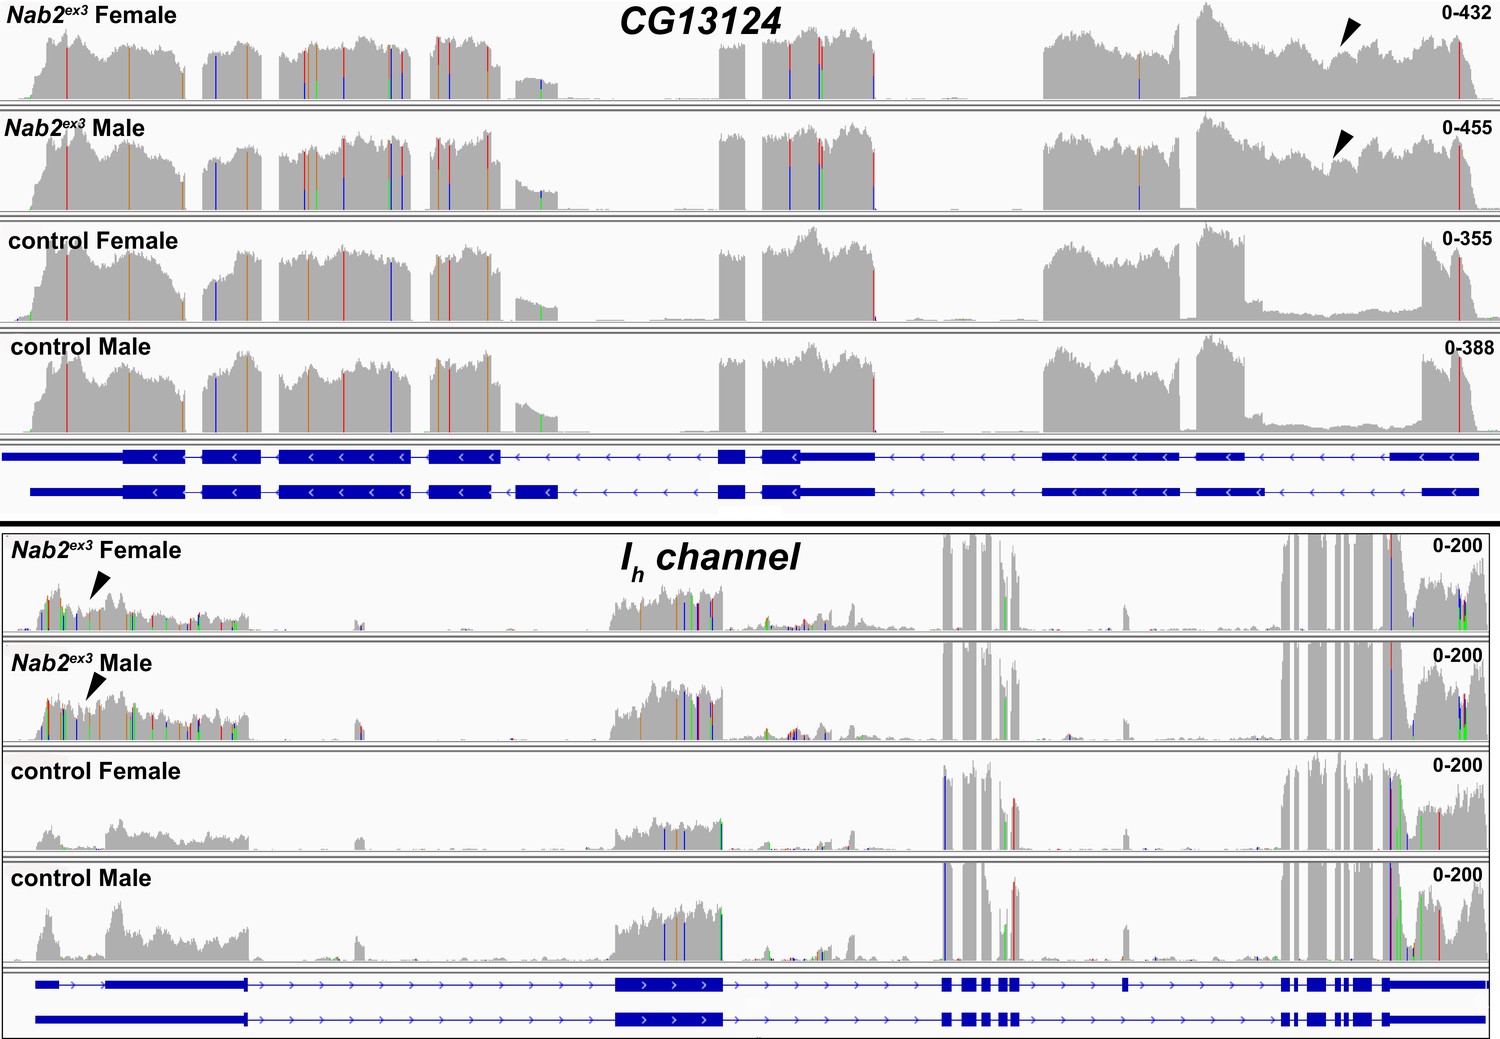
RNA sequencing reads across the CG13124 and Ih channel loci.
Integrative Genomics Viewer (IGV) images of RNA sequencing reads across CG13124 and Ih channel in Nab2ex3 (top tracks) and control (Nab2pex41) adult female and male heads. Intron-exon structure is indicated at bottom. Read depth scales are indicated. Arrowheads indicate reads across the first intron of each gene. Also related to data displayed in Table 1.
Figure 3—figure supplement 2

RNA sequencing reads across the tra and dsx loci.
Integrative Genomics Viewer (IGV) images of RNA sequencing reads across tra, dsx, msl-2, and mle in Nab2ex3 (top tracks) and control (Nab2pex41) adult female and male heads. Intron-exon structure is indicated at bottom. Read depth scales are indicated.
Figure 4 with 1 supplement
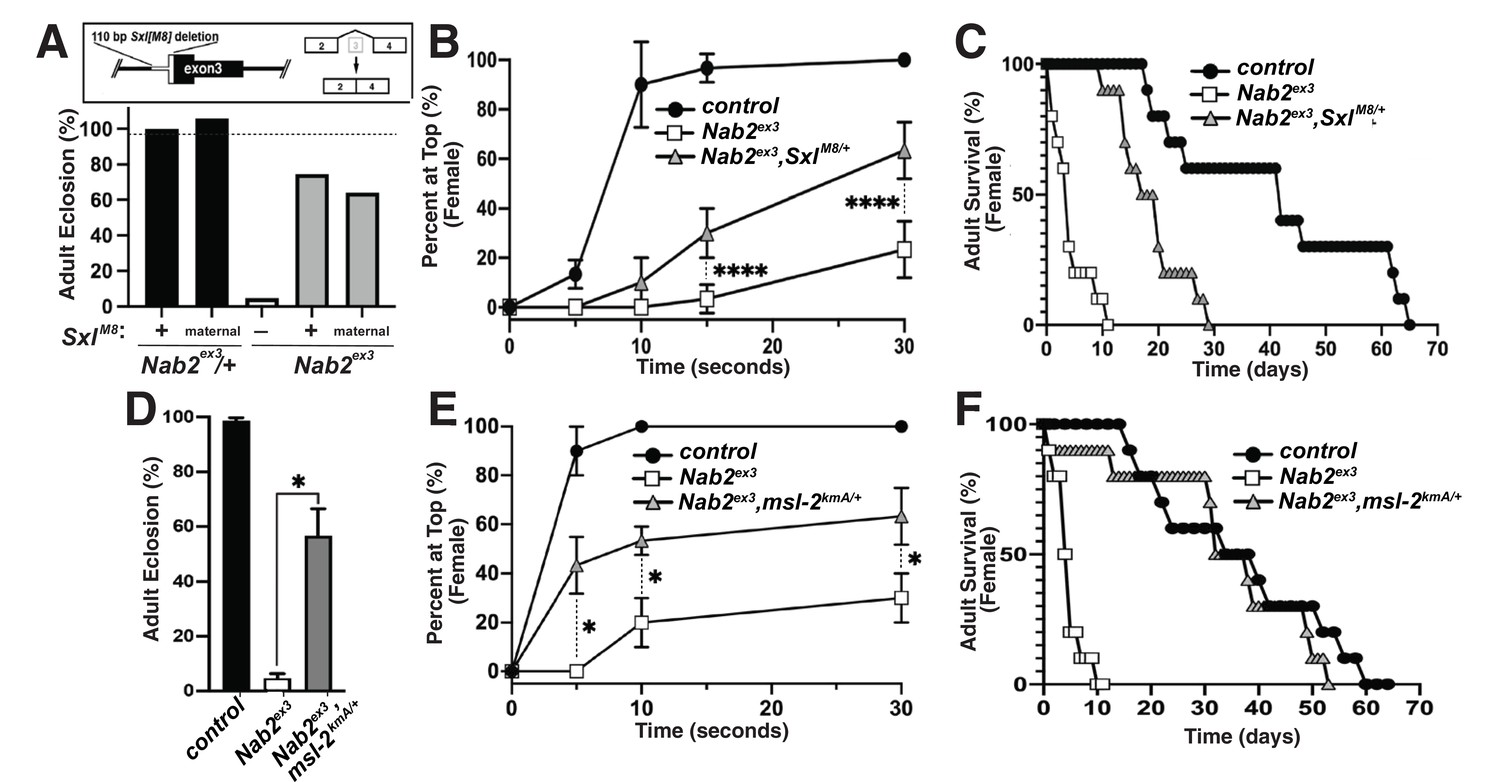
Alleles of SxlM8 or the Dosage Compensation Complex (DCC) component male-specific lethal-2 (msl-2) rescues Nab2 phenotypes.
(A) A single copy of the SxlM8 allele, which harbors a 110 bp deletion that causes constitutive exon 2-4 splicing, partially suppresses lethality of Nab2ex3, both zygotically and maternally (calculated as #observed/#expected). (B, C) SxlM8 dominantly (i.e., M8/+) suppresses previously defined (B) locomotion (as assessed by negative-geotaxis) and (C) lifespan defects in age-matched Nab2ex3 females. (D) Percent of control, Nab2ex3, or msl-2kmA/+;;Nab2ex3 (msl-2 is on the X chromosome) that eclose as viable adults (calculated as #observed/#expected). (E, F) msl-2kmA dominantly (i.e., kmA/+) suppresses previously defined (E) locomotion (as assessed by negative-geotaxis) and (F) lifespan defects in age-matched Nab2ex3 females. Significance values are indicated (*p<0.05, ****p<0.0001).
Figure 4—figure supplement 1

Additional genetic interactions between Nab2ex3 msl-2, roX1, and mle.
(A) Adult viability of control females (black bar) with one copy of Nab2ex3 in a msl-2 deficient background (msl-2227 truncating allele over Exel7016 deletion), females lacking Nab2 (Nab2ex3, dark gray bar), or Nab2ex3 mutant females in msl-2227/Exel7016 background (light gray bar). (B) Negative geotaxis of age-matched adult female controls (Nab2pex41), Nab2ex3 mutants, or Nab2ex3 mutants carrying single copies of the roX1e6 or mle9 loss-of-function alleles at 5 s, 10 s, and 15 s timepoints. Significance values between indicated groups are indicated at the 30 s timepoint (p-values are indicated; n.s., not significant).
Figure 5 with 1 supplement
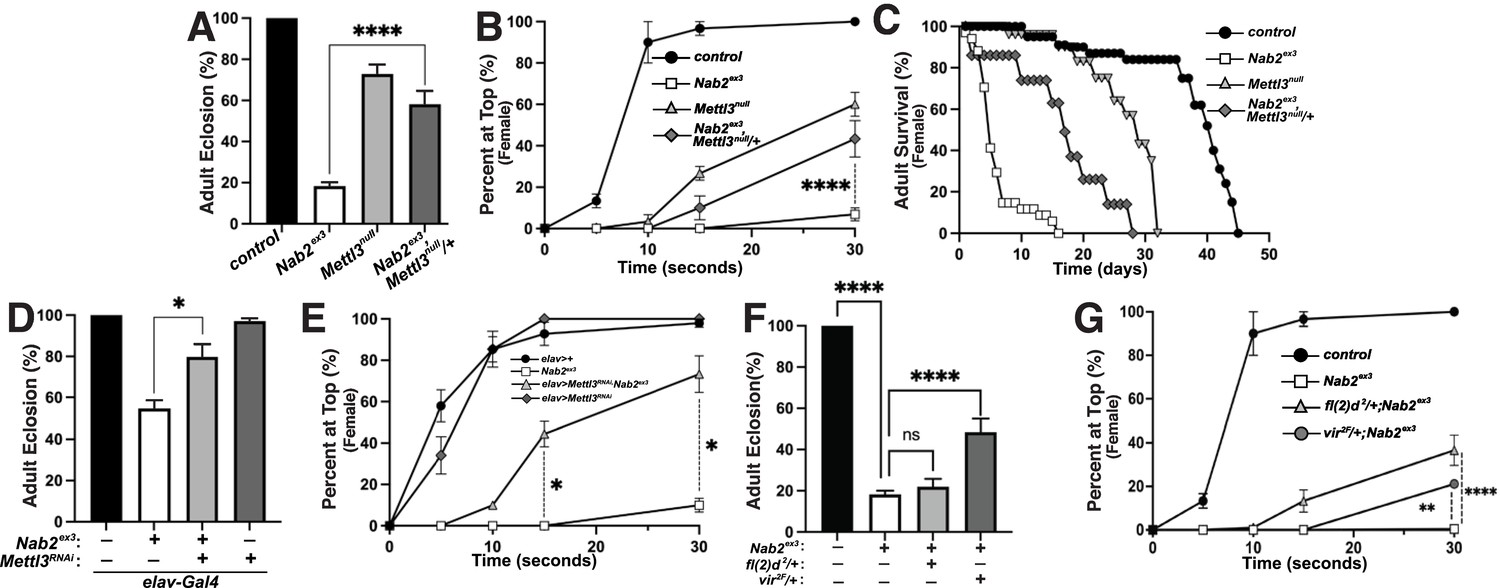
Reduction of the Mettl3 m6A transferase suppresses viability and behavioral defects in Nab2 mutant females.
(A) Percent of control, Nab2ex3, and Nab2ex3,Mettl3null/+ flies that eclose as viable adults (calculated as #observed/#expected). (B) Negative geotaxis of age-matched adult females of the indicated genotypes over time in seconds. (C) Survival of age-matched adult female flies of the indicated genotypes over time in days. (D) Percent of elav >Gal4 alone control, elav-Gal4;;Nab2ex3, elav-Gal4;UAS-Mettl3-RNAi;Nab2ex3, and elav-Gal4;UAS-Mettl3-RNAi flies that eclose as viable adults (calculated as #observed/#expected). Note that baseline Nab2ex3 viability is elevated in the background of the elav-Gal4 transgene, and significantly suppressed by inclusion of UAS-Mettl3 RNAi. (E) Negative geotaxis assay for age-matched adult females of the indicated genotypes over time in seconds. (F) Percent of control, Nab2ex3, Nab2ex3,fl(2)d2/+, or Nab2ex3,vir2F/+ flies that eclose as viable adults (calculated as #observed/#expected). (G) Negative geotaxis of age-matched adult females of the indicated genotypes over time in seconds. Significance values are indicated (*p<0.05, **p<0.01, ****p<0.0001).
Figure 5—figure supplement 1
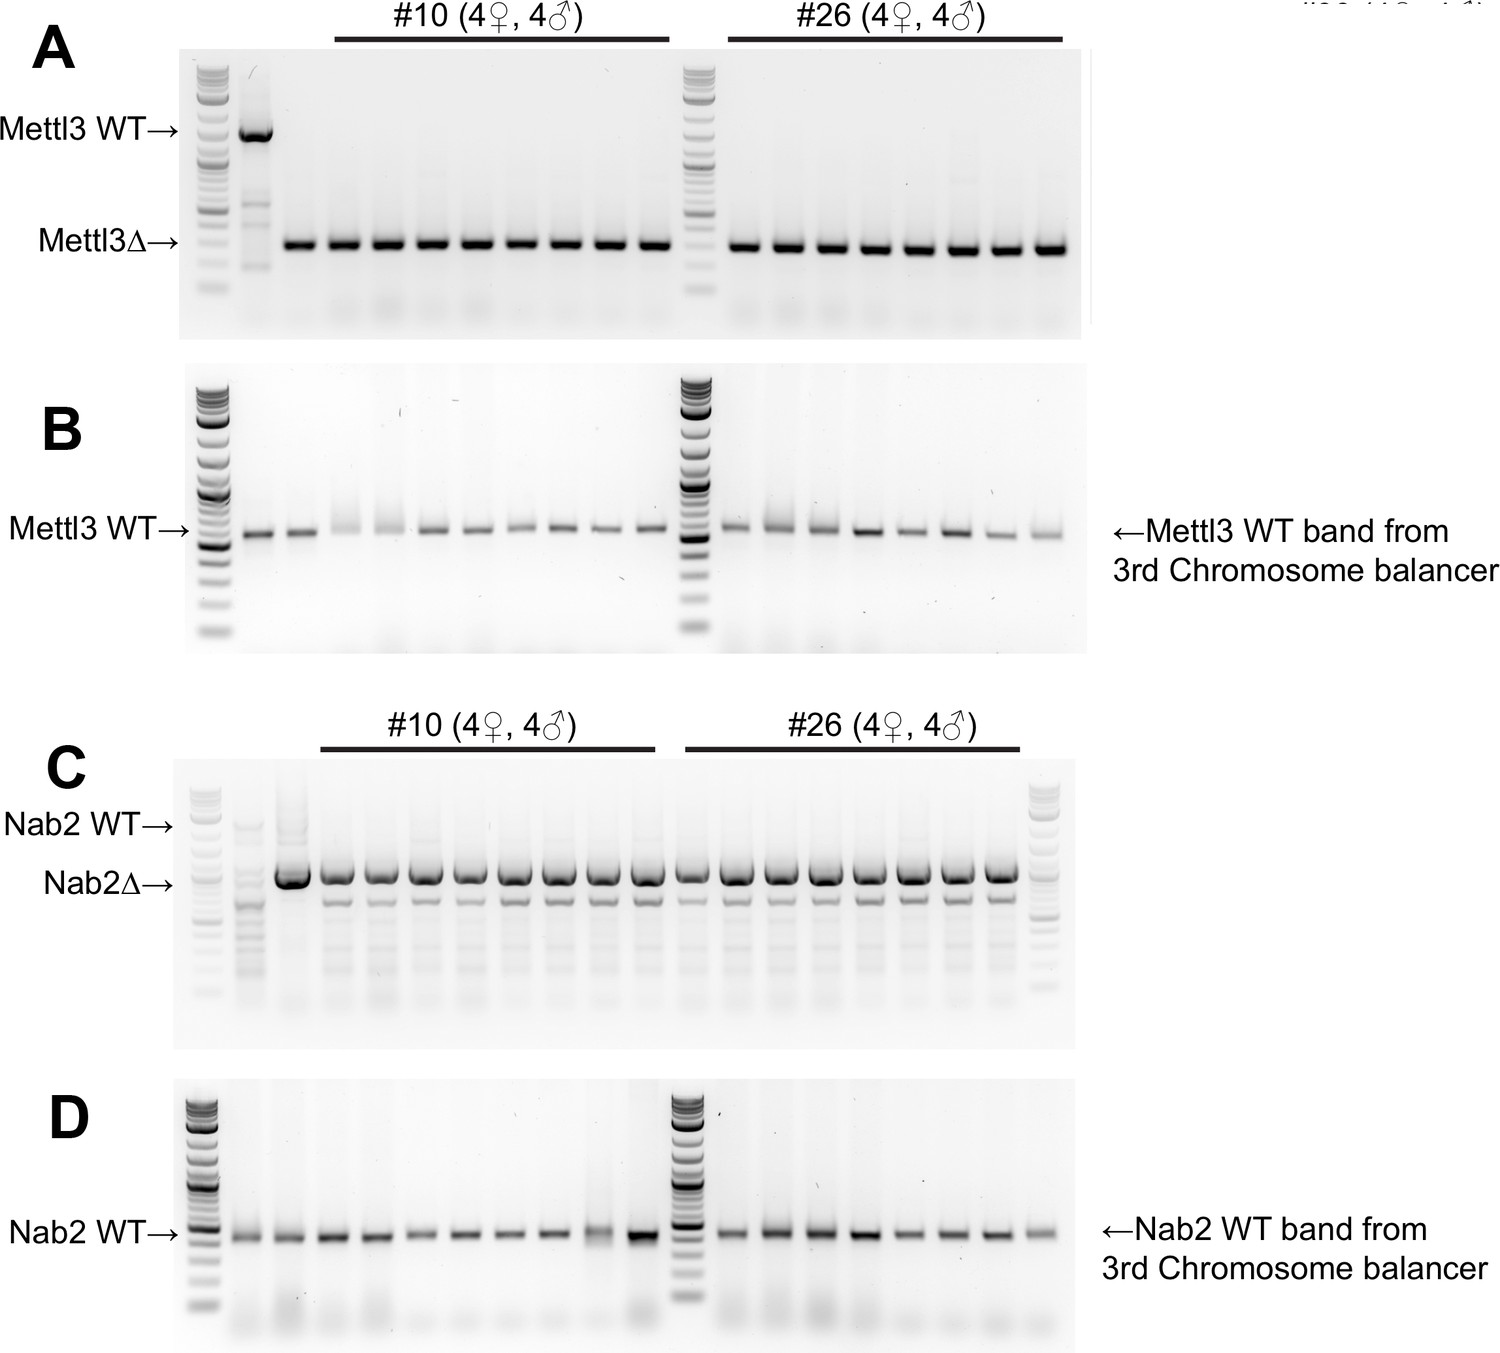
Genomic PCR confirms the Nab2ex3,Mettl3null recombinant.
Genomic PCR of two different isolates (#10, #26) of the Mettl3null,Nab2ex3 double mutant chromosome balanced over TM6B. (A) and (C) show PCR products generated from each isolate using primers that flank the deletions in each gene; the normal wt product from TM6B and truncated products (Δ) are indicated. (B) and (D) show PCR products generated from each isolate using primers that lie within the deleted regions of each gene; the wt products from TM6B are indicated. Numbers of adults used for extraction of gDNA are indicated.
Figure 6 with 4 supplements
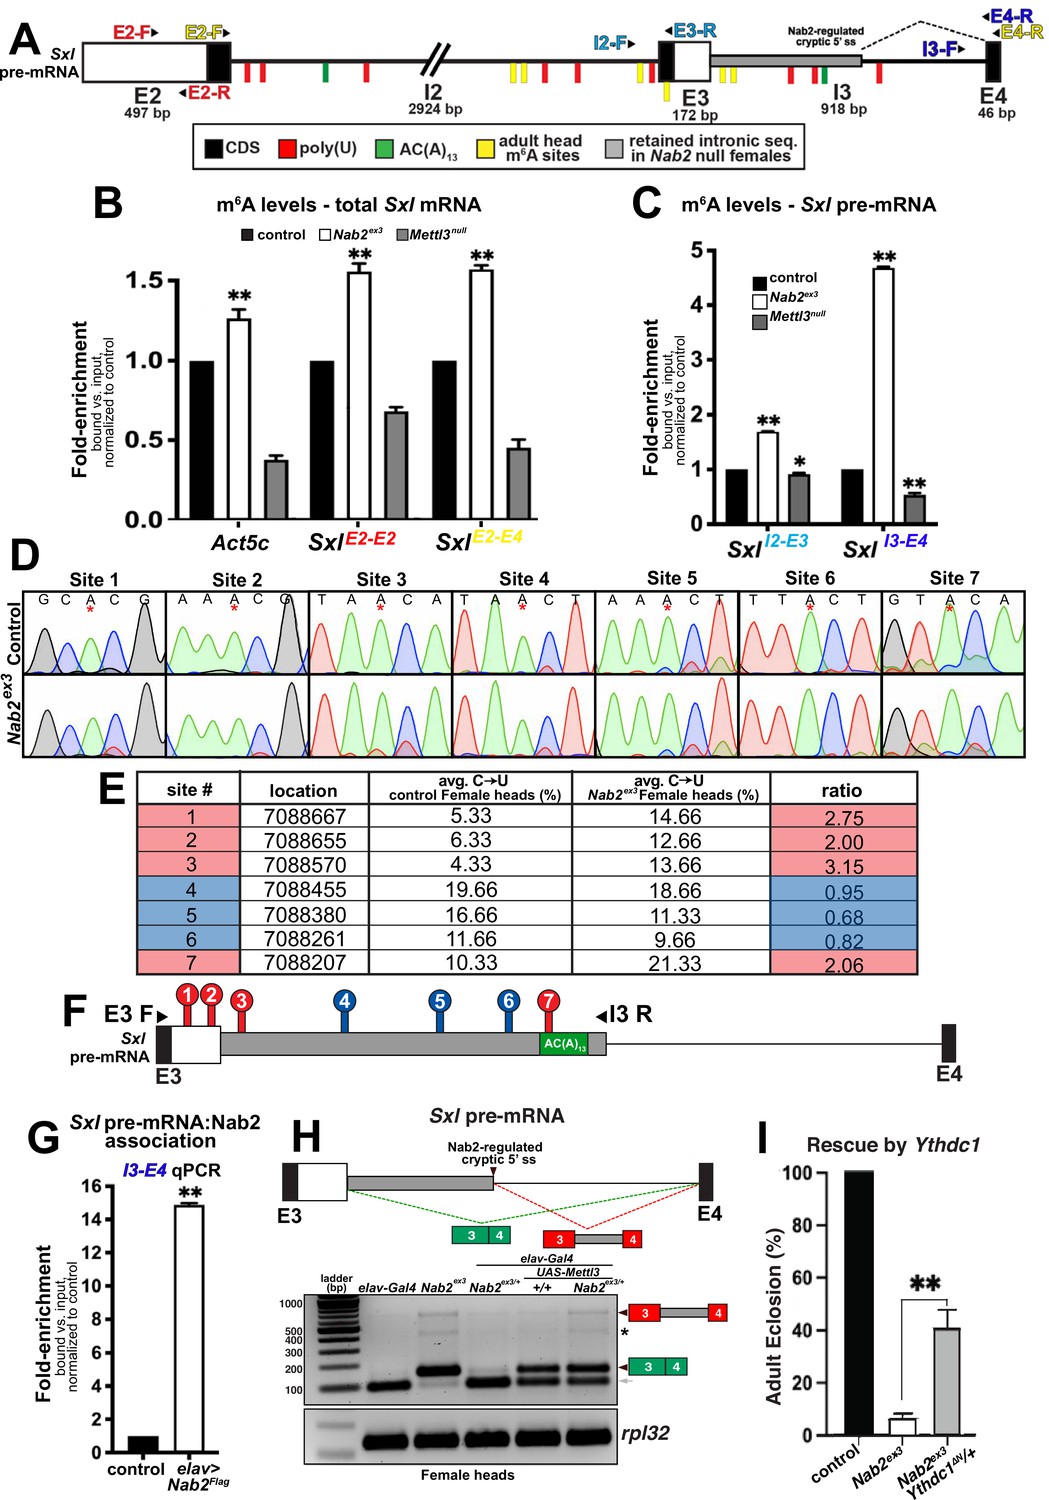
Nab2 associates with the Sxl mRNA and inhibits its m6A methylation.
(A) Diagram of exons (E2, E3, E4) and introns (I2 and I3) of the Sxl pre-mRNA annotated to show coding sequence (CDS; black), the retained intronic region in Nab2ex3 female (gray), and location of color-coded primer pairs (E2-F(orward) and E2-R(everse), E2-F and E4-R, I2-F and E3-R, I3-F, and E4-R), poly(U) sites (red lines), AC(A)13 site (green line), and mapped m6A positions in Drosophila heads (yellow lines) (Kan et al., 2021). (B) RT-qPCR analysis of Act5c and Sxl mRNA present in anti-m6A precipitates of control (control; black), Nab2ex3 (white), or Mettl3null (gray) female heads. The position of Sxl primer pairs is indicated (E2-F+E2-R and E2-F+E4-R). (C) Similar analysis as in (B) using I2-F+E3-R and I3-F+E4-R primer pairs to detect unspliced Sxl transcripts in anti-m6A precipitates of control (black), Nab2ex3 (white), or Mettl3null female heads. (D) Sanger sequencing traces showing C-to-U editing adjacent to m6A sites in control and Nab2ex3 female head RNA samples subjected to DART-sanger sequencing (Meyer, 2019) within the retained intronic region of Sxl pre-mRNA. m6A sites are indicated by red asterisks. (E) Table of the m6A sites (red = hypermethylated in Nab2ex3, blue = no change in Nab2ex3) mapped by DART-sanger sequencing in (D) with the corresponding location (dm6), average C-to-U editing fraction (%), and ratio of C-to-U editing for Nab2ex3 to control female head samples. Data are representative of three biological replicates. (F) Schematic showing the location of the m6A sites mapped by DART within exons (E3 and E4) and intron 3 of Sxl pre-mRNA. Site numbering corresponds to numbering in (E). (G) RT-qPCR analysis with the I3-F+E4-R primer pair in (A) from anti-Flag precipitates of control and elav-Gal4,UAS-Nab2:Flag female heads. (H) Top: schematic of the exon3-exon4 region of Sxl mRNA showing the intron region retained in Nab2ex3 (gray fill) and the normal exon 3-exon 4 splicing product (green fill) and the aberrant exon 3-intron 3503-exon 4 (red-gray fill). Bottom: RT-PCR analysis of Sxl using the E3-E4 primer pair and RNAs harvested from female heads of the indicated genotypes: elav-Gal4 alone, elav-Gal4+Nab2ex3/+, Nab2ex3 mutant, Nab2ex3/+, UAS-Mettl3 alone, or elav>Mettl3+Nab2ex3/+. Arrowheads denote exon 3-exon 4 and exon 3-intron 3503-exon 4 bands are indicated. Small gray arrow indicates Nab2-dependent splice variant. Asterisk marks a nonspecific band. (I) Percent of control, Nab2ex3, or Nab2ex3;Ythdc1ΔN/+ flies that eclose as viable adults (calculated as # observed/# expected).
-
Figure 6—source data 1
Raw agarose gel showing RT-PCR analysis of Sxl mRNA in the relevant genotypes shown in Figure 6H.
- https://cdn.elifesciences.org/articles/64904/elife-64904-fig6-data1-v1.zip
-
Figure 6—source data 2
Raw agarose gel showing RT-PCR analysis of RpL32 mRNA in the relevant genotypes shown in Figure 6H.
- https://cdn.elifesciences.org/articles/64904/elife-64904-fig6-data2-v1.zip
Figure 6—figure supplement 1

Detailed schematic of the exon 2-3-4 Sxl locus with annotated locations of introns and exons annotated to show coding sequence (CDS; blue), the retained intronic region in Nab2ex3 females (gray), and locations of color-coded primer pairs (E2-F and E2-R, E2-F and E4-R, I2-F, and E3-R, I3-F, and E4-R), poly(U) sites red lines, poly(A) sites green lines, and mapped m6A locations in Drosophila embryos yellow lines (Kan et al., 2017).
Colored dotted lines indicated sex-specific splicing in wildtype adults and the altered splicing documented in this study. Boxed areas below summarize exon-intron structure in wild type heads and Nab2ex3 heads. Base pair coordinates are indicated (Dm Release 6).
Figure 6—figure supplement 2

Nab2 limits m6A methylation of additional RNAs.
Quantitative real-time PCR analysis of Act5c and Usp16 mRNAs present in anti-m6A precipitates of control (Nab2pex41; black), Nab2ex3 (gray), and Mettl3null (dark gray) adult female heads. 1-day-old female heads were used in three biological replicates, and data represent bound vs. input ratios normalized to control (Nab2pex41). p-values are indicated (n.s. = not significant).
Figure 6—figure supplement 3
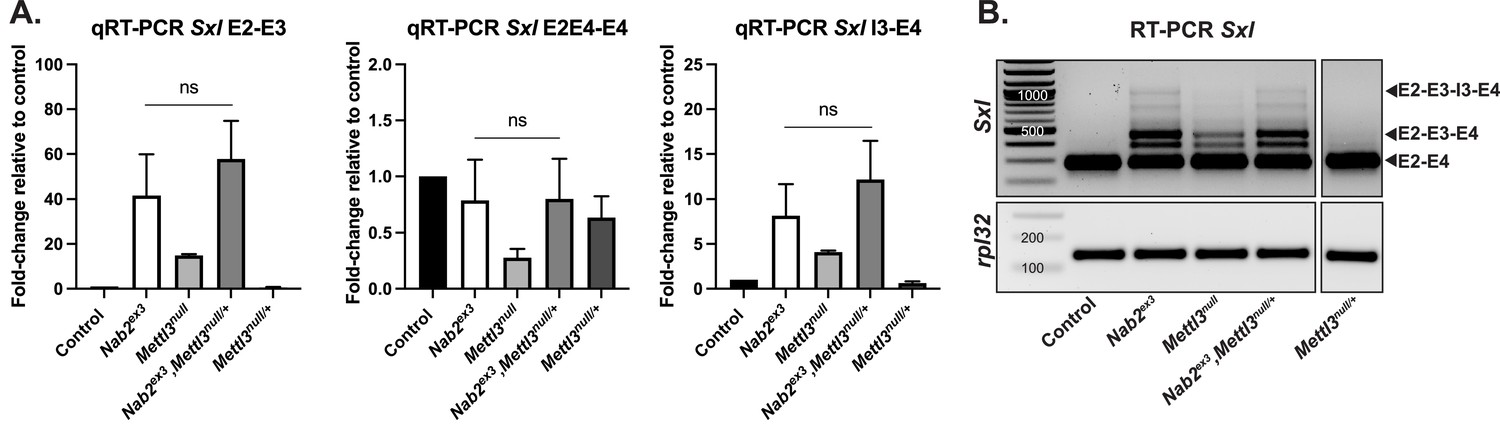
Heterozygosity for Mettl3 does not alter Sxl splicing in control or Nab2ex3 mutant female heads.
(A) qRT-PCR analysis of RNAs harvested from adult female heads of the indicated genotypes with primers that amplify spliced Sxl exon 2-exon 3 (E2-E3) or exon 3-exon 4 (E3E4-E4). The E3E4 primer spans the exon 3-exon 4 junction. Fold-change is calculated relative to ‘control’ (Nab2pex41) and normalized to CT values of Act5c. ns = not specific. (B) Semi-quantitative RT-PCR analysis of Sxl (top) or control RpL32 (bottom) in adult female head RNA of the indicated genotypes. Sxl was analyzed with a E2-E4 primer pair that detects Sxl RNAs indicated by arrowheads. Genotypes and nt size ladder are indicated.
-
Figure 6—figure supplement 3—source data 1
Raw agarose gel showing RT-PCR analysis of Sxl mRNA in the relevant genotypes shown in Figure 6—figure supplement 3.
Boxes correspond to regions included in the figure supplement.
- https://cdn.elifesciences.org/articles/64904/elife-64904-fig6-figsupp3-data1-v1.zip
-
Figure 6—figure supplement 3—source data 2
Raw agarose gel showing RT-PCR analysis of RpL32 mRNA in the relevant genotypes shown in Figure 6—figure supplement 3.
Boxes correspond to regions included in the figure supplement.
- https://cdn.elifesciences.org/articles/64904/elife-64904-fig6-figsupp3-data2-v1.zip
Figure 6—figure supplement 4
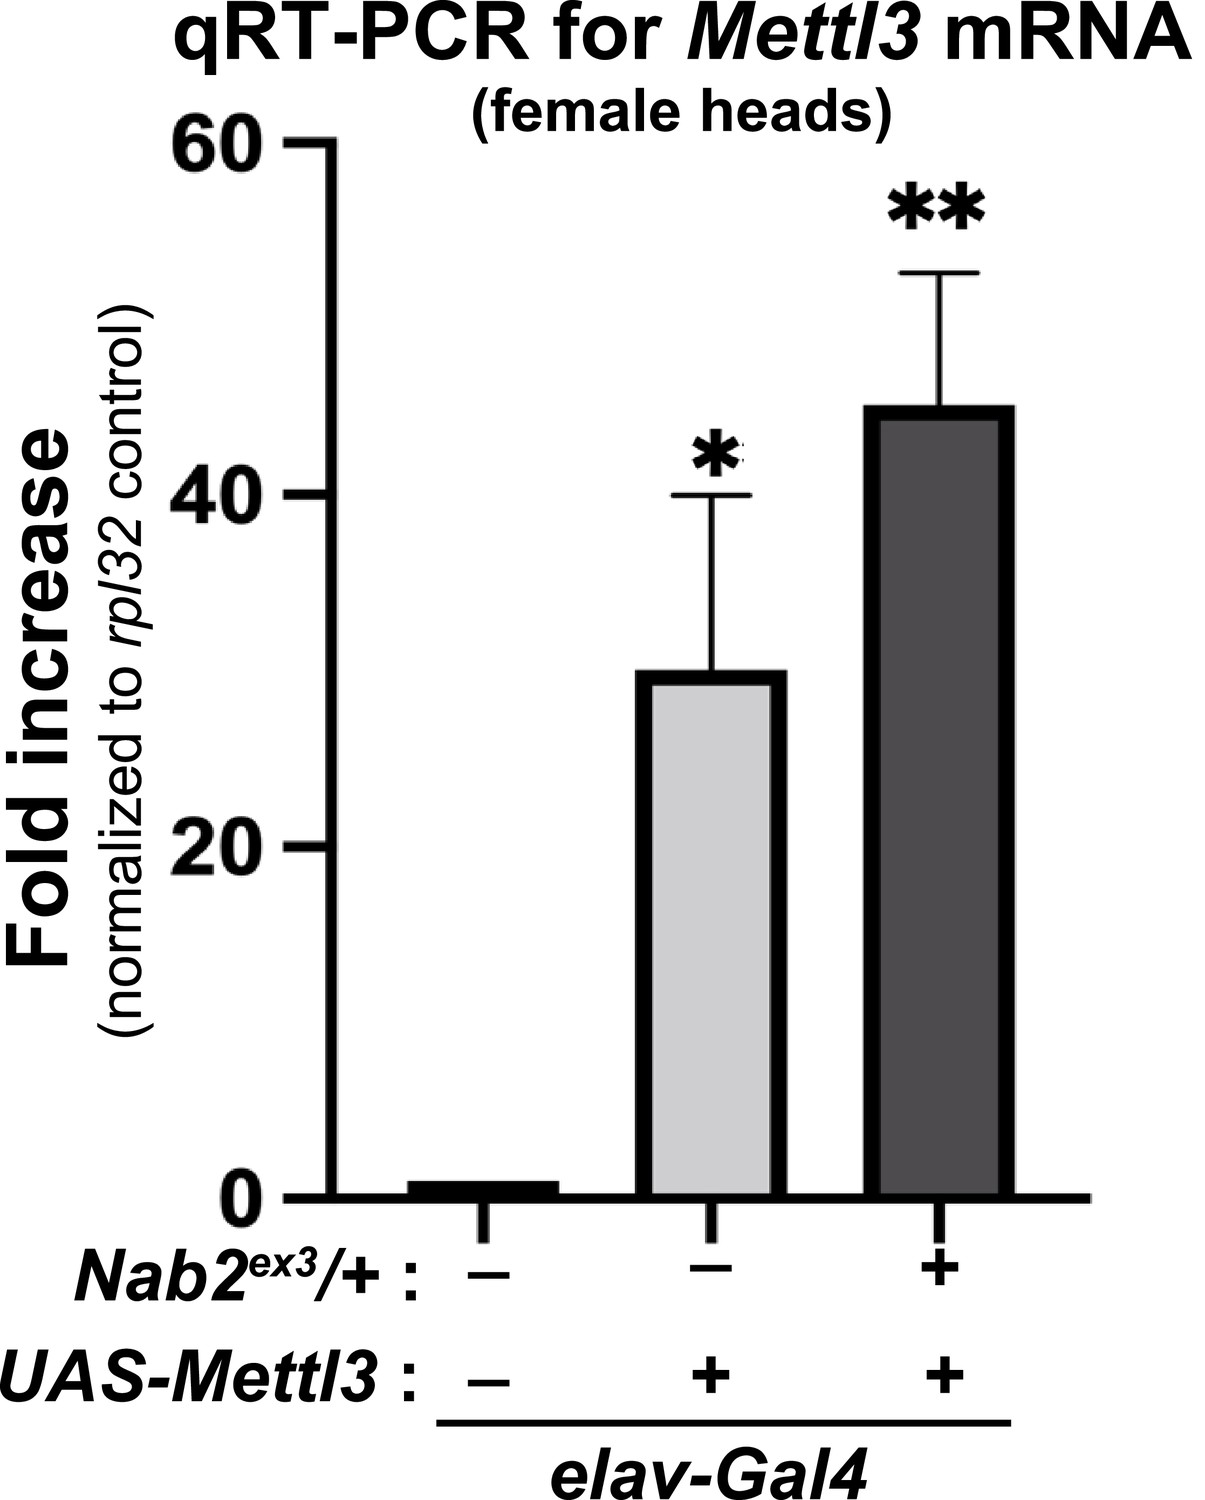
Neuronal overexpression of Mettl3 RNA using the Gal4/UAS system.
qRT-PCR analysis of Mettl3 RNA levels in heads of control w1118 (lane 1), or Mettl3 overexpressing (elav-Gal4,UAS-Mettl3) adult females in the absence (lane2) or presence (lane 3) of a single Nab2ex3 allele. p-values <0.05, <0.005.
Author response image 1
Author response image 2

Tables
Table 1
Alternative exon use (DexSeq) in Nab2ex3 head transcriptomes.
| Females | Males | |
|---|---|---|
| No. of alternatively used exons * | 151 | 114 |
| * |(exon usage fold change)| >~1.75 BH Adj. p<0.05 | ||
| Top mis-spliced transcripts | ||
| Females | foldΔ exon usage | BH adj. p-value |
| Sex lethal (Sxl) | 2.86 | 3.08 × 10–235 |
| CG13124 | 2.45 | 1.09 × 10–81 |
| Ih channel | 2.29 | 3.28 × 1063 |
| Ace | 1.81 | 1.02 × 10–59 |
| Males | foldΔ exon usage | BH adj. p-value |
| Ace | 2.02 | 1.88 × 10–169 |
| Pkc53E | 1.74 | 6.12 × 10–102 |
| plx | 2.12 | 9.03 × 10–67 |
| Pkn | 1.84 | 9.04 × 10–67 |
| Bacc | 2.31 | 1.11 × 10–64 |
-
Table 1—source data 1
Files (.bed format, openable as .excel tables) of splicing defects detected by lower threshold analysis than in Table 1.
Abbreviations: A3’SS, alternative 3′ splice site; A5’SS, alternative 5′ splice site; MEE, mutually exclusive exon; RI, retained intron; SE, skipped exon.
- https://cdn.elifesciences.org/articles/64904/elife-64904-table1-data1-v1.zip
Additional files
-
Supplementary file 1
RNA abundance in Nab2ex3 vs. control female and male adult heads.
This file contains a list of all annotated RNAs and their corresponding expression level across all samples in female and male adult heads (i.e., raw counts) and their fold-change in Nab2 null heads relative to control in descending rank order of significance (p-value, column H) as determined by DESeq2 analysis.
- https://cdn.elifesciences.org/articles/64904/elife-64904-supp1-v1.xlsx
-
Supplementary file 2
Splicing changes in female and male Nab2 null heads relative to control heads.
This file contains a list of RNAs and corresponding changes in splice patterns in Nab2 null vs. control detected by MISO. A5SS, alternative 5′ splice site; A3SS, alternative 3′ splice site; RI, retained intron; SE, skipped exon.
- https://cdn.elifesciences.org/articles/64904/elife-64904-supp2-v1.xlsx
-
Supplementary file 3
DEXSeq called differential exon usage in Nab2 null heads.
This file contains a list of RNAs with differential exon usage in Nab2 null female or male heads detected by DEXSeq in descending rank order of significance (p-value, column P).
- https://cdn.elifesciences.org/articles/64904/elife-64904-supp3-v1.xlsx
-
Transparent reporting form
- https://cdn.elifesciences.org/articles/64904/elife-64904-transrepform1-v1.docx
Download links
A two-part list of links to download the article, or parts of the article, in various formats.
Downloads (link to download the article as PDF)
Open citations (links to open the citations from this article in various online reference manager services)
Cite this article (links to download the citations from this article in formats compatible with various reference manager tools)
The Drosophila Nab2 RNA binding protein inhibits m6A methylation and male-specific splicing of Sex lethal transcript in female neuronal tissue
eLife 12:e64904.
https://doi.org/10.7554/eLife.64904


