Tissue-autonomous immune response regulates stress signaling during hypertrophy
- Department of Molecular Biosciences, The Wenner-Gren Institute (MBW), Stockholm University, Sweden
Figures
Figure 1 with 1 supplement
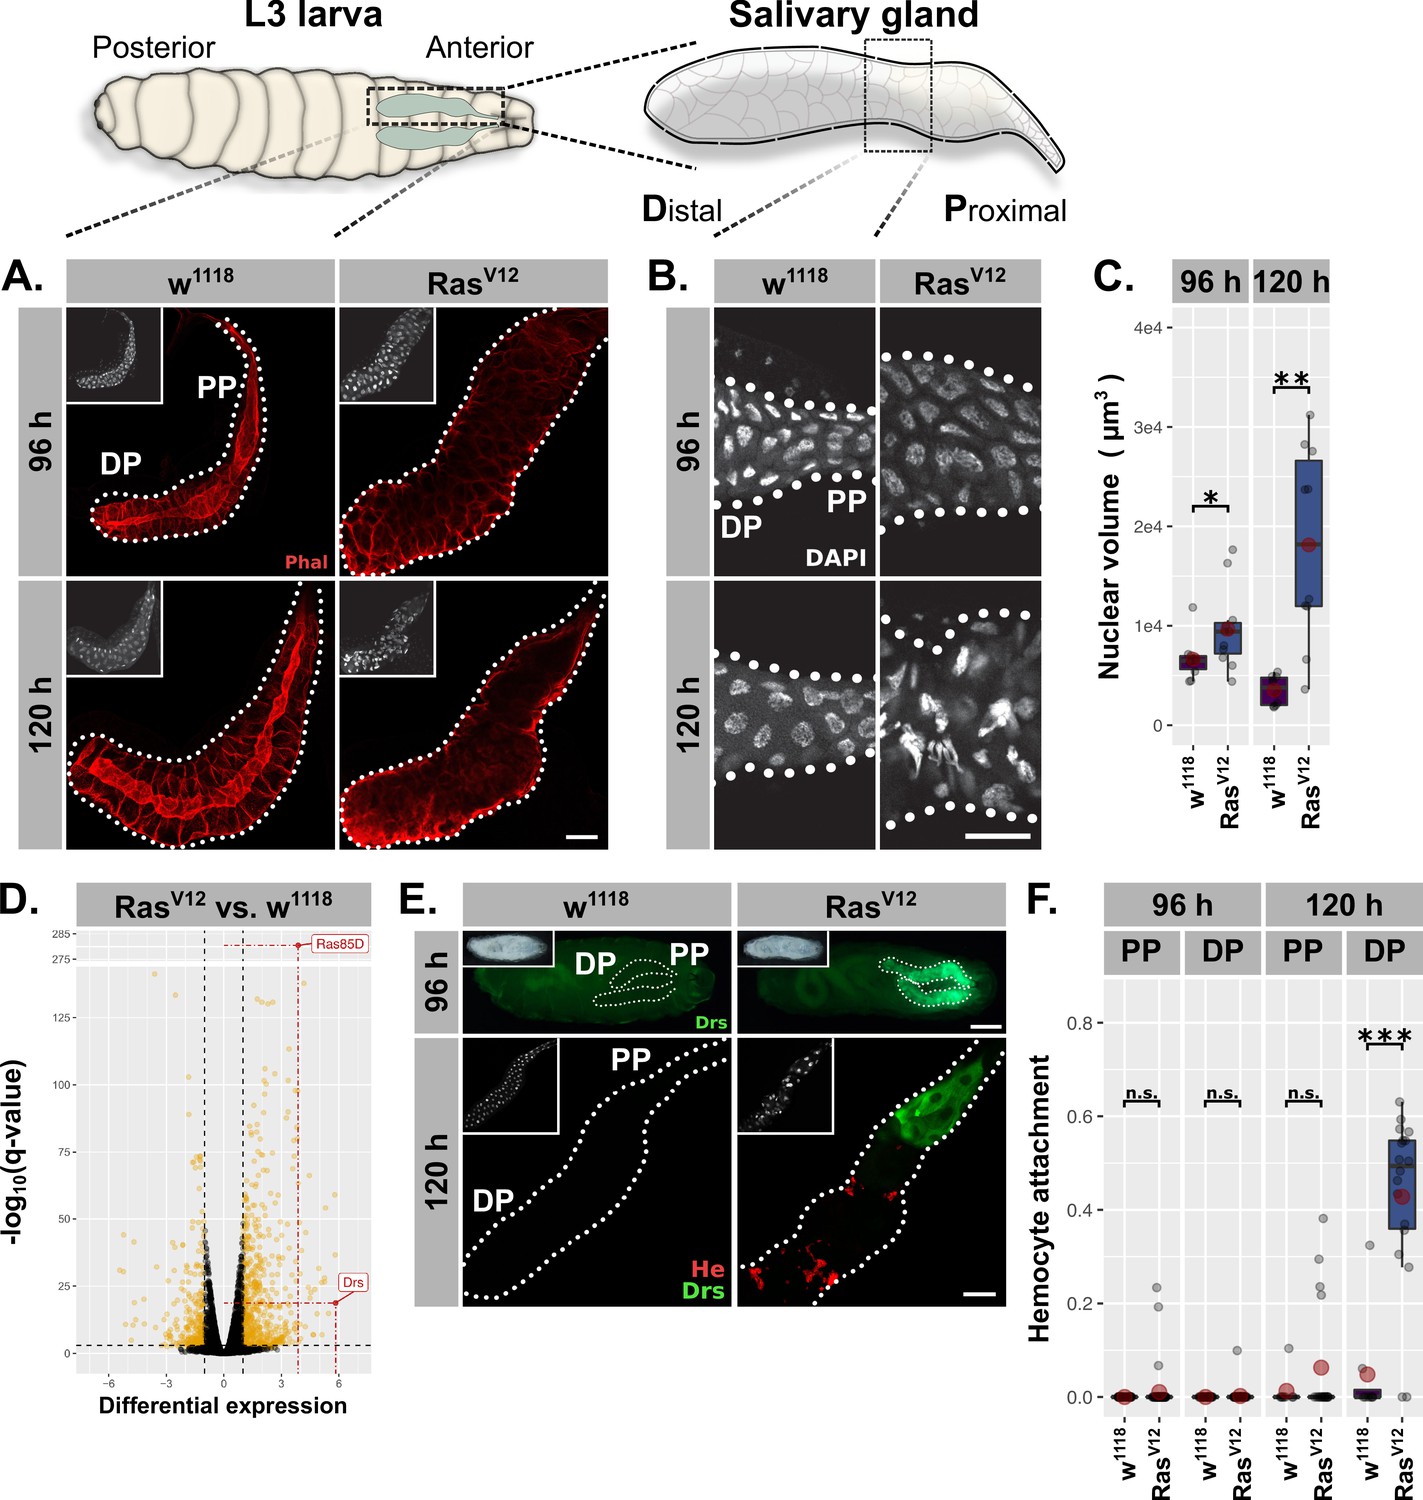
RasV12-induced hypertrophy induces local and cellular immune responses.
(A) RasV12-glands and controls stained with Phalloidin (red) to monitor tissue integrity at 96 hr and 120 hr after egg deposition (AED). (B) Nuclei stained with DAPI (white) to visualize nuclear volume and disintegration at 120 hr AED in RasV12-glands. (C) Nuclear volume as quantified by z-stacks of DAPI-stained salivary glands (SGs) at 96 hr and 120 hr AED and averaged per gland. (D) Comparative transcriptome analysis of RasV12- vs. w1118-glands. Differential expression quantified as beta statistic with q-values by Wald test. Significantly differentially expressed genes (log2(beta) ≥1; q-value ≤0.05) highlighted in yellow. (E) Upper: Whole larvae with DrsGFP reporter (green) expressing RasV12 in glands or controls at 96 hr AED. Lower: RasV12- and control-glands with DrsGFP reporter (green) stained for hemocytes (anti-Hemese, red). Proximal and distal gland parts are indicated by ‘PP’ and ‘DP’. (F) Hemocyte attachment measured as ln(Hemese-area)/ln(SG-area) and separated by time and gland part. Insets: (A/E Lower) DAPI, (E Upper) brightfield. Scalebars: (A-B, E Lower) 100 µm, (E Upper) 500 µm. Boxplots in (C, F): lower/upper hinges indicate 1st/3rd quartiles, whisker lengths equal 1.5*IQR, red circle and bar represent mean and median. Significance evaluated by Student's t-tests (***p<0.001, **p<0.01, *p<0.05, n.s. p≥0.05).
Figure 1—figure supplement 1
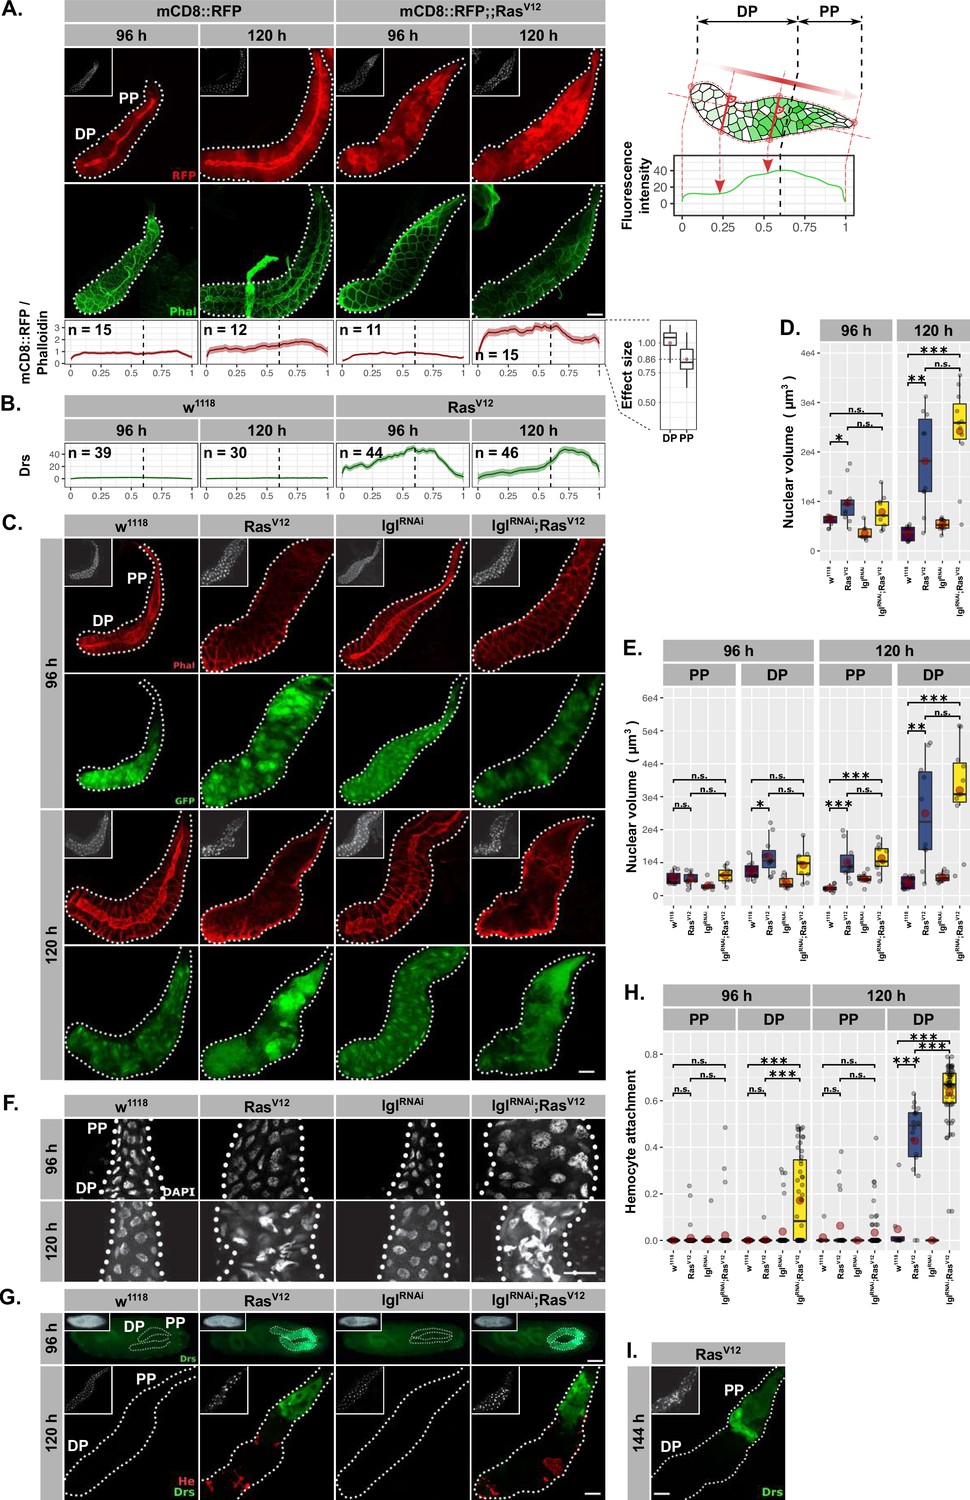
Homeostasis, local and cellular immune responses separate along the longitudinal axis of RasV12-glands.
(A) Right: Schematic representation of deployed algorithm to measure fluorescene signals along all vertical axis perpendicular to the glands longitudinal axis. Left: mCD8::RFP;;RasV12- and mCD8::RFP-control glands stained with Phalloidin (green) to assess BxMS1096 driven, Phalloidin-normalized RFP-expression at 96 hr and 120 hr after egg deposition (AED) along the longitudinal gland axis (bottom). Signals averaged across n=x glands showed 86% of the signal intensity in proximal part (PP) compared to distal part (DP; right). (B) DrsGFP-reporter intensities along the longitudinal gland axis in RasV12- and w1118-control glands at 96 hr and 120 hr AED. (C) GFP (green) expression to validate continued BxMS1096-driven expression at 96 hr and 120 hr AED in both gland parts across all genotypes and Phalloidin (red) staining to trace tissue integrity. (D) Volume of DAPI-stained nuclei derived from SG z-stacks and averaged per gland. (E) Nuclear volume separated per gland into DP and PP. (F) SG nuclei stained with DAPI (white) to indicate nuclear size and disintegration. (G) Upper: Whole larvae carrying DrsGFP reporter (green). Lower: SGs with DrsGFP reporter signal (green) and stained hemocytes (anti-Hemese, red). (H) Attached hemocytes quantified as ln(Hemese-area)/ln(SG-area) separated for DP and PP. (I) DrsGFP-reporter signal in RasV12-glands at 144 hr AED. Insets: (A Left, C, G Lower, I) DAPI, (G Upper) brightfield. Scalebars: (A, C, F, G Lower) 100 µm, (G Upper) 500 µm. Boxplots in (D-E, H): lower/upper hinges indicate 1st/3rd quartiles, whisker lengths equal 1.5*IQR, red circle and bar represent mean and median. Significance evaluated by Student's t-tests (***p<0.001, **p<0.01, *p<0.05, n.s. p≥0.05). (C-D.,F-G.) w1118 and RasV12 data reused from Figure 1. (E) Separated nuclei measurements based on data in (D). (H) Separated hemocyte attachment measurements based on data in Figure 1F.
Figure 2 with 3 supplements

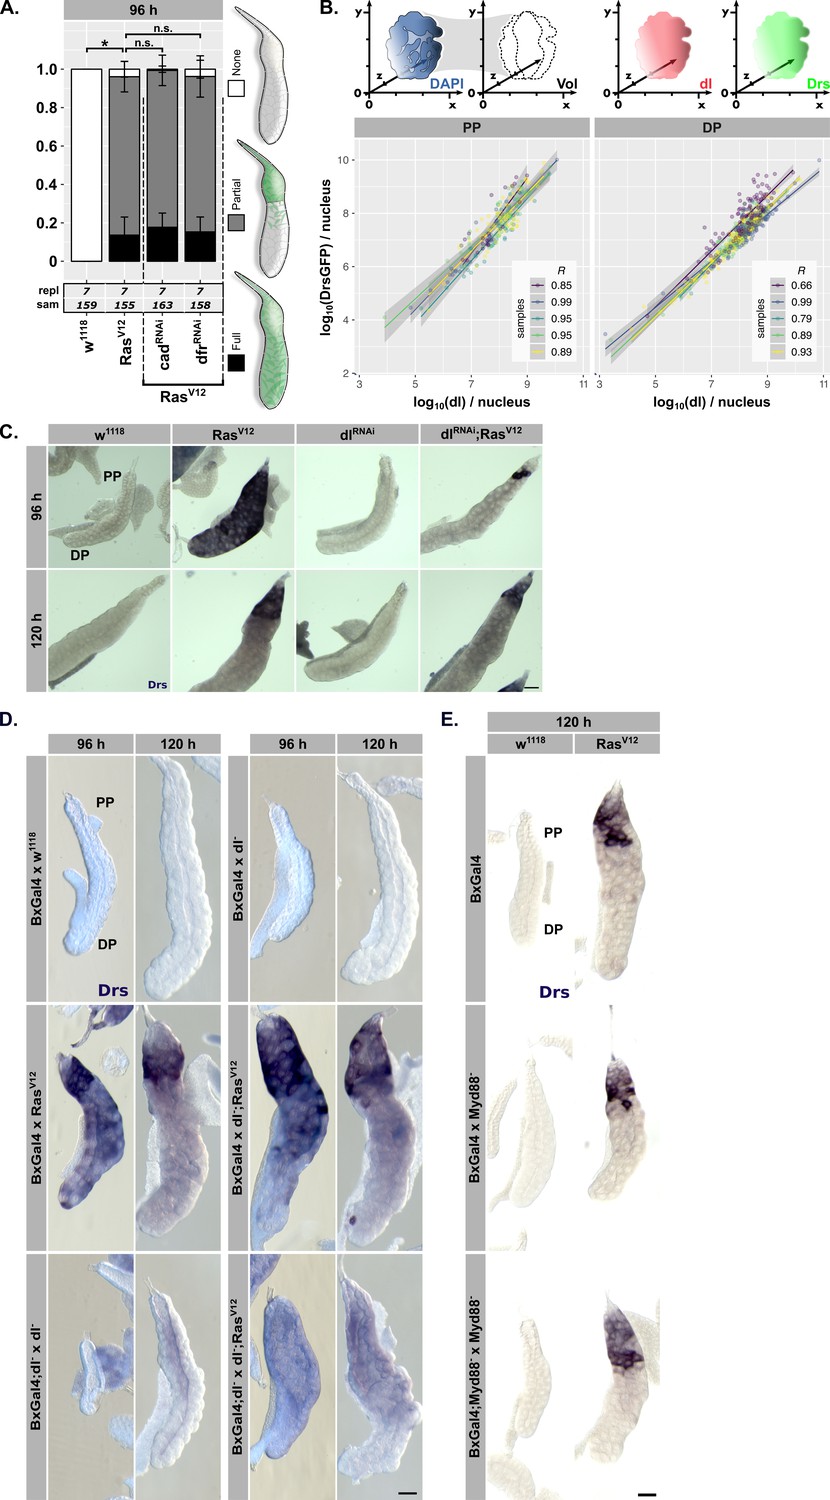
Drs expression is part of a genuine tissue-autonomous immune response.
(A) Semi quantitative DrsGFP reporter assay to identify upstream effectors of Drs expression by RNAi in RasV12-glands. Schematic representation (left) of the Toll-/imd-pathways showing components with (green) and without an effect (red). The three distinguished phenotypes (right) were scored per replicate, means and standard deviations plotted (middle) and p-values for ‘None’-phenotype calculated via Dunn’s test based on Kruskal-Wallis rank sum test (***p<0.001, n.s. p≥0.05). Monitoring melanization in pupae (insets) confirmed RasV12-expression to avoid false positives (Hauling et al., 2014). (B) dl staining (red) and DrsGFP signal (green) in RasV12-glands with and without dl-knock-down. Dashed lines added to aid separating proximal part (PP) from distal part (DP). (C) In-situ hybridization for endogenous Drs in RasV12-glands hetero- or homozygous mutant for dl (dl15). Insets: (B) DAPI. Scalebars: (B–C) 100 μm.
Figure 2—figure supplement 1

Drs expressed in a bona fide, tissue-autonomous, RasV12-dependent manner.
Larvae with RasV12-glands and DrsGFP reporter (green). (A) raised on plates with standard potatomash/molasses medium including stringent antibiotics cocktail, (A’) transferred immediately after hatching to germ- and yeast-extract free apple-agar supplemented with antibiotics or (A’’) after egg dechorionization were raised on sterile apple-agar including antibiotics. Scalebars: (A-A’’. Upper) 500 µm.
Figure 2—figure supplement 2
Drs expression in RasV12-glands is dorsal-dependent.
(A) DrsGFP reporter assay with RNAi constructs against Caudal and Drifter in RasV12-glands. Sketched phenotypes (right) were scored, their mean and standard deviations plotted. Dunn’s test performed to evaluate significant differences in distribution of ‘None’-phenotype (*p<0.05, n.s. p≥0.05). (B) Upper: Schematic representation of the correlation assay. DAPI-signal defines nuclei location and volume used to subsequently accumulate fluorescence signals from nuclear DrsGFP-reporter and dl-staining. Lower: Scatterplot of associated dl- and Drs-signals per nucleus in proximal part (PP) or distal part (DP) across five glands at 96 hr after egg deposition (AED). Pearson correlation coefficient shown for all five samples. Lines with confidence intervals indicate linear regression for Drs- as a function of dl-signal per sample and gland compartment. (C) Endogenous Drs mRNA detected by in-situ hybridization in RasV12-glands with or without knocking down dl. (D) Complete set of experimental genotypes for Drs in-situ hybridization as shown in Figure 2C. including additional controls. (E) Drs in situ hybridization in 120-hr-old RasV12- and control-glands hetero- or homozygous mutant for Myd88 (Myd88KG03447). Scalebars: (C) 100 µm.
Figure 2—figure supplement 3
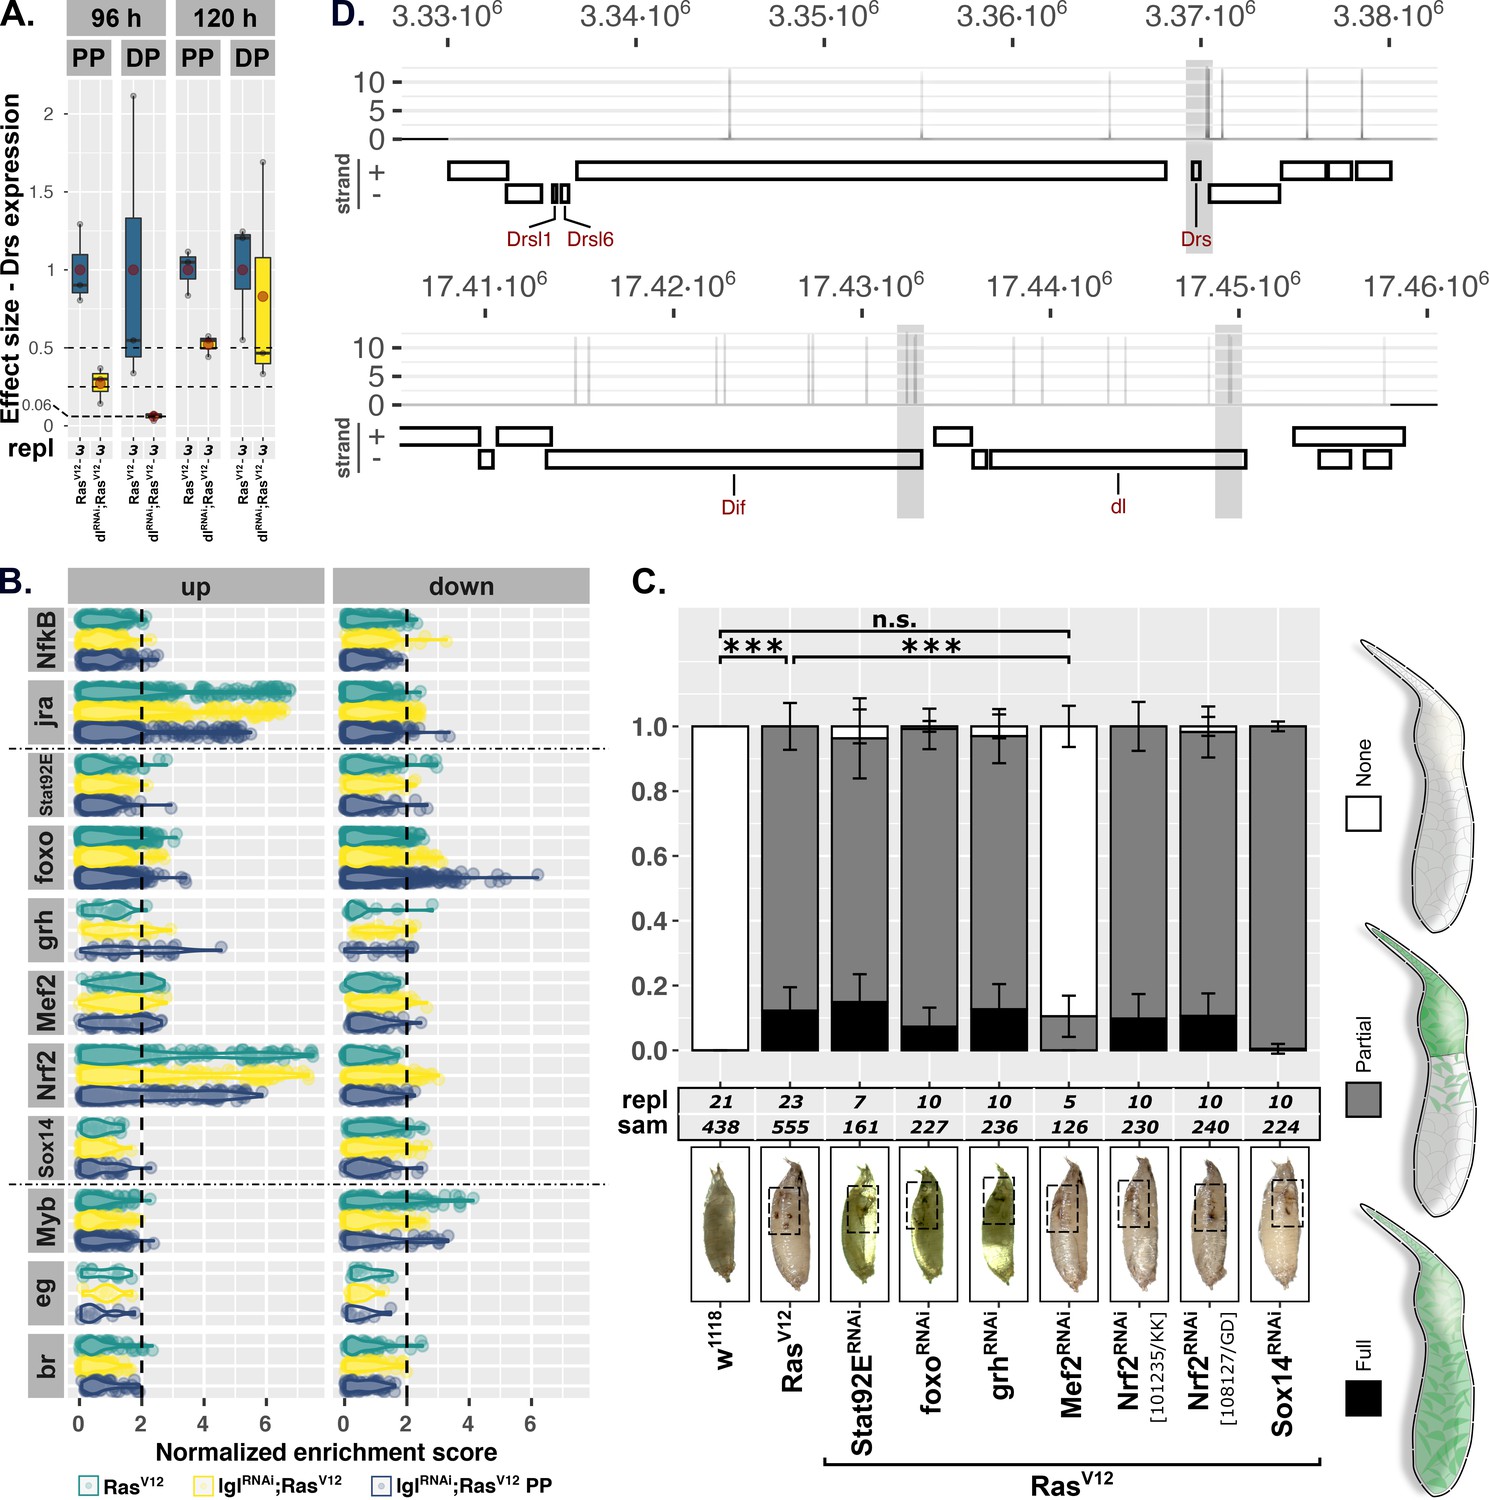
Mef2 contributes to Drs expression in RasV12-glands.
(A) Effect sizes of dlRNAi-knock-down on Drs-expression in proximal part (PP) and distal part (DP) compartments of and compared to RasV12-glands at 96 and 120 hr after egg deposition (AED). Mean of Drs-expression in RasV12-glands was set to '1’. Boxplots: lower/upper hinges indicate 1st/3rd quartiles, whisker lengths equal 1.5*IQR, red circle and bar represent mean and median. (B) Transcription factor binding site analysis in up- and down-regulated genesets of RasV12-, lglRNAi;RasV12-, and lglRNAi;RasV12-PP samples. Normalized enrichment scores represent statistical overrepresentation (NES >2) of transcription-factor-binding motifs in the six screened genesets. Cis-BP-derived motifs were sorted into the displayed transcription factor groups. NFκB- and jra- as well as Myb-, eg-, and br-motif groups were included as positive and negative examples. (C) DrsGFP-reporter-based assay including screened RNAi-lines targeting transcription factors identified in binding site analysis. three different phenotypes were scored (right) per genotype and their mean and standard deviation plotted. Dunn’s post-hoc test conducted on ‘None’-phenotype to validate significant differences (***p<0.001, n.s. p≥0.05). To avoid false positives, melanization was monitored in pupae (insets) to confirm RasV12-expression (Hauling et al., 2014). (D) Wider Drs-locus on ‘3L’- and ‘Dif/dl’-locus on ‘2L’-chromosome shown including outlines for gene loci encoded on plus and minus strands. Log-transformed motif scores are represented as a function of the motif’s location along the respective gene loci.
Figure 3 with 2 supplements
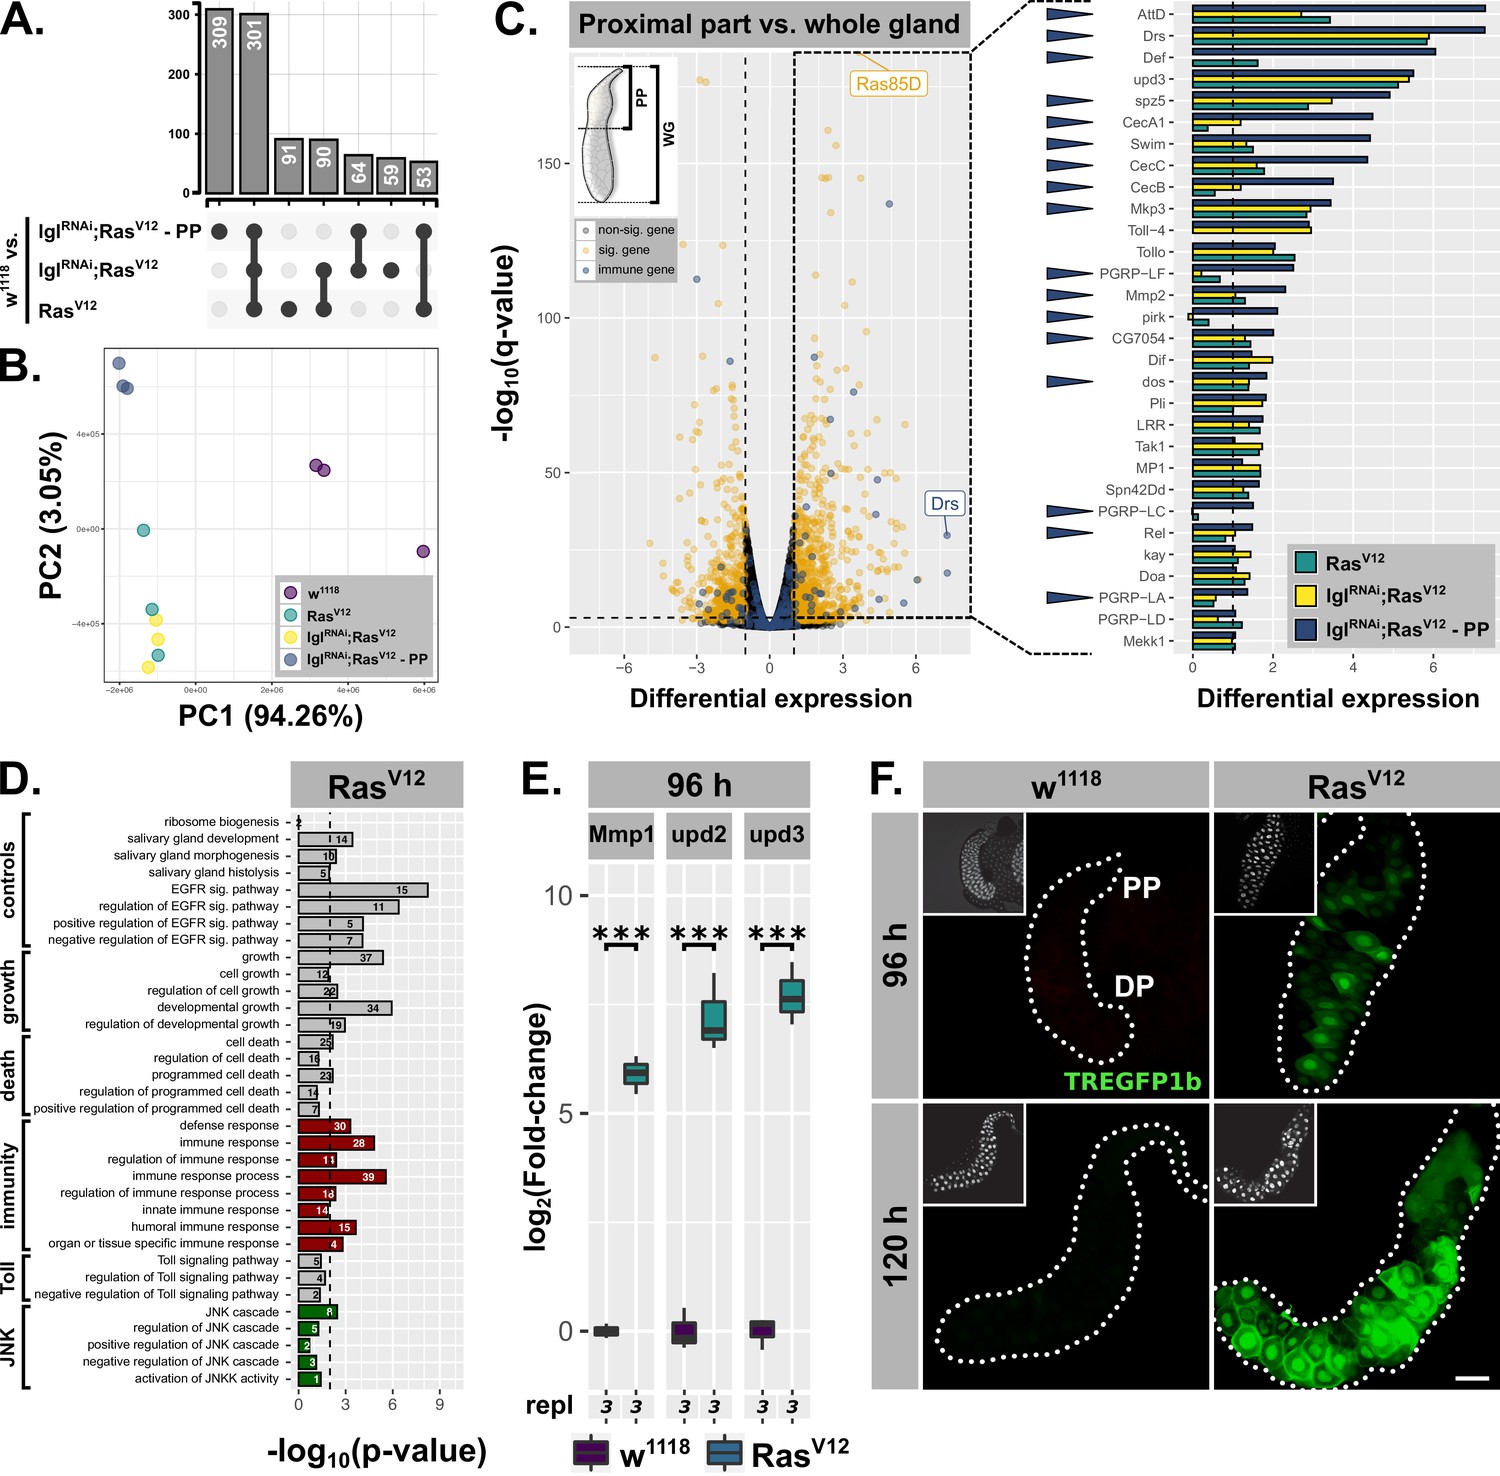
Hypertrophic RasV12-glands induce parallel immune and stress responses.
(A) Common and specific genesets significantly upregulated (log2(beta) ≥1; q-value ≤0.05) in either RasV12, lglRNAi;RasV12, or lglRNAi;RasV12-PP compared to w1118-glands. (B) PCA including all transcriptome replicates of all sequenced genotypes. (C) Left: Comparative transcriptome analysis between proximal part (PP) of lglRNAi;RasV12- and entire w1118-glands. Significantly differentially expressed genes (log2(beta) ≥1; q-value ≤0.05) and genes belonging to GO-term ‘immune response’ (GO:0006955) highlighted in yellow and blue. Right: Gene expression in RasV12, lglRNAi;RasV12 or lglRNAi;RasV12-PP compared to w1118-glands for immune genes significantly upregulated in the PP. Blue arrows indicate strongest expression in the PP for the indicated genes between all three groups. Missing bars indicate absence of expression values in the RNAseq data. (D) GO term enrichment among significantly upregulated genes in RasV12-glands including terms related to activation of JNK (green) and immune responses (red). Numbers in bars indicate amount of upregulated genes belonging to associated GO term. (E) qPCR results for canonical JNK target genes (log2-transformed, fold-change over Rpl32) at 96 hr after egg deposition (AED). Lower/upper hinges of boxplots indicate 1st/3rd quartiles, whisker lengths equal 1.5*IQR and bar represents median. Significance evaluated by Student's t-tests (***p<0.001). (F) TREGFP1b reporter (green) signal in RasV12- and control-glands at 96 hr and 120 hr AED. Scalebar: 100 µm.
Figure 3—figure supplement 1
Drs is the only AMP detected to be expressed in the distal part of RasV12-glands until 96 hr.
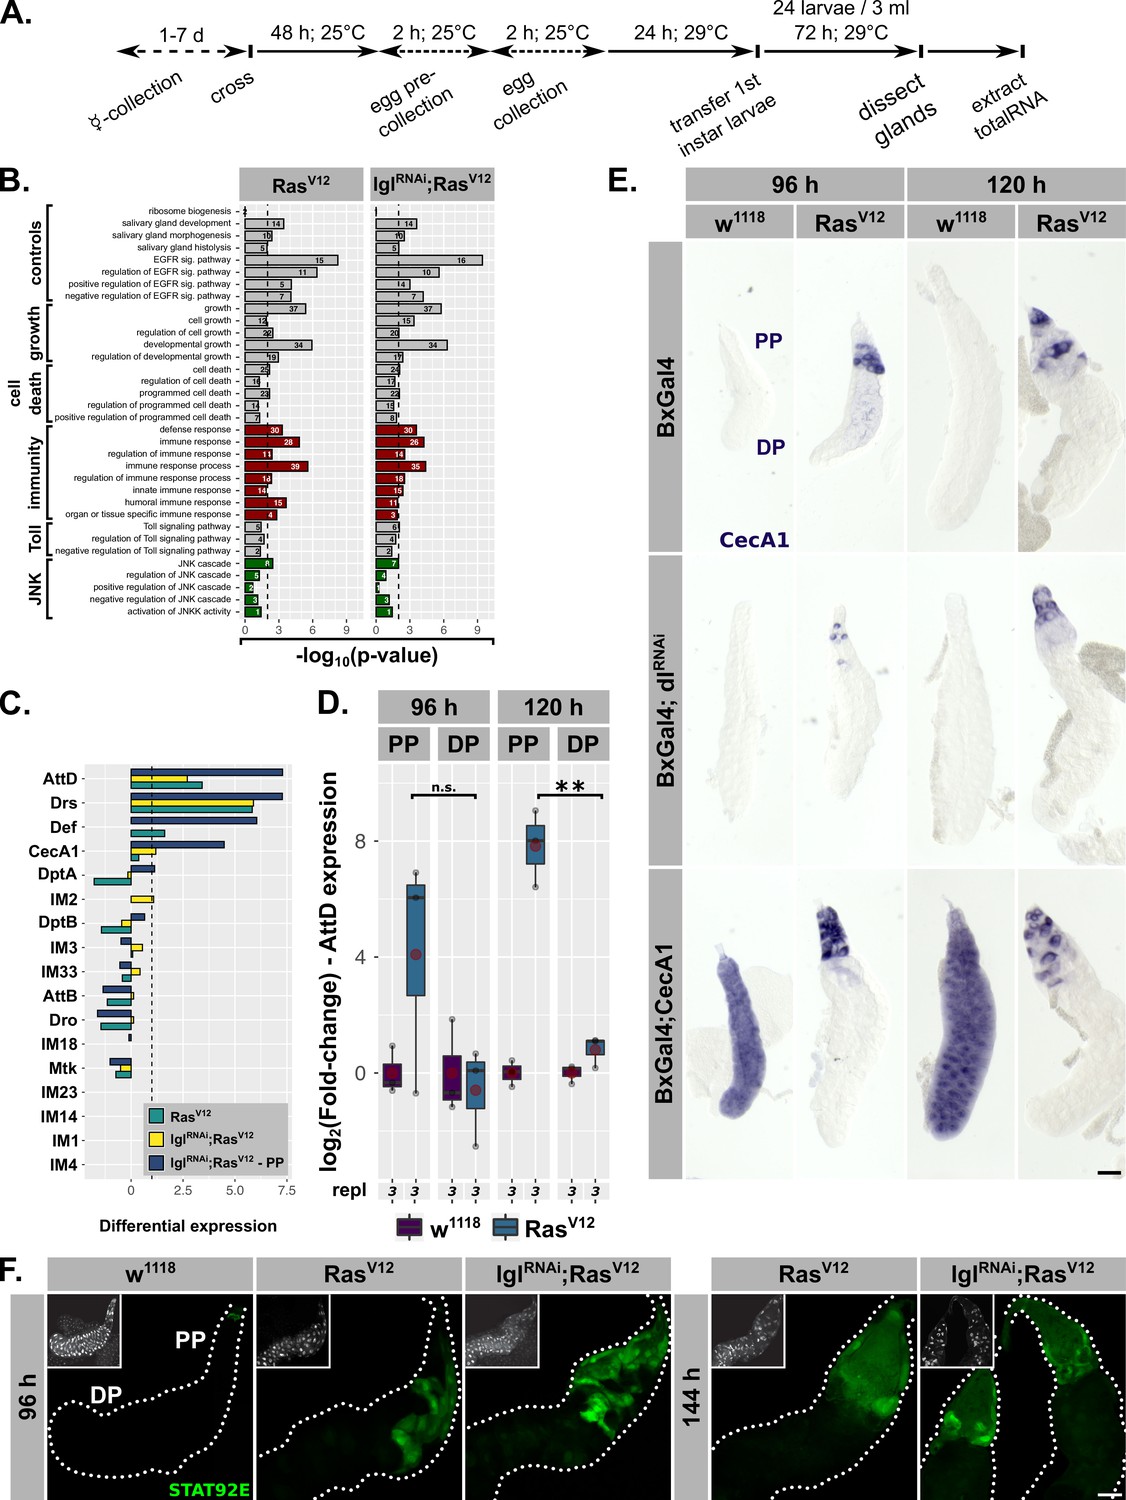
(A) Schematic overview of protocol for preparing tissues analyzed by RNAseq. (B) Comparative GO term enrichment analysis for genes significantly upregulated in either RasV12- or lglRNAi;RasV12-glands. Terms associated with activation of JNK (green) or immune response (red) are highlighted. GO terms for RasV12 also shown in Figure 3D. (C) Expression of AMP genes in RasV12, lglRNAi;RasV12 or lglRNAi;RasV12-PP- in comparison to w1118-samples. Missing bars indicate absence of expression values in the RNAseq data. (D) AttD gene expression as determined by qPCR in separated proximal part (PP) and distal part (DP) of RasV12- and w1118-control glands at 96 hr and 120 hr after egg deposition (AED; log2-transformed, fold-change over Rpl32). Lower/upper hinges of boxplots indicate 1st/3rd quartiles, whisker lengths equal 1.5*IQR, red circle and bar represent mean and median. Student's t-tests determine statistical significance (**p<0.01, n.s. p≥0.05). (E) CecA1-mRNA detected by in-situ hybridization in RasV12- and w1118-control glands at 96 hr and 120 hr AED upon coexpression of either a dlRNAi-knock-down or a CecA1-overexpression construct. (F) RasV12-, lglRNAi;RasV12- and w1118-control glands carrying the 10xStat92E-GFP reporter (green) at 96 hr and 144 hr AED (w1118-larvae pupate at 120 hr AED). Insets represent DAPI (white) staining. Scalebars: (E–F) 100 µm.
Figure 3—figure supplement 2

JNK-signaling is predominantly activated in the distal part of RasV12-glands.
(A) Gene expression for canonical target genes measured by qPCR (log2-transformed, fold-change over Rpl32). Lower/upper hinges of boxplots indicate 1st/3rd quartiles, whisker lengths equal 1.5*IQR and bar represents median. Significance evaluated by Student's t-tests (***p<0.001, **p<0.01, *p<0.05, n.s. p≥0.05). Results for Mmp1, upd2 and upd3 in RasV12- and w1118-glands also presented in Figure 3E. (B) Activation of TREGFP1b reporter (green) used to evaluate induction of JNK-signaling at 96 hr and 120 hr after egg deposition (AED). RasV12 and w1118 images also presented in Figure 3F. Scalebar: 100 µm.
Figure 4 with 1 supplement

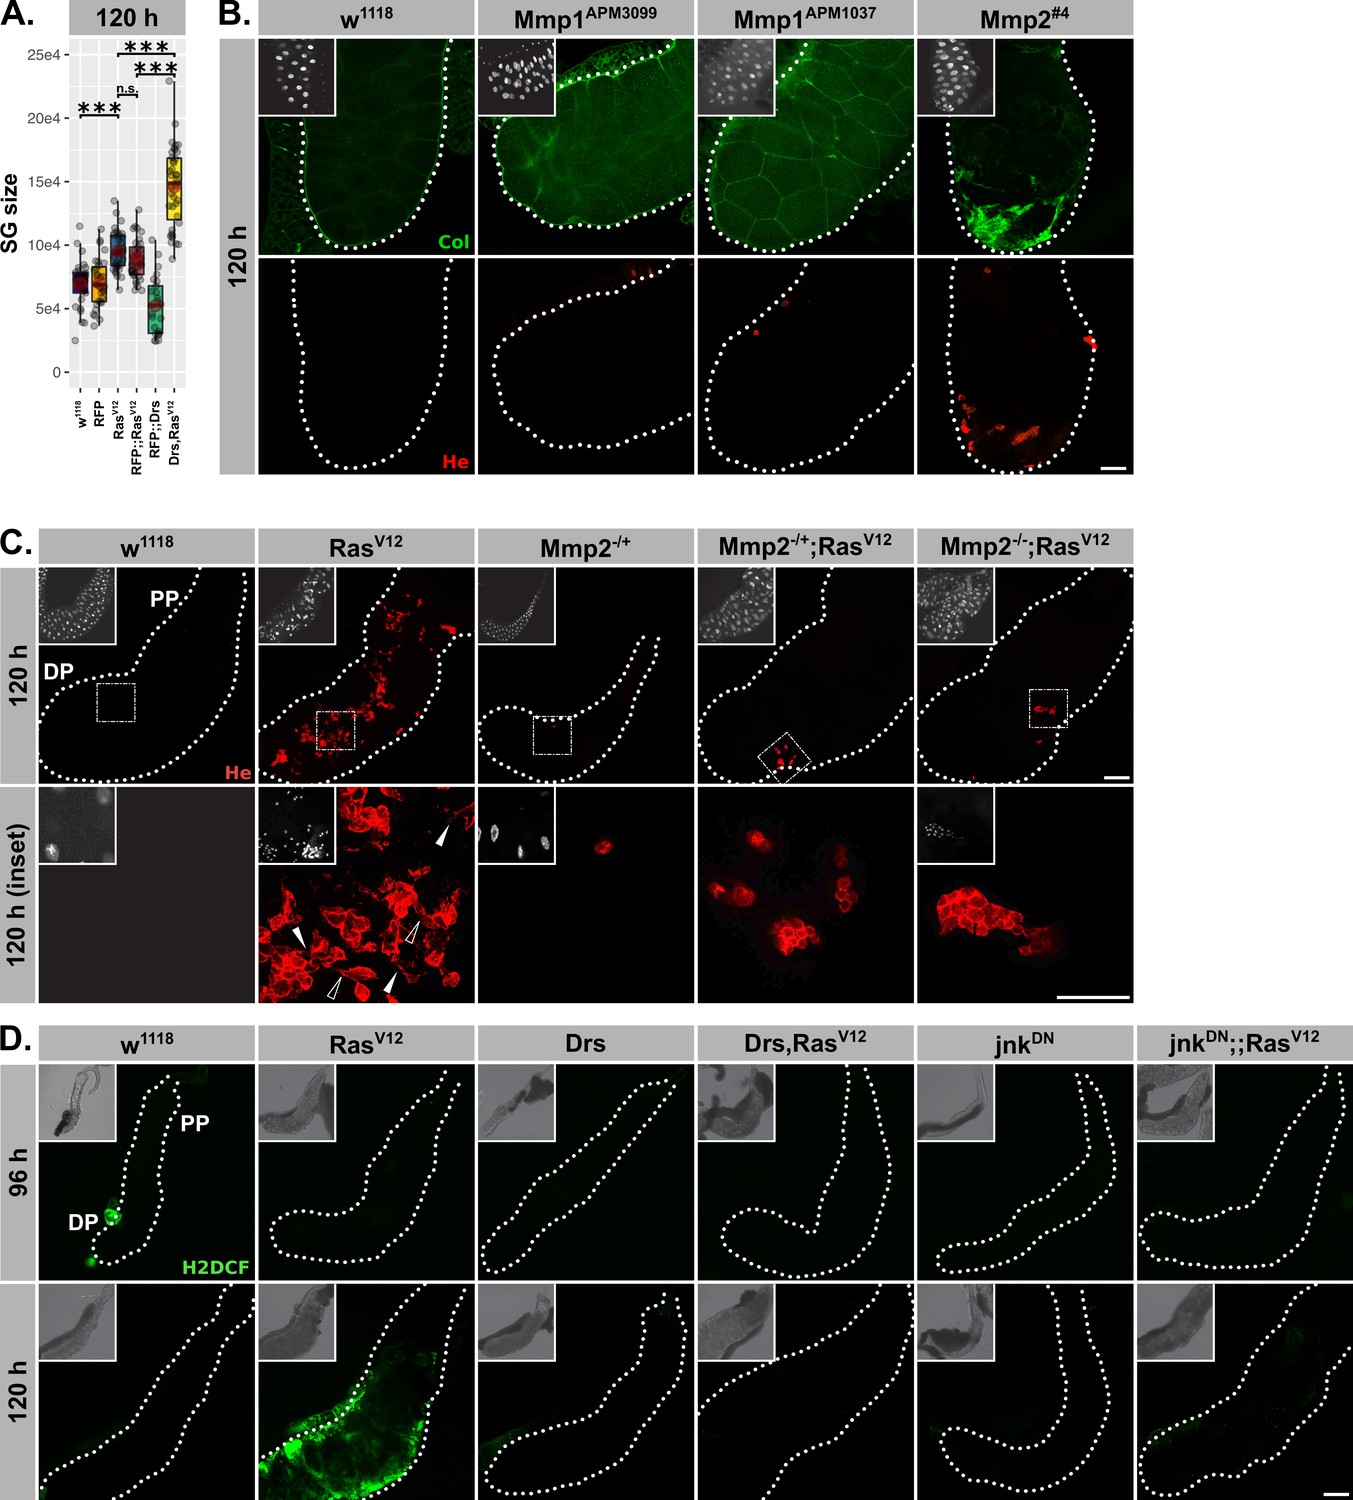
Drs overexpression and JNK inhibition individually prevent tissue disintegration.
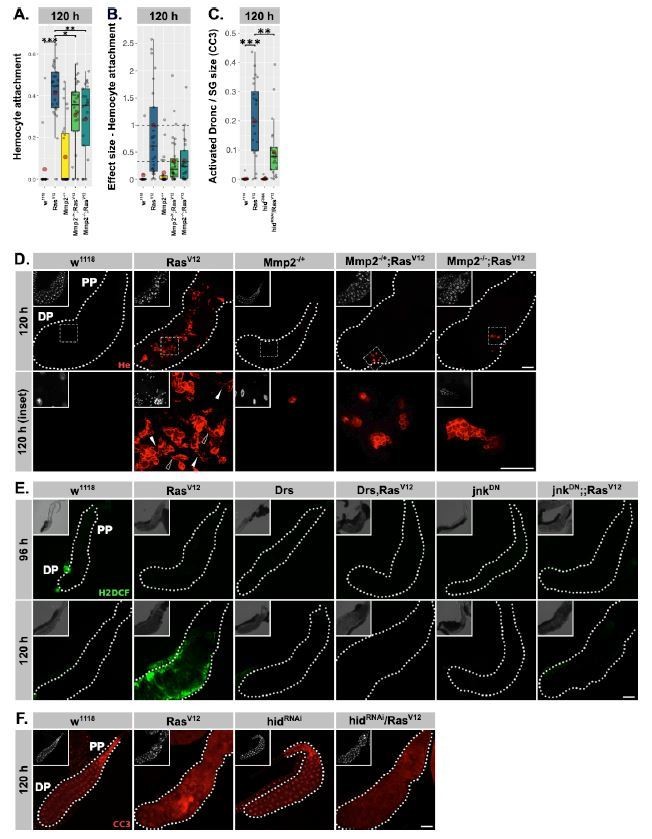
(A) Drs-specific in-situ hybridization identifies endogenous (RasV12, jnkDN;;RasV12) and exogenous (Drs, Drs,RasV12) Drs expression. (B) Collagen-GFP trap (vkgG00454, green) and Hemese staining (red) identify integrity of BM and hemocyte attachment to gland surface. Arrows indicate BM-free areas occupied and surrounded by hemocytes. Insets show DAPI (white) staining. (C) Size of salivary glands measured as outlined area in captured images of indicated genotypes at 96 hr and 120 hr after egg deposition (AED). (D) Hemocyte attachment at 96 hr and 120 hr AED represented as ln(Hemese-area)/ln(SG-area). (E) log2-transformed, Rpl32-normalized gene expression values for matrix metalloproteinases obtained by qPCR at 96 hr and 120 hr AED. (F) Hemocyte attachment at 120 hr AED in RasV12-glands hetero- and homozygous mutant for Mmp2 (Mmp2k00604). (G) Effect size of hetero- and homozygous mutant Mmp2-allele (Mmp2k00604) on hemocyte attachment to and compared to RasV12-glands. Mean of hemocyte attachment in RasV12-glands at 120 hr was set to ‘1’. (E) and (F) represent the same data points. Scalebars: (A–B) 100 µm. Boxplots in (C–G): lower/upper hinges indicate 1st/3rd quartiles, whisker lengths equal 1.5*IQR, red circle and bar represent mean and median. Significance evaluated by Student's t-tests (***p<0.001, **p<0.01, *p<0.05, n.s. p≥0.05).
Figure 4—figure supplement 1
Hemocyte recruitment requires JNK-dependent Mmp2 expression.
(A) SG size as measured by outlining images of the 120 hr-old, experimental and control glands with the indicated genotypes. Lower/upper hinges of boxplots indicate 1st/3rd quartiles, whisker lengths equal 1.5*IQR, red circle and bar represent mean and median. Significance evaluated by Student's t-tests (***p<0.001, n.s. p≥0.05). (B) Staining of BM via Collagen-GFP trap (green) and attached hemocytes via Hemese antibody (red) upon sole Mmp1- or Mmp2-overexpression. (C) w1118-control and RasV12-glands hetero- or homozygous for Mmp2 (Mmp2k00604) stained for attached hemocytes with anti-Hemese-antibody. Lower image row shows magnifications of the insets in the upper row. Filopodia (filled arrowheads) and lamellipodia (open arrowheads) indicate hemocyte activation on the surface of RasV12-, but not glands mutant for Mmp2. (D) H2DCF-staining (green) of live glands as general means to evaluate the presence of ROS at 96 hr and 120 hr after egg deposition (AED). Insets: (B–C) DAPI, (D) brightfield. Scalebars: (B, C. Upper, D) 100 µm, (C Lower) 50 µm.
Figure 5 with 3 supplements

Drs overexpression inhibits JNK-activation.
(A) Schematic representation of the JNK-pathway including read-outs (green) employed to track its activation. (B) qPCR results for canonical JNK-target genes (log2-transformed, fold-change over Rpl32) at 120 hr after egg deposition (AED). (C) Quantification of activated jnk by staining with phosphorylation-sensitive antibody normalized for the salivary gland (SG) size per gland at 120 hr AED. (D.) Quantification of TREGFP1b signal normalized for SG size per gland indicating JNK-dependent transcriptional activation at 120 hr AED. (E) Visualization of phosphorylated jnk in RasV12-glands with and without Drs-coexpression. (F) Distribution of TREGFP1b reporter signal in RasV12-glands in the presence or absence of coexpressed Drs. Insets: (E–F) DAPI. Scalebars: (E–F) 100 µm. Boxplots in (B–D): lower/upper hinges indicate 1st/3rd quartiles, whisker lengths equal 1.5*IQR, red circle and bar represent mean and median. Significance evaluated by Student's t-tests (***p<0.001).
Figure 5—figure supplement 1
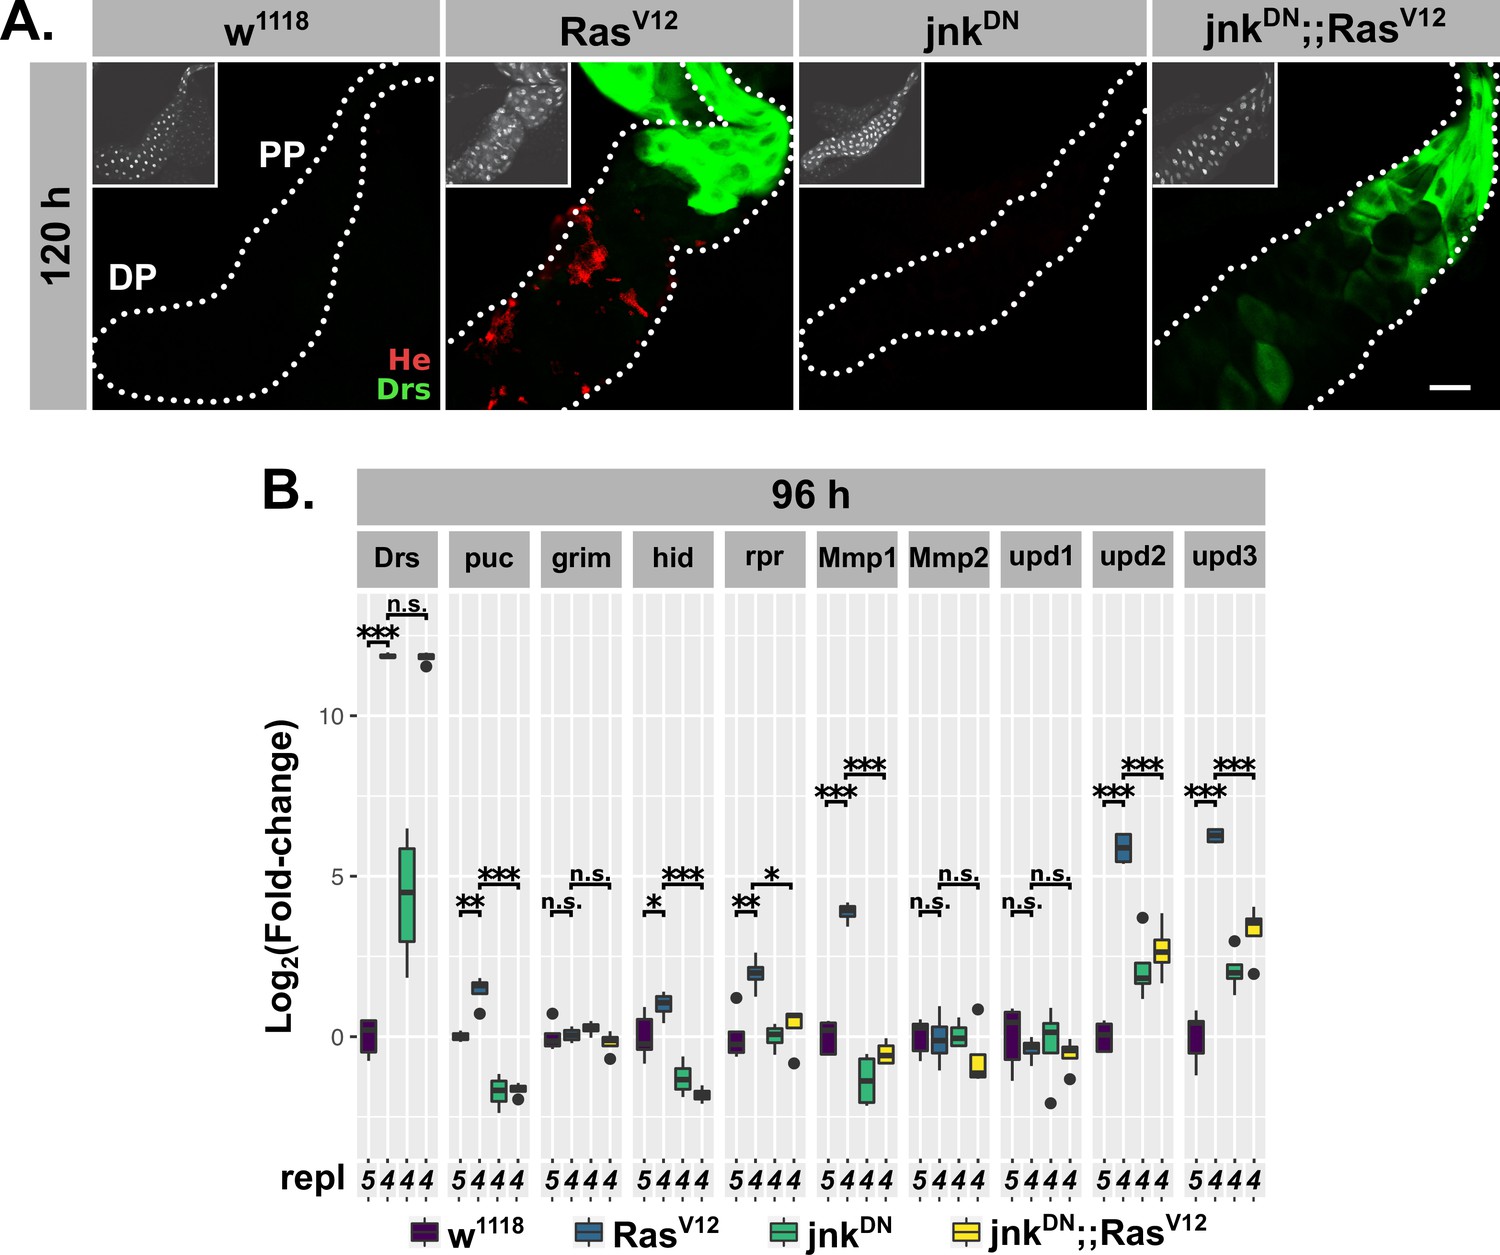
JNK-signaling does not regulkate Drs expression.
(A) DrsGFP reporter (green) and Hemese antibody (red) used to detect endogenous Drs expression and attached hemocytes. Scalebar indicates 100 µm. (B) Expression of Drs and JNK-target genes as measured by qPCR (log2-transformed; normalized to Rpl32 expression) in RasV12-glands with and without inhibited JNK-pathway at 96 hr after egg deposition (AED). Boxplots comprise lower/upper hinges which inidcate 1st/3rd quartiles, whiskers with lengths equal to 1.5*IQR, red circle and bar representing mean and median. Significance levels evaluated by Student's t-tests (***p<0.001, **p<0.01, *p<0.05, n.s. p≥0.05).
Figure 5—figure supplement 2
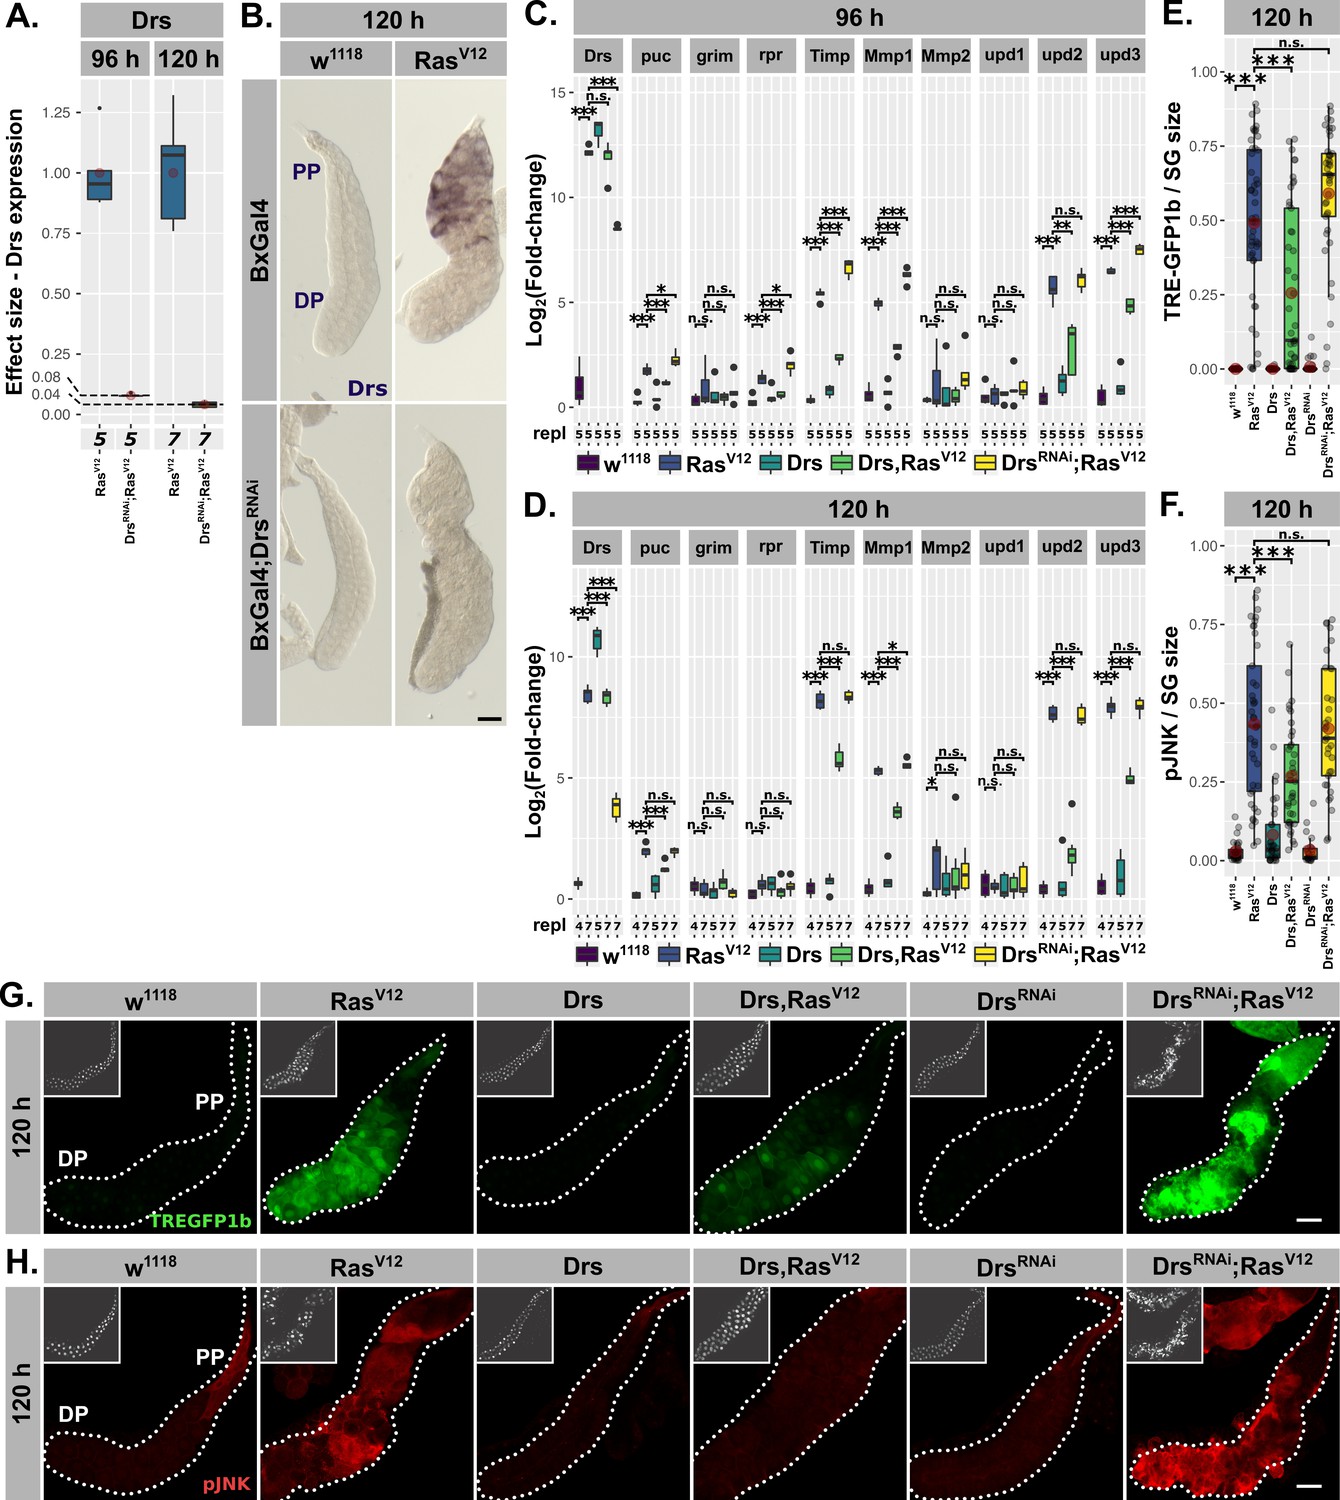
Drs levels determine JNK-activation.
(A) Effect size of Drs-knock-down on Drs-expression in RasV12-glands. Mean RasV12-expression was set to ‘1’ separately at 96 hr and 120 hr after egg deposition (AED). (B) ISH with Drs-probe in RasV12-glands with or without coexpressed DrsRNAi-construct. (C–D) qPCR-derived expression values for Drs and JNK target genes in RasV12-glands with and without Drs-overexpression or Drs-knock-down at 96 hr AED and 120 hr AED (log2-transformed; normalized to Rpl32 expression). (E/G) RasV12-glands with in- (Drs) or decreased (DrsRNAi) Drs expression carrying TREGFP1b-reporter (green) to detect JNK-dependent transcriptional activation and corresponding quantifications of reporter signal normalized for SG size. (F/H) RasV12-glands with in- (Drs) or decreased (DrsRNAi) Drs expression stained for activated jnk with a phosphorylation sensitive antibody (pJnk, red) and corresponding quantifications of detected signal normalized for SG size. Insets: (G–H) DAPI. Scalebars: (B.,G-H.) 100 µm. Boxplots in (A, C-F): lower/upper hinges indicate 1st/3rd quartiles, whisker lengths equal 1.5*IQR, red circle and bar represent mean and median. Significance evaluated by Student's t-tests (***p<0.001, **p<0.01, *p<0.05, n.s. p≥0.05). Mmp1 and Mmp2 expression in (C–D) for w1118- and RasV12-glands also shown in Figure 4E. Images for w1118, RasV12, Drs, and Drs,RasV12 in (G–H) also presented in Figure 5E–F.
Figure 5—figure supplement 3
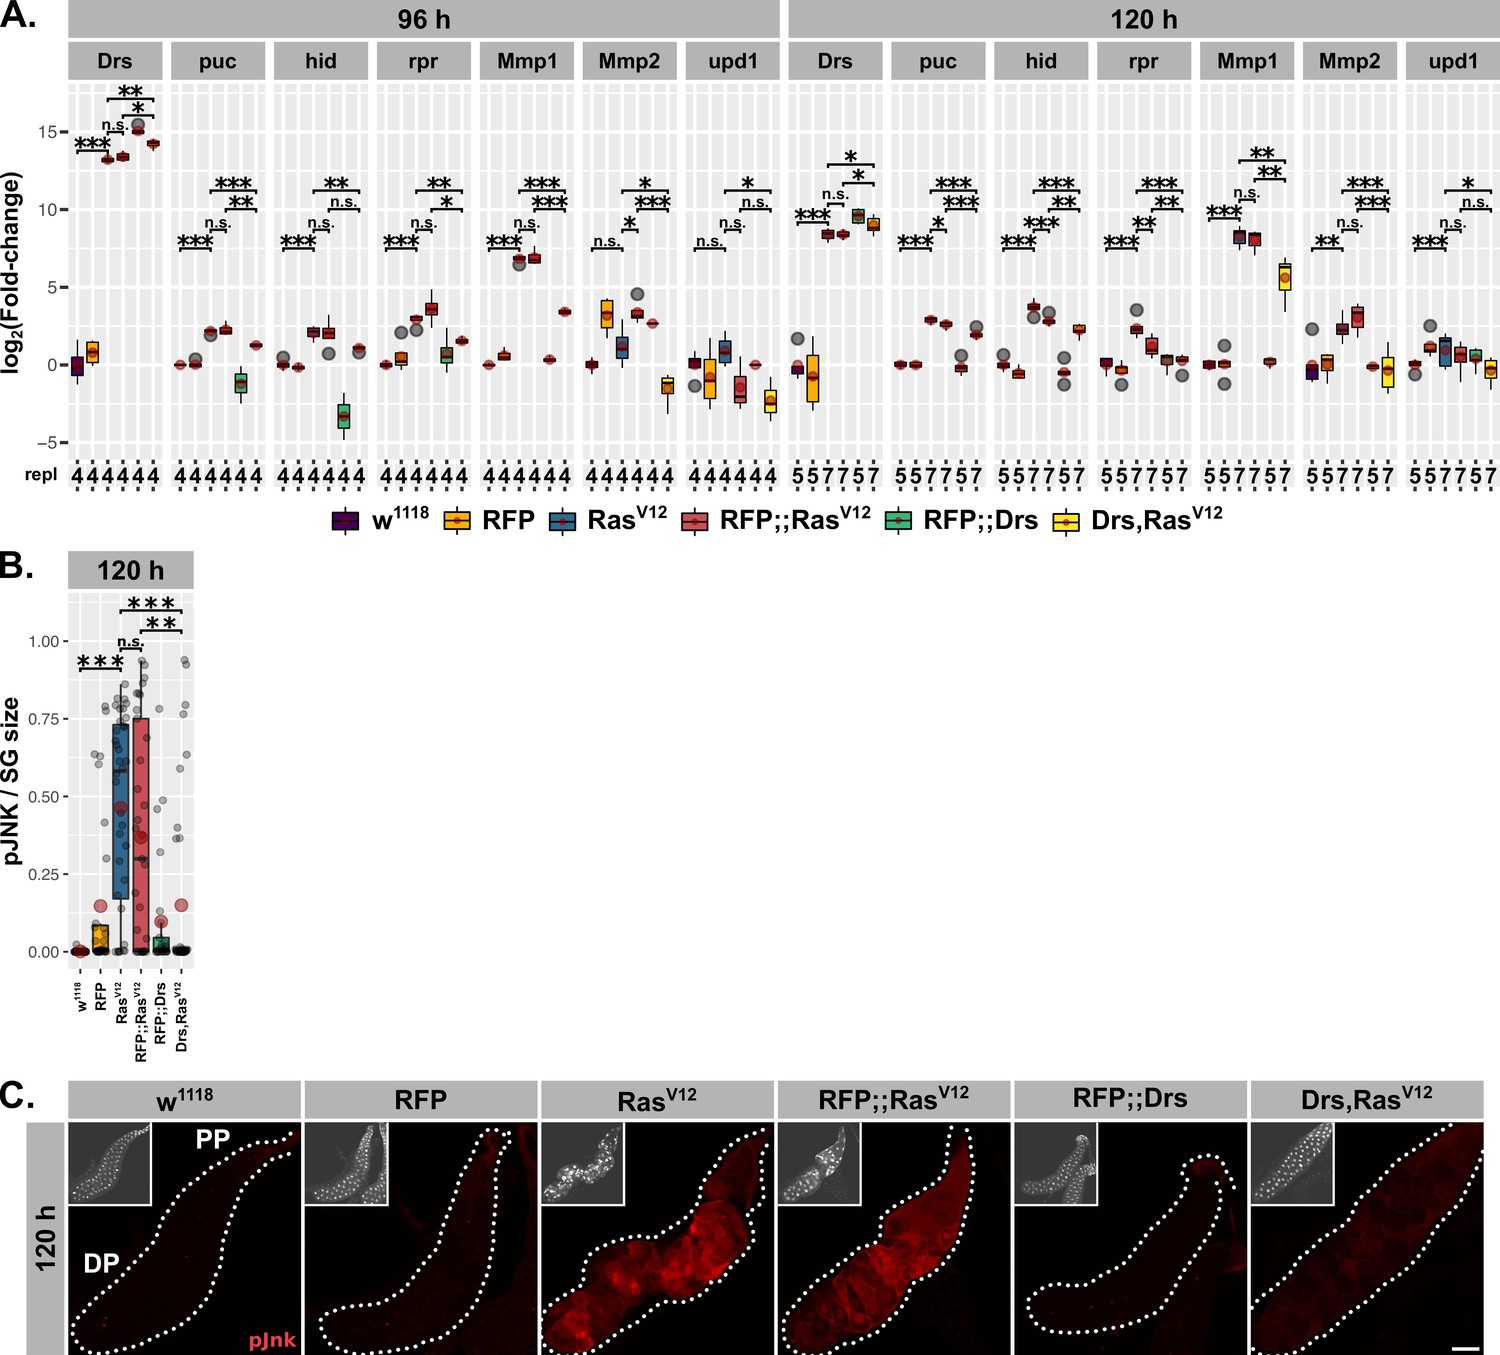
Overexpression of Drs is specific in its effect on JNK-signaling.
(A) Expression values for Drs and JNK target genes as determined by qPCR for RasV12-glands coexpressing either Drs or mCD8::RFP as an UAS-dilution control at 96 hr and 120 hr after egg deposition (AED; log2-transformed; normalized to Rpl32 expression). (B–C.) Quantifications and prototypical representations of activated jnk assessed by anti-phosphoJNK-antibody staining and normalized for gland size in RasV12-glands coexpressing Drs or mCD8::RFP. Insets in (C) indicate DAPI (white) and the scalebar illiustrates 100 µm. Boxplots in (A–B): lower/upper hinges indicate 1st/3rd quartiles, whisker lengths equal 1.5*IQR, red circle and bar represent mean and median. Significance evaluated by Student's t-tests (***p<0.001, **p<0.01, *p<0.05, n.s. p≥0.05).
Figure 6 with 1 supplement
Drs inhibits programmed cell death.
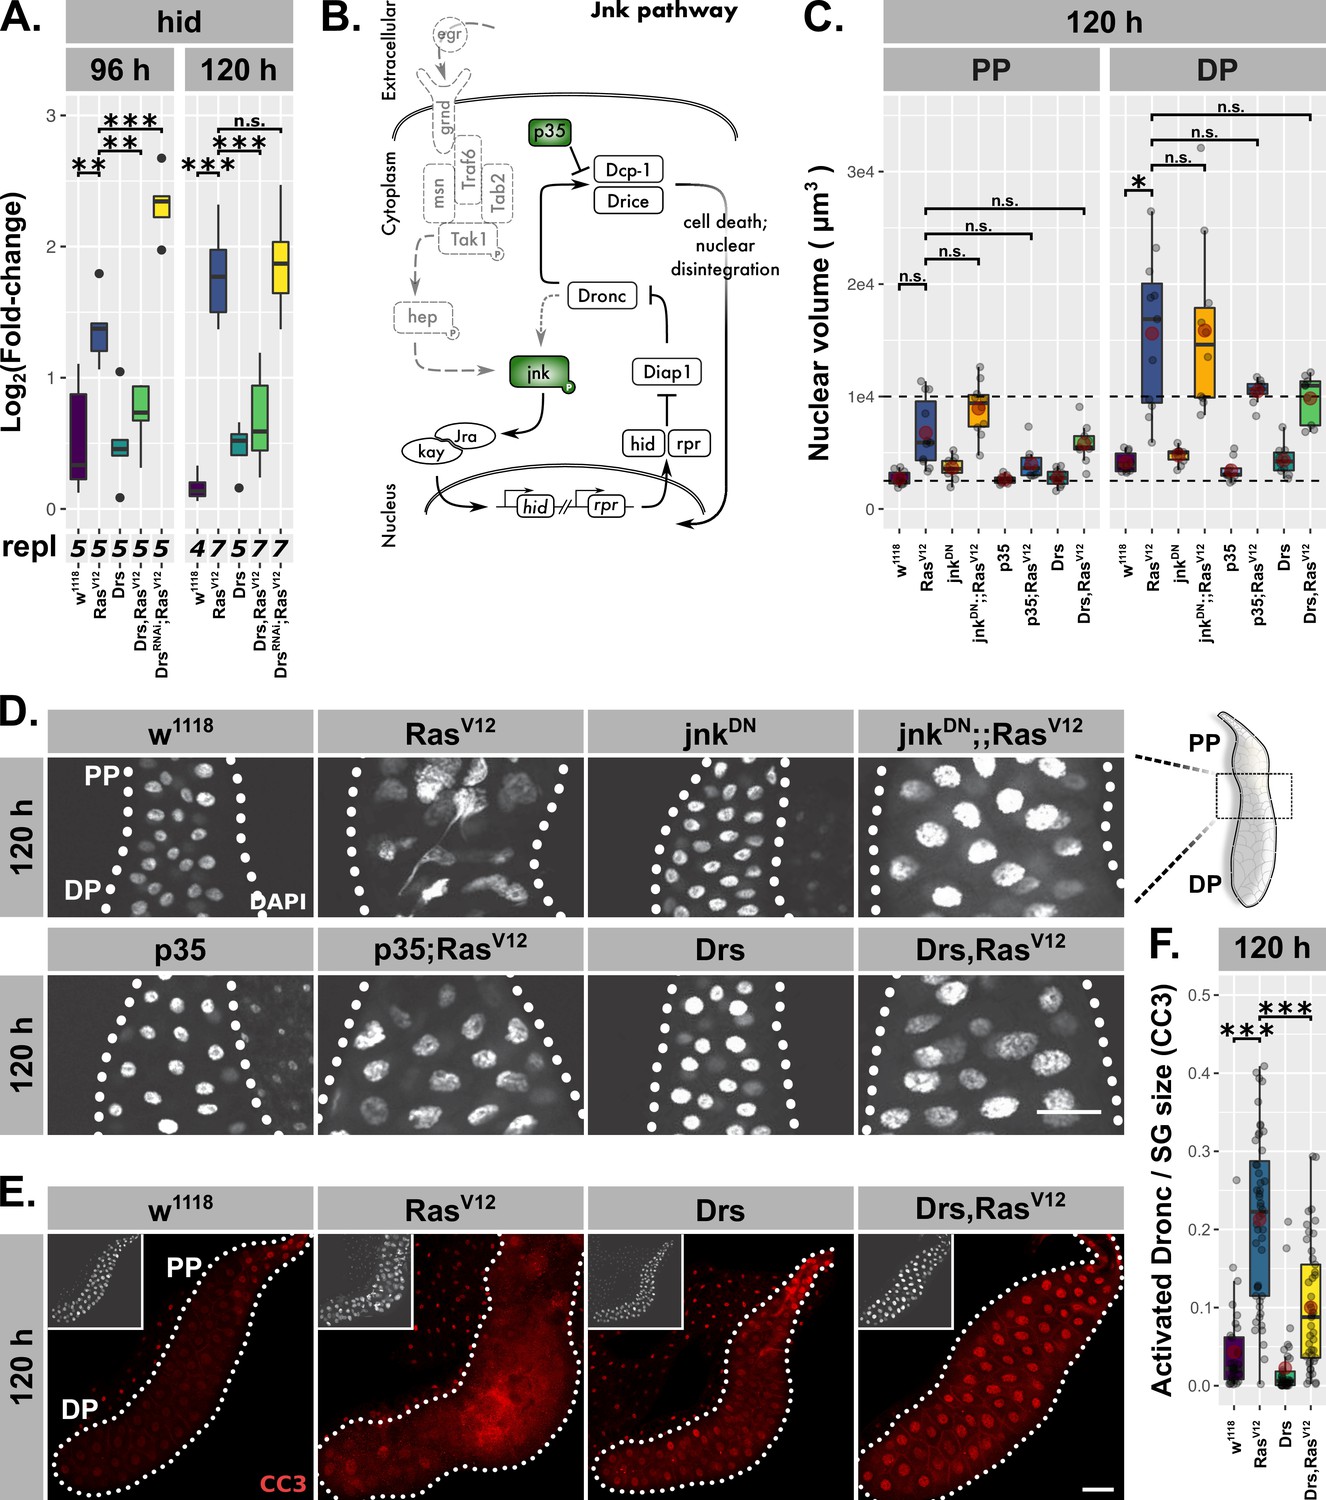
(A) Hid expression as measured by qPCR and plotted as log2-transformed values normalized to Rpl32-expression in RasV12-glands with in- (Drs) or decreased (DrsRNAi) Drs expression. (B) Schematic representation of the JNK-pathway including used methods of interference (green). (C) Nuclear volumina derived from z-stacks of DAPI-stained salivary glands (SGs) and averaged per gland at 96 hr and 120 hr after egg deposition (AED). (D) DAPI-stained (white) SG nuclei to indicate nuclear size and disintegration. (E–F) RasV12-glands with increased Drs expression stained with anti-CC3-antibody to detect Dronc activation (red) and corresponding quantifications of detected signal normalized for SG size. Insets in (E) show DAPI and scalebars in (D–E) represent 100 µm. Lower/upper hinges of boxplots in (A, C, F) indicate 1st/3rd quartiles, whisker lengths equal 1.5*IQR, red circle and bar represent mean and median. Significance evaluated by Student’s t-tests (***p<0.001).
Figure 6—figure supplement 1

Drs inhibits programmed cell death via hid and Dronc.
(A–B) Quantifications and prototypical examples of RasV12-glands with in- (Drs) or decreased (DrsRNAi) Drs expression stained for activated Dronc (red) via the CC3-antibody, JNK-dependent transcriptional activation via the TREGFP1b reporter (green) and nuclei size and disintegration via DAPI (white). Arrows in magnified images point toward strong CC3-staining correlating with disintegrating nuclei. (C–D) CC3-staining (red) of RasV12-glands with coexpressed Drs or mCD8::RFP as a UAS-dilution control and corresponding quantifications. (E–F) Staining and quantification of CC3 to measure Dronc-activation upon hid-knock-down in RasV12-glands. All quantifications (A, C, E) of CC3-staining are normalized per gland for SG size. Insets: (B, D, F) DAPI. Scalebars: (B, D, F) 100 µm. Lower/upper hinges of boxplots in (A, C, E) indicate 1st/3rd quartiles, whisker lengths equal 1.5*IQR, red circle and bar represent mean and median. Significance evaluated by Student's t-tests (***p<0.001, **p<0.01, *p<0.05, n.s. p≥0.05).
Figure 7 with 1 supplement
Drs inhibits the JNK-feedback loop.
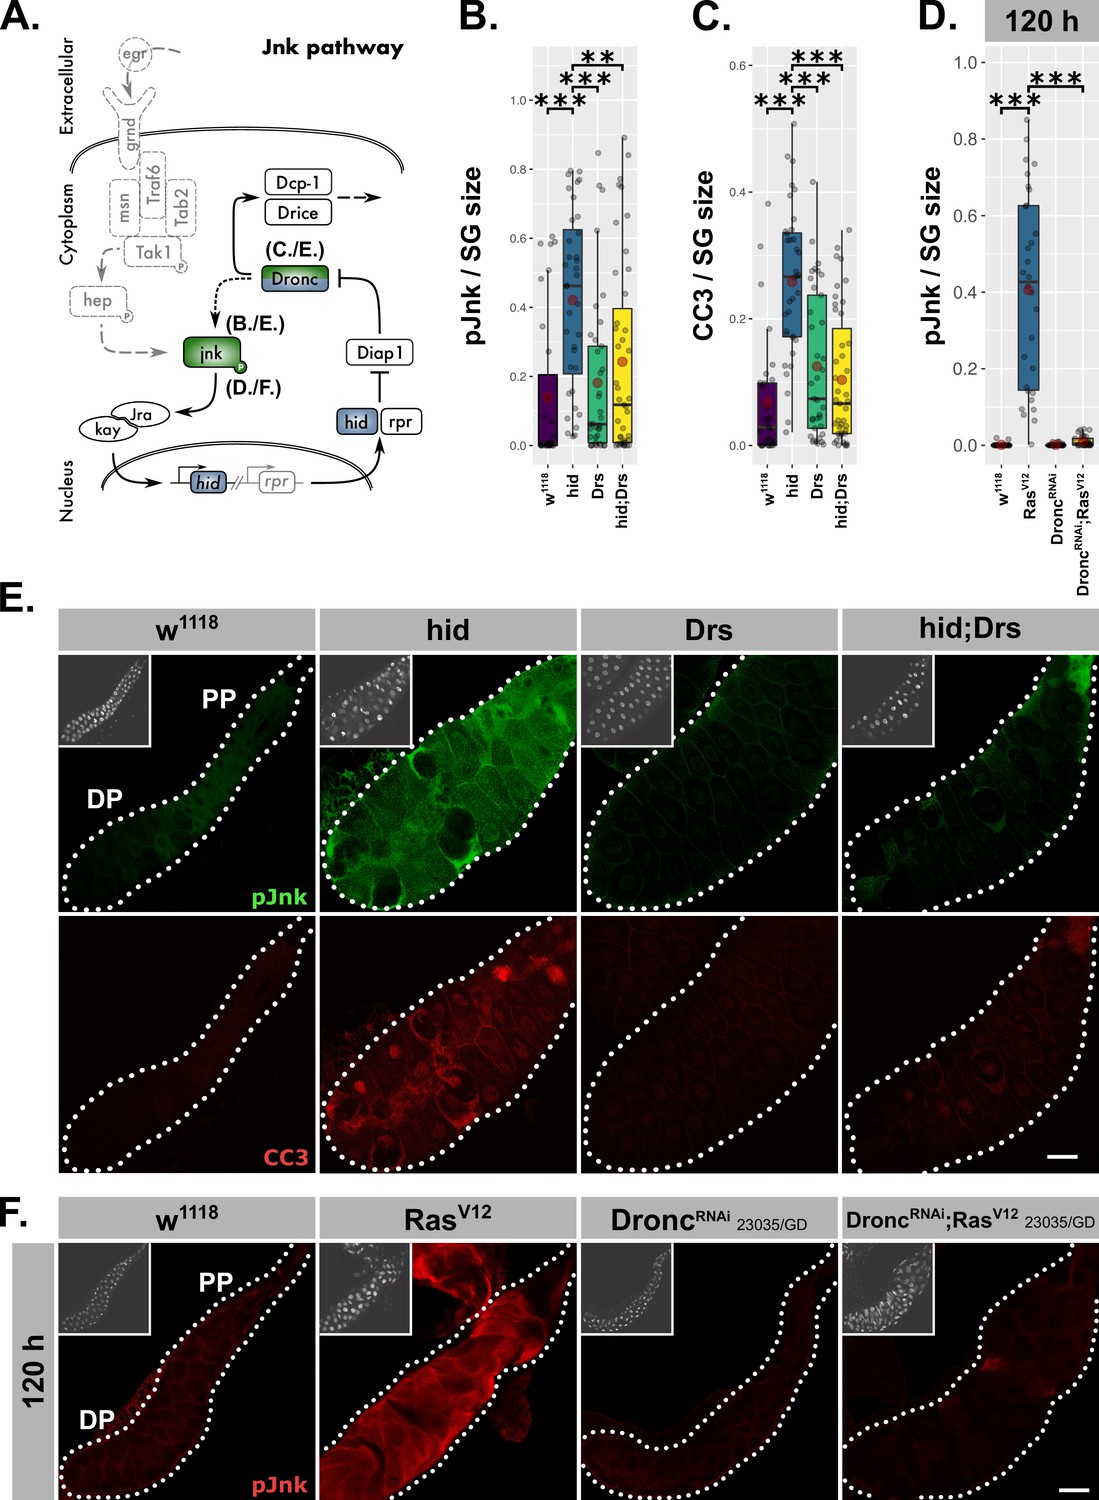
(A) Schematic representation of the JNK-feedback loop including levels of interference (blue) and used read-outs of its activity (green). hid-overexpressing glands with or without coexpressed Drs were quantified for (B) activated jnk via a phosphorylation sensitive antibody and (C) activated Dronc via the CC3-antibody. (D) Activated jnk (pJnk) was quantified and normalized to tissue size in RasV12-glands upon knockdown of Dronc. (E) Salivary glands solely overexpressing hid with or without Drs-coexpression were stained for activated jnk (green) and activated Dronc (red). (F) Activated jnk (red) was detected in RasV12-glands with or without Dronc-knock-down at 120 hr AED. Insets: (E–F) DAPI. Scalebars: (E–F) 100 µm. Boxplots in (B–D): lower/upper hinges indicate 1st/3rd quartiles, whisker lengths equal 1.5*IQR, red circle and bar represent mean and median. Significance evaluated by Student's t-tests (***p<0.001, **p<0.01).
Figure 7—figure supplement 1
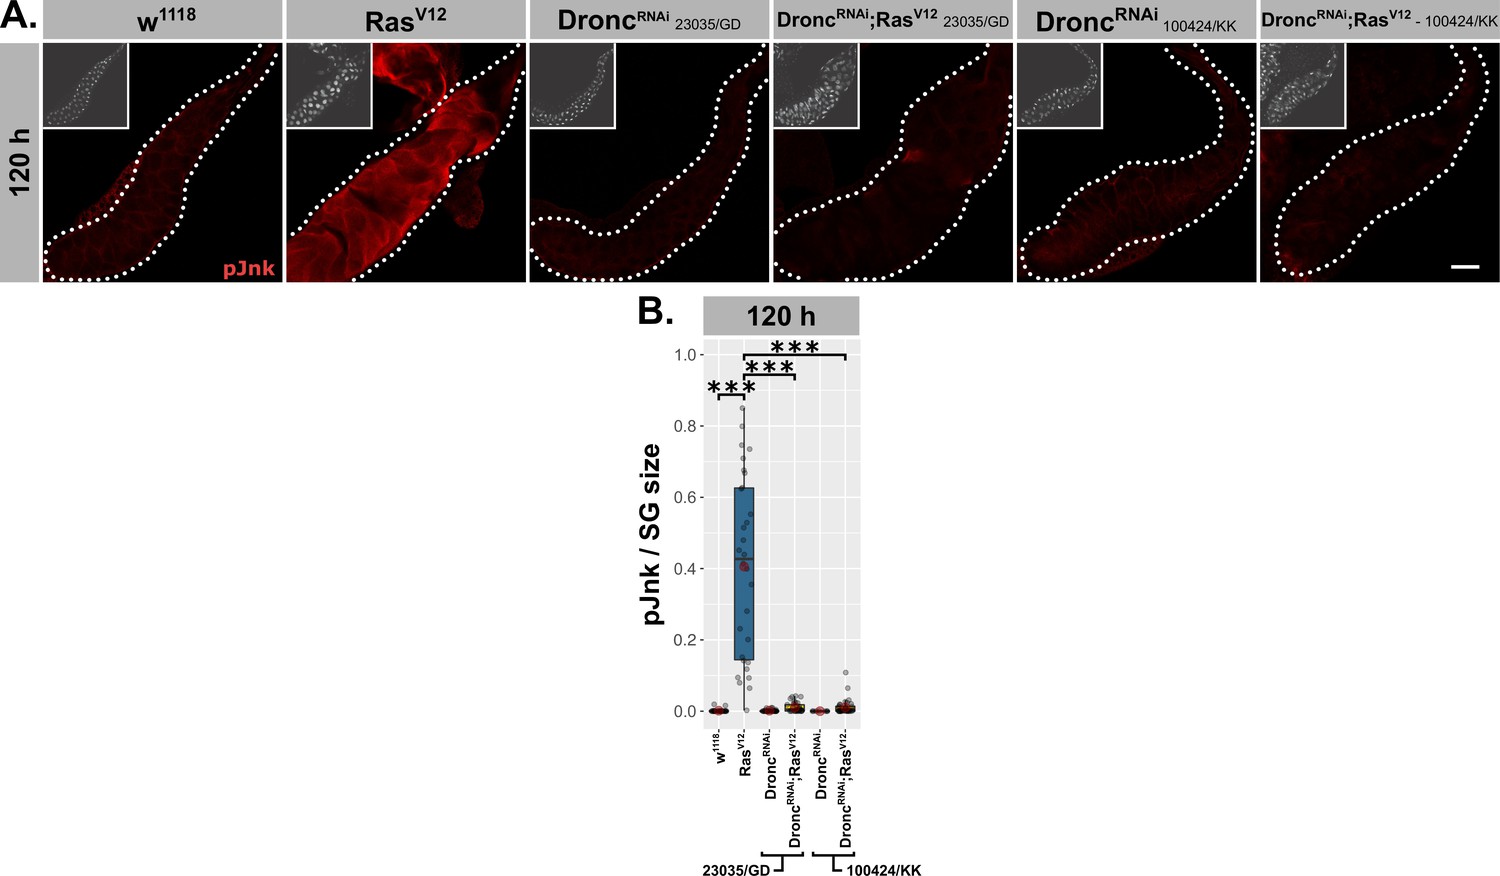
Dronc-reduction blocks the JNK-feedback loop in RasV12-glands.
(A) RasV12-glands with or without Dronc-knock-down were stained for activated jnk with a phosphorylation sensitive antibody at 120 hr after egg deposition (AED) and (B) the signal was quantified per SG and normalized for its size. Results for both RNAi-lines used, 23035/GD and 100424/KK, were consistent. Insets in (A) show DAPI and scalebar represents 100 µm. Lower/upper hinges of boxplots in (B) indicate 1st/3rd quartiles, whisker lengths equal 1.5*IQR, red circle and bar represent mean and median. Significance evaluated by Student's t-tests (***p<0.001).
Figure 8

Tissue-autonomous antagonizes cellular immune response via JNK-inhibition in RasV12-glands .
dl-mediated Drs expression inhibits JNK activation in the entire RasV12-gland until 96 hr after egg deposition (AED). At 120 hr AED, dl and thus Drs expression is reduced to the PP, derepressing full JNK-activation in the DP. Consequently, JNK-dependent expression of hid and Mmp2 participate in stimulating nuclear and tissue disintegration, which eventually leads to the interference with tissue growth and integrity by the cellular immune response.
Author response image 1
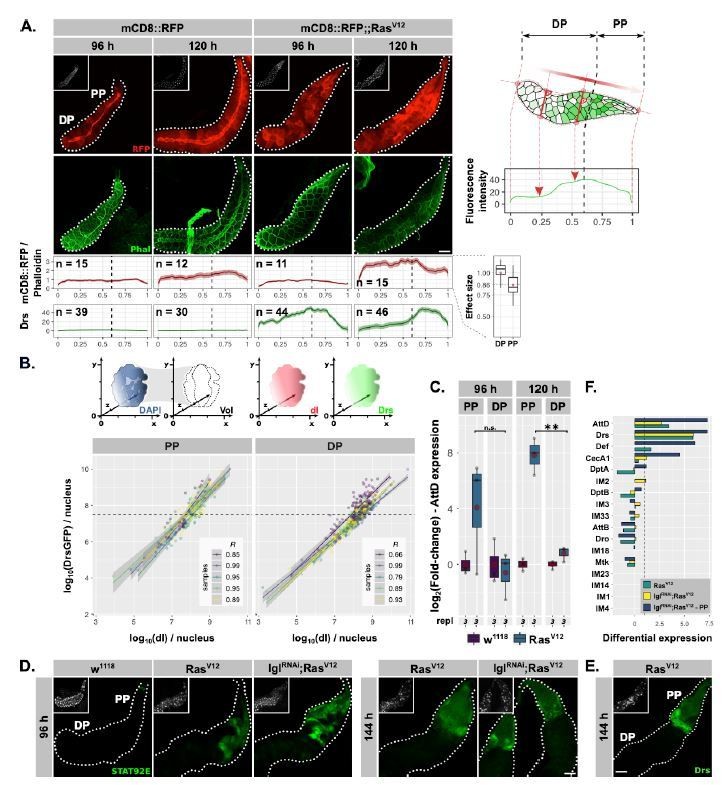
RasV12-glands show intrinsic anterior-posterior separation.
(A) Right: Schematic representation of deployed algorithm to measure fluorescene signals along all vertical axis perpendicular to the glands longitudinal axis. Left: mCD8::RFP;;RasV12- and mCD8::RFP -control glands stained with Phalloidin (green) to assess BxMS1096 driven, Phalloidin-normalized RFP-expression at 96 h and 120 h AED along the longitudinal gland axis (middle). Signals averaged across n=15 glands showed 86% of the signal intensity in the proximal gland part (PP) compared to the distal (DP) (right). DrsGFP-reporter intensities along the longitudinal gland axis in RasV12- and w1118-control glands at 96 h and 120 h AED (bottom). (B) Upper: Schematic representation of the correlation assay. DAPI-signal defines nuclei location and volume used to subsequently accumulate fluorescence signals from nuclear DrsGFP-reporter and dl-staining. Lower: Scatterplot of associated dl- and Drs-signals per nucleus in PP or DP across 5 glands at 96 h AED. Pearson correlation coefficient shown for all 5 samples. Lines with confidence intervals indicate linear regression for Drs- as a function of dl-signal per sample and gland compartment. (C) AttD gene expression as determined by qPCR in separated PP and DP of RasV12- and w1118-control glands at 96 h and 120 h AED (log2-transformed, fold-change over Rpl32). Lower/upper hinges of boxplots indicate 1st/3rd quartiles, whisker lengths equal 1.5*IQR, red circle and bar represent mean and median. Student's t-tests determine statistical significance (** p<0.01, n.s. p≥0.05). (D) RasV12-, lglRNAi;RasV12- and w1118-control glands carrying the 10xStat92E-GFP reporter (green) at 96 h and 144 h AED (w1118-larvae pupate at 120 h AED). (E) DrsGFP-reporter signal in RasV12-glands at 144 h AED. (F) Expression of AMP genes in RasV12, lglRNAi;RasV12 or lglRNAi;RasV12-PP- in comparison to w1118-samples. Missing 1009 bars indicate absence of expression values in the RNAseq data. Insets: (D-E) DAPI. Scalebars: (D-E) 100 µm.
Author response image 2
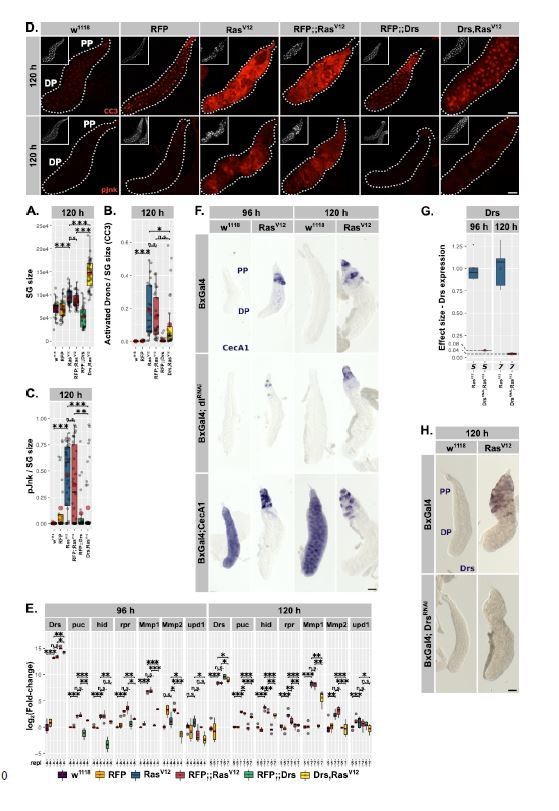
Drs asserts specific function on JNK-signaling not mimicked by other detected AMPs.
(A) SG size as measured by outlining images of the 120 h-old, experimental and control glands with the indicated genotypes. (B) Quantified CC3-staining in RasV12-glands with coexpressed Drs or mCD8::RFP as a UAS-dilution control, normalized for gland size. (C). Quantifications of activated jnk assessed by antiphosphoJNK-antibody staining and normalized for gland size in RasV12-glands coexpressing Drs or mCD8::RFP. (D) Prototypical examples of Dronc- and JNK-activation in RasV12-glands with coexpressed Drs or mCD8::RFP. (E) Expression values for Drs and JNK target genes as determined by qPCR for RasV12-glands coexpressing either Drs or mCD8::RFP as a UAS-dilution control at 96 h and 120 h AED (log2-transformed; normalized to Rpl32 expression). (F) CecA1-mRNA detected by in-situ hybridization in RasV12- and w1118-control glands at 96 h and 120 h AED upon coexpression of either a dlRNAi-knock-down or a CecA1-overexpression construct. (G) Effect size of Drs-knock-down on Drs-expression in RasV12-glands. Mean RasV12-expression was set to “1” separately at 96 h and 120 h AED. (H) ISH with Drs-probe in RasV12-glands with or without coexpressed DrsRNAi-construct. Scalebars: (D/F/H) 100 µm. Insets: (D) DAPI. Boxplots: (A-C,E,G) lower/upper hinges indicate 1st/3rd quartiles, whisker lengths equal 1.5*IQR, red circle and bar represent mean and median. Significance evaluated by Student's t-tests (*** p<0.001, ** p<0.01, * p<0.05, n.s. p≥0.05).
Author response image 3
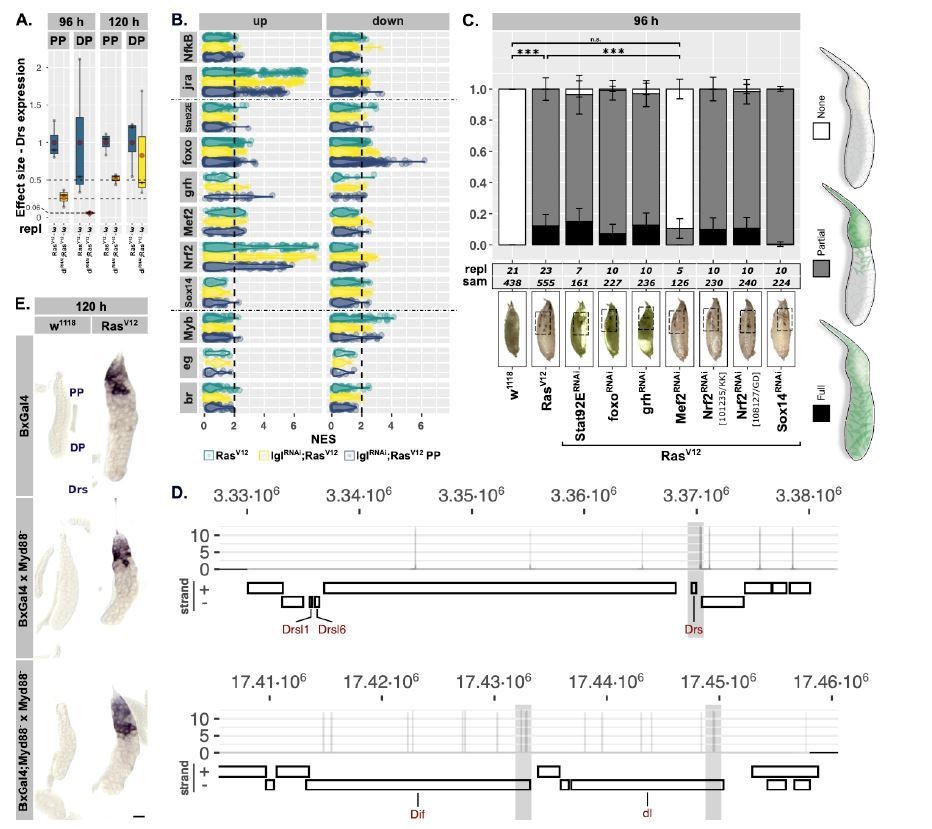
Apart from dorsal Drs is putatively regulated by Mef2.
(A) Effect sizes of dlRNAi-knock-down on Drs-expression in PP- and DP-compartments of and compared to RasV12-glands at 96 and 120 h AED. Mean of Drs-expression in RasV12-glands was set to “1”. Boxplots: lower/upper hinges indicate 1st/3rd quartiles, whisker lengths equal 1.5*IQR, red circle and bar represent mean and median. (B) Transcription factor binding site analysis in up- and down-regulated genesets of RasV12-, lglRNAi;RasV12- and lglRNAi;RasV12-PP- samples. Normalized enrichment scores represent statistical overrepresentation (NES>2) of transcription factor binding motifs in the 6 screened genesets. Cis-BP-derived motifs were sorted into the displayed transcription factor groups. NFκB- and jra- as well as Myb-, eg- and br-motif groups were included as positive and negative examples. (C) DrsGFP-reporter based assay including screened RNAi-lines targeting transcription factors identified in binding site analysis. 3 different phenotypes were scored (right) per genotype and their mean and standard deviation plotted. Dunn’s post-hoc test conducted on “None”phenotype to validate significant differences (*** p<0.001, n.s. p≥0.05). To avoid false positives, melanisation was monitored in pupae (insets) to confirm RasV12-expression (Hauling et al., 2014). (D) Wider Drs-locus on “3L”- and “Dif/dl”-locus on “2L”-chromosome shown including outlines for gene loci encoded on plus and minus strands. Log-transformed motif scores are represented as a function of the motif’s location along the respective gene loci. (E) Drs in-situ hybridization in 120 h-old RasV12- and control-glands hetero- or homozygous mutant for Myd88 (Myd88KG03447). Scalebar corresponds to 100 µm.
Author response image 4
Mmp2 expression necessary for hemocyte attachment to the surface of RasV12-glands.
(A) Hemocyte attachment at 120 h AED in RasV12-glands hetero- and homozygous mutant for Mmp2 (Mmp2k00604). (B) Effect size of hetero- and homozygous mutant Mmp2-allele (Mmp2k00604) on hemocyte attachment to and compared to RasV12-glands. Mean of hemocyte attachment in RasV12-glands at 120 h was set to “1”. E. and F. represent the same data points. (C) Quantification of CC3 to measure Dronc-activation upon hidknock-down in RasV12-glands. (D) w1118-control and RasV12-glands hetero- or homozygous for Mmp2 (Mmp2k00604) stained for attached hemocytes with anti-Hemese-antibody. Lower image row shows magnifications of the insets in the upper row. Filopodia (filled arrowheads) and lamellipodia (open arrowheads) indicate hemocyte activation on the surface of RasV12-, but not glands mutant for Mmp2. (E) H2DCF-staining of live glands as general means to evaluate the presence of ROS at 96 h and 120 h AED. (F) Dronc-activation upon hid-knock-down in RasV12glands indicated by CC3-staining normalized by SG size per gland. Insets: (D,F) DAPI, (E) brightfield. Scalebars: (D. Upper,E-F) 100 µm, (D. Lower) 50 µm. Boxplots (A-C): lower/upper hinges indicate 1st/3rd quartiles, whisker lengths equal 1.5*IQR, red circle and bar represent mean and median. Significance evaluated by Student's t-tests (*** p<0.001, ** p<0.01, * p<0.05).
Author response image 5
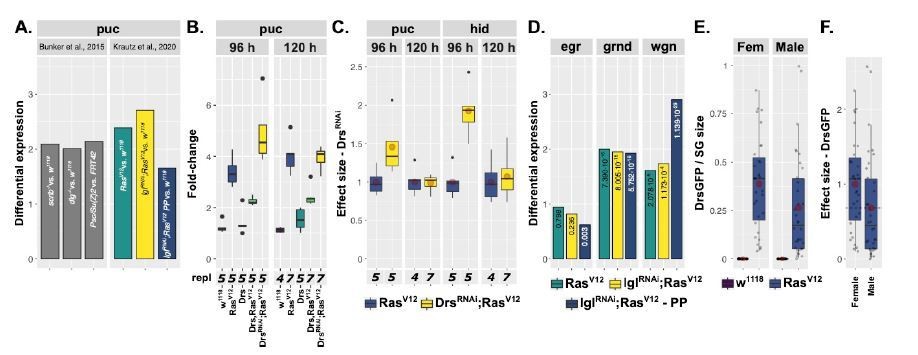
Puc expression levels in RasV12-glands comparable to other tumor models.
(A) Differential expression values for puc as quantified from the here presented RNAseq datasets and Bunker, B.D. et al., 2015. Comparison of sequenced genotypes are presented in the respective bars. (B) Fold-change expression values for puc without log-transformation in RasV12-glands with Drs-overexpression (Drs) and -knock-down (DrsRNAi). Data reproduced from Figure 5—figure supplement 2C-D. (C) Effect sizes of puc and hid upon DrsRNAi-co-expression in RasV12-glands with respective mean expression in RasV12-glands set to “1” for each gene and time point. (D) Differential expression values for egr, grnd and wgn across the three sample populations screened with RNAseq (i.e., RasV12, lglRNAi;RasV12 or lglRNAi;RasV12-PP each compared to w1118-glands). Q-values are presented in the respective bars. (E) DrsGFP-signal normalized to SG size per gland in RasV12- and w1118control glands each separated by sex into female and male specimens. (F) Effect size for DrsGFP-signal in male RasV12-glands compared to their female equivalents with mean of female RasV12-glands set to “1”. Boxplots (BC,E-F): lower/upper hinges indicate 1st/3rd quartiles, whisker lengths equal 1.5*IQR, red circle and bar represent mean and median.
Tables
Key resources table
| Reagent type (species) or resource | Designation | Source or reference | Identifiers | Additional information |
|---|---|---|---|---|
| Genetic reagent (D. melanogaster) | UAS-dlRNAi | Bloomington | 36650 | |
| Genetic reagent (D. melanogaster) | UAS-l(2)glRNAi | VDRC | 109604/KK | Rives-Quinto et al., 2017 |
| Genetic reagent (D. melanogaster) | UAS-imdRNAi | VDRC | 101834/KK | Bosch et al., 2005 |
| Genetic reagent (D. melanogaster) | UAS-FaddRNAi | VDRC | 100333/KK | |
| Genetic reagent (D. melanogaster) | UAS-keyRNAi | VDRC | 100257/KK | |
| Genetic reagent (D. melanogaster) | UAS-RelRNAi | VDRC | 108469/KK | Cammarata-Mouchtouris et al., 2020 |
| Genetic reagent (D. melanogaster) | UAS-spzRNAi | VDRC | 105017/KK | Panettieri et al., 2020 |
| Genetic reagent (D. melanogaster) | UAS-TlRNAi | VDRC | 1000788/KK | Alpar et al., 2018 |
| Genetic reagent (D. melanogaster) | UAS-cadRNAi | VDRC | 49562/KK | |
| Genetic reagent (D. melanogaster) | UAS-Stat92ERNAi | VDRC | 106980/KK | Recasens-Alvarez et al., 2017 |
| Genetic reagent (D. melanogaster) | UAS-DroncRNAi | VDRC | 100424/KK | Kale et al., 2015 |
| Genetic reagent (D. melanogaster) | UAS-DroncRNAi | VDRC | 23035/GD | Florentin and Arama, 2012 |
| Genetic reagent (D. melanogaster) | UAS-Myd88RNAi | VDRC | 25402/GD | Li et al., 2020 |
| Genetic reagent (D. melanogaster) | UAS-pllRNAi | VDRC | 2889/GD | Wu et al., 2015 |
| Genetic reagent (D. melanogaster) | UAS-DifRNAi | VDRC | 30578/GD | Wu et al., 2015 |
| Genetic reagent (D. melanogaster) | UAS-DifRNAi | VDRC | 30579/GD | Wu et al., 2015 |
| Genetic reagent (D. melanogaster) | UAS-DrsRNAi | VDRC | 2703/GD | |
| Genetic reagent (D. melanogaster) | UAS-dfrRNAi | S. Certel | ||
| Genetic reagent (D. melanogaster) | UAS-hidRNAi | VDRC | 8269/GD | Nagata et al., 2019 |
| Genetic reagent (D. melanogaster) | UAS-foxoRNAi | VDRC | 107786/KK | McLaughlin et al., 2019 |
| Genetic reagent (D. melanogaster) | UAS-grhRNAi | VDRC | 33680/GD | |
| Genetic reagent (D. melanogaster) | UAS-Mef2RNAi | Bloomington | 38247 | Zhao et al., 2020 |
| Genetic reagent (D. melanogaster) | UAS-Nrf2RNAi | VDRC | 101235/KK | Brock et al., 2017 |
| Genetic reagent (D. melanogaster) | UAS-Nrf2RNAi | VDRC | 108127/KK | Brock et al., 2017 |
| Genetic reagent (D. melanogaster) | UAS-Sox14RNAi | VDRC | 107146/KK | Wang et al., 2020 |
| Genetic reagent (D. melanogaster) | DrsGFP | W.-J. Lee | ||
| Genetic reagent (D. melanogaster) | TRE-GFP1b | D. Bohmann | ||
| Genetic reagent (D. melanogaster) | UAS-Drs | B. Lemaitre | ||
| Genetic reagent (D. melanogaster) | UAS-CecA1 | B. Lemaitre | ||
| Genetic reagent (D. melanogaster) | dl15 | Y. Engström | ||
| Genetic reagent (D. melanogaster) | Myd88KG03447 | Y. Engström | ||
| Genetic reagent (D. melanogaster) | UAS-hid | M.Suzanne | ||
| Genetic reagent (D. melanogaster) | UAS-Mmp2#4 | A. Page-McCaw | ||
| Genetic reagent (D. melanogaster) | UAS-Mmp1APM1037 | A. Page-McCaw | ||
| Genetic reagent (D. melanogaster) | UAS-Mmp1APM3099 | A. Page-McCaw | ||
| Genetic reagent (D. melanogaster) | UAS-RasV12 | Bloomington | 4847 | |
| Genetic reagent (D. melanogaster) | BxMS1096 | Bloomington | 8860 | |
| Genetic reagent (D. melanogaster) | UAS-jnkDN | Bloomington | 6409 | UAS-bskDN |
| Genetic reagent (D. melanogaster) | tubP-Gal80ts | Bloomington | 7108 | |
| Genetic reagent (D. melanogaster) | Mmp2k00604 | Bloomington | 10358 | |
| Genetic reagent (D. melanogaster) | 10xStat92E-GFP | Bloomington | 26197 | |
| Genetic reagent (D. melanogaster) | UAS-p35.H | Bloomington | 5072 | |
| Genetic reagent (D. melanogaster) | UAS-mCD8::mRFP | Bloomington | 27400 | |
| Genetic reagent (D. melanogaster) | vkgG00454 | Flytrap | Ref. 100; CollagenIV | |
| Antibody | Anti-Hemese (mouse monoclonal) | István Andó | H2 | IF(1:5) |
| Antibody | Anti-pJNK (mouse monoclonal) | Cell Signaling Technology | Cat#:9255 | IF (1:250) |
| Antibody | Anti-cleaved caspase 3 (rabbit polyclonal) | Cell Signaling Technology | Cat#:9661 | IF(1:200) |
| Antibody | Anti-dorsal (mouse monoclonal) | DSHB | 7A4-39 | IF(1:50) |
| Antibody | Anti-mouse-IgG-Alexa546 (goat polyclonal) | ThemoFisher Scientific | Cat#: A-11030 | IF(1:500) |
| Antibody | Anti-rabbit-IgG-Alexa568 (goat polyclonal) | ThemoFisher Scientific | Cat#: A-11011 | IF(1:500) |
| Recombinant DNA reagent | Drs (cDNA clone) | DGRC | LP03851 | |
| Recombinant DNA reagent | CecA1 (cDNA clone) | DGRC | IP21250 | |
| Sequence-based reagent | oligo(dT)16-primer | ThermoFisher Scientific | Cat#:8080128 | |
| Sequence-based reagent | Drs_F | This paper | qPCR primers | gaggagggacgctccagt |
| Sequence-based reagent | Drs_R | This paper | qPCR primers | ttagcatccttcgcaccag |
| Sequence-based reagent | AttD_F | This paper | qPCR primers | gtttatggagcggtcaacg |
| Sequence-based reagent | AttD_R | This paper | qPCR primers | tctggaagagattggcttgg |
| Sequence-based reagent | TIMP_F | This paper | qPCR primers | aacagagcgtcatggcttca |
| Sequence-based reagent | TIMP_R | This paper | qPCR primers | tcacaccaaaacaggtggca |
| Sequence-based reagent | Upd1_F | This paper | qPCR primers | cgggtgatcgcttcaatc |
| Sequence-based reagent | Upd1_R | This paper | qPCR primers | ctgcggtactcccgaaag |
| Sequence-based reagent | Upd2_F | This paper | qPCR primers | aagttcctgccgaacatgac |
| Sequence-based reagent | Upd2_R | This paper | qPCR primers | atccttgcggaacttgtactg |
| Sequence-based reagent | Upd3_F | This paper | qPCR primers | actgggagaacacctgcaat |
| Sequence-based reagent | Upd3_R | This paper | qPCR primers | gcccgtttggttctgtagat |
| Sequence-based reagent | Hid_F | This paper | qPCR primers | tctacgagtgggtcaggatgt |
| Sequence-based reagent | Hid_R | This paper | qPCR primers | gcggatactggaagatttgc |
| Sequence-based reagent | Rpr_F | This paper | qPCR primers | gatcaggcgactctgttgc |
| Sequence-based reagent | Rpr_R | This paper | qPCR primers | actgtgactcccgcaagc |
| Sequence-based reagent | Grim_F | This paper | qPCR primers | atcgatgaccatgtcggagt |
| Sequence-based reagent | Grim_R | This paper | qPCR primers | cgcagagcgtagcagaagat |
| Sequence-based reagent | MMP1_F | This paper | qPCR primers | gtttccaccaccacacagg |
| Sequence-based reagent | MMP1_R | This paper | qPCR primers | gcagaggcgggtagatagc |
| Sequence-based reagent | MMP2_F | This paper | qPCR primers | tttcgatgcggacgagac |
| Sequence-based reagent | MMP2_R | This paper | qPCR primers | gccacgttcagaaaattggt |
| Sequence-based reagent | PUC_F | This paper | qPCR primers | cgtcatcatcaacggcaat |
| Sequence-based reagent | PUC_R | This paper | qPCR primers | aggcggggtgtgtttctat |
| Sequence-based reagent | RPL32_F | This paper | qPCR primers | cggatcgatatgcta |
| Sequence-based reagent | RPL32_R | This paper | qPCR primers | cgacgcactctgttg |
| Peptide, recombinant protein | RNase-free DNase I | ThermoFisher Scientific | Cat#:EN0521 | |
| Peptide, recombinant protein | SuperscriptIII | ThermoFisher Scientific | Cat#:18080-093 | |
| Peptide, recombinant protein | Phalloidin-546 | Molecular probes | Cat#:A22283 | |
| Commercial assay or kit | KAPA SYBR FAST qPCR Master Mix (2x) kit | Kapa Biosystems; Sigma-Aldrich | KR0389, v9.13 | |
| Commercial assay or kit | RNAqueous-Micro Kit | ThermoFisher Scientific | Cat#:AM1931 | |
| Commercial assay or kit | RNAqueous Kit | ThermoFisher Scientific | Cat#:AM1912 | |
| Commercial assay or kit | Experion RNA StdSens Reagents and Supplies | Bio-Rad | Cat#:700-7154 | |
| Commercial assay or kit | Experion RNA StdSens Chips | Bio-Rad | Cat#:700-7153 | |
| Chemical compound, drug | Vancomycin | Sigma-Aldrich | Cat#:V2002 | |
| Chemical compound, drug | Metronidazole | Sigma-Aldrich | Cat#:M3761 | |
| Chemical compound, drug | Neomycin | Sigma-Aldrich | Cat#:N1876 | |
| Chemical compound, drug | Carbenicillin | Sigma-Aldrich | Cat#:C1389 | |
| Chemical compound, drug | Sodium Hypochlorite solution | Fisher Scientific | Cat#:10401841 | |
| Chemical compound, drug | DAPI | Sigma-Aldrich | D9542 | |
| Software, algorithm | ImageJ | Fiji contributors | v1.52n | https://imagej.nih.gov/ij/ |
| Software, algorithm | Zen software | Zeiss | Blue edition | |
| Software, algorithm | kallisto | Bray et al., 2016 | v0.44.0 | https://pachterlab.github.io/kallisto/ |
| Software, algorithm | sleuth | Pimentel et al., 2017 | v0.30.0 | https://pachterlab.github.io/sleuth/ |
| Software, algorithm | GOstats | Falcon and Gentleman, 2007 | v2.48.0 | https://github.com/Bioconductor/GOstats/ |
| Software, algorithm | AnnotationDbi | Pagès et al., 2020 | v1.44.0 | https://github.com/Bioconductor/AnnotationDbi/ |
| Software, algorithm | org.Dm.eg.db | Carlson, 2019 | v3.7.0 | http://bioconductor.org/packages/org.Dm.eg.db/ |
| Software, algorithm | RNAseq_sg_ analysis.Rmd | This paper | https://github.com/robertkrautz/sg_analysis/; Krautz, 2021; copy archived at swh:1:rev:82c91040d3434b215c04cfce11cf73f70300e099 | |
| Software, algorithm | RNAseq_motif_ enrichment.Rmd | This paper | https://github.com/robertkrautz/sg_analysis/ | |
| Software, algorithm | scanner.ijm | This paper | https://github.com/robertkrautz/sg_analysis/ | |
| Software, algorithm | RcisTarget | Aibar et al., 2017 | v1.6.0 | https://www.bioconductor.org/packages/release/bioc/html/RcisTarget.html |
| Software, algorithm | biomaRt | Durinck et al., 2009 | v2.42.1 | https://bioconductor.org/packages/release/bioc/html/biomaRt.html |
| Software, algorithm | Biostrings | Pàges et al., 2020 | v2.54.0 | https://bioconductor.org/packages/release/bioc/html/Biostrings.html |
| Software, algorithm | PWMEnrich | Stojnic and Diez, 2020 | v4.22.0 | https://www.bioconductor.org/packages/release/bioc/html/PWMEnrich.html |
Additional files
-
Supplementary file 1
Complete list of all crosses associated with the experimental results in the indicated figures.
- https://cdn.elifesciences.org/articles/64919/elife-64919-supp1-v2.docx
-
Supplementary file 2
Complete list of all sequences corresponding to forward and reverse primers used for qPCR.
- https://cdn.elifesciences.org/articles/64919/elife-64919-supp2-v2.docx
-
Supplementary file 3
Overview of all RNAi-lines used in the DrsGFP-reporter assay, including references indicating prior use and evidence for active inhibition of the outlined target of the respective RNAi-line.
- https://cdn.elifesciences.org/articles/64919/elife-64919-supp3-v2.docx
-
Transparent reporting form
- https://cdn.elifesciences.org/articles/64919/elife-64919-transrepform-v2.docx
Download links
A two-part list of links to download the article, or parts of the article, in various formats.
Downloads (link to download the article as PDF)
Open citations (links to open the citations from this article in various online reference manager services)
Cite this article (links to download the citations from this article in formats compatible with various reference manager tools)
Tissue-autonomous immune response regulates stress signaling during hypertrophy
eLife 9:e64919.
https://doi.org/10.7554/eLife.64919


