Global, cell non-autonomous gene regulation drives individual lifespan among isogenic C. elegans
- Department of Biomedical Engineering, Washington University in St. Louis, United States
- Department of Developmental Biology and Department of Genetics, Washington University in St. Louis, United States
- Program in Developmental, Regenerative, and Stem Cell Biology, Washington University in St. Louis, United States
Figures
Figure 1 with 3 supplements
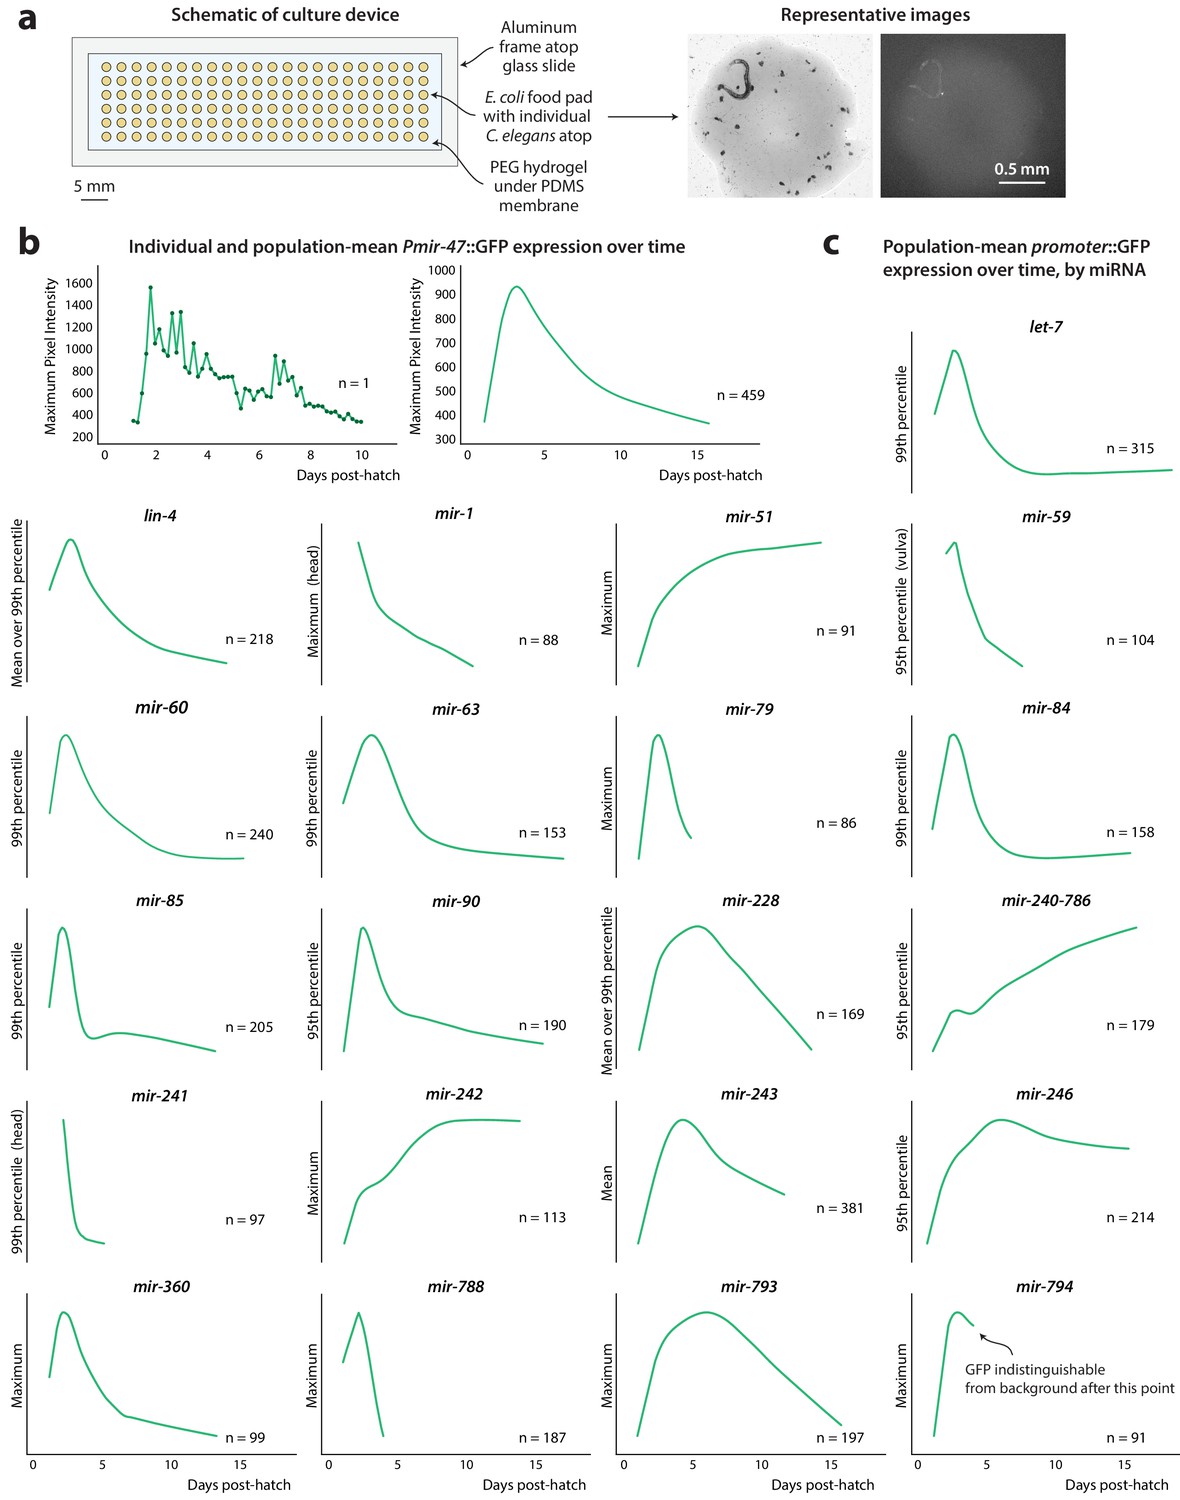
PmiRNA::GFP expression over time.
(a) Schematic of high-density single animal culture device and representative bright-field and fluorescent images acquired from a single Pmir-47::GFP; spe-9(hc88) individual. (b) Timecourse of Pmir-47::GFP expression for a single animal from hatch until death (left). Expression is measured as the maximum pixel intensity within the image region comprising that individual, from images acquired every 4 hr. LOWESS regression showing the average population timecourse of Pmir-47::GFP expression, collated from five biological replicates comprising more than 400 individuals (right). (c) Population timecourse of expression for all PmiRNA::GFP reporters. (Fluorescent values are in arbitrary units; in all cases the bottom of the y-axis is approximately the noise floor of the camera sensor).
Figure 1—figure supplement 1
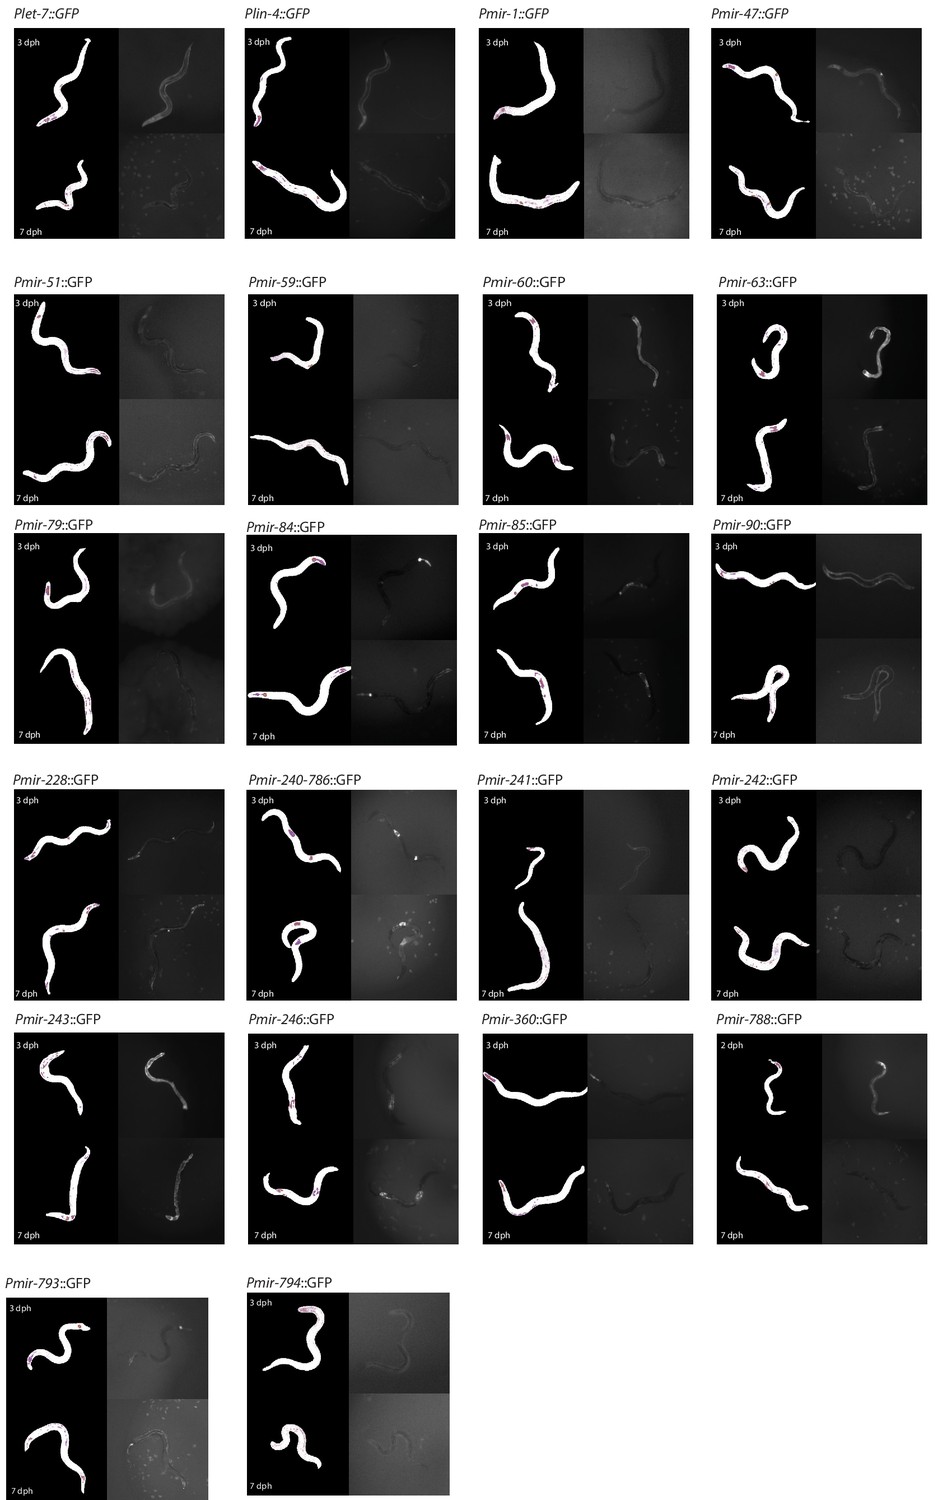
Representative fluorescence images taken of individuals at 3 dph (top right panels) and 7 dph (bottom right panels) from each PmiRNA::GFP reporter strain.
The masks produced from automatic image segmentation are at left and color-coded to show worm pixels captured by a 95th percentile (magenta), 99th percentile (orange), and 99.9th percentile (blue) intensity threshold.
Figure 1—figure supplement 2
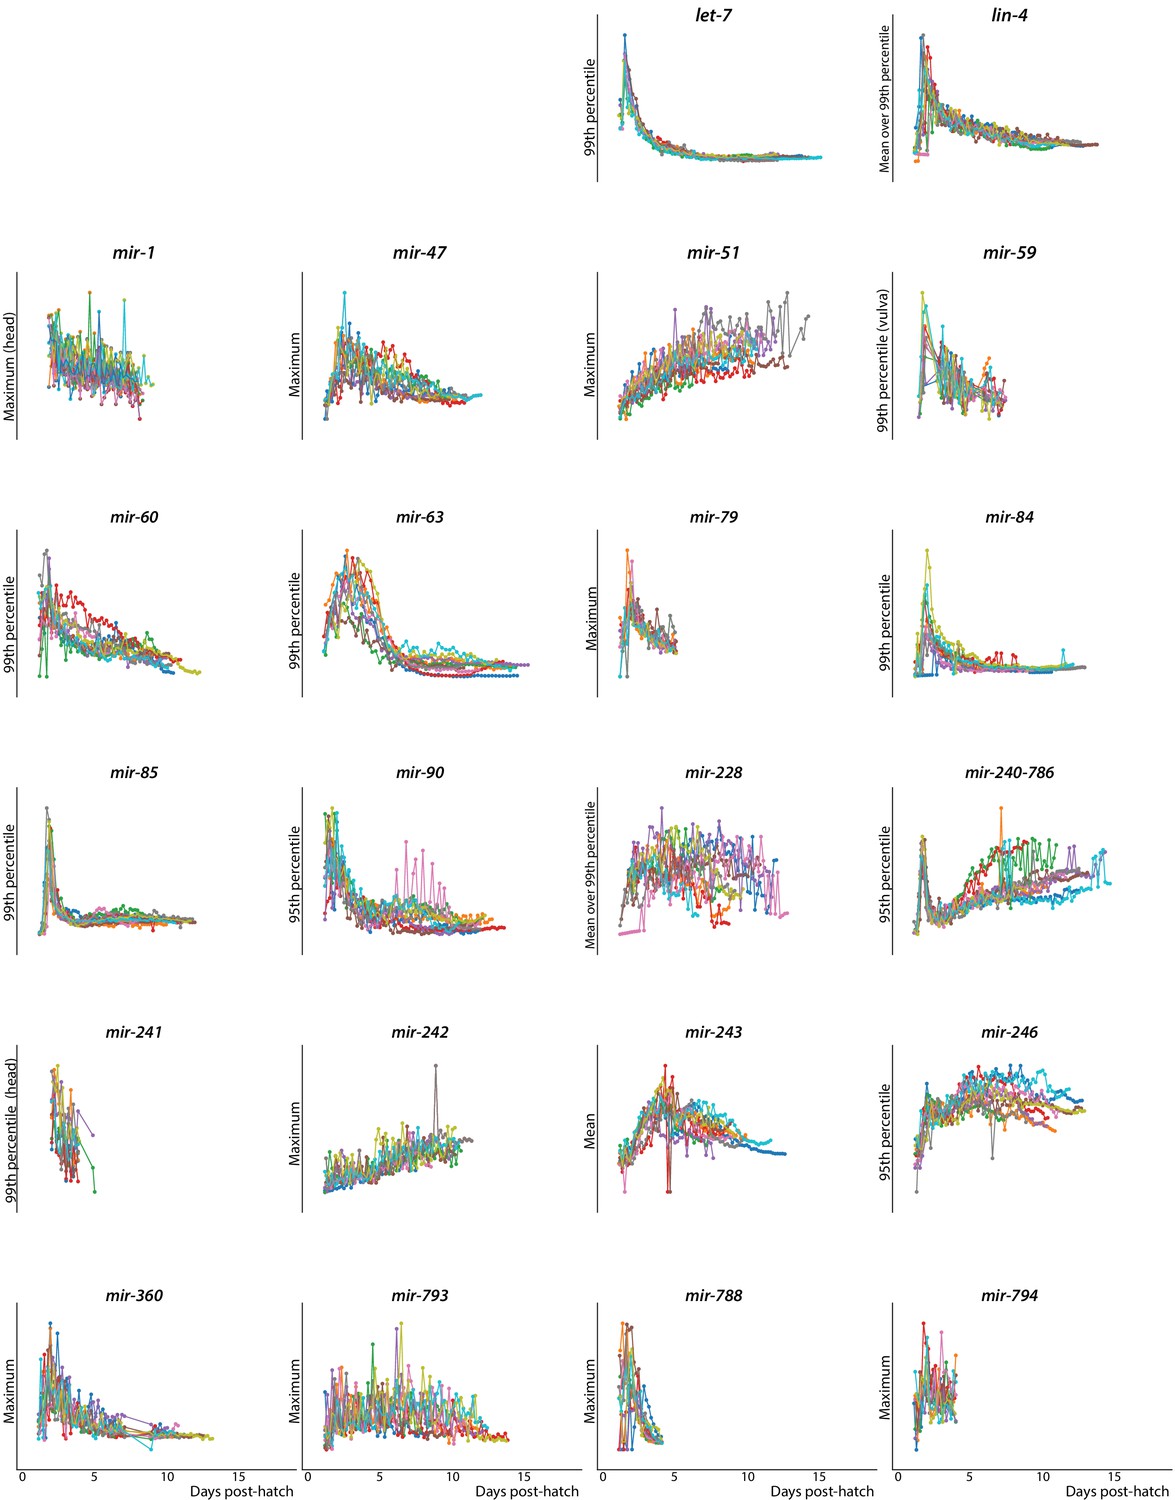
Timecourse of expression for 10 randomly selected individuals from all PmiRNA::GFP reporters.
Figure 1—figure supplement 3
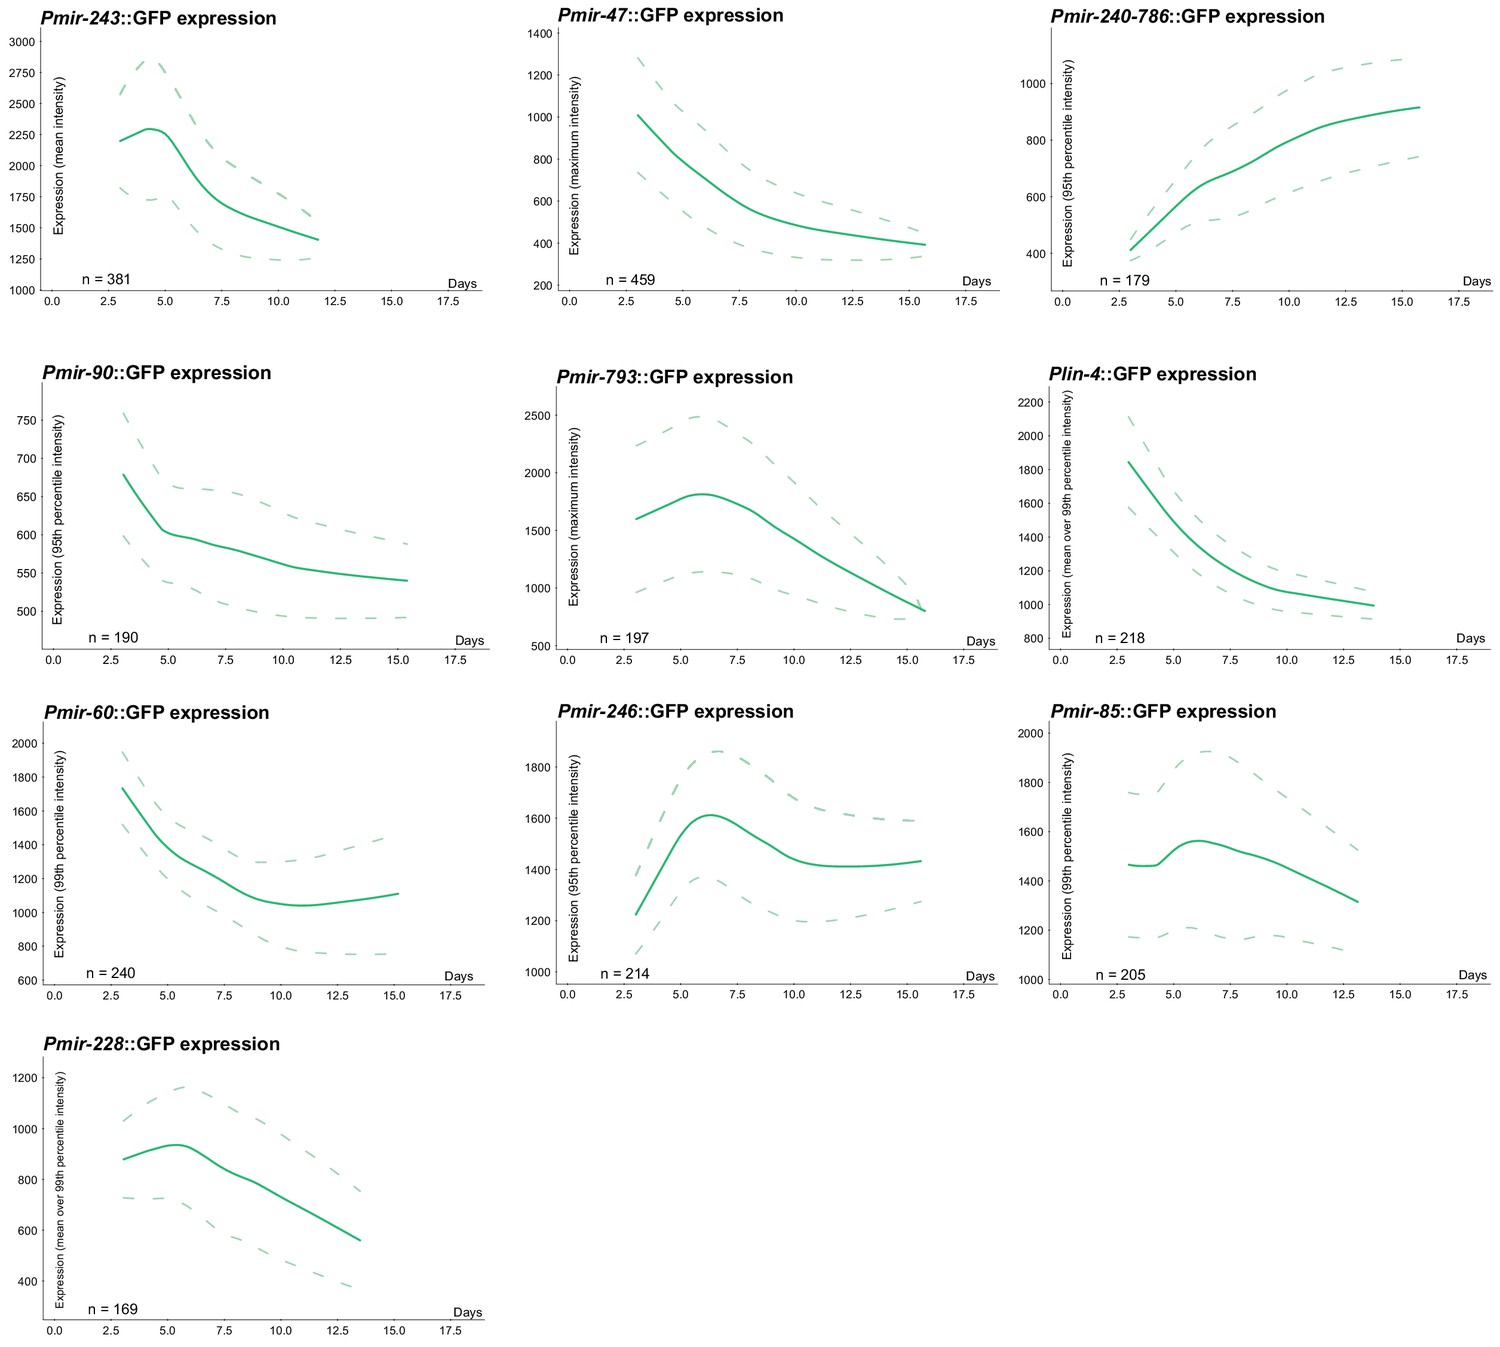
LOWESS trends for expression of predictive PmiRNA::GFP reporters over time (solid line) and standard deviation (dashed line).
Figure 2 with 1 supplement
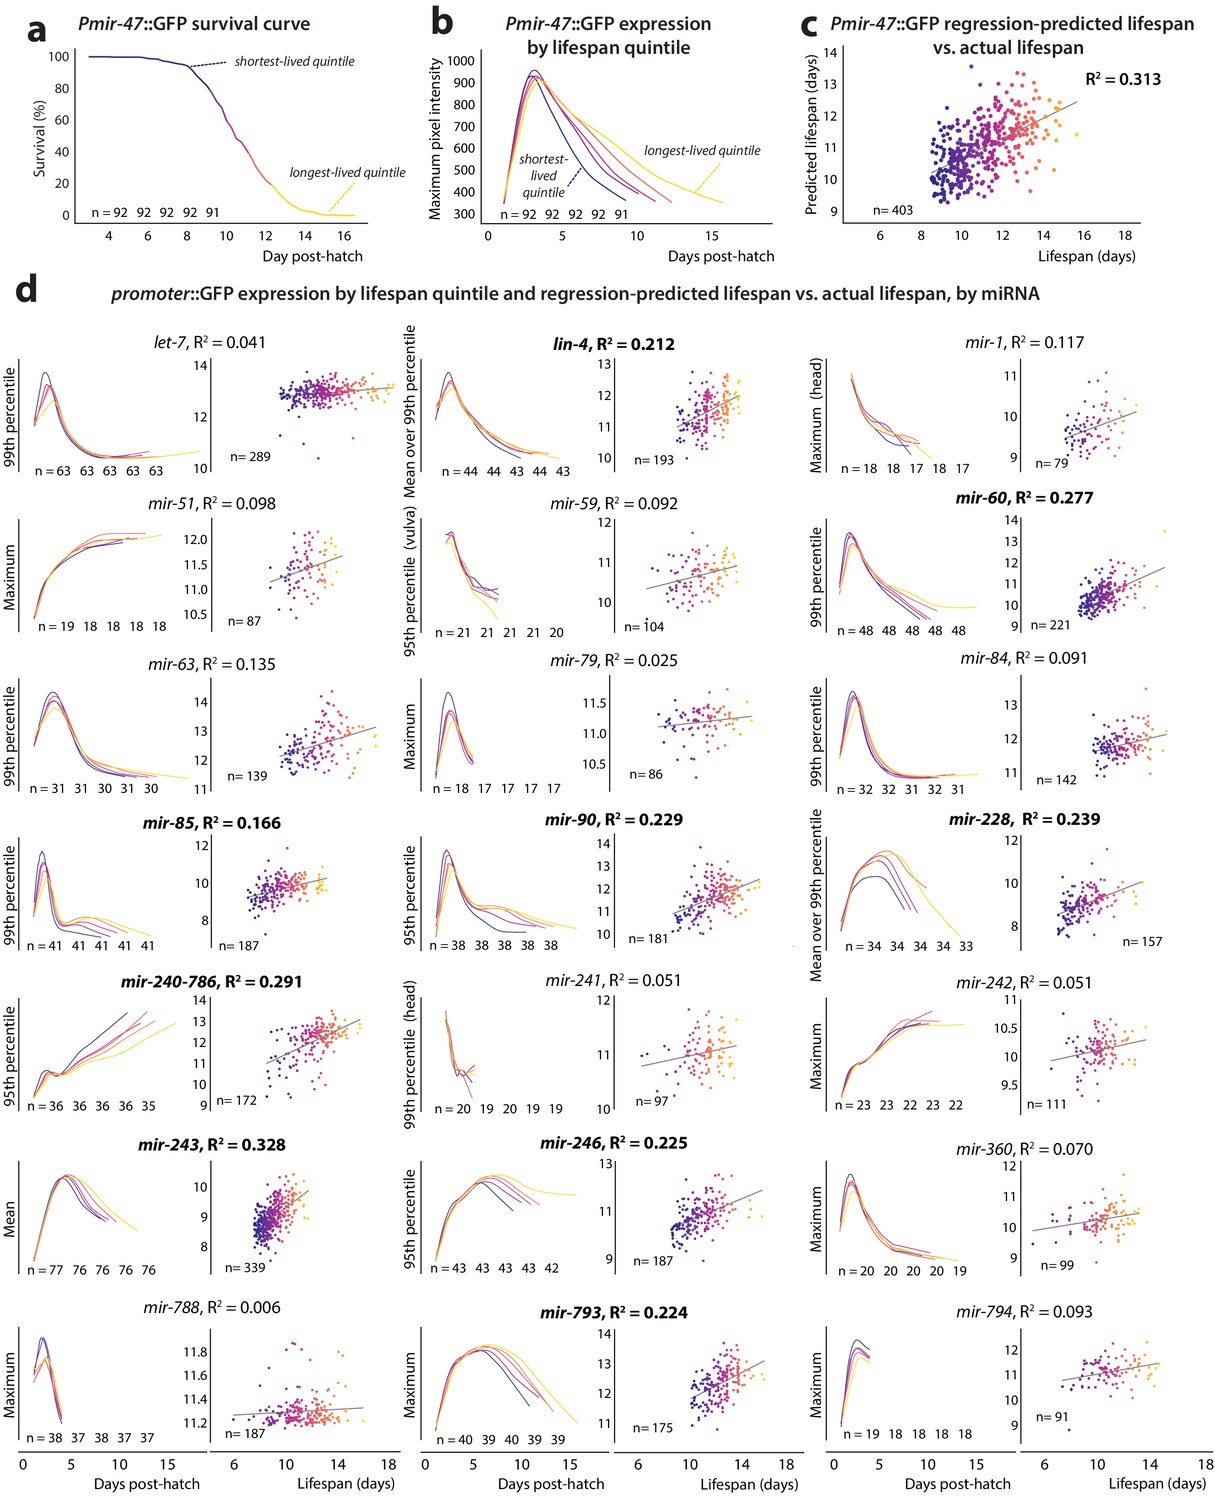
PmiRNA::GFP expression vs.future lifespan.
(a) Survival curve for Pmir-47::GFP; spe-9(hc88) individuals pooled from five biological replicates. Animals are binned into color-coded quintiles based on eventual lifespan. The number of individuals in each quintile is indicated. (b) LOWESS regression of each quintile’s average Pmir-47::GFP expression (as measured by maximum intensity per individual at each timepoint) is plotted over time for the quintiles in panel a. (c) Joint regression of both the mean level of each individual’s Pmir-47::GFP expression between 5 and 8.5 days post-hatch, and the slope of that expression over that time, against future lifespan yields an R2 of 0.313. Each dot represents an individual animal and is color-coded based on lifespan. (d) Cohort-level expression timecourse and joint regression of slope and mean expression against future lifespan for all PmiRNA::GFP reporters. This mean and slope were measured across the optimal time window for each reporter’s correlation with future lifespan (specified in Table 2). Correlation coefficients > 0.15 are indicated by bolded text.
Figure 2—figure supplement 1
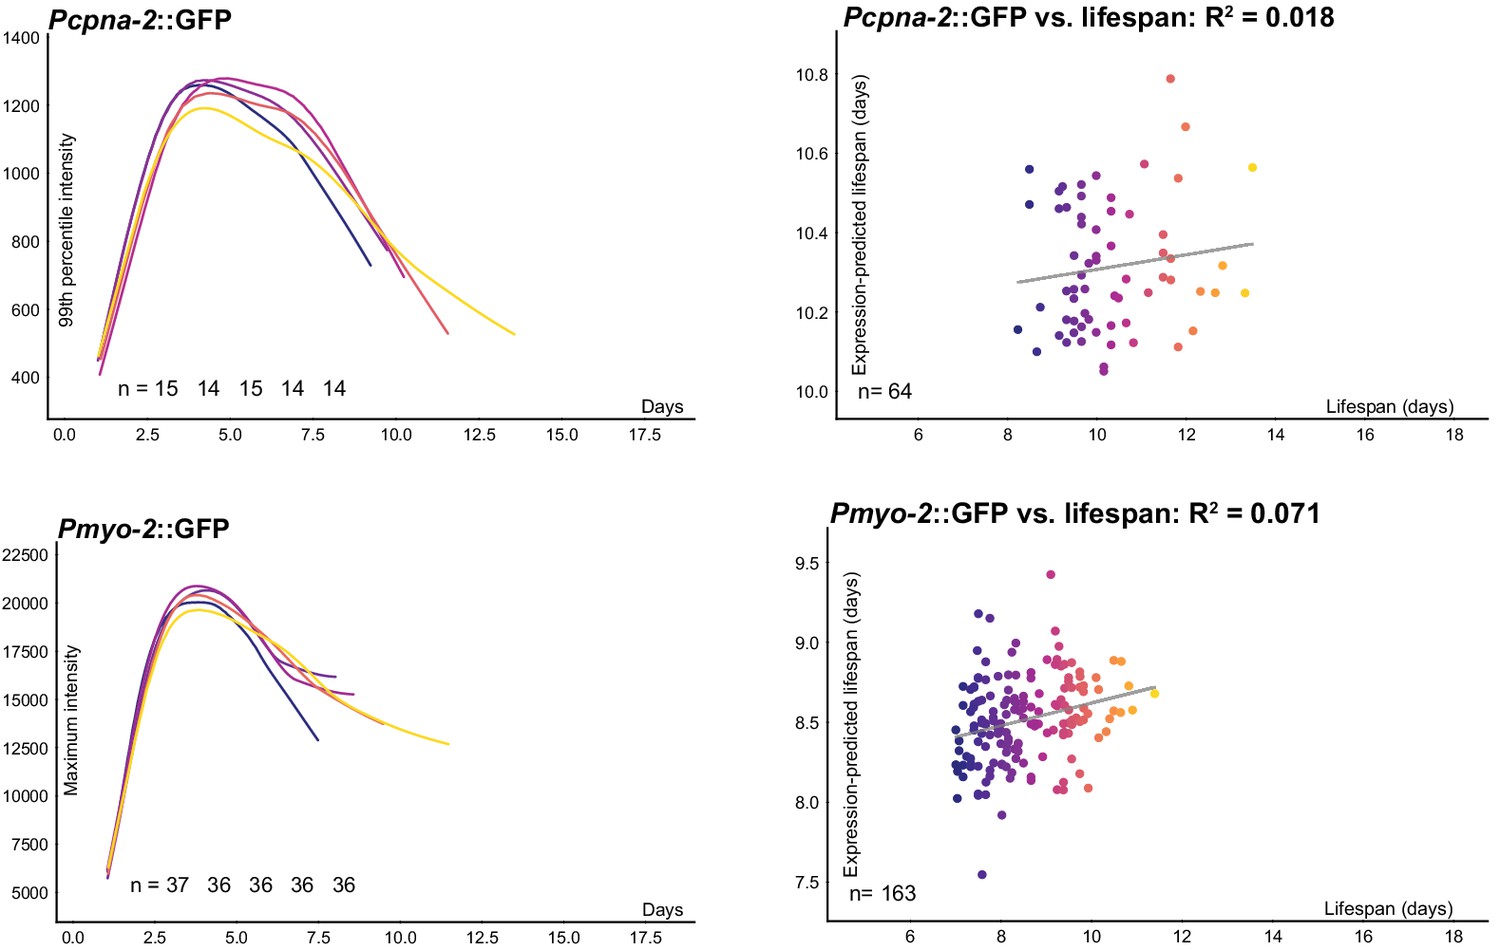
Expression of non-miRNA reporters Pcpna-2::GFP and Pmyo-2::GFP is plotted over time for each lifespan cohort.
Regression on both the slope and average of individual Pcpna-2::GFP expression 72–196 hr post-hatch and future lifespan yields an R2 of 0.018, while regression on Pmyo-2::GFP expression 72–168 hr post-hatch and future lifespan yields an R2 of 0.071.
Figure 3 with 2 supplements
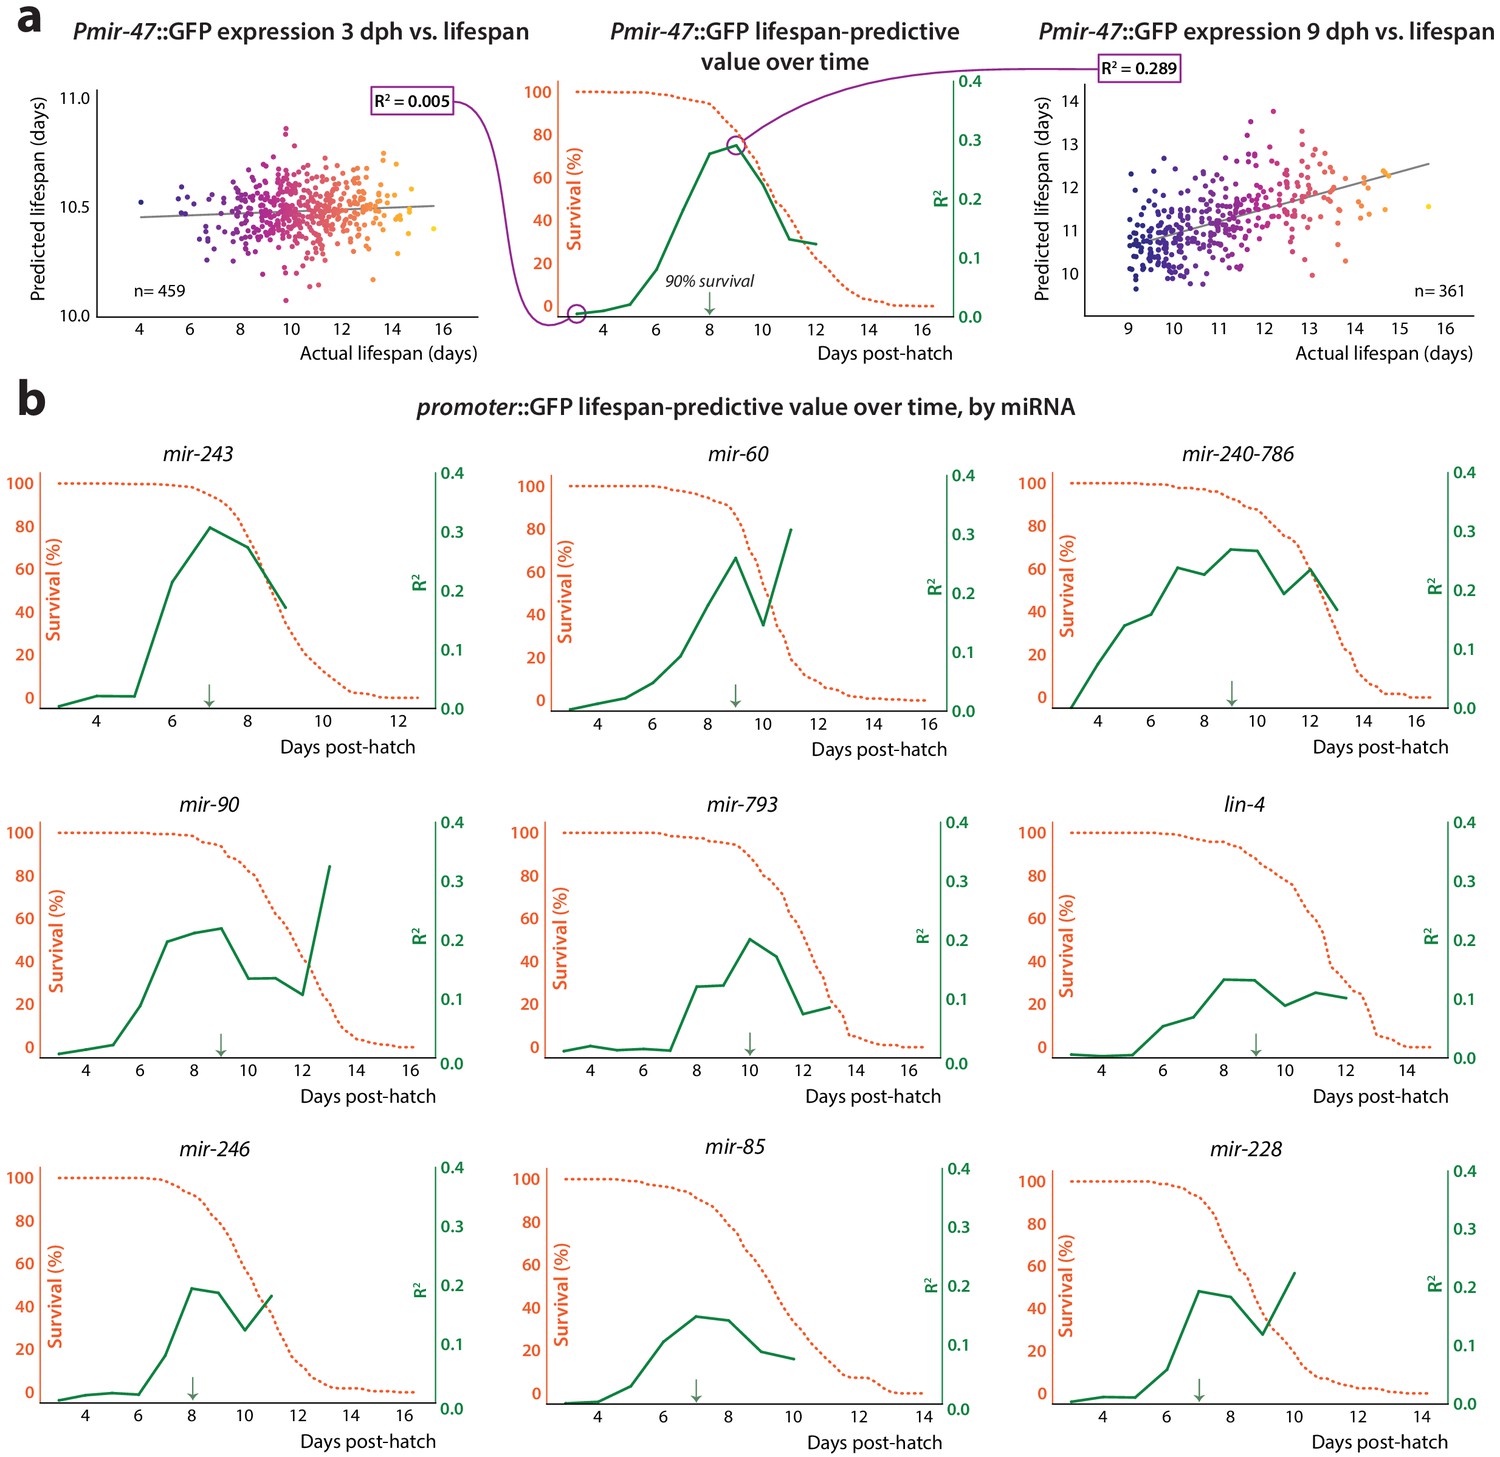
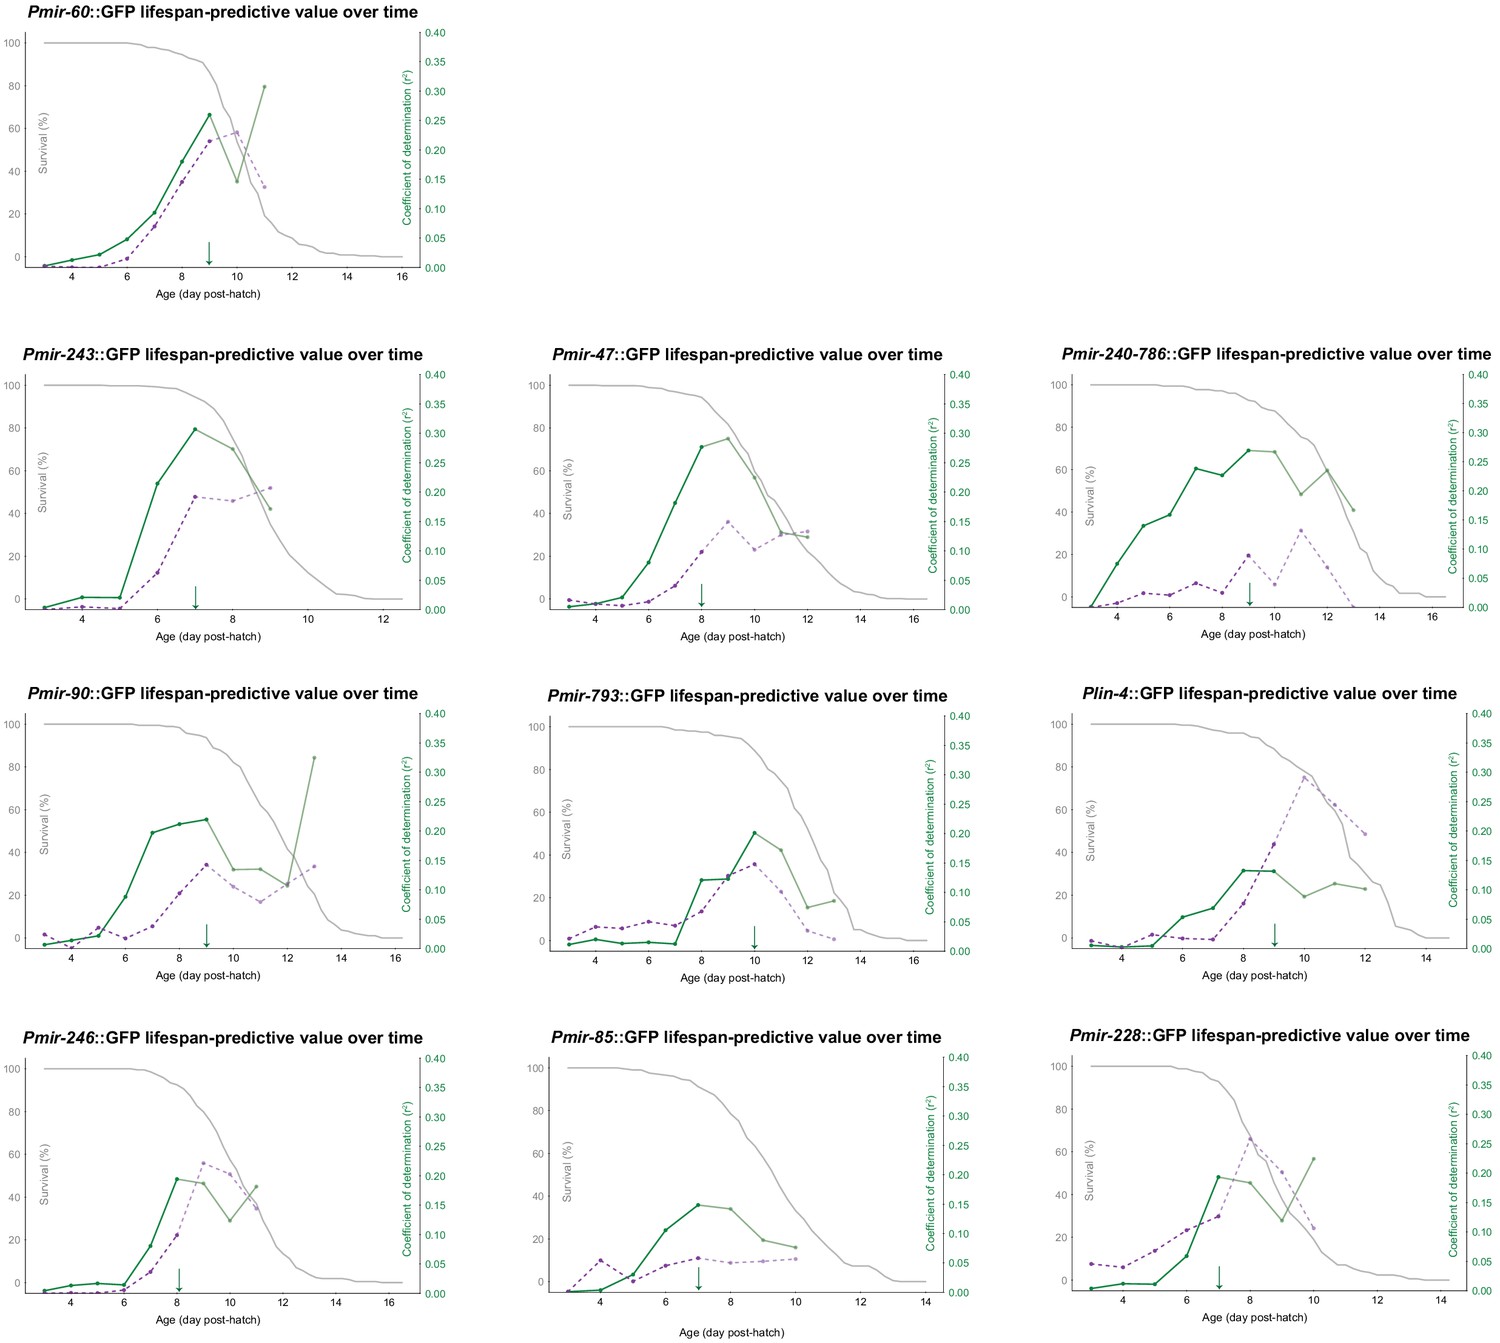
Lifespan-predictive ability vs.time.
(a) Construction of correlation plot for Pmir-47::GFP. Mean and slope of expression values for each individual during a sliding 24 hr time window, starting at 3 dph, were regressed against future lifespan. The regressions for 48–72 hr (window centered at 3 dph, left) and 192–216 hr (9 dph, right) are shown. At center, the correlation coefficient from each regression is plotted against the age at the middle of the regression window (solid line). The survival curve for the population is overlaid (dashed line). The 90% survival timepoint is indicated by the green arrow. (b) Correlation plots for remainder of predictive PmiRNA::GFP reporters.
Figure 3—figure supplement 1
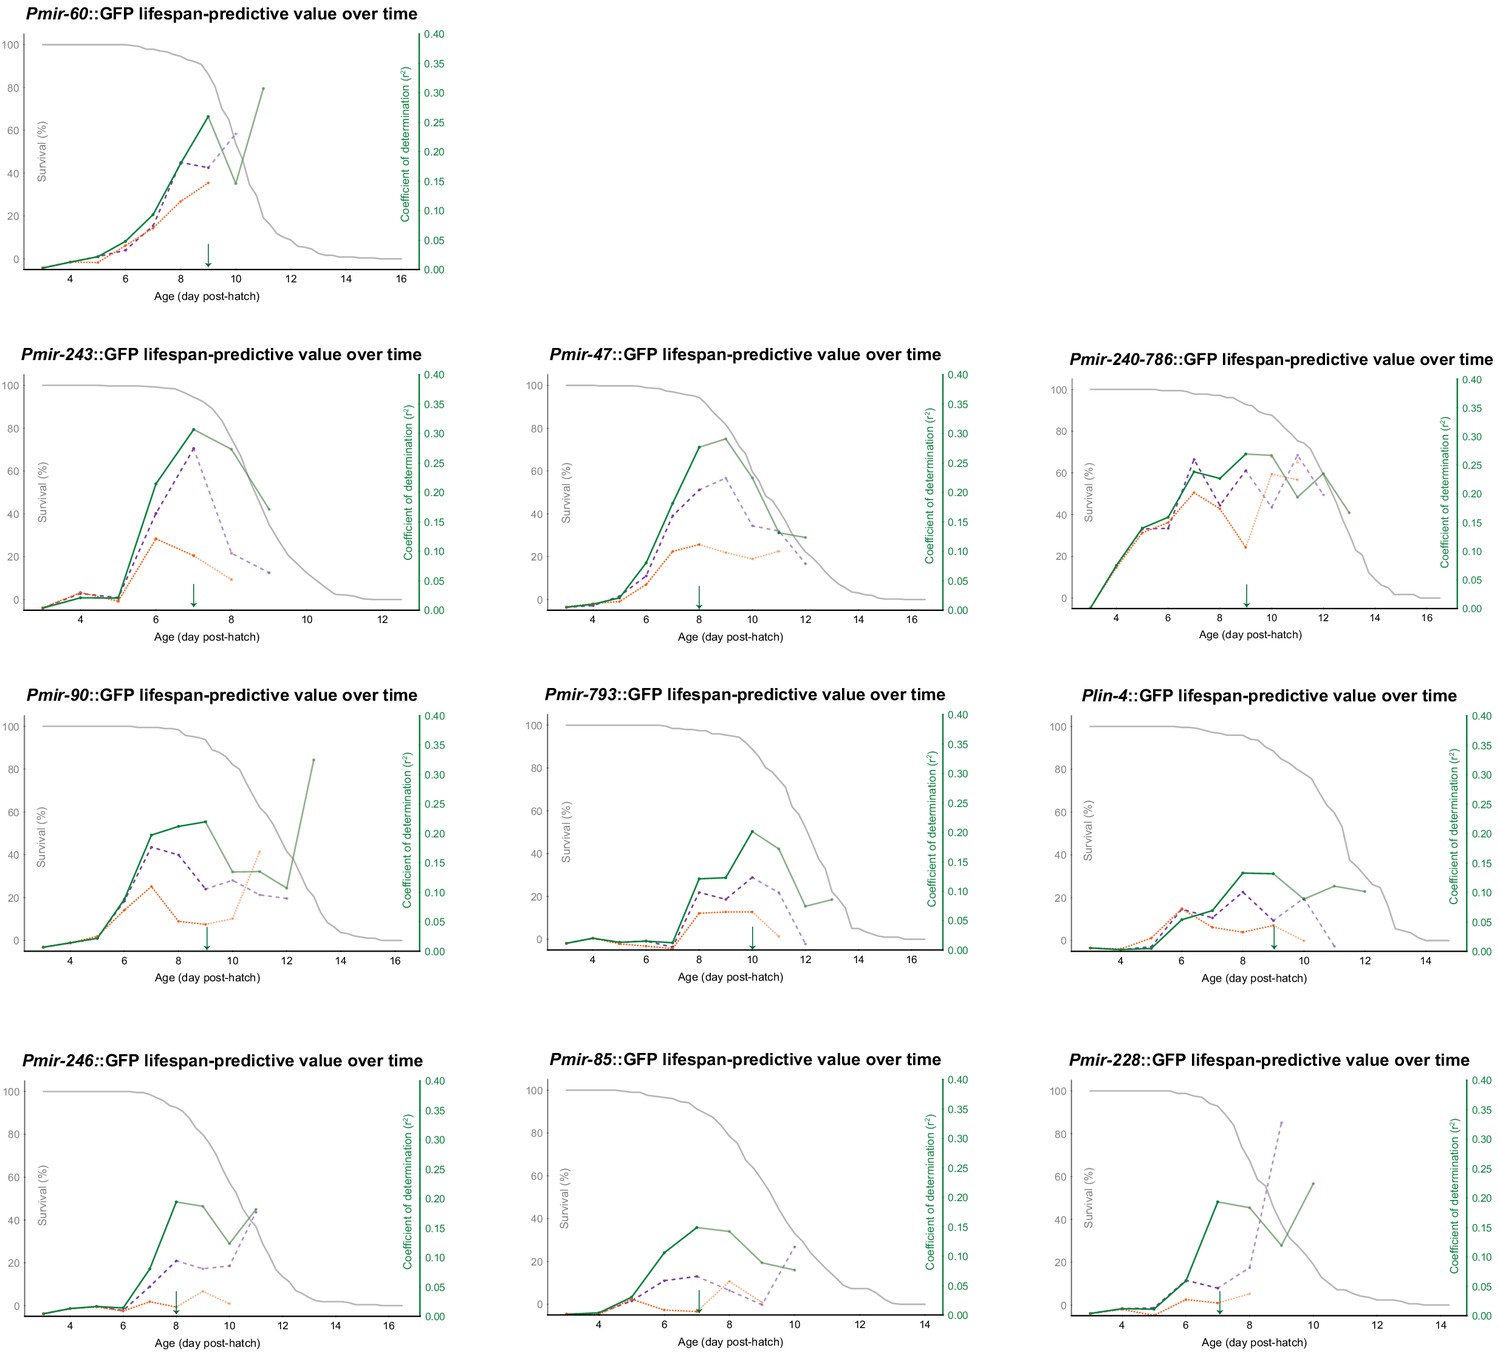
Mean and slope of PmiRNA::GFP expression in a sliding 24 hr window was regressed against future lifespan, only for individuals surviving the subsequent 24 hr (green), 48 hr (purple), and 72 hr (orange).
The resulting correlation coefficients were plotted against the middle of the window in which expression was measured and overlaid with the survival curve for the population (gray). The 90% survival timepoints are shown with green arrows.
Figure 3—figure supplement 2
Mean and slope of PmiRNA::GFP expression (green) and the 95th percentile of autofluorescence intensity (purple) for each individual during a 24 hr time window were regressed on future lifespan.
The resulting correlation coefficient was then plotted against the corresponding timepoint and overlayed with the survival curve for the population (gray). The 90% survival timepoints are indicated by green arrows.
Figure 4
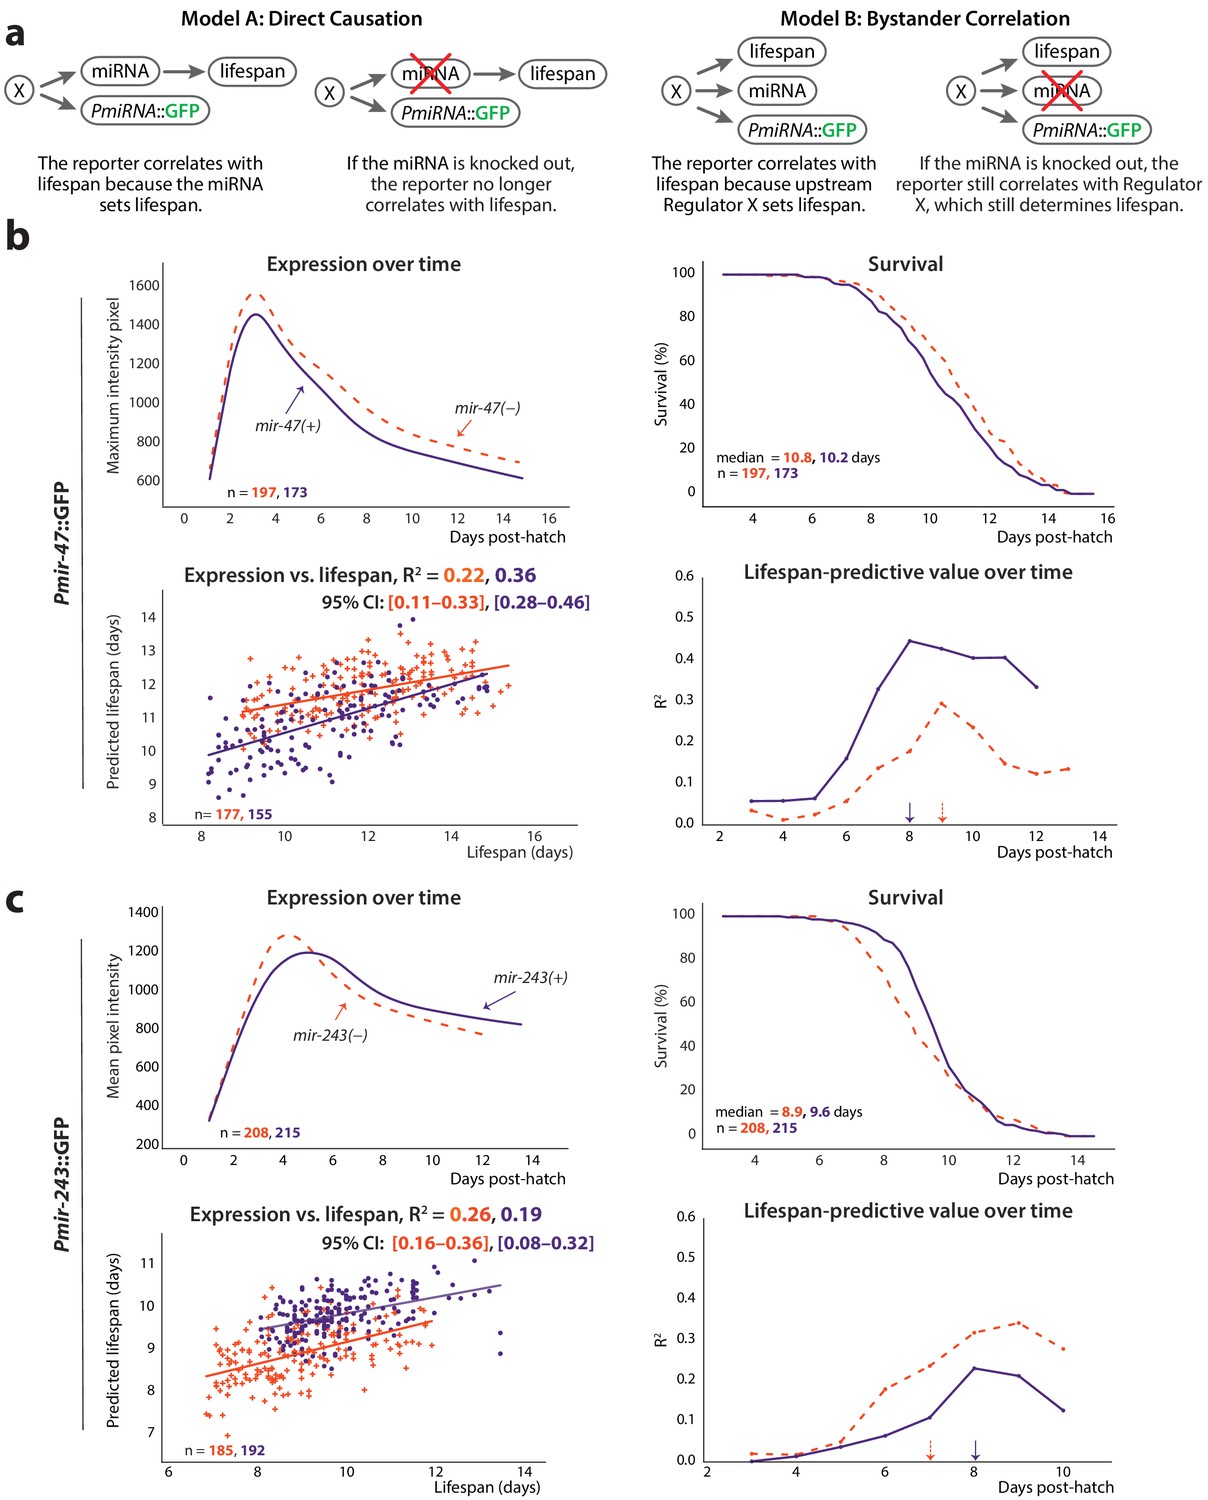
Non-involvement of endogenous miRNAs.
(a) Two models of the possible relationship between the endogenous miRNA and lifespan: ‘direct causation’ in which the miRNA is directly involved in determining individual lifespans, and ‘bystander correlation’ in which it is not. The predicted effect of knocking out the endogenous miRNA on the correlation between PmiRNA::GFP levels and future lifespan is shown for each scenario. (b) Comparison of Pmir-47::GFP expression over time (top left), survival (top right), regression on slope and mean of expression against lifespan (bottom right), and lifespan-predictive value (bottom left) between mir-47(+) (solid lines) and mir-47(gk167) (dashed lines) backgrounds. The time windows for regression were those that maximized correlation with future lifespan: 72–194 and 72–215 hr post-hatch for mir-47(+) and mir-47(gk167), respectively. (c) Comparison of Pmir-243::GFP expression over time (top left), survival (top right), regression on slope and mean of expression against lifespan (bottom left), and lifespan-predictive value (bottom right) between mir-243(+) (solid lines) and mir-243(n4759) (dashed lines) backgrounds. The time windows for regression were 72–192 and 72–164 hr post-hatch for mir-243(+) and mir-243(n4759), respectively. The 90% survival ages for each genotype are indicated by arrows. The 95% CI for each regression correlation coefficient is shown in brackets. In scatter plots, the (o) and (+) symbols correspond to the regressions in wild-type or miRNA-mutant genotypes, respectively. All figures pool data from two biological replicates.
Figure 5

Non-involvement of IIS.
(a) For PmiRNA::GFPs to correlate with lifespan, each must report on some lifespan-determining process. The reported-on process may be IIS-dependent (left) or IIS-independent (right); these scenarios can be distinguished by the effects of knocking out the IIS effector daf-16 on the correlation between PmiRNA::GFP and future lifespan. (b) Comparison of Pmir-47::GFP expression over time (top left), survival (top right), regression on slope and mean of expression against lifespan (bottom right), and lifespan-predictive value (bottom left) between daf-16(+) (solid lines) and daf-16(mu86) (dashed lines) backgrounds. The optimal time windows for regression were 72–190 and 72–164 hr post-hatch for daf-16 wild-type and daf-16(mu86), respectively. (c) Comparison of Pmir-243::GFP expression over time (top left), survival (top right), regression on slope and mean of expression against lifespan (bottom left), and lifespan-predictive value (bottom right) between daf-16(+) (solid lines) and daf-16(mu86) (dashed lines) backgrounds. The optimal time windows for regression were 72–158 and 72–144 hr post-hatch for daf-16(+) and daf-16(mu86), respectively. The 90% survival ages for each genotype are indicated by arrows. The 95% CI for each regression correlation coefficient is shown in brackets. In scatter plots, the (o) and (+) symbols correspond to the regressions in daf-16(+) and daf-16(mu86), respectively. All figures pool data from two biological replicates.
Figure 6 with 1 supplement
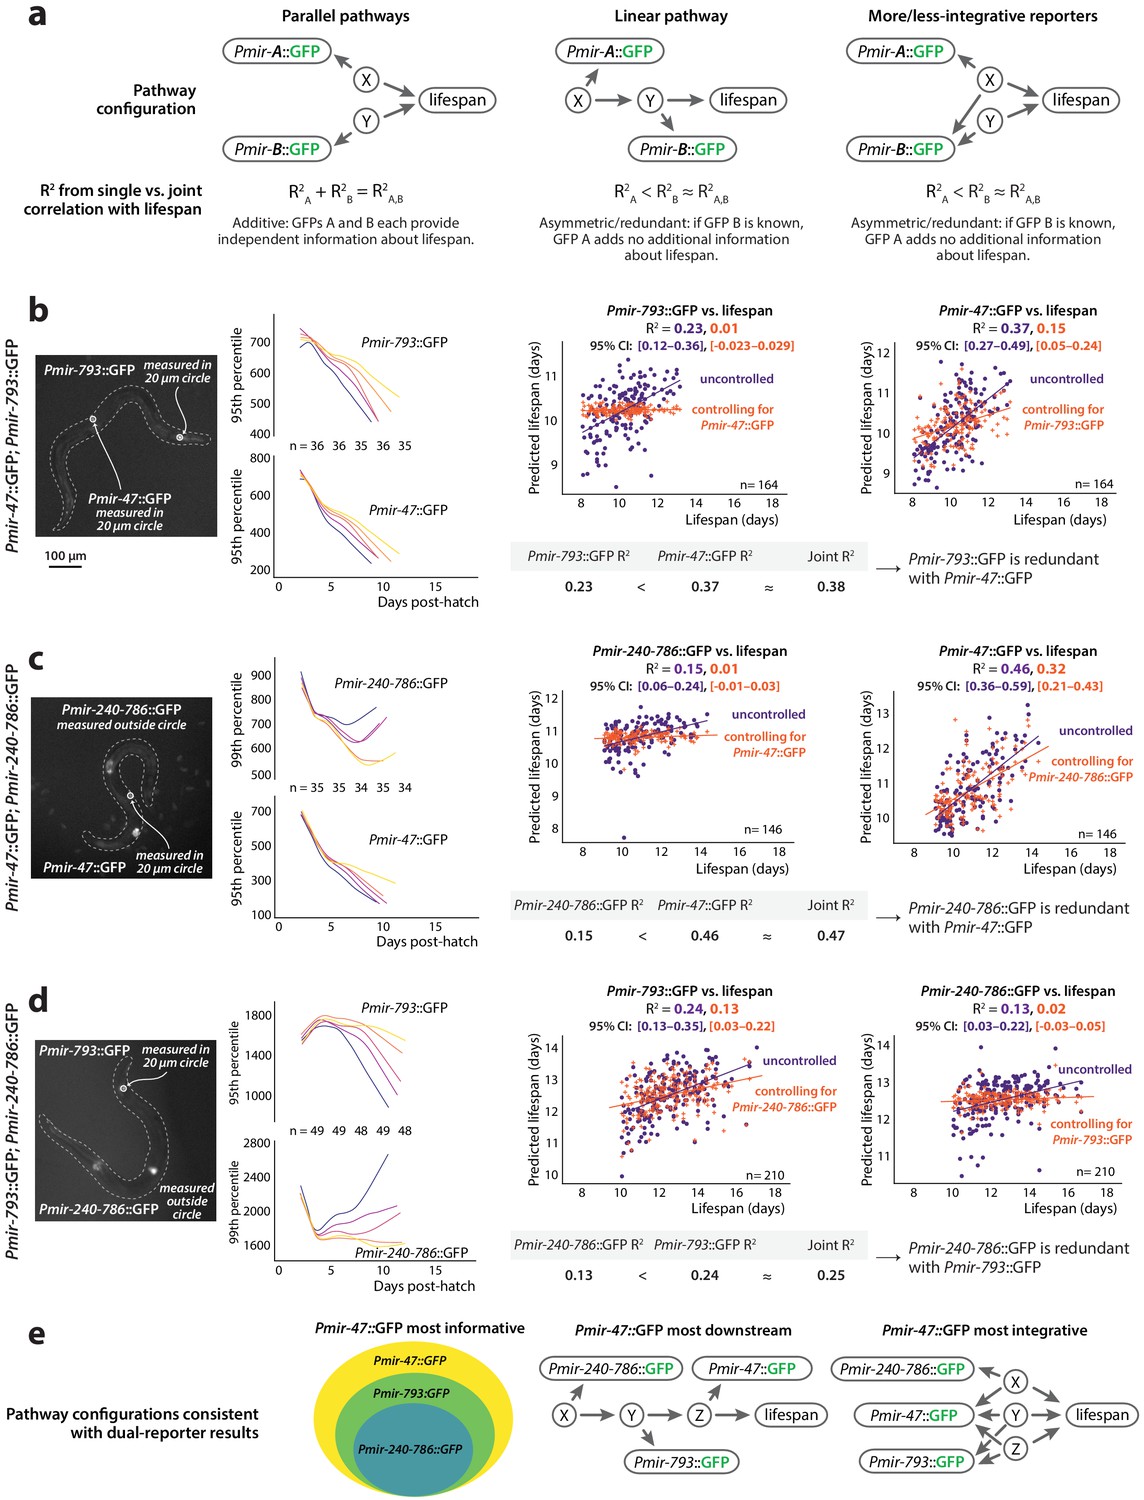
Redundancy of reporters.
(a) Three models depicting possible additive or redundant relationships between lifespan-determining processes X and Y and two PmiRNA::GFP reporters A and B, with respect to their correlation vs. future lifespan. (b) Pmir-793::GFP and Pmir-47::GFP expression for different lifespan cohorts over time (left) and regression on slope and mean of each reporter from 3 to 8 dph controlled for expression of the other reporter (right). (c) Pmir-47::GFP and Pmir-240–786::GFP expression for different lifespan cohorts over time (left) and regression on slope and mean of each reporter from 3 to 9 dph controlled for expression of the other reporter (right). (d) Pmir-793::GFP and Pmir-240–786::GFP expression for different lifespan cohorts over time (left) and regression on slope and mean of each reporter from 3 to 10 dph controlled for expression of the other reporter (right). The tables in panels a–c compare correlation coefficients for single PmiRNA::GFP reporters to the joint correlation coefficient obtained by regressing on both reporters. In scatter plots, the (o) and (+) symbols correspond to the uncontrolled and controlled regressions, respectively. All figures represent data from two biological replicates. (e) Interpretations of the relationships among these three reporters and the reported-on lifespan-determining processes. Informational hierarchy (left): Pmir-47::GFP provides strictly more information about future lifespan than the other two reporters, and Pmir-793::GFP provides strictly more information than Pmir-240–786::GFP expression. This is consistent with (at least) two different mechanistic hierarchies. Signaling hierarchy (center): the informational hierarchy may suggest that Pmir-47::GFP provides lifespan-predictive information strictly more downstream than the other reporters. Integration hierarchy (right): alternately, Pmir-47::GFP could provide information that integrates among more independent lifespan determinants.
Figure 6—figure supplement 1
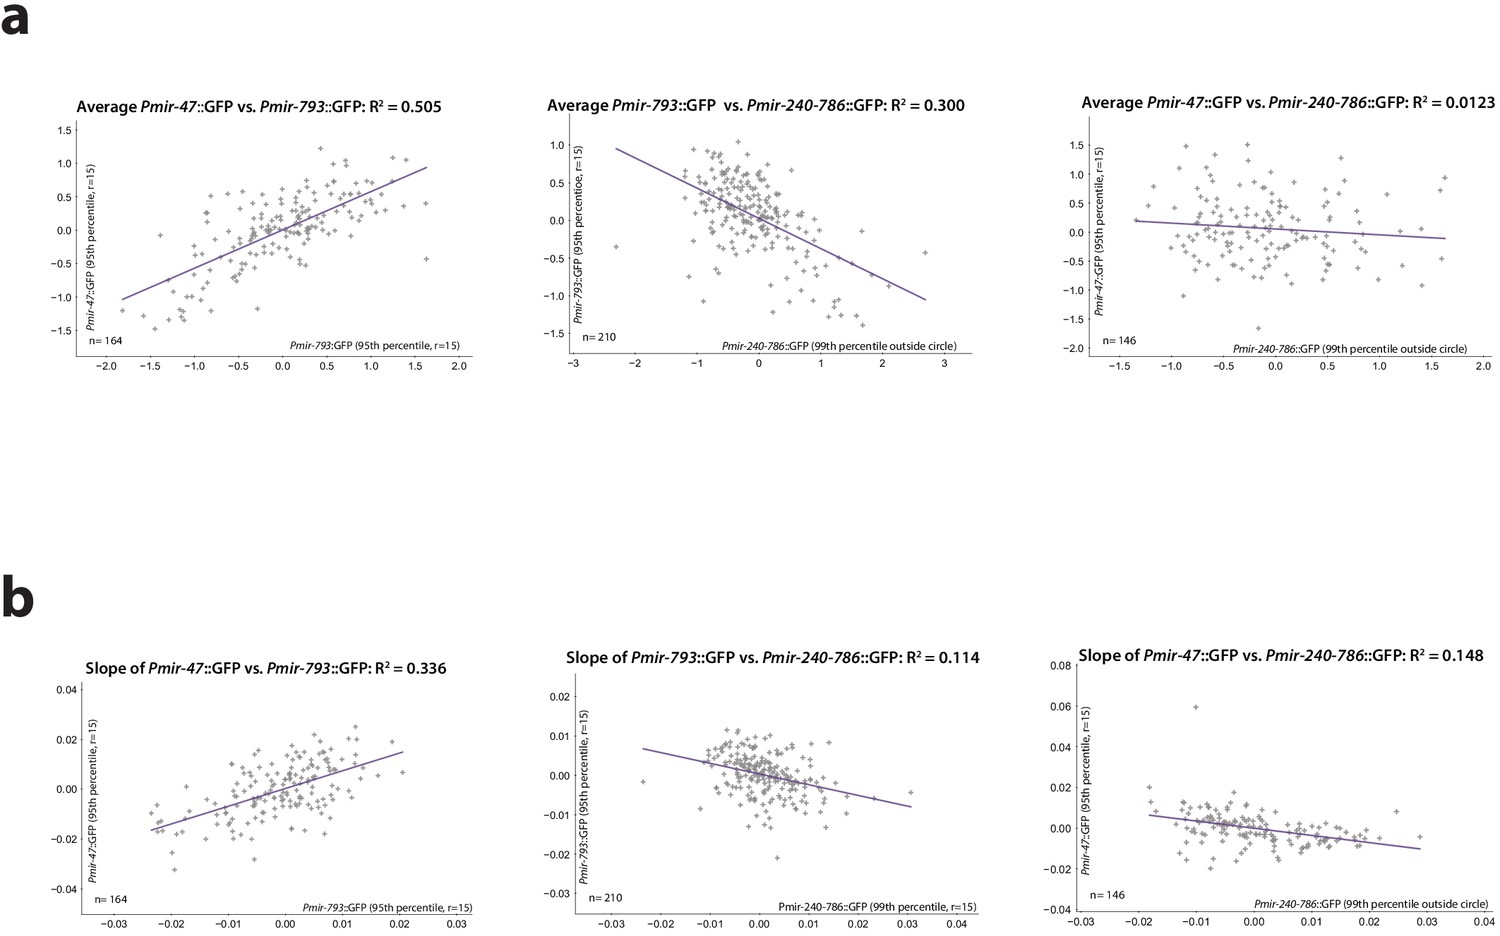
Pairwise correlations among GFP levels 3–8dph for each biomarker.
(a) Correlations among the mean fluorescence levels 3–8dph(b) Correlations among the slopes of the best-fit line to fluorescence levels 3–8dph.
Tables
Table 1
miRNAs corresponding to PmiRNA::GFP reporters selected for this study and the predominant expression pattern and time window of expression, as observed at ×5 magnification.
Published regulatory functions and lifespan phenotypes for each miRNA are noted. Bold text indicates miRNAs that we found to be predictive of lifespan in this current study, as measured by correlation of PmiRNA::GFP expression with lifespan.
| miRNA | Expression pattern | Time window of expression | Regulatory function | Lifespan phenotype |
|---|---|---|---|---|
| let-7 | Ubiquitous | Embryo–death | Developmental timing (Reinhart et al., 2000) | – |
| lin-4 | Ubiquitous | L1–death | Developmental timing (Wightman et al., 1993) | lin-4(e912) are short-lived; lin-4 overexpression extends lifespan (Boehm, 2005) |
| mir-1 | Pharynx | Embryo–death | Synaptic function (Simon et al., 2008) | – |
| mir-228 | Neurons | Embryo–death | – | mir-228(n4382) are long-lived; mir-228 overexpression shortens lifespan (Smith-Vikos et al., 2014) |
| mir-240–786 | Uterus, gonad sheath | L3–death | Defecation (Kemp et al., 2012) | – |
| mir-241 | Hypodermis | L1–four dph | Developmental timing (Abbott, 2005) | – |
| mir-242 | Neurons | Embryo–death | – | – |
| mir-243 | Intestine | Embryo–death | – | – |
| mir-246 | Gonad sheath | L4–death | – | mir-246(n4636) are short-lived; mir-246 overexpression extends lifespan (de Lencastre et al., 2010) |
| mir-360 | Pharynx | Embryo–death | – | – |
| mir-47 | Hypodermis, vulva | Embryo–death | – | – |
| mir-51 | Intestine | Embryo–death | Developmental timing (Brenner et al., 2012), GABAergic synapses (Zhang et al., 2018) | – |
| mir-59 | Vulva | L4–death | – | – |
| mir-60 | Intestine | Embryo–death | Oxidative stress response (Kato et al., 2016) | mir-60(n4947) are long-lived under oxidative stress conditions (Kato et al., 2016) |
| mir-63 | Intestine | Embryo–death | – | – |
| mir-788 | Hypodermis | Embryo–four dph | – | – |
| mir-79 | Hypodermis | Embryo–five dph | Proteoglycan homeostasis (Pedersen et al., 2013) | – |
| mir-793 | Neurons | Embryo–death | – | – |
| mir-794 | Body wall muscle, intestine | Embryo–four dph | – | – |
| mir-84 | Pharynx, vulva | L1–death | Developmental timing (Abbott, 2005) | – |
| mir-85 | Gonadal sheath, uterus, spermatheca | L2–death | – | – |
| mir-90 | Body wall muscle, vulva | Embryo–death | – | – |
Table 2
Correlation of PmiRNA::GFP reporters with lifespan.
A joint regression of slope and average expression against lifespan was performed using a sliding time window (minimum width of 12 hr) beginning at 3 days post-hatch and ending at the 90% survival timepoint, which we observed to be variable between strains. The optimal time window and highest correlation achieved is reported. R2 values exceeding 0.15 are indicated by bolded text. The 95% confidence interval (CI) for each joint correlation coefficient is also shown. The direction of correlation, derived from the individual regression on slope and mean expression (which we observed to always correlate in the same direction), is indicated by (+) or (-), respectively.
| miRNA | N | Measure of pixel intensity | Time window (dph) | Slope R2 | Mean R2 | Joint R2 | Joint 95% CI |
|---|---|---|---|---|---|---|---|
| let-7 | 289 | 99th percentile | 6.0–9.5 | 0.024 | 0.012 | 0.041 | [−0.002, 0.085] |
| lin-4 | 193 | Mean over 99th percentile | 4.5–9.0 | 0.211 | 0.029 | 0.212 (+) | [0.124, 0.306] |
| mir-1 | 79 | Maximum (head) | 6.0–7.5 | 0.102 | 0.025 | 0.117 | [0.008, 0.234] |
| mir-47 | 403 | Maximum | 5.0–8.5 | 0.158 | 0.158 | 0.313 (+) | [0.240, 0.388] |
| mir-51 | 87 | Maximum | 8.0–8.5 | 0.025 | 0.048 | 0.098 | [−0.010, 0.211] |
| mir-59 | 104 | 95th percentile (vulva) | 4.5–5.0 | 0.002 | 0.092 | 0.092 | [−0.020, 0.186] |
| mir-60 | 221 | 99th percentile | 7.5–8.5 | 0.035 | 0.238 | 0.277 (+) | [0.137, 0.402] |
| mir-63 | 139 | 99th percentile | 5.0–9.5 | 0.118 | 0.053 | 0.135 | [0.047, 0.230] |
| mir-79 | 86 | Maximum | 3.5–4.0 | 0.005 | 0.010 | 0.025 | [−0.033, 0.076] |
| mir-84 | 142 | 99th percentile | 9.0–9.5 | 0.000 | 0.091 | 0.091 | [−0.016, 0.187] |
| mir-85 | 187 | 99th percentile | 3.5–7.0 | 0.157 | 0.052 | 0.166 (+) | [0.075, 0.257] |
| mir-90 | 181 | 95th percentile | 8.0–8.5 | 0.014 | 0.215 | 0.229 (+) | [0.116, 0.340] |
| mir-228 | 157 | Mean over 99th percentile | 5.0–7.0 | 0.194 | 0.070 | 0.239 (+) | [0.129, 0.350] |
| mir-240–786 | 172 | 95th percentile | 7.5–8.5 | 0.043 | 0.268 | 0.291 (-) | [0.168, 0.419] |
| mir-241 | 97 | 99th percentile (head) | 3.0–3.5 | 0.013 | 0.037 | 0.051 | [−0.038, 0.133] |
| mir-242 | 111 | Maximum | 4.5–5.5 | 0.050 | 0.010 | 0.051 | [−0.041, 0.130] |
| mir-243 | 339 | Mean | 3.5–7.5 | 0.299 | 0.110 | 0.328 (+) | [0.254, 0.409] |
| mir-246 | 187 | 95th percentile | 6.5–8.5 | 0.124 | 0.124 | 0.225 (+) | [0.124, 0.332] |
| mir-360 | 99 | Maximum | 4.0–5.0 | 0.070 | 0.000 | 0.070 | [−0.032, 0.157] |
| mir-788 | 187 | Maximum | 3.0–3.5 | 0.000 | 0.005 | 0.006 | [−0.029, 0.037] |
| mir-793 | 175 | Maximum | 6.0–10.0 | 0.166 | 0.091 | 0.224 (+) | [0.146, 0.312] |
| mir-794 | 91 | Maximum | 3.0–3.5 | 0.009 | 0.082 | 0.093 | [−0.032, 0.209] |
Additional files
-
Source data 1
Source data for all figures.
- https://cdn.elifesciences.org/articles/65026/elife-65026-data1-v2.zip
-
Supplementary file 1
Supplementary tables.
- https://cdn.elifesciences.org/articles/65026/elife-65026-supp1-v2.pdf
-
Transparent reporting form
- https://cdn.elifesciences.org/articles/65026/elife-65026-transrepform-v2.pdf
Download links
A two-part list of links to download the article, or parts of the article, in various formats.
Downloads (link to download the article as PDF)
Open citations (links to open the citations from this article in various online reference manager services)
Cite this article (links to download the citations from this article in formats compatible with various reference manager tools)
Global, cell non-autonomous gene regulation drives individual lifespan among isogenic C. elegans
eLife 10:e65026.
https://doi.org/10.7554/eLife.65026


