High-speed, three-dimensional imaging reveals chemotactic behaviour specific to human-infective Leishmania parasites
- York Biomedical Research Institute, Department of Biology, University of York, United Kingdom
- Department of Physics, University of York, United Kingdom
- York Biomedical Research Institute, Hull York Medical School, University of York, United Kingdom
Figures
Figure 1 with 1 supplement
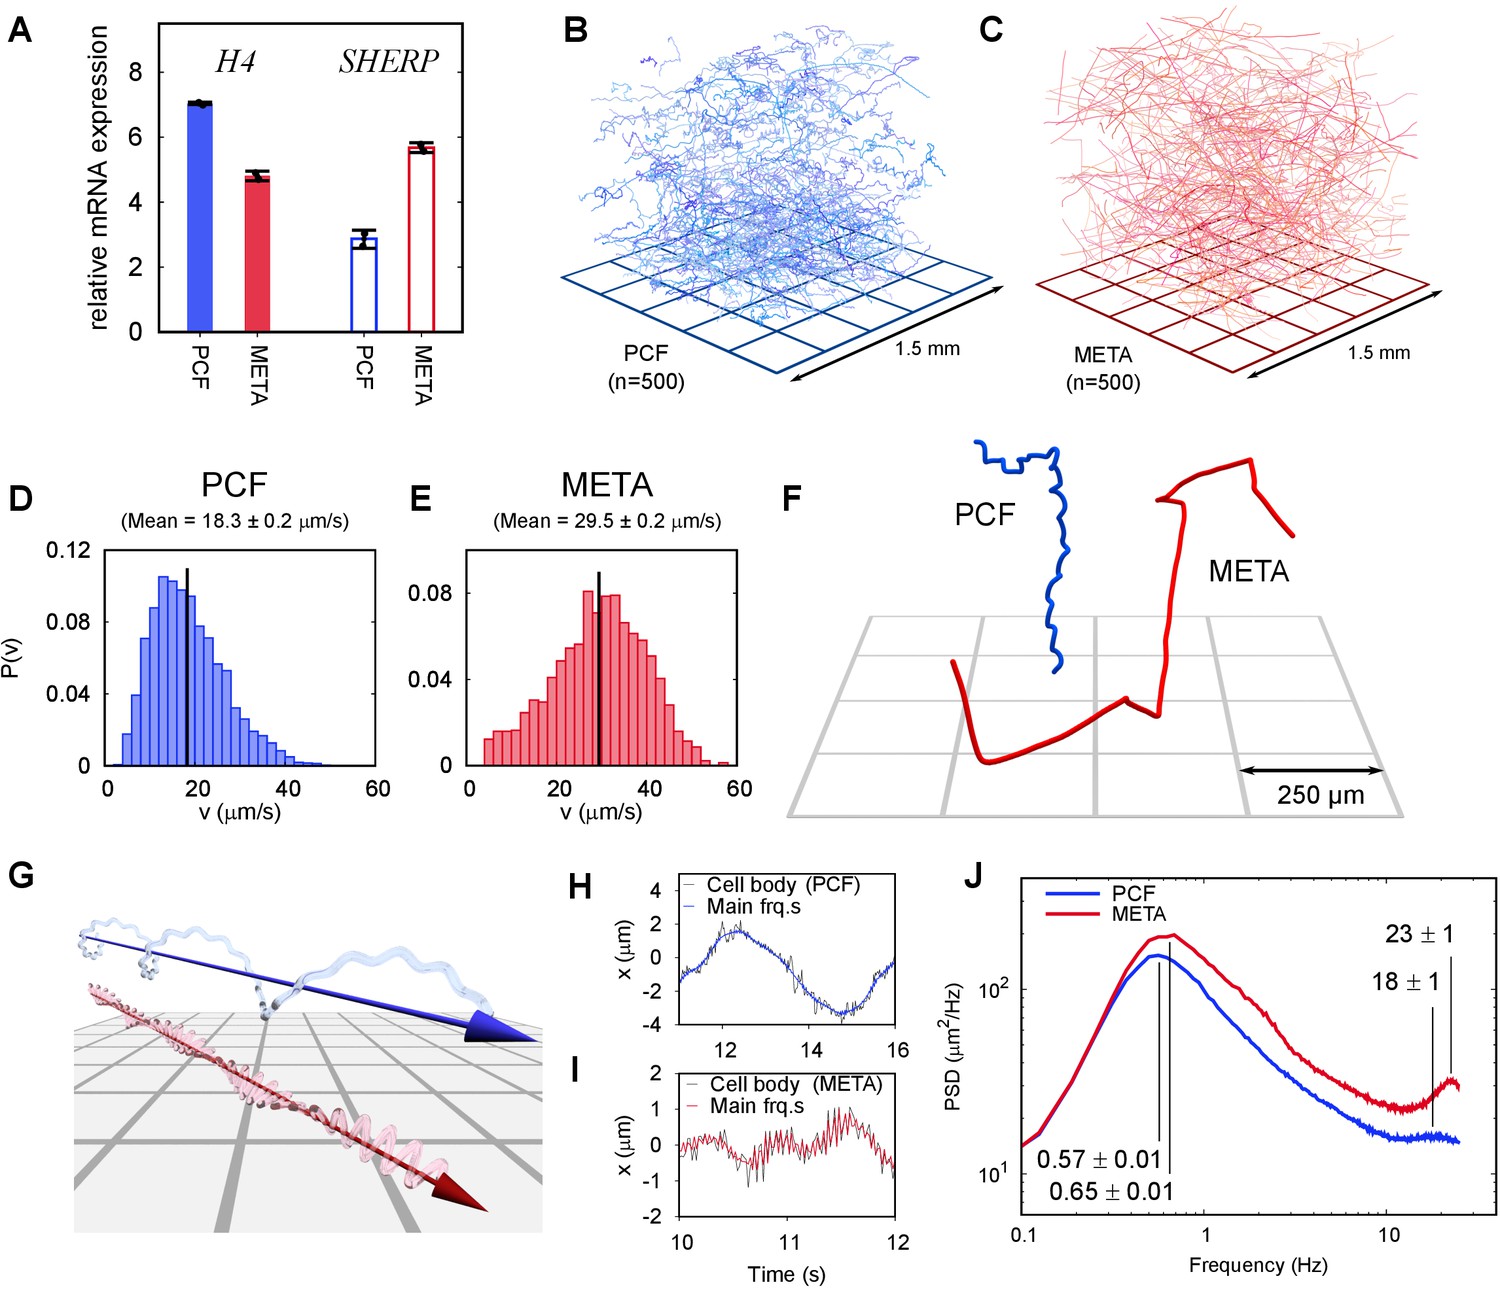
Swimming phenotypes in infective (metacyclic promastigote [META]) and non-infective (procyclic promastigote [PCF]) Leishmania mexicana cells.
(A) qPCRs of H4 (PCF molecular marker) and SHERP (META molecular marker) levels relative to N-myristyltransferase (nmt) (constant transcript control) demonstrate that enriched, but not wholly distinct populations of cells were isolated and characterised. (B) Three-dimensional swimming trajectories from 500 PCF cells of L. mexicana, showing stereotypical meandering helical paths (Video 2). (C) Trajectories of 500 META cells of L. mexicana. These show a marked transition to a ‘run and tumble’ phenotype of rapid, straight trajectories interspersed by sharp reorientations (Video 3). (D,E) Distribution of instantaneous swimming speeds in PCF (n = 3231) and META (n = 2202) cells, respectively. (F) Individual tracks of PCF and META cells at a smaller scale, illustrating the different swimming phenotypes (Video 4). (G) Cartoon illustrating the dominant swimming phenotype for PCF (top) and META (bottom). (H) The x-component of cell body motion as a function of time for a PCF cell. The black line represents the raw data, and the blue line is the motion reconstituted using the principal frequency components only. (I) The x-component of motion for a META cell, both raw data (black) and principal frequencies only (red). The flagellar beat frequency is more pronounced in META cells compared to PCF cells because the cell bodies of the former are significantly smaller, and their flagella are longer. (J) Averaged power spectra of PCF (blue, n = 3231) and META (red, n = 2202) motion, when the lowest frequencies have been removed (see text). The peaks at around 0.6 Hz correspond to the rotation of the flagellar beat plane and the peaks at around 20 Hz to the flagellar beat in both cell types. The peak values and estimated uncertainties are indicated.
Figure 1—figure supplement 1
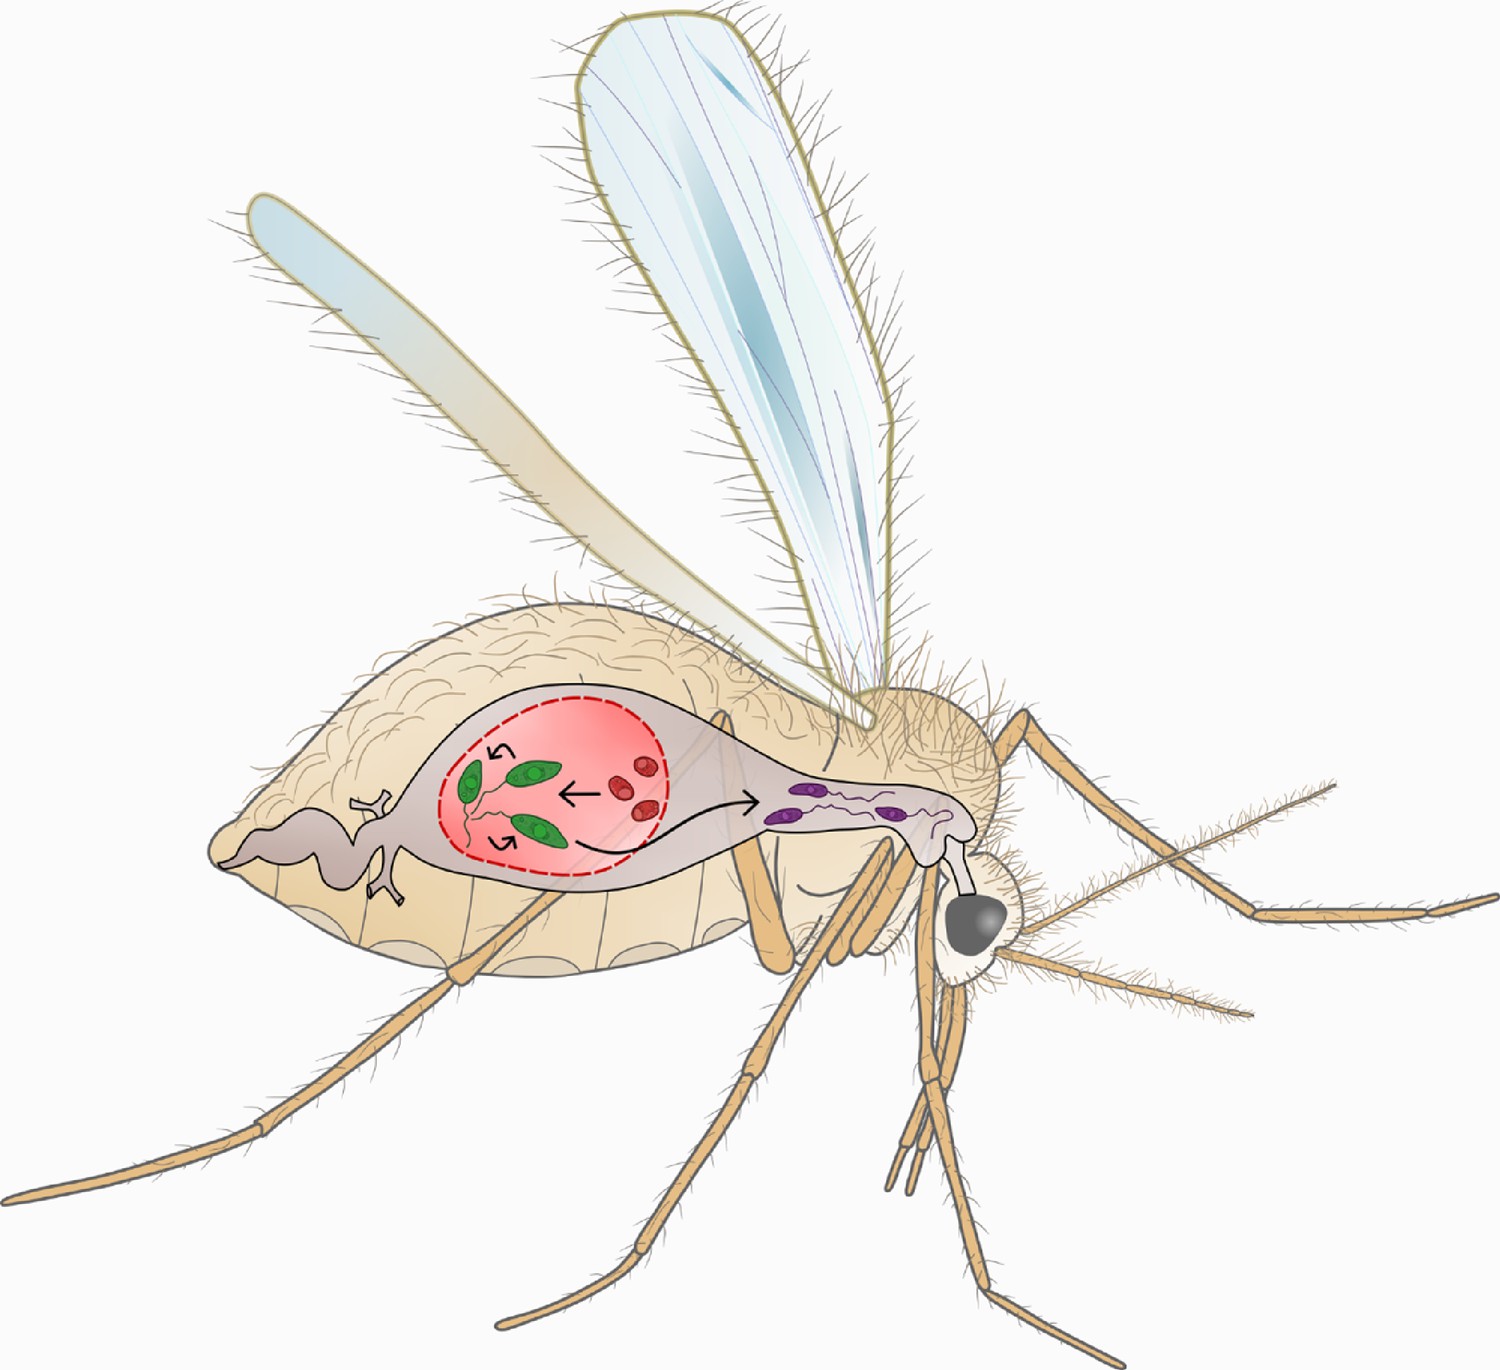
The Leishmania life cycle.
This cartoon shows the key stages of the Leishmania life cycle within the sandfly. Female sandflies ingest Leishmania amastigote-stage parasites (AMA; red) during bloodmeals from infected mammals. Within 24–48 hr of exposure to the midgut environment, AMA differentiate into procyclic-stage promastigotes (PCF; green). PCF in turn differentiate into human-infective metacyclic-stage promastigotes (META; purple) within 2 weeks. Subsequent bloodmeals can then transmit META parasites into new mammalian hosts. In our study we compare the swimming phenotype of the motile life cycle stages: PCF (green) and META (purple). We find that parasite differentiation is accompanied by distinct changes in swimming behaviour.
Figure 2
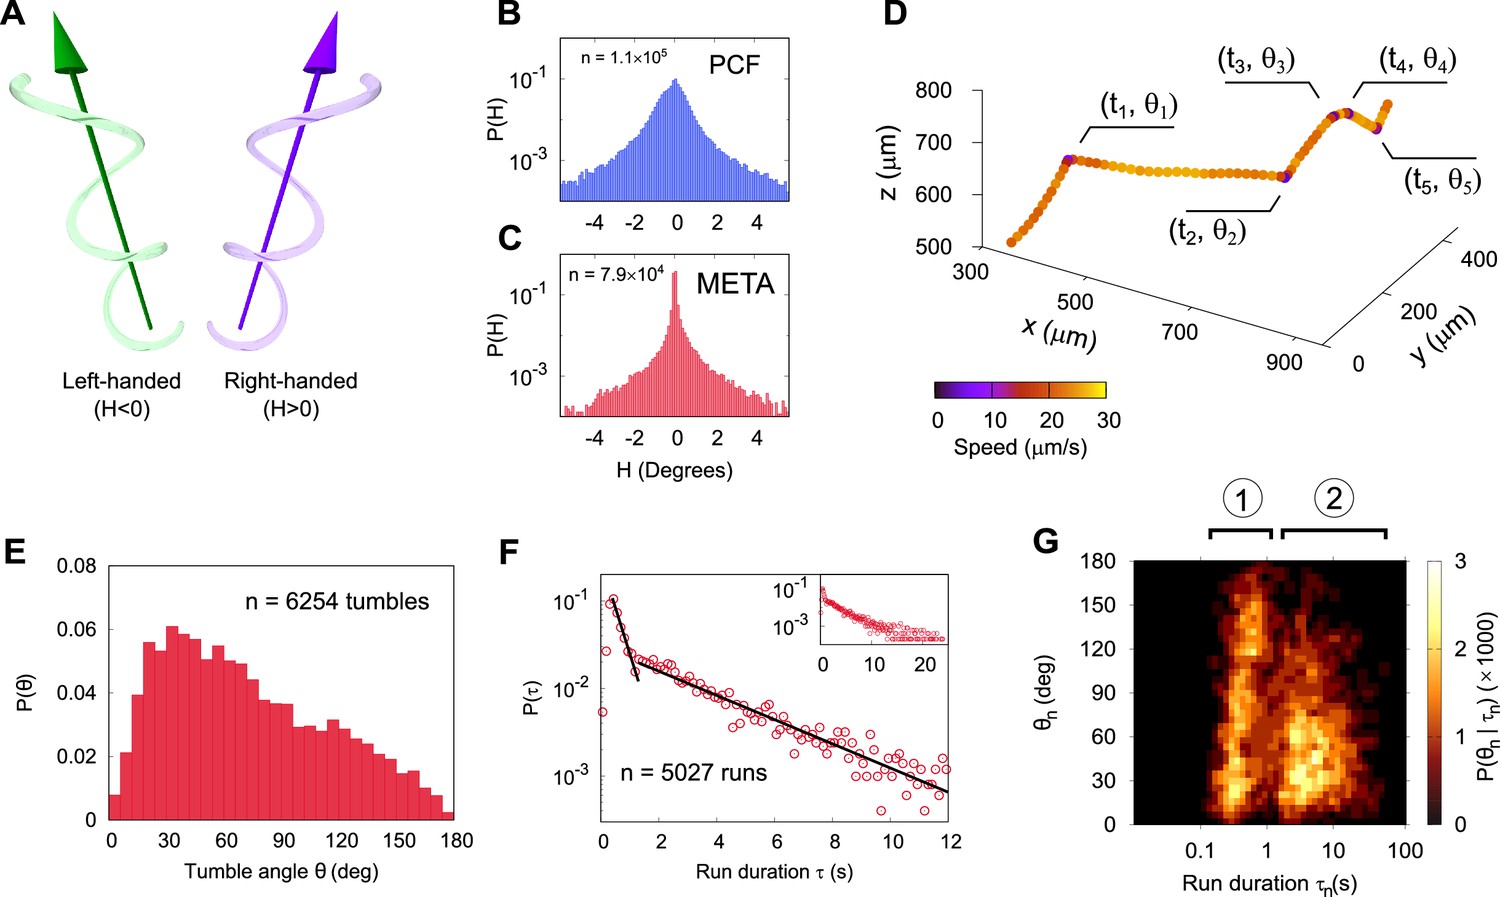
Three-dimensional geometry of metacyclic promastigote (META) and procyclic promastigote (PCF) cell tracks in Leishmania mexicana.
(A) Cartoon depicting left- and right-handed tracks, corresponding to negative and positive helicity, respectively ( is an achiral line). (B) Normalised probability density of instantaneous helicity in a population of PCF (n = 1.1 × 10⁵). (C) Normalised probability density of helicity among META (n = 7.9 × 10⁴). (D) An example META trajectory in which the colour code shows instantaneous speed. The cell was imaged at 50 Hz, with every 30th point plotted for clarity and five changes in direction (‘tumbles’), as indicated. (E) The normalised probability density of tumble angles among META. The mean tumble angle is 72° ± 0.5° (SEM) and the mode is 21°. (F) The distribution of run durations among META, showing two distinct exponential regimes, at short and long times as indicated by the piecewise straight-line fits (black lines). The inset shows the complete range of run durations. (G) Correlation between the duration of a run and the tumble angle following it among META (n = 5027 runs). Shorter runs (population 1) are followed by a wider range of angles than longer runs (population 2) indicative of two characteristic run phenotypes.
Figure 3 with 2 supplements
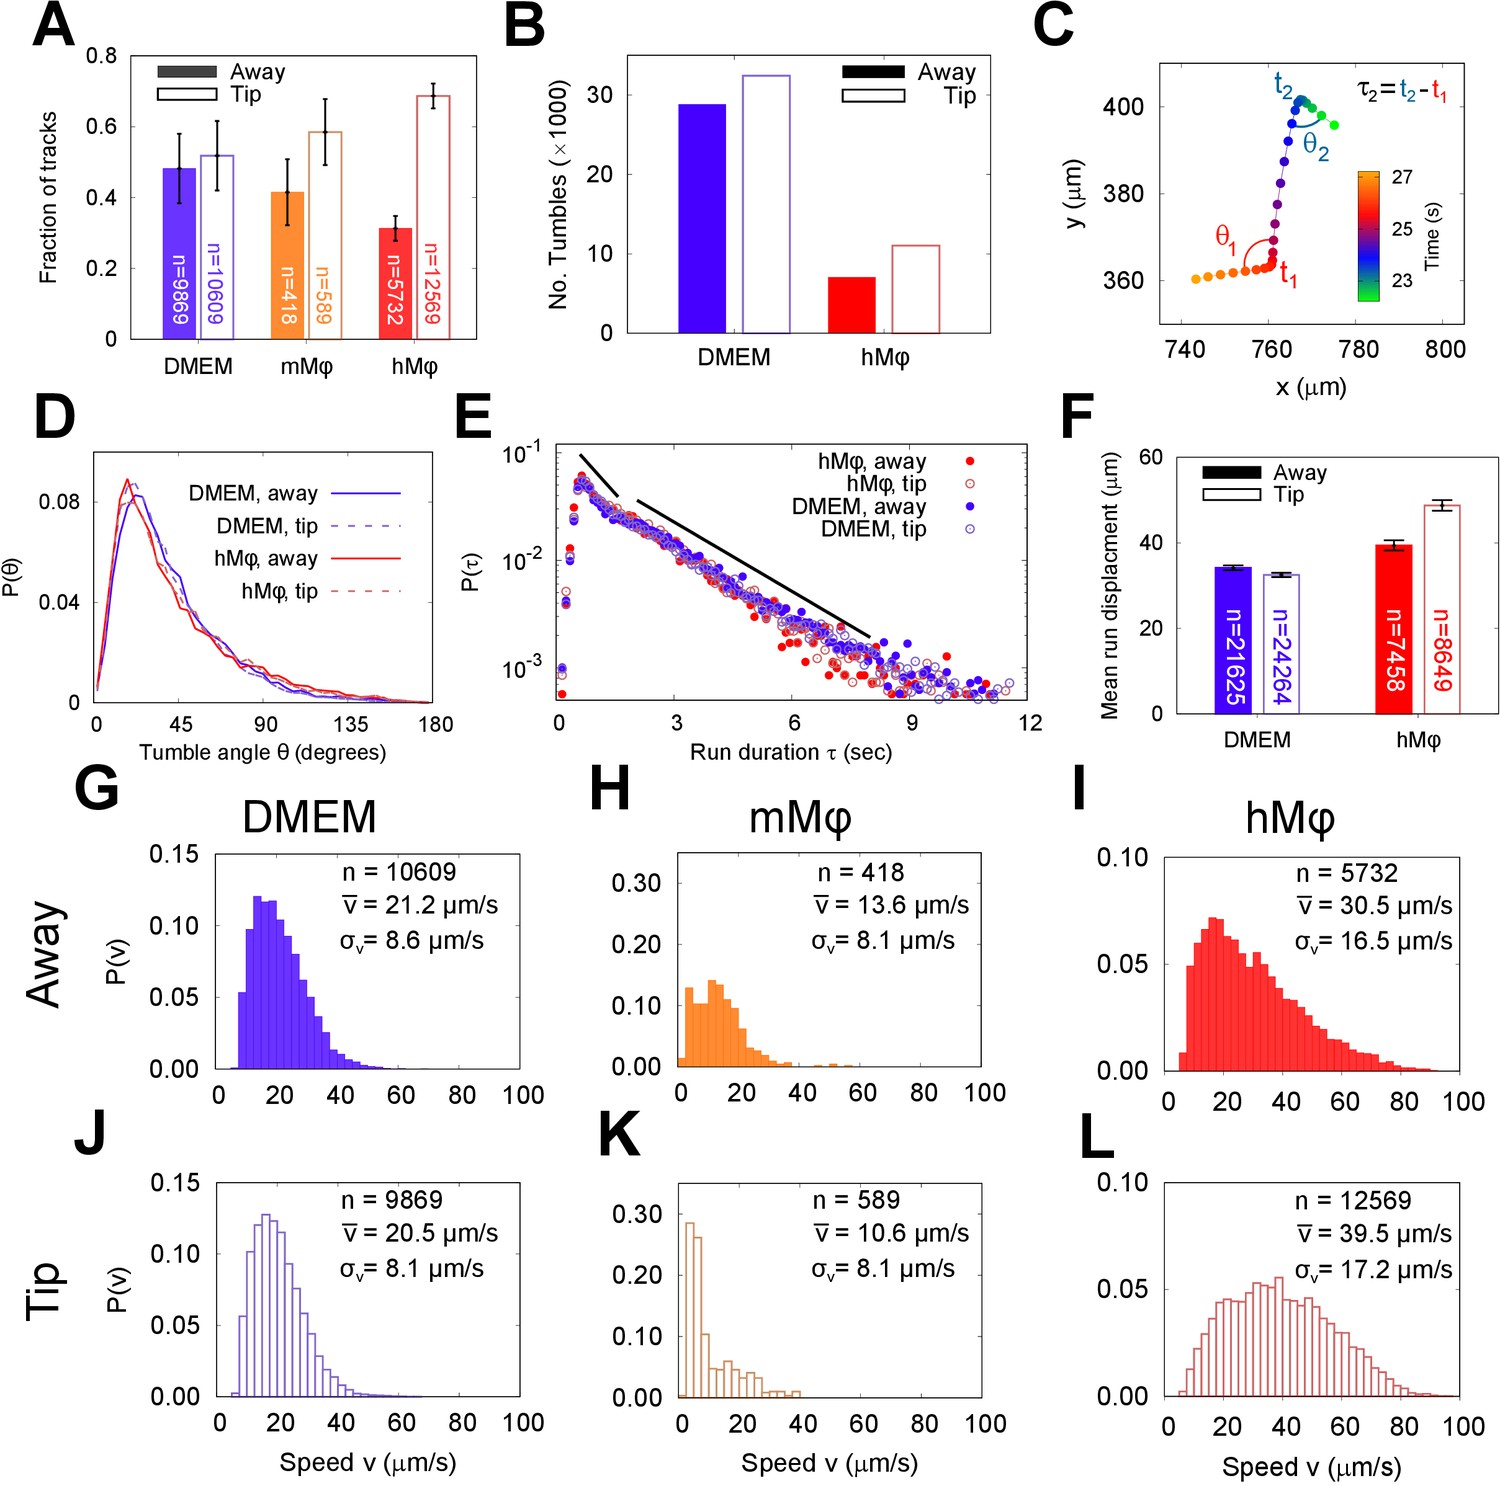
The run and tumble behaviour of metacyclic promastigote (META) cells in the presence of an immunological stimulus.
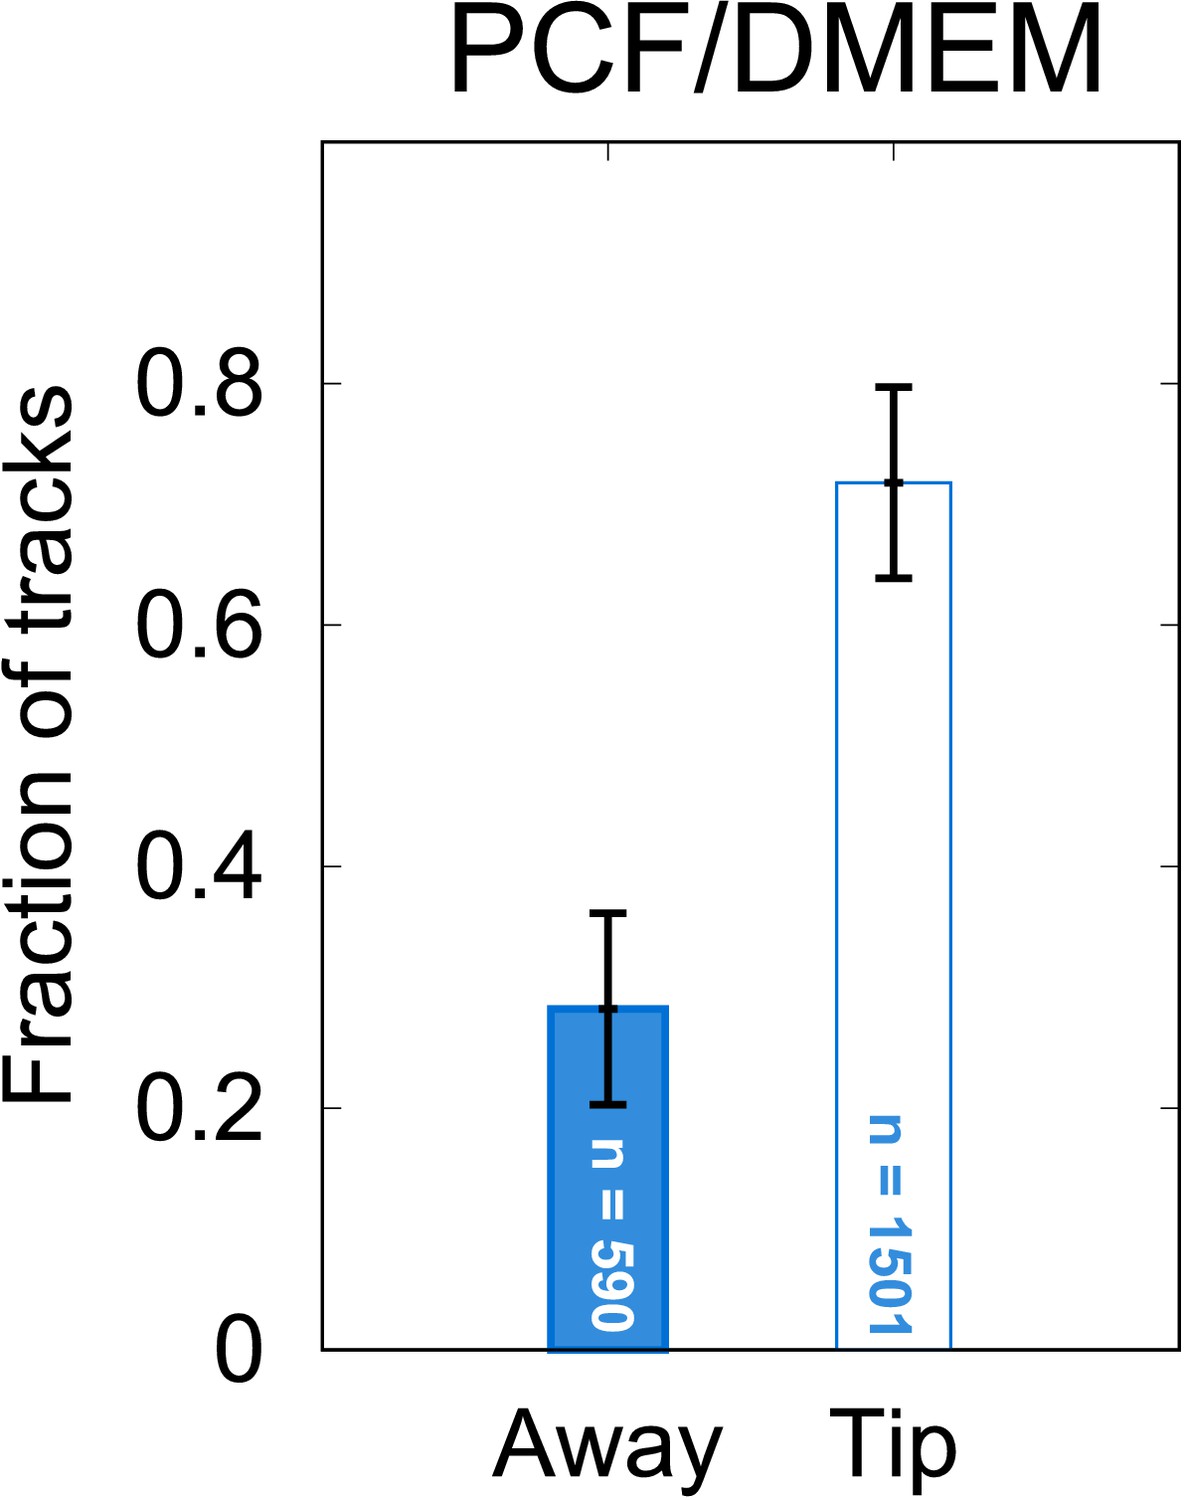
(A) Fractions of tracks from META cells observed in a bulk suspension of cells 1 cm away from (‘Away’, solid bars) and immediately adjacent to a loaded pipette tip that had been immersed in the sample medium (‘Tip’, filled bars) for 30 min. The negative controls, in which tips were filled with DMEM agar, show negligible differences in the number of tracks proximal to the tip, versus the distal bulk. Pipette tips filled with either cultured J774.2 immortalised, mouse stomach-derived macrophages (mMφ) or fresh human blood-derived macrophages (hMφ) showed accumulations of cells around the pipette tips (error bars = 95% CI). (B) The number of ‘tumble’ events for cells in control (DMEM) and test (hMφ) conditions. Exposure to hMφ reduces the number of tumble events considerably, consistent with a more persistent swimming direction. This effect impacts not only the cells that are in the immediate proximity of the human-derived macrophages (hMφ, Tip) but also those in the rest of the sample chamber. As the cells are free to explore the whole sample volume, any ‘activation’ of cells exposed to a macrophage stimulus may persist even when the cells themselves have left the immediate environment of the pipette tip. (C) The x-y projection of a section of a META track, showing tumble times (), reorientation angles (), and intervening run duration (). (D) The distribution of tumble angles remains unchanged in the presence of macrophage stimulus, suggesting an unbiased stochastic reorientation process. (E) Distribution of run durations. Contrary to what would be expected in the equivalent situation in chemotaxis in model bacterial systems, there is no increase in run duration in the presence of stimulus (hMφ ‘Tip’), compared to controls (hMφ ‘Away’, DMEM ‘Tip’, DMEM ‘Away’); the distribution of run durations is almost identical in all cases. (F) The mean displacement per run, showing an increase in the run displacement as a consequence of the faster run speed near the macrophage-loaded pipette tip (error bars = error bars=95% CI). (G–L) Normalised instantaneous cell speed distributions for cells distal versus proximal to stimulus. Control samples (DMEM; G,J) show minimal difference, but the presence of mouse- or human-derived macrophages causes a decrease or increase in swimming speed, respectively.
Figure 3—figure supplement 1
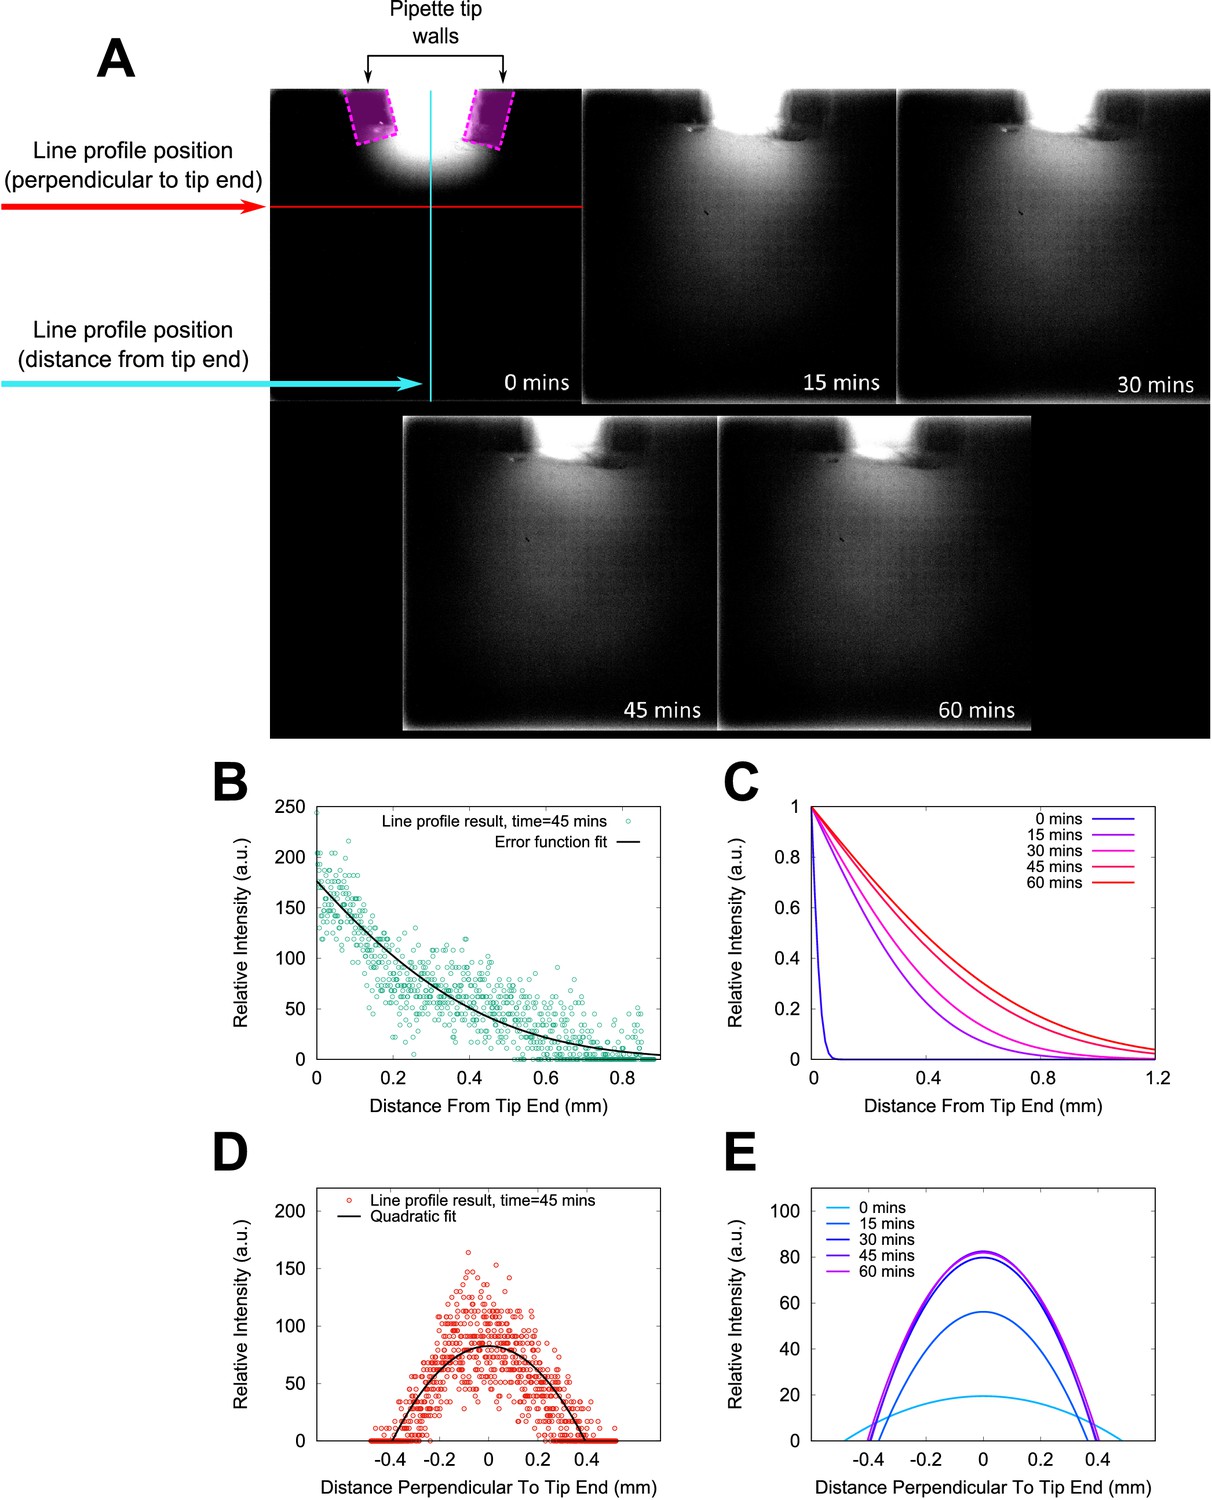
Fluorescein modelling of chemoeffector gradient.
Fluorescein-infused agar was used to model the diffusion of a molecular substance into our sample chambers. A 10 μl pipette tip was loaded with agar and sealed into the chamber. The sample chamber was placed horizontally on the microscope and fluorescence images were acquired at intervals of 15 min after loading (panel (A)). To quantify the extent of the chemical plume emitted from the pipette tip, line profiles of intensity were measured in each image. The positions of the line profiles are illustrated in the first panel only (0 min), along with the outlines of the pipette tip walls where they lie in the focal plane. The fluorescein plume extends towards the bottom of the image over the course of the experiment. Example line profile data is shown in (B), for the case of a line profile extending normal to the surface of the agar in the pipette tip. These data were fitted with an error function, shown as a black solid line. Profiles in the same position in the other images in the sequence are shown in (C). Panels (D) and (E) show example line profile data and fits from the transect parallel to agar surface normal. A quadratic fit was used to fit the data in this case. These data show that the plume is relatively stable against any convection currents in the sample, and extend throughout the field of view of our chemotaxis experiments.
Figure 3—figure supplement 2
Chemotaxis results from procyclic promastigotes (PCF).
Control experiments show that PCF cells are attracted to the gel matrix contained within the pipette tip even in the absence of macrophages. This is consistent with previous studies in which samples of ‘promastigotes’ (i.e. samples in which the metacyclic fraction has not been enriched) are attracted to various small carbohydrate molecules. These molecules are associated with unrefined agar. In light of this ‘false positive’ result – unlike the case for metacyclic promastigotes’ (META) cells – further experiments with PCF were not pursued. (Error bars represent 95% CI.)
Videos
Video 1
Differential interference contrast movie of an unenriched sample of Leishmania mexicana cells, including procyclic promastigotes and metacyclic promastigotes, as well as intermediate forms.
The cells were attached to the chamber surface by pre-treating the glass slide with polylysine. The scale bar represents 25 μm.
Video 2
Computer rendering of 500 Leishmania mexicana procyclic promastigote tracks, showing stereotypical meandering helical paths.
The squares on the ground represent 300 μm on a side, and the tracks are between 20 and 60 s in duration.
Video 3
Computer rendering of 500 Leishmania mexicana metacyclic promastigote tracks, showing the stereotypical run and tumble phenotype of unstimulated cells.
The squares on the ground represent 300 μm on a side, and the tracks are between 20 and 60 s in duration.
Video 4
Computer rendering of two exemplar cell tracks: a procyclic promastigote (blue) and a metacyclic promastigote (red) of Leishmania mexicana.
The squares on the ground represent 250 μm on a side. The procyclic promastigote track displays the stereotypical meandering helical trajectory, while the metacyclic cell shows longer, straight runs interspersed with tumble events.
Video 5
Artist’s impression of a mixed population of swimming metacyclic and procyclic promastigotes of Leishmania mexicana.
The cells are rendered with the cell bodies in proportion to the flagella, and the cells’ swimming trajectories are those obtained from tracking data.
Video 6
Artist’s impression of a mixed population of swimming metacyclic and procyclic promastigotes of Leishmania mexicana, presented as a three-dimensional (3D) red-cyan anaglyph.
The cells are rendered with the cell bodies in proportion to the flagella, and the cells’ swimming trajectories are those obtained from tracking data.
Additional files
Download links
A two-part list of links to download the article, or parts of the article, in various formats.
Downloads (link to download the article as PDF)
Open citations (links to open the citations from this article in various online reference manager services)
Cite this article (links to download the citations from this article in formats compatible with various reference manager tools)
High-speed, three-dimensional imaging reveals chemotactic behaviour specific to human-infective Leishmania parasites
eLife 10:e65051.
https://doi.org/10.7554/eLife.65051


