Human embryo polarization requires PLC signaling to mediate trophectoderm specification
- Mammalian Embryo and Stem Cell Group, University of Cambridge, Department of Physiology, Development and Neuroscience, United Kingdom
- Blavatnik Institute, Harvard Medical School, Department of Genetics, United States
- MRC Laboratory of Molecular Biology. Francis Crick Avenue, Biomedical Campus., United Kingdom
- IVIRMA Valencia, IVI Foundation, Spain
- Center for Reproductive Medicine, Cheeloo College of Medicine, Shandong University, China
- Key laboratory of Reproductive Endocrinology of Ministry of Education, Shandong University, China
- Developmental Plasticity and Self-Organization Group, California Institute of Technology, Division of Biology and Biological Engineering, United States
- Yale School of Medicine, Department of Genetics, United States
- California Institute of Technology, Division of Biology and Biological Engineering,, United States
- USC Fertility, University of Southern California, Keck School of Medicine, United Kingdom
- IVIRMA New Jersey, United States
- CARE Fertility Group, John Webster House, 6 Lawrence Drive, Nottingham Business Park, United Kingdom
- School of Pharmacy and Biomolecular Sciences, Liverpool John Moores University, United Kingdom
- Yale School of Medicine, Department of Obstetrics, Gynecology, and Reproductive Sciences, United States
Figures
Figure 1 with 1 supplement
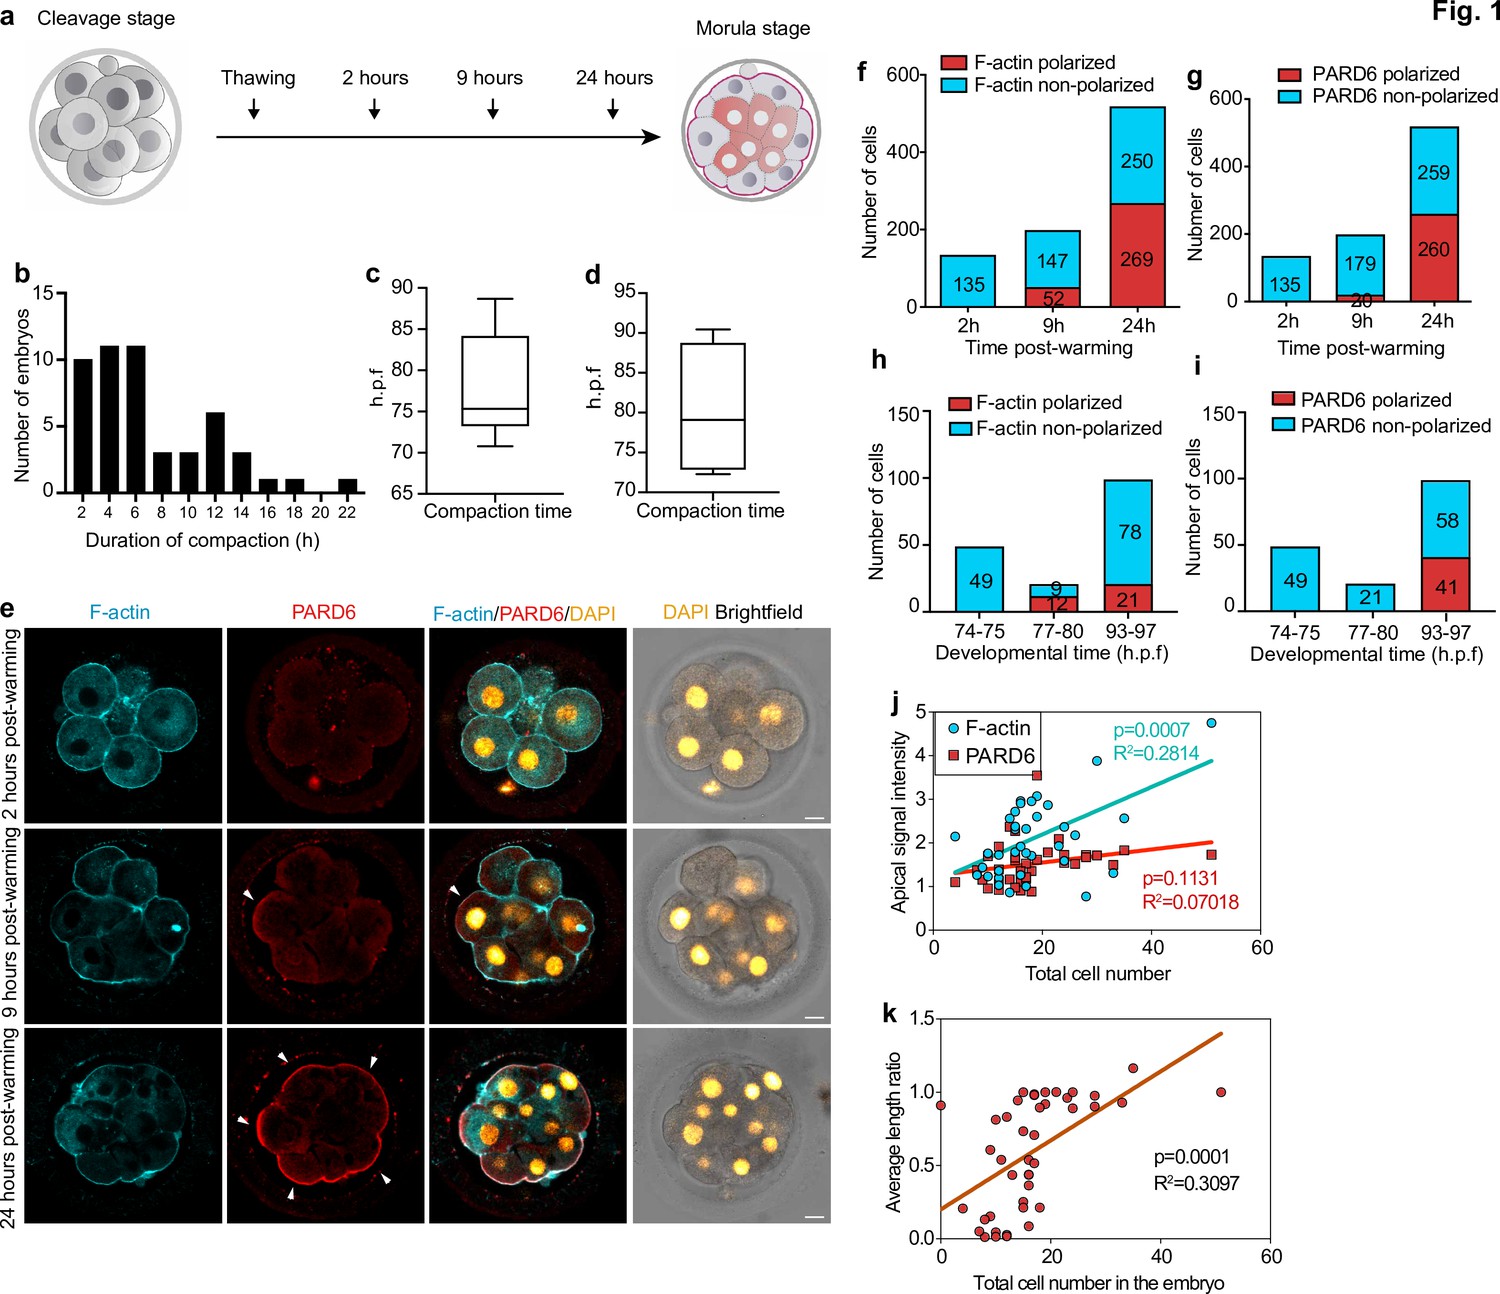
Timing of compaction and polarization in human embryos.
(a) Scheme for human embryo culture. Supernumerary in vitro fertilized human embryos were warmed at day 3, and cultured for 2, 9, or 24 hr to examine the localization of polarization markers. (b) Histogram showing the time between the initiation and the end of compaction. N = 50 control embryos. Eight independent experiments. (c) Time at which compaction is initiated in embryos with known fertilization time. N = 10 control embryos. (d) Time at which compaction is completed in embryos with known fertilization time. N = 4 control embryos. Data is shown as a box and whiskers plot from the minimum to the maximum value. Four independent experiments. (e) Representative images of human embryos fixed at different developmental time-points (as shown in a) and immunostained for F-actin and PARD6. Arrowheads indicate the apical domain. (f) Quantification of the number of cells showing polarized or non-polarized F-actin in different developmental time-points. (g) Quantification of the number of cells showing polarized or non-polarized PARD6. For both e and f, the number in each bar represents the number of cells analyzed. N = 17 embryos for 2 hr post-warming; N = 20 embryos for 9 hr post-warming and N = 32 embryos for 24 hr post-warming. N = 5 independent experiments. (h) Quantification of the number of cells showing polarized or non-polarized F-actin in different post-fertilization time points. (h) Quantification of the number of cells showing polarized or non-polarized PARD6 in different post-fertilization time points. For both g and h, the number in each bar represents the number of cells analyzed. N = 6 74–75 h.p.f., N = 2 77–78 h.p.f. and N = 9 h.p.f. embryos. (i) Correlation between F-actin/PARD6 apical enrichment and cell numbers. Apical enrichment of F-actin and PARD6 is measured as the ratio of signal intensity on the apical surface to the cell-cell contacts. (j) Correlation between the length of the apical domain (based on the PARD6 immunostaining) and embryo cell numbers. Each dot represents one analyzed cell. h.p.f.: hours post-fertilization. Seven independent experiments. Scale bars, 15 µm.
-
Figure 1—source data 1
Source data for Figure 1.
This file contains the source data used to make the graphs presented in Figure 1 and Figure 1—figure supplement 1. GraphPad Prism was utilized to visually represent the quantitative data.
- https://cdn.elifesciences.org/articles/65068/elife-65068-fig1-data1-v2.xlsx
Figure 1—figure supplement 1
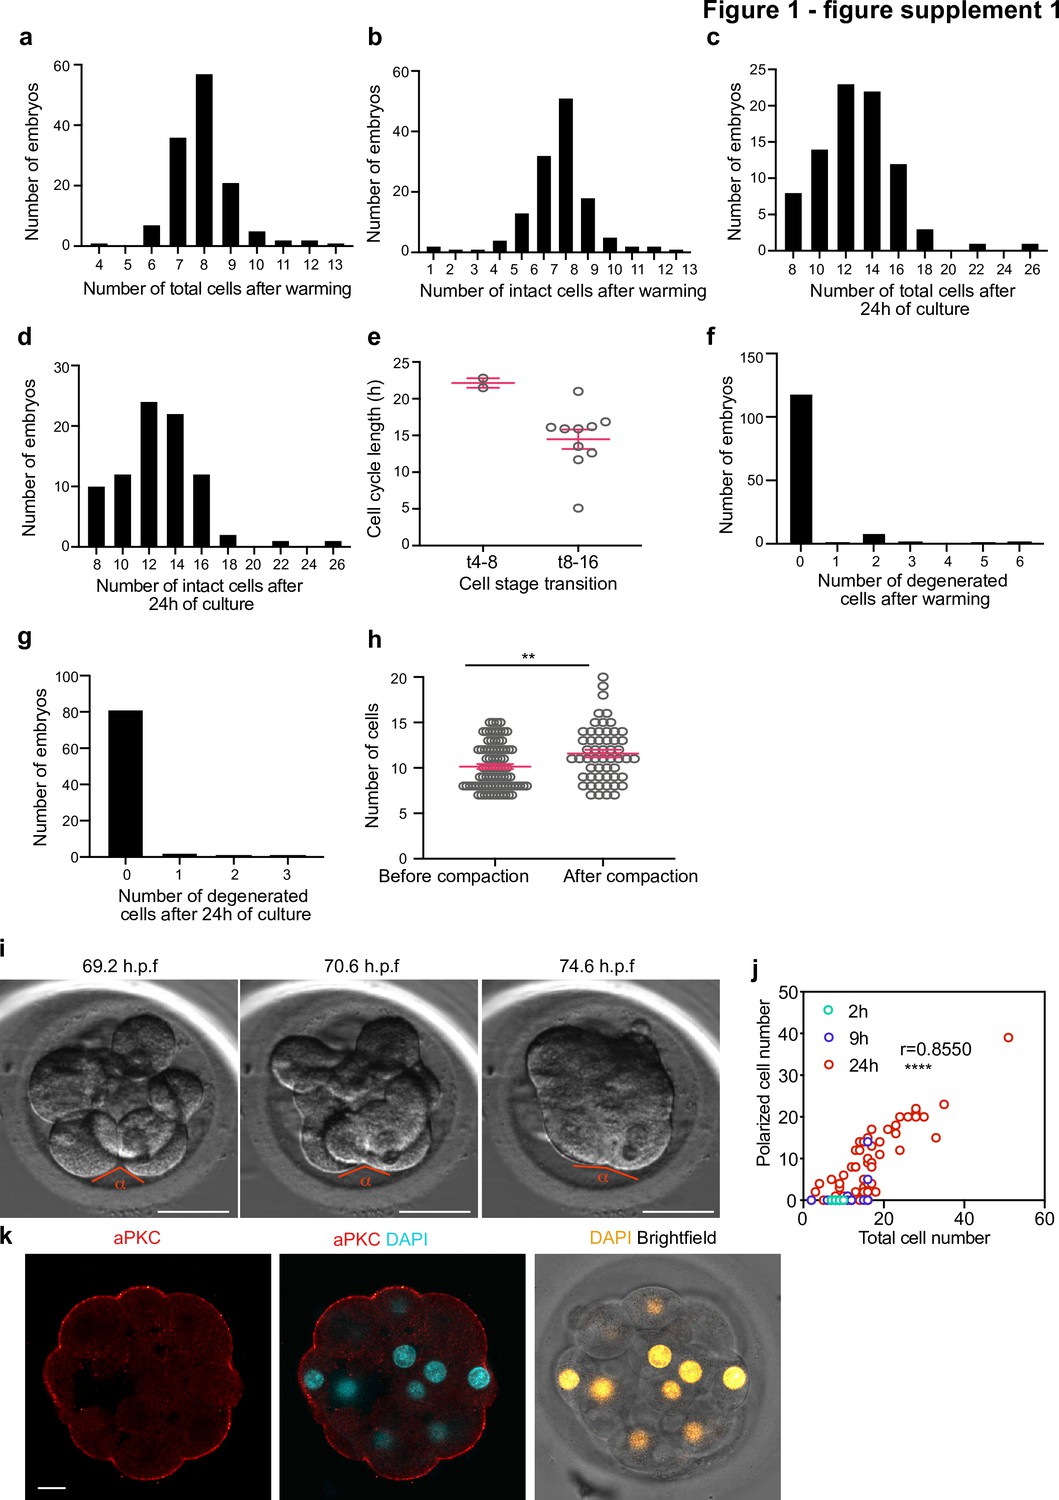
Morpho-kinetic analysis of human embryos cultured in vitro from day 3 to day 4.
(a-b) Histograms showing the number of total (a) and intact (b) cells at the time of embryo warming, N = 132 control embryos. (c–d) Histograms showing the number of total (c) and intact (d) cells after 24 hours of embryo culture, N = 84 control embryos. (e) Cell cycle length at the 4–8 (t4-8) and 8–16 (t8-16) cell stage transitions. Each dot represents an individual cell. N = 2 t4-8 and N = 10 t8-16 control embryos. Data are shown as mean ± S.D. (f) Histogram showing the number of degenerated cells at the time of embryo warming, N = 132 control embryos. (g) Histogram showing the number of degenerated cells during 24 hours of embryo culture, N = 85 control embryos. (h) Number of cells before and after compaction. Each dot represents an individual embryo. Data are shown as mean ± S.E.M. N = 83 (before) and N = 54 (after) control embryos. **p = 0.0083, Mann Whitney U test. (i) Brightfield images of an embryo undergoing compaction. The angle measured to assess compaction is indicated. (j) Number of polarized cells in relation to the total cell number in embryos analyzed 2, 9, and 24 hr after warming. Pearson correlation r = 0.8550, ****p < 0.0001. (k), Human embryos at embryonic day four were immunostained with aPKC and DAPI. N = 5 embryos. h.p.f.: hours post-fertilization. Scale bars, 10 µm.
Figure 2 with 2 supplements
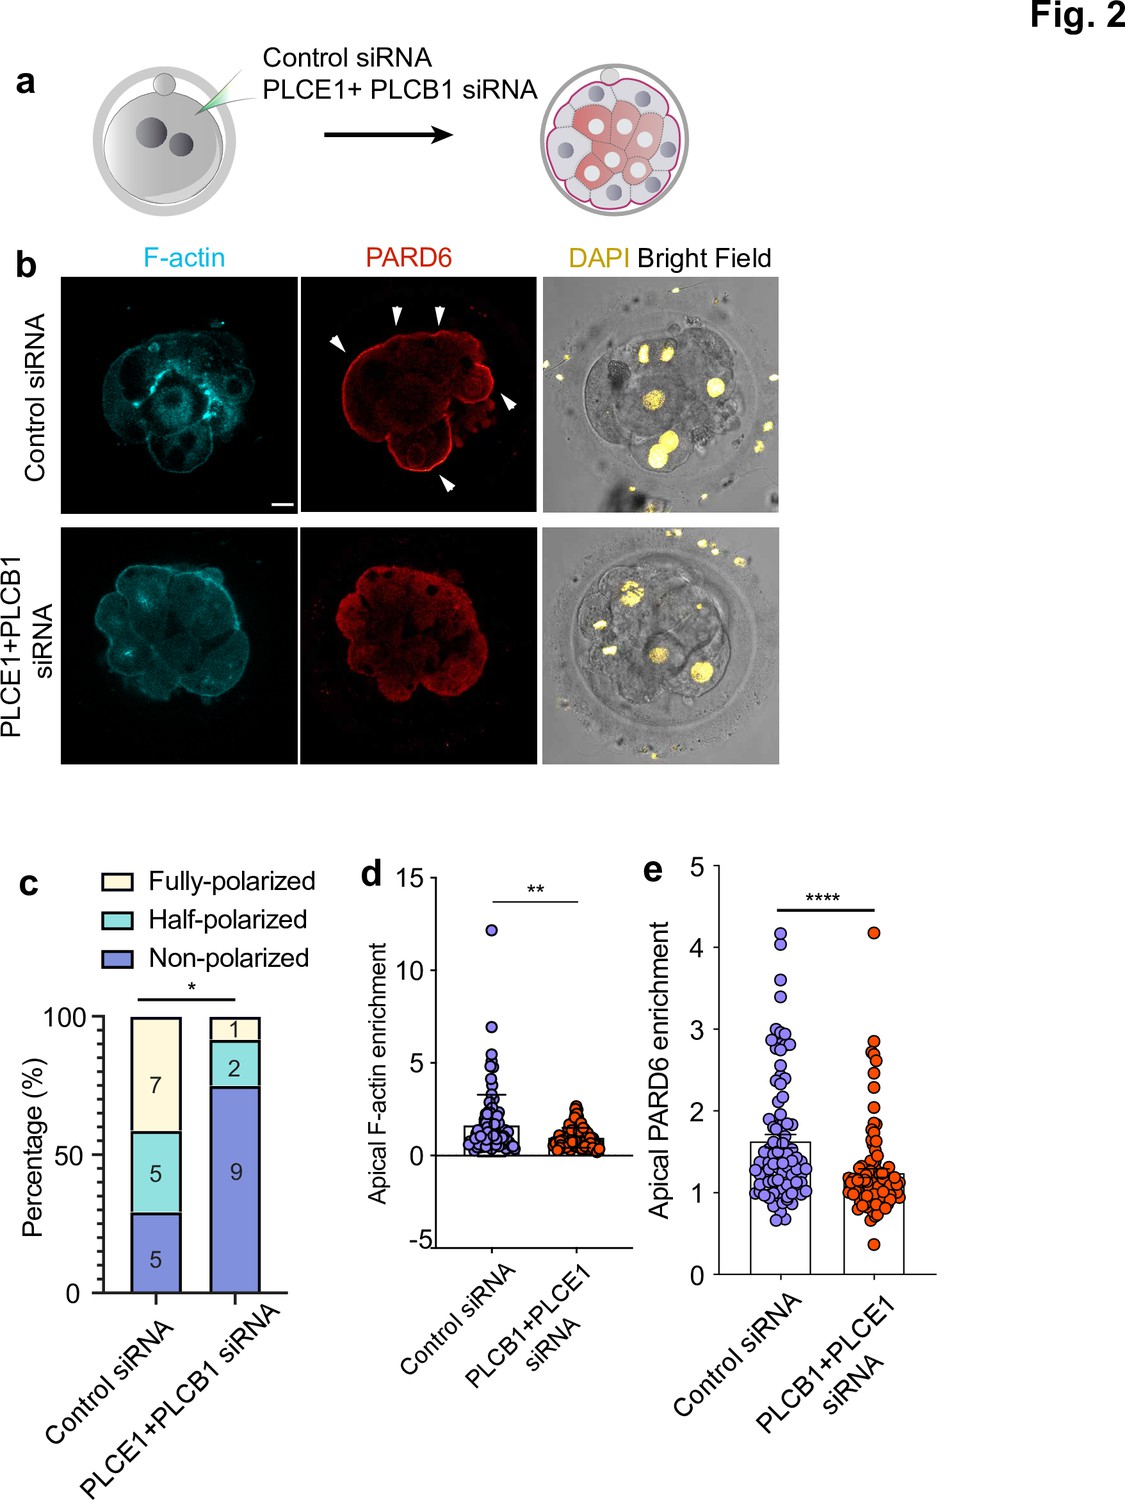
PLC activity regulates cell polarization in the human embryo.
(a) Scheme of the PLCE1/PLCB1 siRNA injections. (b), Representative images of embryos injected with control siRNA or PLCE1/PLCB1 siRNA and cultured until embryonic day four to reveal the localization of F-actin, PARD6, and DAPI. (c) Quantification of the percentage of embryos showing PARD6 polarized cells in embryos from panel b. The number in each bar indicates the number of embryos analyzed. N = 17 embryos for control siRNA injected group; N = 12 for PLCB1+ PLCE1 siRNA injected group. * p < 0.05. Fisher’s exact test. Three independent experiments. (d) Quantification of apical F-actin fluorescence intensity in embryos from panel b. N = 92 control siRNA cells and N = 100 PLCB1+ PLCB1 siRNA cells. **p < 0.0001, Mann-Whitney test. (e) Quantification of apical PARD6 fluorescence intensity in embryos from panel f. N = 89 control siRNA cells and N = 100 PLCB1+ PLCB1 siRNA cells. ****p < 0.0001, Mann-Whitney test. Scale bars, 15 µm.
-
Figure 2—source data 1
Source data for Figure 2.
This file contains the source data used to make the graphs presented in Figure 2 and Figure 2—figure supplements 1 and 2. GraphPad Prism was utilized to visually represent the quantitative data.
- https://cdn.elifesciences.org/articles/65068/elife-65068-fig2-data1-v2.xlsx
Figure 2—figure supplement 1
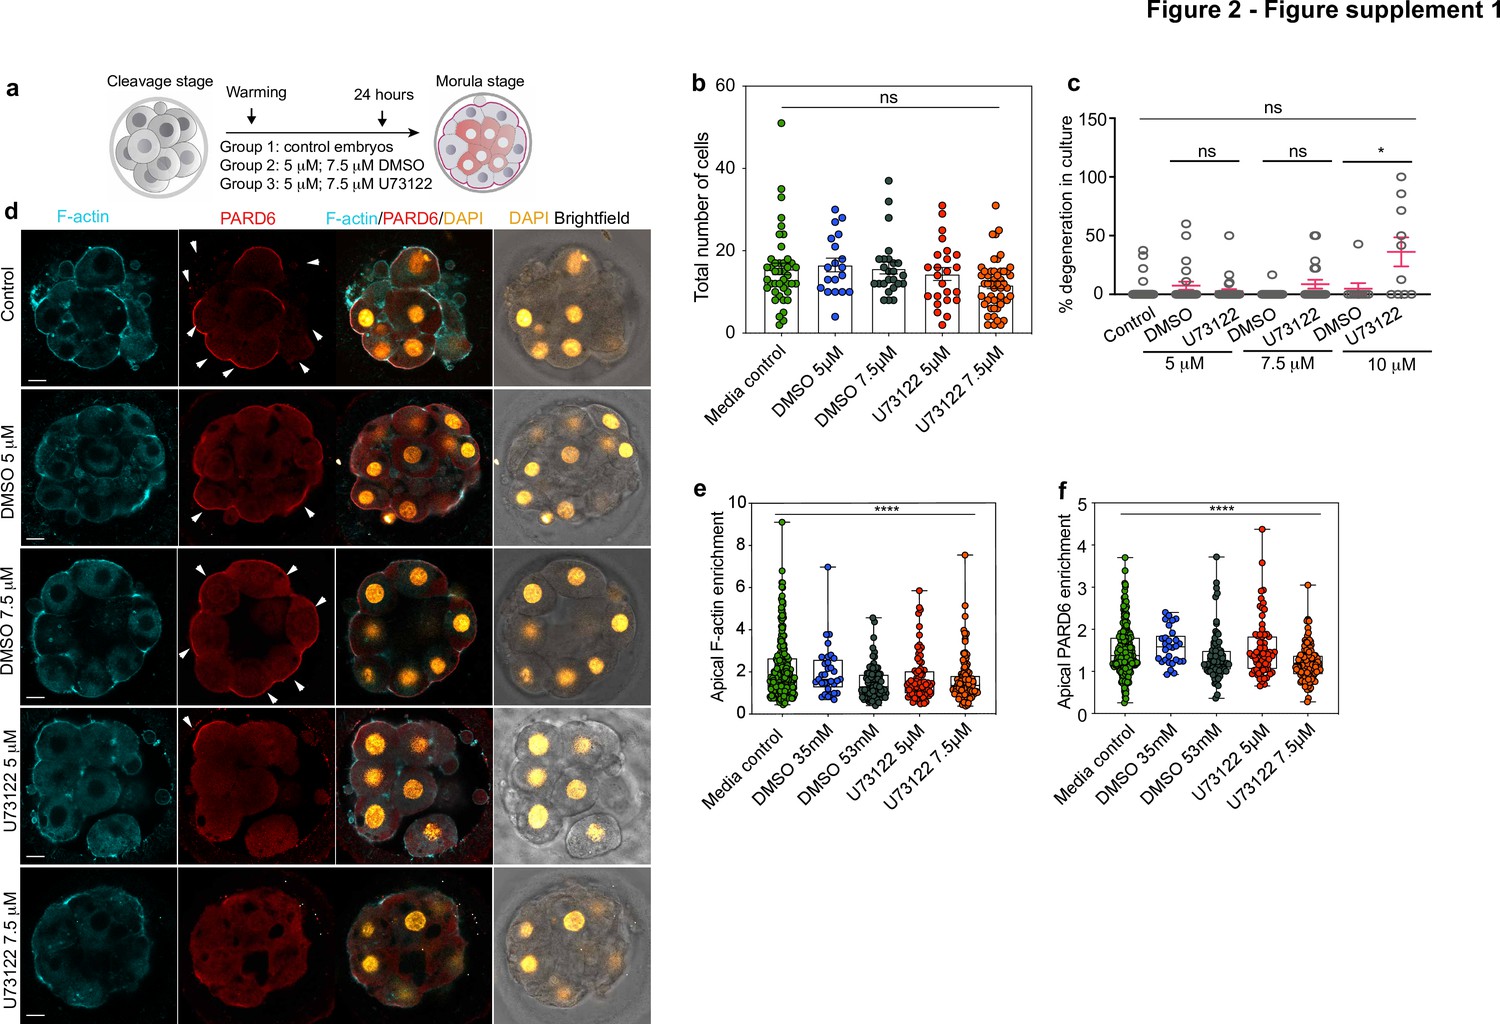
Morphokinetic analysis of the consequences of pharmacological inhibition of PLC.
(a) Scheme of the PLC inhibitor treatment. (b) Quantification of the total number of cells in embryos from panel d. Each dot represents one embryo. N = 42 embryos for media control group, N = 19 embryos for DMSO 35 mM, N = 24 embryos for DMSO 53 mM, N = 25 embryos for U73122 5 µM (35 mM DMSO) and N = 24 embryos for U73122 7.5 µM (53 mM DMSO). Data are shown as mean ± S.E.M. ns: non-significant, Kruskal-Wallis test. None of the paired comparisons were statistically significant. (c) Percentage of degenerated cells in embryos from panel d. Each dot represents an individual embryo. Data are shown as mean ± S.D. N = 66 embryos (control), N = 23 embryos (DMSO 35 mM), N = 31 embryos (U73122 5 µM (DMSO 35 mM)), N = 20 embryos (DMSO 53 mM and U73122 7.5 µM (DMSO 53 mM)), N = 9 embryos (DMSO 70 mM) and N = 10 embryos (U73122 10 µM (DMSO 70 mM)). Kruskal-Wallis test with a multiple comparisons test. *p = 0.0355, ns: non-significant. (d) Representative images of in vitro fertilized human embryos warmed at day three and cultured for 24 hr (see scheme in panel a) with or without DMSO or U73122 to reveal the localization of F-actin and PARD6. Arrowheads indicate the apical domain. (e) Quantification of apical F-actin fluorescence intensity in embryos from panel d. Each dot represents one analyzed cell. N = 218 cells for Media control; N = 32 cells for DMSO 35 mM; N = 79 cells for DMSO 53 mM, N = 72 cells for U73122 5 µM and N = 126 cells for U73122 7.5 µM. ****p < 0.001, Kruskal-Wallis test with a multiple comparisons test. Individual paired comparisons: ***p = 0.0005 (Media control vs. DMSO 53 mM and Media control vs. U73122 7.5 µM), and *p = 0.0455 (Media control vs. U73122 5 µM). The rest of the comparisons were not statistically significant. (f) Quantification of apical PARD6 fluorescence intensity in embryos from panel d. N = 213 cells for Media control; N = 29 cells for DMSO 35 mM; N = 75 cells for DMSO 53 mM, N = 68 cells for U73122 5 µM and N = 126 cells for U73122 7.5 µM. Each dot represents one analyzed cell. ****p < 0.001, Kruskal-Wallis test with a multiple comparisons test. Individual paired comparisons: ****p < 0.0001 (Media control vs U73122 7.5 μM); ***p = 0.0001 (DMSO 35 mM vs. U73122 7.5 µM), and ***p = 0.0009 (U73122 5 µM vs. U73122 7.5 µM). The rest of the comparisons were not statistically significant. Scale bars, 15 µm.
Figure 2—figure supplement 2
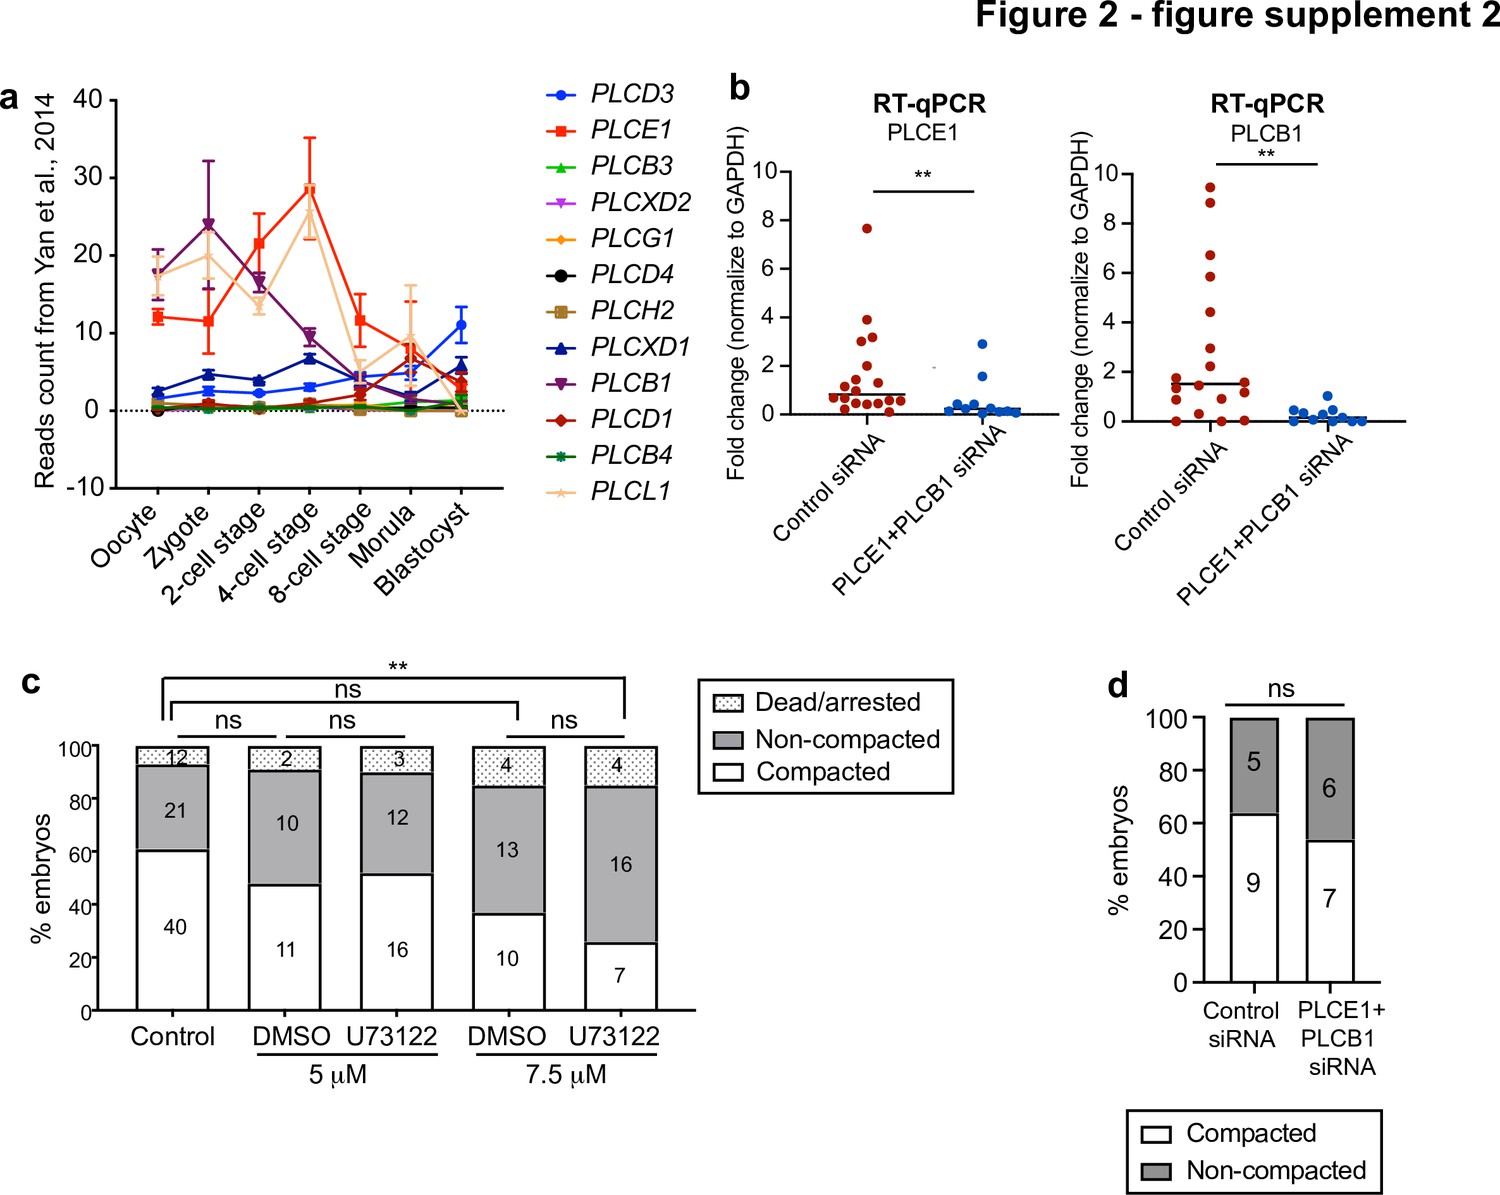
Morphokinetic analysis of PLC loss of function experiments.
(a) Expression profile for all PLC isoforms at different stages of human preimplantation development. Data retrieved from Yan et al., 2013. (b) The expression level of PLCE1 and PLCB1 in human zygotes injected with control siRNA or PLCE1+ PLCB1 siRNA assessed by RT-qPCR; Data presented as mean with individual data points. Each data point represents one biological replicate. N = 18 control siRNA embryos, N = 11 PLCE1+ PLCB1 siRNA embryos. **p = 0.0062 for PLCE1 expression, **p = 0.0014 for PLCB1 expression. Mann-Whitney test. (c) Compaction analysis in control and PLC inhibitor-treated embryos. The number of embryos per category is indicated. Ns: non-significant, **p = 0.0099, ns: non-significant, Chi-squared test. (d) Compaction analysis in control siRNA and PLCE1+ PLCB1 siRNA-injected embryos. The number of embryos per category is indicated. ns: non-significant, Chi-squared test.
Figure 3 with 1 supplement
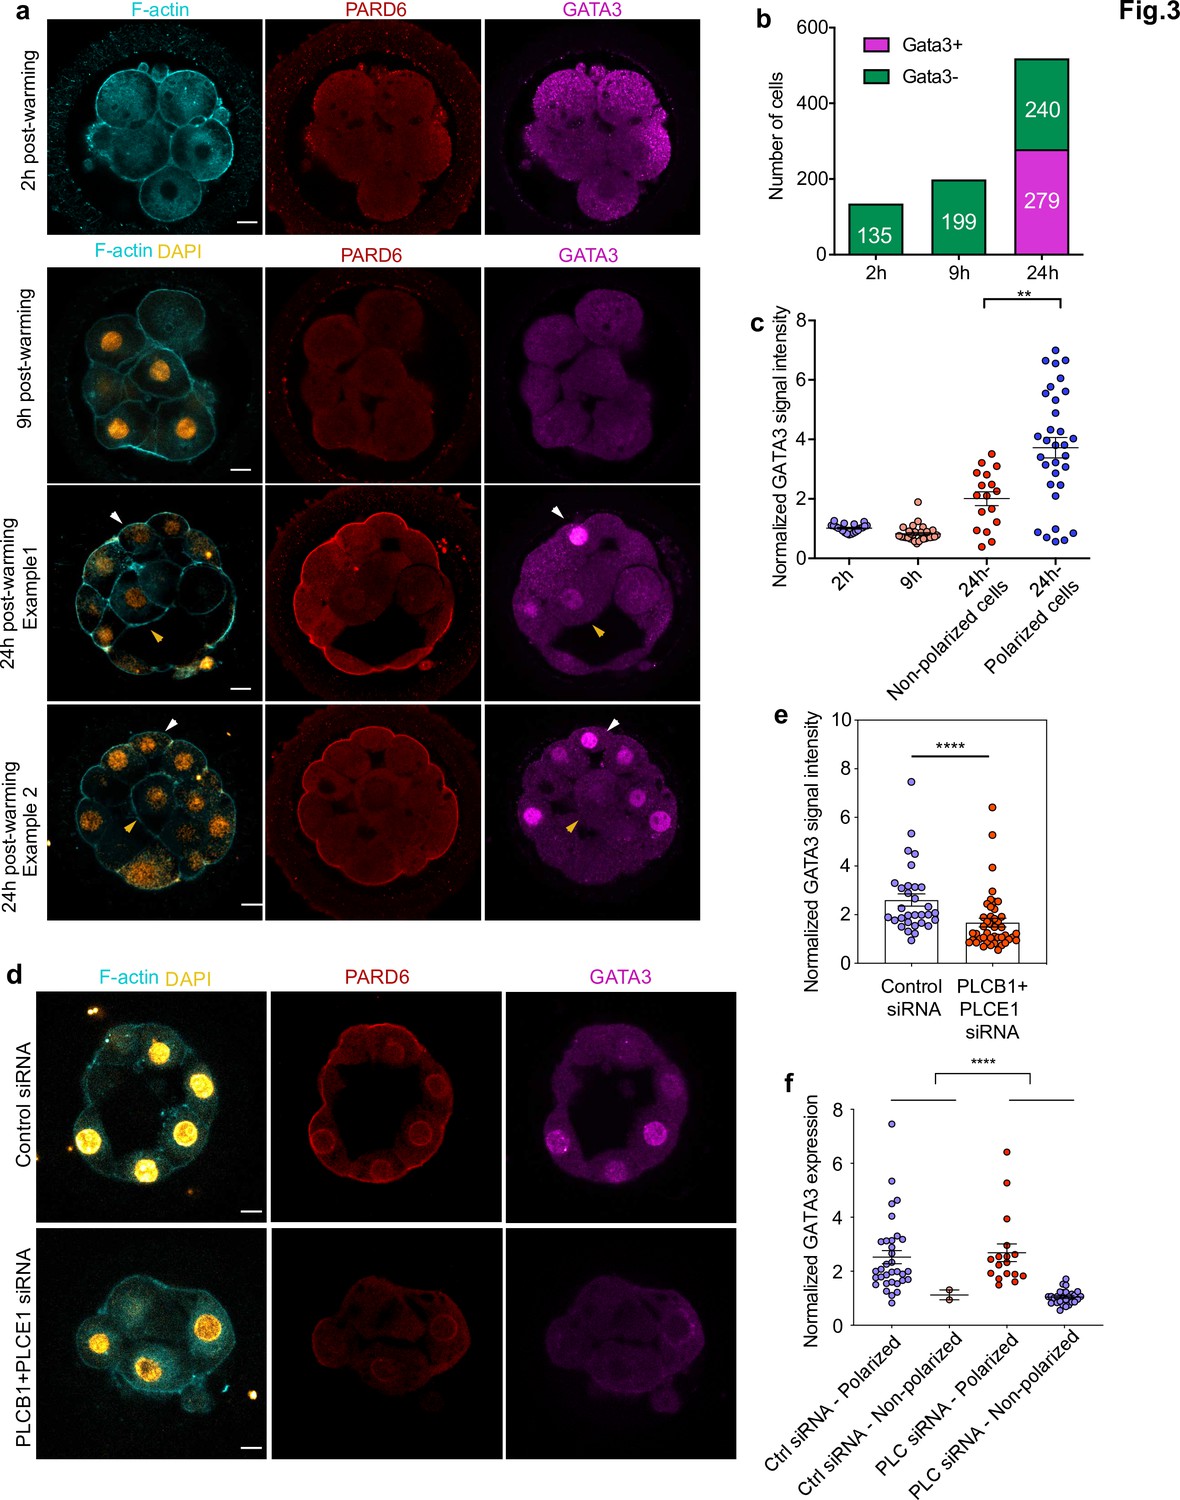
GATA3 expression is initiated independently of cell polarization.
(a) Representative images of in vitro fertilized human embryos warmed at day 3 and cultured for 2, 9, or 24 hr (see scheme in Figure 1a ) to reveal the localization of F-actin, PARD6, and GATA3. White arrowheads indicate outer cells; yellow arrowheads indicate inner cells. (b) Quantification of the number of GATA3-positive cells in embryos from panel a. Cells that have higher nuclear GATA3 signal (above a nucleus to cytoplasm ratio of 1.5) are categorized as GATA3+ cells. Numbers in each bar indicate the number of cells analyzed. ns, not significant, Fisher’s exact test. N = 17 embryos for 2 hr N = 20 embryos for 9 hr and N = 33 embryos for 24 hr. (c) Quantification of GATA3 nuclear signal in embryos from panel a. Each dot represents one cell. Data are shown as mean ± S.E.M. The GATA3 nuclear signal has been calculated as the nucleus to cytoplasmic signal ratio in each cell. N = 21 cells (2 hr), N = 32 cells (9 hr), and N = 49 cells (24 hr). **p < 0.01; two-tailed unpaired Student’s t-test. (d) Representative images of embryos injected with Control siRNA or PLCB1+ PLCE1 siRNA at the zygote stage, cultured until Day 4, and stained for F-actin, PARD6, and GATA3. (e), Quantification of GATA3 nuclear signal intensity (normalized against the cytoplasmic signal) in embryos from panel d. Each dot indicates one cell analyzed. N = 31 cells for Control siRNA group and N = 44 cells for PLCB1+ PLCE1 siRNA group. ****p < 0.0001, Mann-Whitney test. Five independent experiments (a–c) and two independent experiments (d-f). Scale bars, 15 µm. (f), Quantification of the level of nuclear GATA3 (normalized against cytoplasm signal) in embryos injected with Control siRNA or PLCB1+ PLCE1 siRNA. The data were classified according to the polarity status of the cells. Each dot indicates one cell. N = 31 cells for Control siRNA and N = 44 cells for PLCB1+ PLCE1 siRNA, ****p < 0.0001, Mann-Whitney test.
-
Figure 3—source data 1
Source data for Figure 3 and Figure 3—figure supplement 1.
This file contains the source data used to make the graphs presented in Figure 3. GraphPad Prism was utilized to visually represent the quantitative data.
- https://cdn.elifesciences.org/articles/65068/elife-65068-fig3-data1-v2.xlsx
Figure 3—figure supplement 1

Trophectoderm specification and inner cell generation in human embryos.
(a) Number of cells showing nuclear GATA3 (defined as a nucleus to cytoplasm ratio of more than 1.5) in relation to their polarity status in human embryos at embryonic day 4. Numbers in each bar indicate the number of cells analyzed. N = 13 embryos. (b) Human embryos at embryonic day 4 immunostained for YAP1, PARD6, and DAPI. White arrows indicate outer cells, yellow arrows indicate inner cells. (c) Quantification of the nucleus to cytoplasm ratio of YAP1 in embryos from panel b. Each dot represents a cell. N = 22 polarized cells and N = 18 unpolarized cells from four embryos. ****p < 0.0001, Mann-Whitney test. (d) Representative images of embryos treated with different concentrations of U73122, cultured from day 3 to day 4 and stained for F-actin, PARD6, and GATA3. (e) Quantification of GATA3 nuclear signal intensity (normalized against the cytoplasmic signal) in embryos from panel d. N = 142 cells for Media control; N = 37 cells for DMSO 35 mM; N = 84 cells for DMSO 53 mM, N = 56 cells for U73122 5 µM (35 mM DMSO) and N = 90 for U73122 7.5 µM (53 mM DMSO). Each dot represents one cell analyzed. ns: non-significant. **** p < 0.0001, Kruskal-Wallis test with a multiple comparisons test. Individual paired comparisons: ****p < 0.0001 (Media control vs. U73122 7.5 µM, DMSO 53 mM vs. U73122 7.5 µM, and U73122 5 µM vs. U73122 7.5 µM), and *p = 0.0227 (Mediacontrol vs. DMSO 35 mM). The rest of the comparisons were not statistically significant. Scale bars, 15 µm.
Figure 4
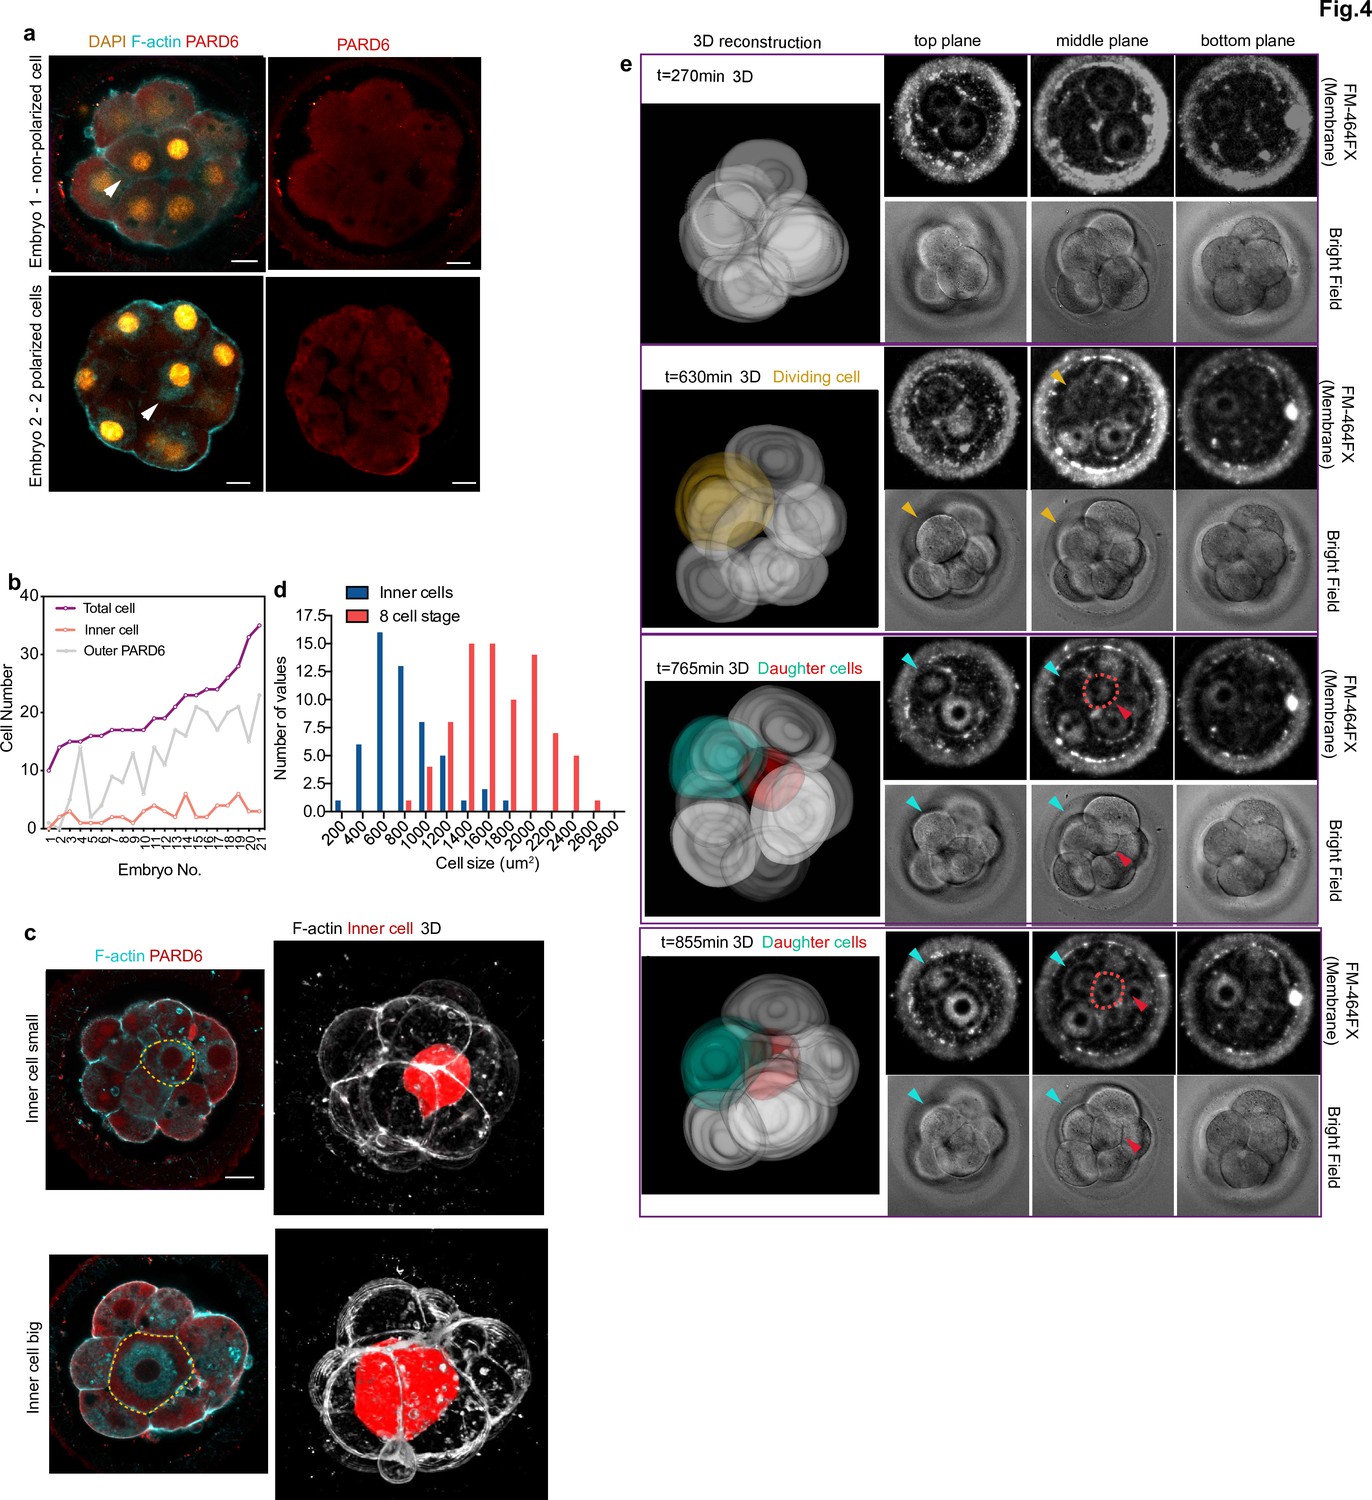
Generation of inner cells in the human embryo.
(a) Representative images of embryos that have inner cells with a low number of outer polarized cells. White arrowheads indicate the presence of inner cells. (b) Line chart showing the relation between the number of inner cells, the number of PARD6 positive cells, and the total cell number in embryos that have inner cells. (c) Representative images of embryos showing inner cells of different sizes. Dotted lines indicate the outline of the inner cells. (d) Quantification of the distribution of the size of inner cells in comparison with the size of 8 cell stage blastomeres. N = 53 inner cells from 21 embryos; and N = 80, eight-cell stage blastomeres from 10 embryos. (e) Time-lapse imaging of cell position during human embryo compaction. After a cell division, one of the two daughter cells was positioned to the inside of the embryo. The dividing cell is labeled in yellow, and the two daughter cells are colored in green and red. Red dotted lines indicate the red cell shown in 3D reconstruction. The red cell becomes localized to the inside. Scale bars, 15 µm.
-
Figure 4—source data 1
Source data for Figure 4.
This file contains the source data used to make the graphs presented in Figure 4. GraphPad Prism was utilized to visually represent the quantitative data.
- https://cdn.elifesciences.org/articles/65068/elife-65068-fig4-data1-v2.xlsx
Figure 5
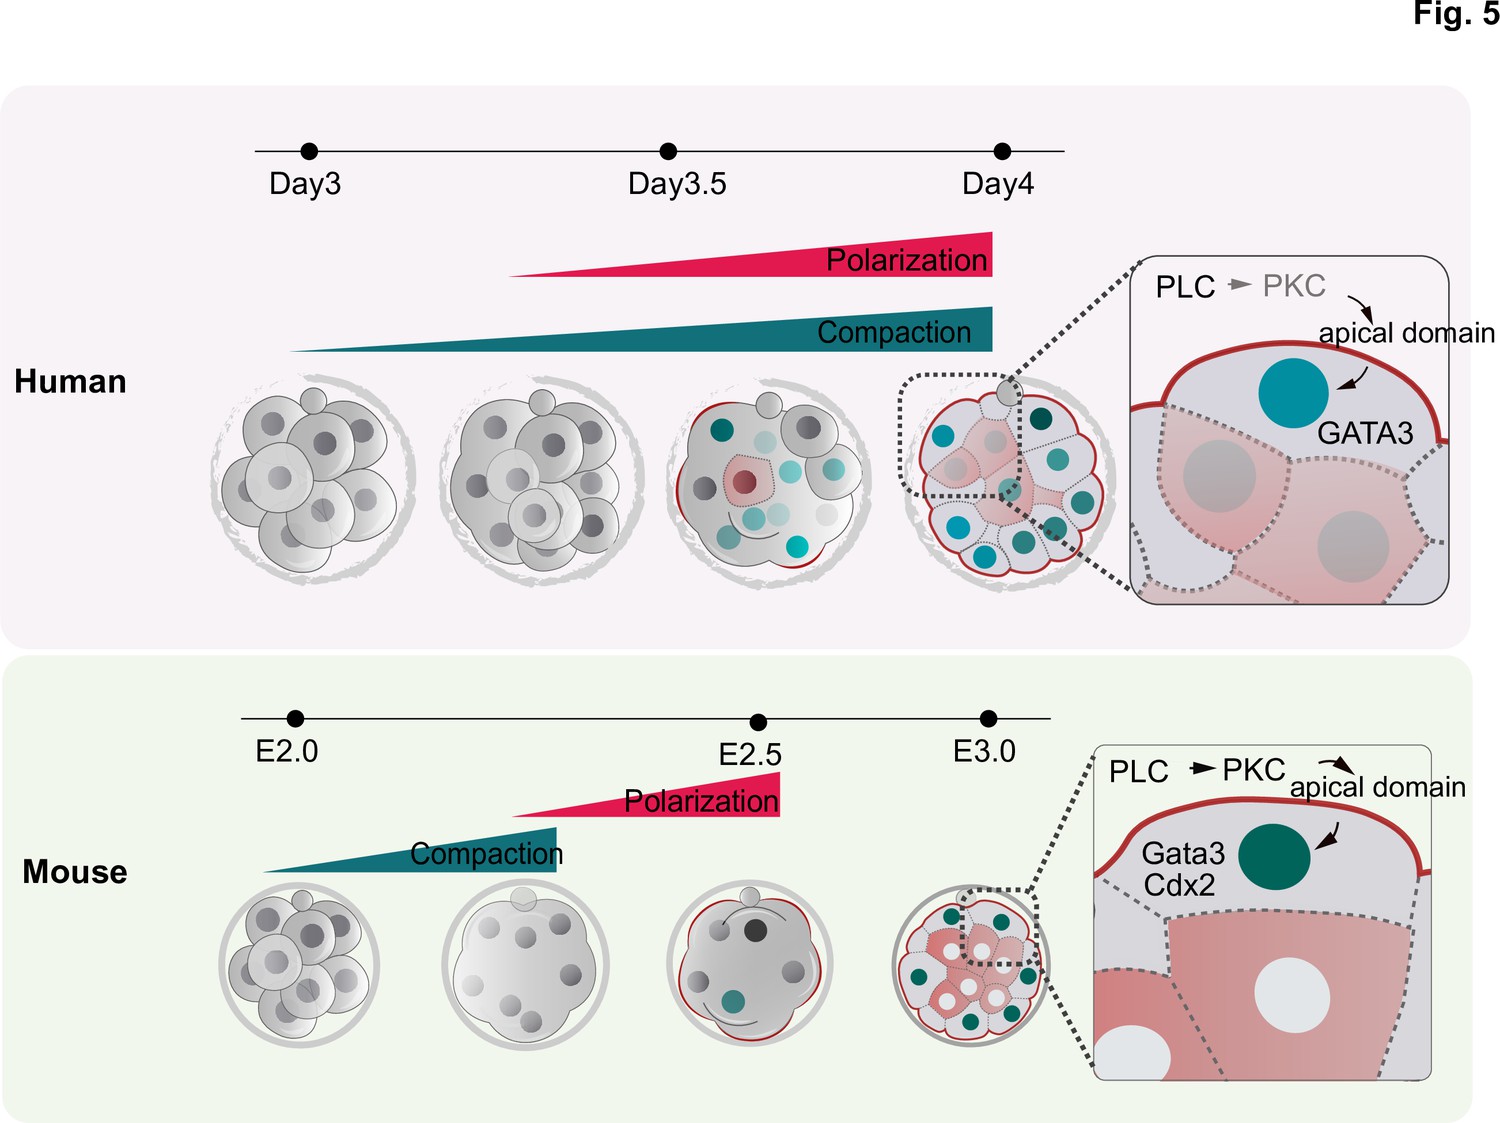
Schematic summarizing the main findings of this study.
F-actin polarization precedes PAR complex polarization and it is triggered by PLC activation in mouse and human embryos. In human embryos, blastomeres initiate the expression of TE factors independently of the polarity machinery, but polarization reinforces a TE fate. In contrast to mouse embryos, in which inner cell generation takes place only once all blastomeres become polarized, inner cells can be observed in human embryos that are not fully polarized, indicating mechanistic differences in the first lineage decision between the two species.
Author response image 1
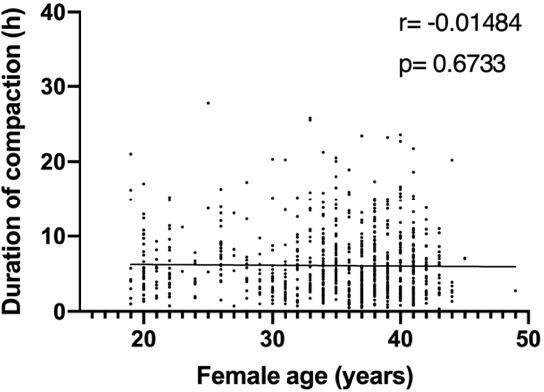
Correlation analysis of the variables ‘duration of compaction’ and ‘female age’ in a validation dataset comprising 810 embryos.
Duration of compaction was defined as the time in hours between the start of compaction and morula formation. r: pearson correlation coefficient; p: p-value. No correlation was found between both variables..
Tables
Key resources table
| Reagent type (species) or resource | Designation | Source or reference | Identifiers | Additional information |
| Sequenced-based reagent | siRNA to PLCE1 and PLCB1 | Qiagen | Hs_PLCB1_4, SI00115521; Hs_PLCB1_6, SI02781184Hs_PLCE1_1, SI00115521; negative control siRNA:1022076. | A 20 μM concentration of siRNA solution was used for injection. |
| Biological sample (Human) | Human embryos | Donated supernumerary embryos generated from in vitro fertilization experiments | ||
| Antibody | (Rabbit monoclonal), anti-PARD6 | Santa Cruz | sc-67393 | (1:200) |
| Antibody | (Goat polyclona)l, anti-GATA3 | R&D systems | AF2605 | (1:200) |
| Antibody | (Mouse monoclonal), anti-aPKC | Santa Cruz | sc-17781 | (1:50) |
| Antibody | (Mouse monoclonal), anti-YAP1 | Santa Cruz | sc-101199 | (1:200) |
| Recombinant DNA reagent | pRN3P- GAP-GFP | Zhu et al., 2017 | ||
| Sequence-based reagent | GAPDH-F | This paper | qPCR primers | GATCATCAGCAATGCCTCCT |
| Sequence-based reagent | GAPDH-R | This paper | qPCR primers | TTCAGCTCAGGGATGACCTT |
| Sequence-based reagent | PLCB1-F | This paper | qPCR primers | GGAAGCGGCAAAAAGAAGCTC |
| Sequence-based reagent | PLCB1-R | This paper | qPCR primers | CGTCGTCGTCACTTTCCGT |
| Sequence-based reagent | PLCE1-F | This paper | qPCR primers | TGCAGCCTCTCATCCAGTT |
| Sequence-based reagent | PLCE1-R | This paper | qPCR primers | CCCTGCGGTAAATAGTCTGC |
| Commercial assay or kit | SMART-Seq v4 Ultra Low Input RNA Kit | Takara | Cat. No. 634,888 | |
| Commercial assay or kit | Agencourt AMPure XP Kit | Beckman Coulter | A63880 | |
| Chemical compound, drug | U73122 | Caymanchem | No. 70,740 | |
| Chemical compound, drug | DMSO | Sigma-Alrich | D2650−5 × 10 ML | |
| Software, algorithm | Prism 8 | Graphpad |
Additional files
Download links
A two-part list of links to download the article, or parts of the article, in various formats.
Downloads (link to download the article as PDF)
Open citations (links to open the citations from this article in various online reference manager services)
Cite this article (links to download the citations from this article in formats compatible with various reference manager tools)
Human embryo polarization requires PLC signaling to mediate trophectoderm specification
eLife 10:e65068.
https://doi.org/10.7554/eLife.65068


