Integrating taxonomic, functional, and strain-level profiling of diverse microbial communities with bioBakery 3
- Department CIBIO, University of Trento, Italy
- Harvard T.H. Chan School of Public Health, United States
- The Broad Institute of MIT and Harvard, United States
- Department of Food Quality and Nutrition, Research and Innovation Center, Edmund Mach Foundation, Italy
- IEO, European Institute of Oncology IRCCS, Italy
Figures
Figure 1 with 5 supplements

bioBakery 3 includes new microbial community profiling approaches that outperform previous versions and current methods.
(A) The newly developed ChocoPhlAn 3 consolidates, quality controls, and annotates isolate-derived reference sequences to enable metagenomic profiling in subsequent bioBakery methods. (*The 1.1M MetaPhlAn 3 markers also encompass 61.8 k viral markers from MetaPhlAn 2 Truong et al., 2015) (B) MetaPhlAn 3 was applied to a set of 113 total evaluation datasets provided by CAMI (Fritz et al., 2019) representing diverse human-associated microbiomes and five datasets of non-human-associated microbiomes (Supplementary file 1). MetaPhlAn 3 showed increased performance compared with the previous version MetaPhlAn 2 (Truong et al., 2015), mOTUs2 (Milanese et al., 2019), and Bracken 2.5 (Lu et al., 2017). We report here the F1 scores (harmonic mean of the species-level precision and recall, see Figure 1—figure supplement 1 for other evaluation scores). (C) MetaPhlAn 3 better recapitulates relative abundance profiles both from human and murine gastrointestinal metagenomes as well from non-human-associated communities compared to the other currently available tools (full results in Figure 1—figure supplement 1). Bracken is reported both using its original estimates based on the fraction of reads assigned to each taxon and after re-normalizing them using the genome lengths of the taxa in the gold standard to match the taxa abundance estimate of the other tools. (D) Compared with HUMAnN 2 (Franzosa et al., 2018) and Carnelian (Nazeen et al., 2020), HUMAnN 3 produces more accurate estimates of EC abundances and displays a higher species true positive rate compared to HUMAnN 2. In panels B–D, an asterisk ('*') indicates that the bioBakery 3 method (MetaPhlAn 3 or HUMAnN 3) scored significantly better than all other methods (repeated paired t-tests over synthetic metagenomes, two-tailed p<0.05).
Figure 1—figure supplement 1
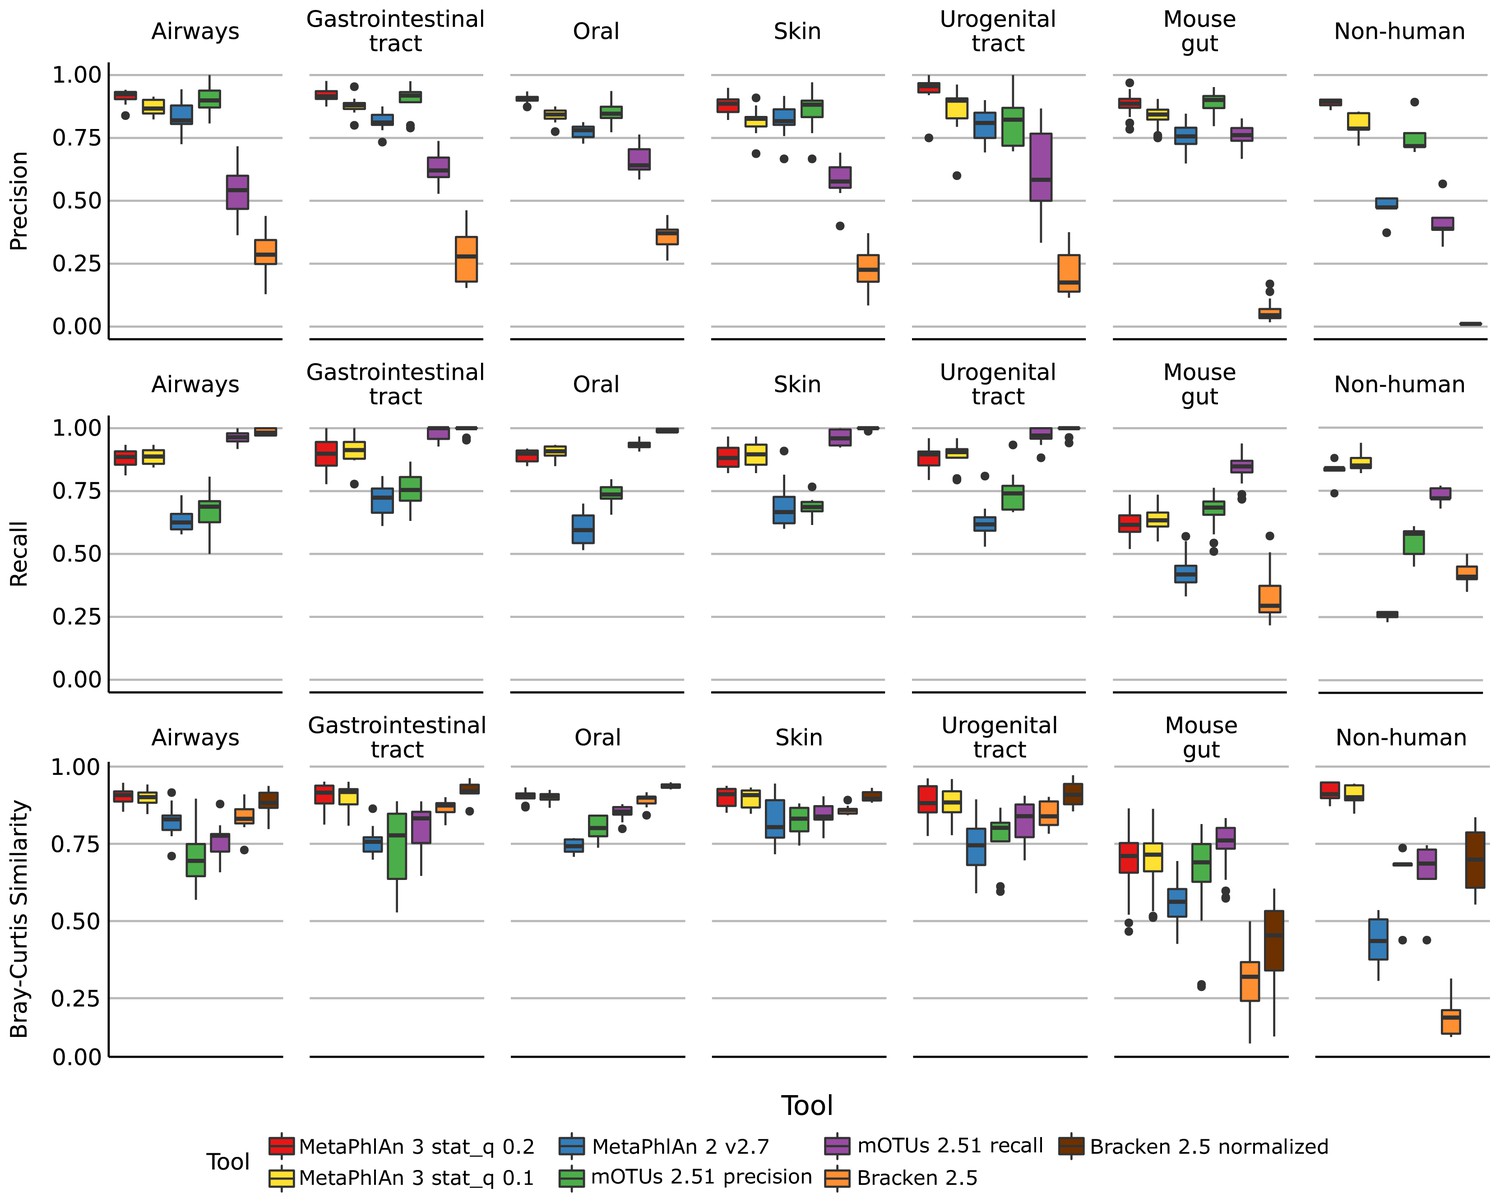
Performance metrics (Precision, Recall, Bray-Curtis similarity) of MetaPhlAn 3, MetaPhlAn2, mOTU, and Bracken species-level profiling of the CAMI human-associated, CAMI mouse gut, and non-human datasets.
Bray-Curtis similarity index is calculated on arcsine-square-root transformed relative abundances.
Figure 1—figure supplement 2
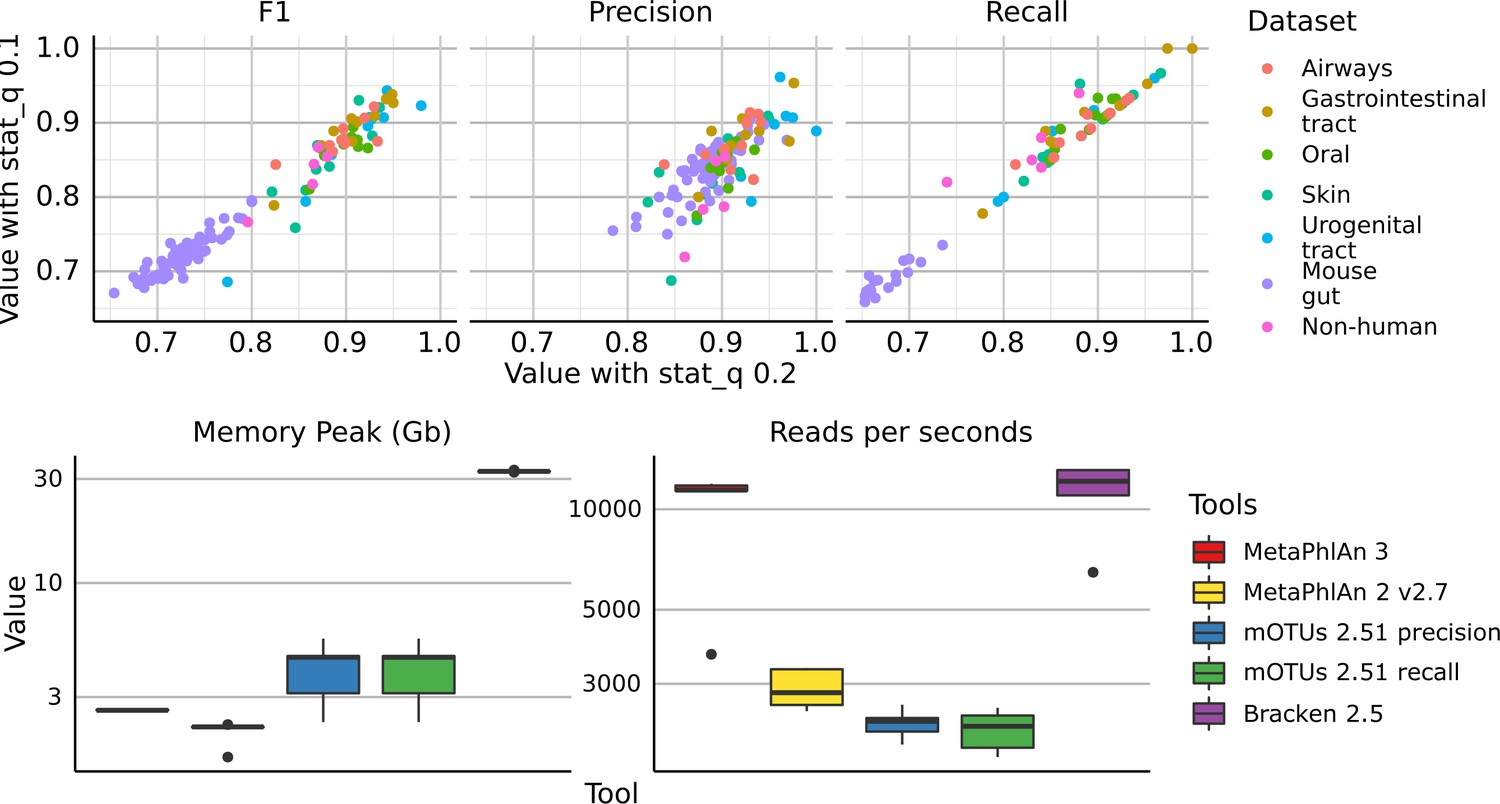
(top) Scatter plots of precision, recall, and F1 score, of all the synthetic metagenomes profiled with MetaPhlAn 3 using stat_q = 0.2 (default value for MetaPhlAn 3) and stat_q = 0.1 (rho = 0.97).
(bottom) Comparison of memory usage (maxRSS) and speed of taxonomic profilers included in the evaluation. Each tool was run on 5 HMP metagenomes using one thread.
Figure 1—figure supplement 3
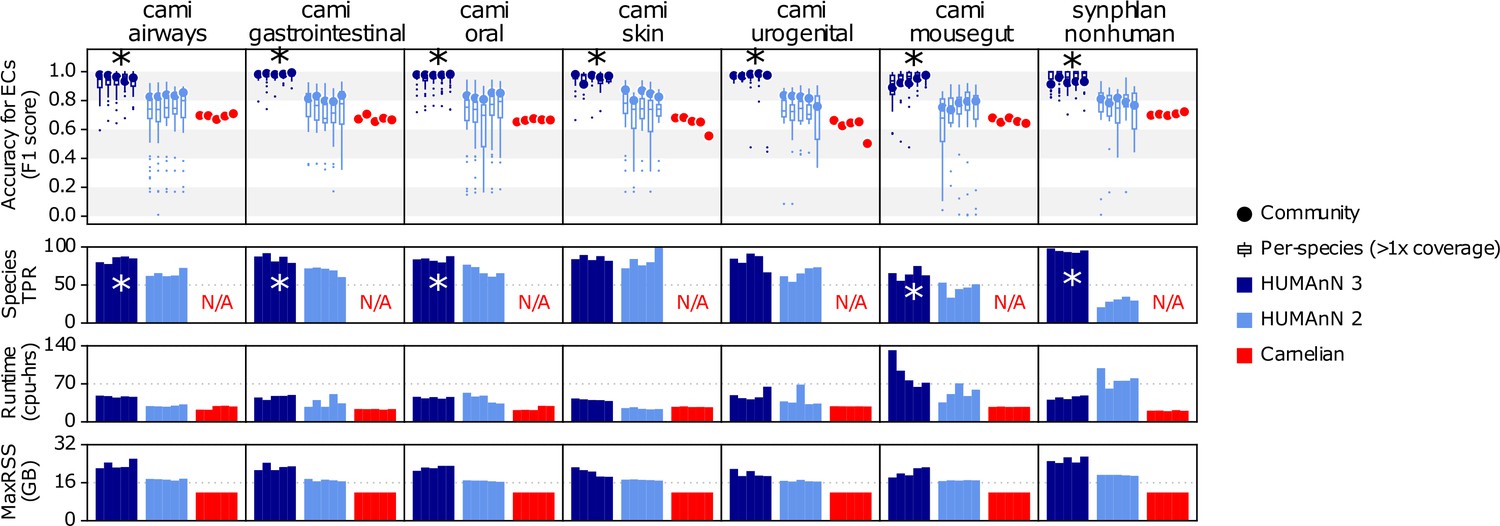
This figure expands Figure 1D from the main text to further compare HUMAnN 3, HUMAnN 2, and Carnelian on the basis of F1 score for accuracy of enzyme commission (EC) family detection, runtime (cpu-hrs), and peak memory usage (MaxRSS).
'*' values indicate that HUMAnN 3’s F1 and species TPR scores were significantly higher than those of the other methods (between-method paired t-tests, all p-values<0.05).
Figure 1—figure supplement 4
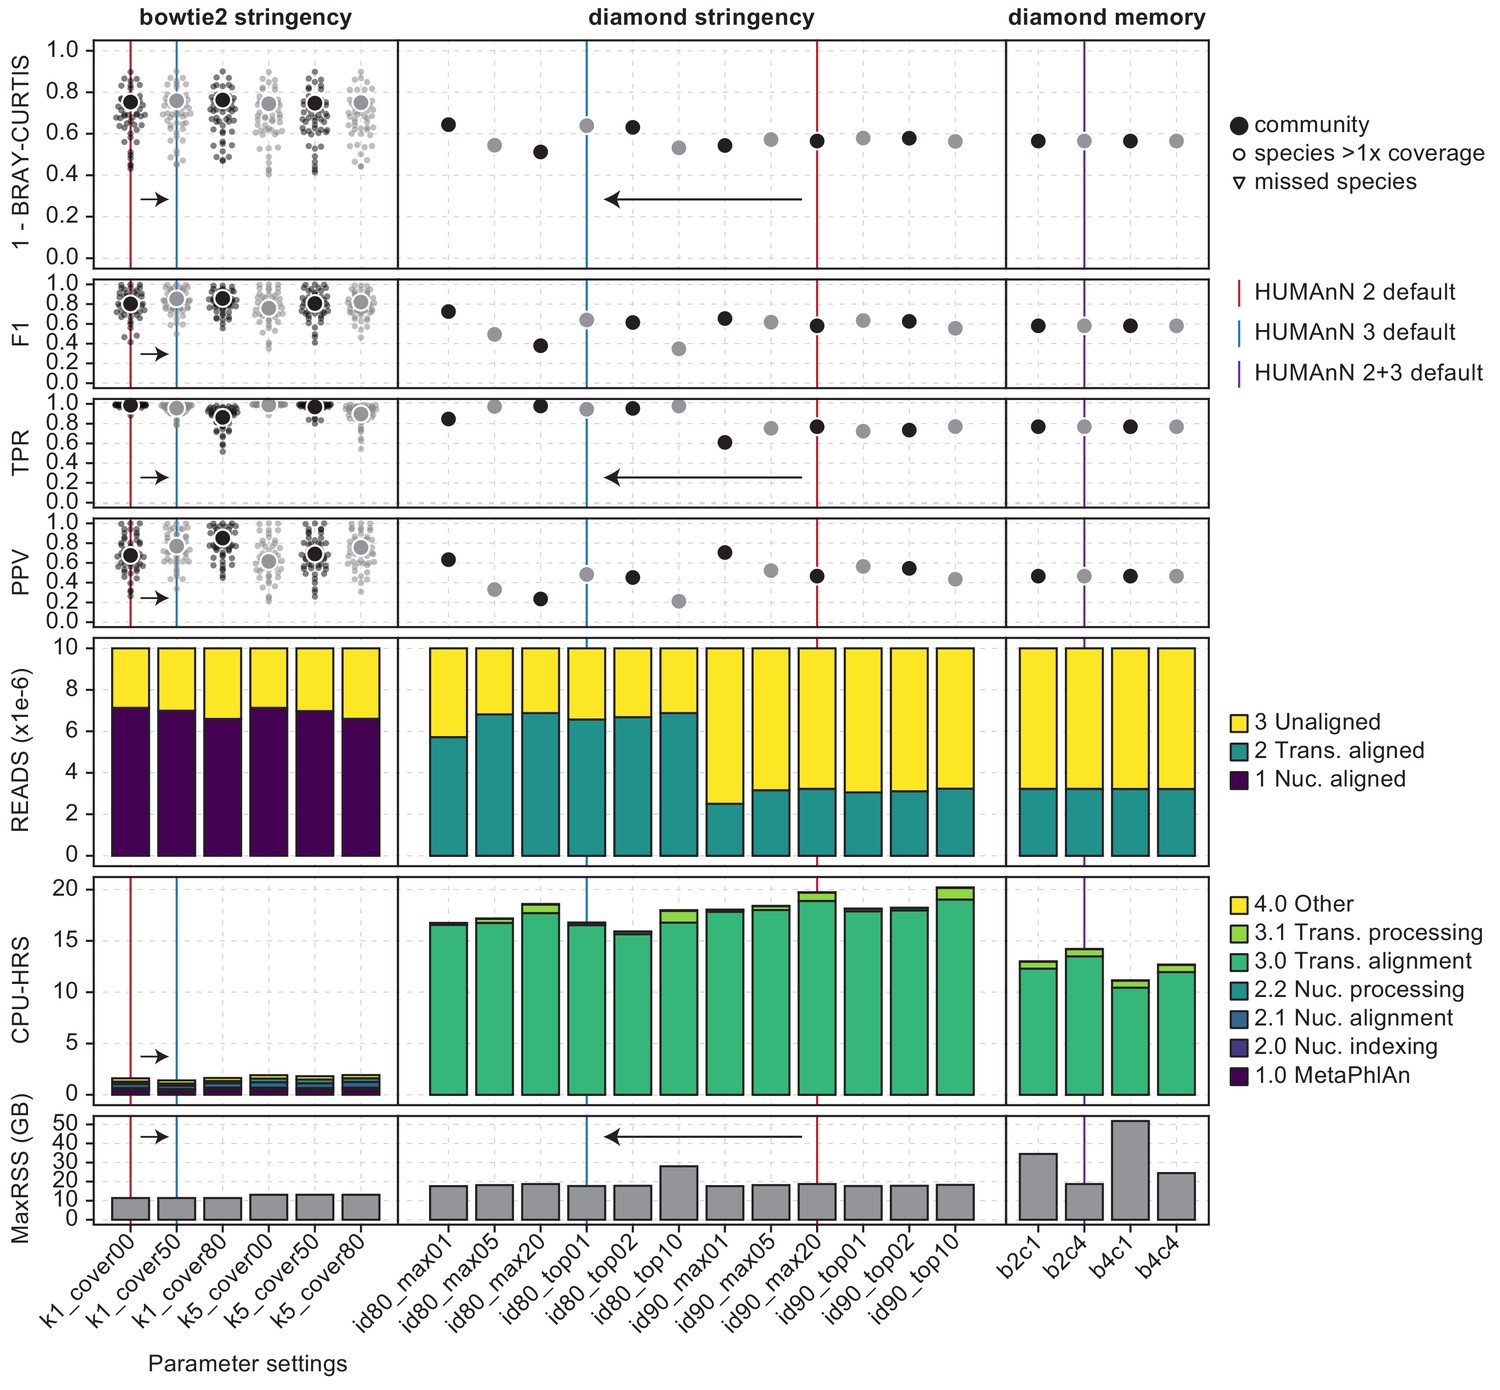
Re-optimization of HUMAnN 3 based on the synphlan-humanoid metagenome and UniRef90 gold standard.
HUMAnN’s accuracy and performance using v2 settings on v3 databases are highlighted with red vertical lines; changes in v3 are highlighted with blue lines. Bowtie two settings were evaluated in ‘--bypass-translated-search’ mode and DIAMOND settings were evaluated in ‘--bypass-nucleotide-search’ mode. Left column: We compared accuracy and performance requesting 1 vs. 5 hits from Bowtie two and performing post hoc filtering of target sequences requiring 0% (i.e. no filtering), 50%, and 80% of sites to be hit. HUMAnN 3 adopts the 50% coverage filter while continuing to request a single hit per read. Center column: We compared a variety of DIAMOND stringency filters during translated search. HUMAnN 3 adopts a relaxed percent identity threshold per hit compared with v2 (80 vs. 90%) but considers fewer suboptimal hits (those within 1% bit score vs. the top 20). Right column: We evaluated different memory utilization settings in DIAMOND, but maintained the DIAMOND defaults (‘-b 2 c 4’) between v2 and v3.
Figure 1—figure supplement 5
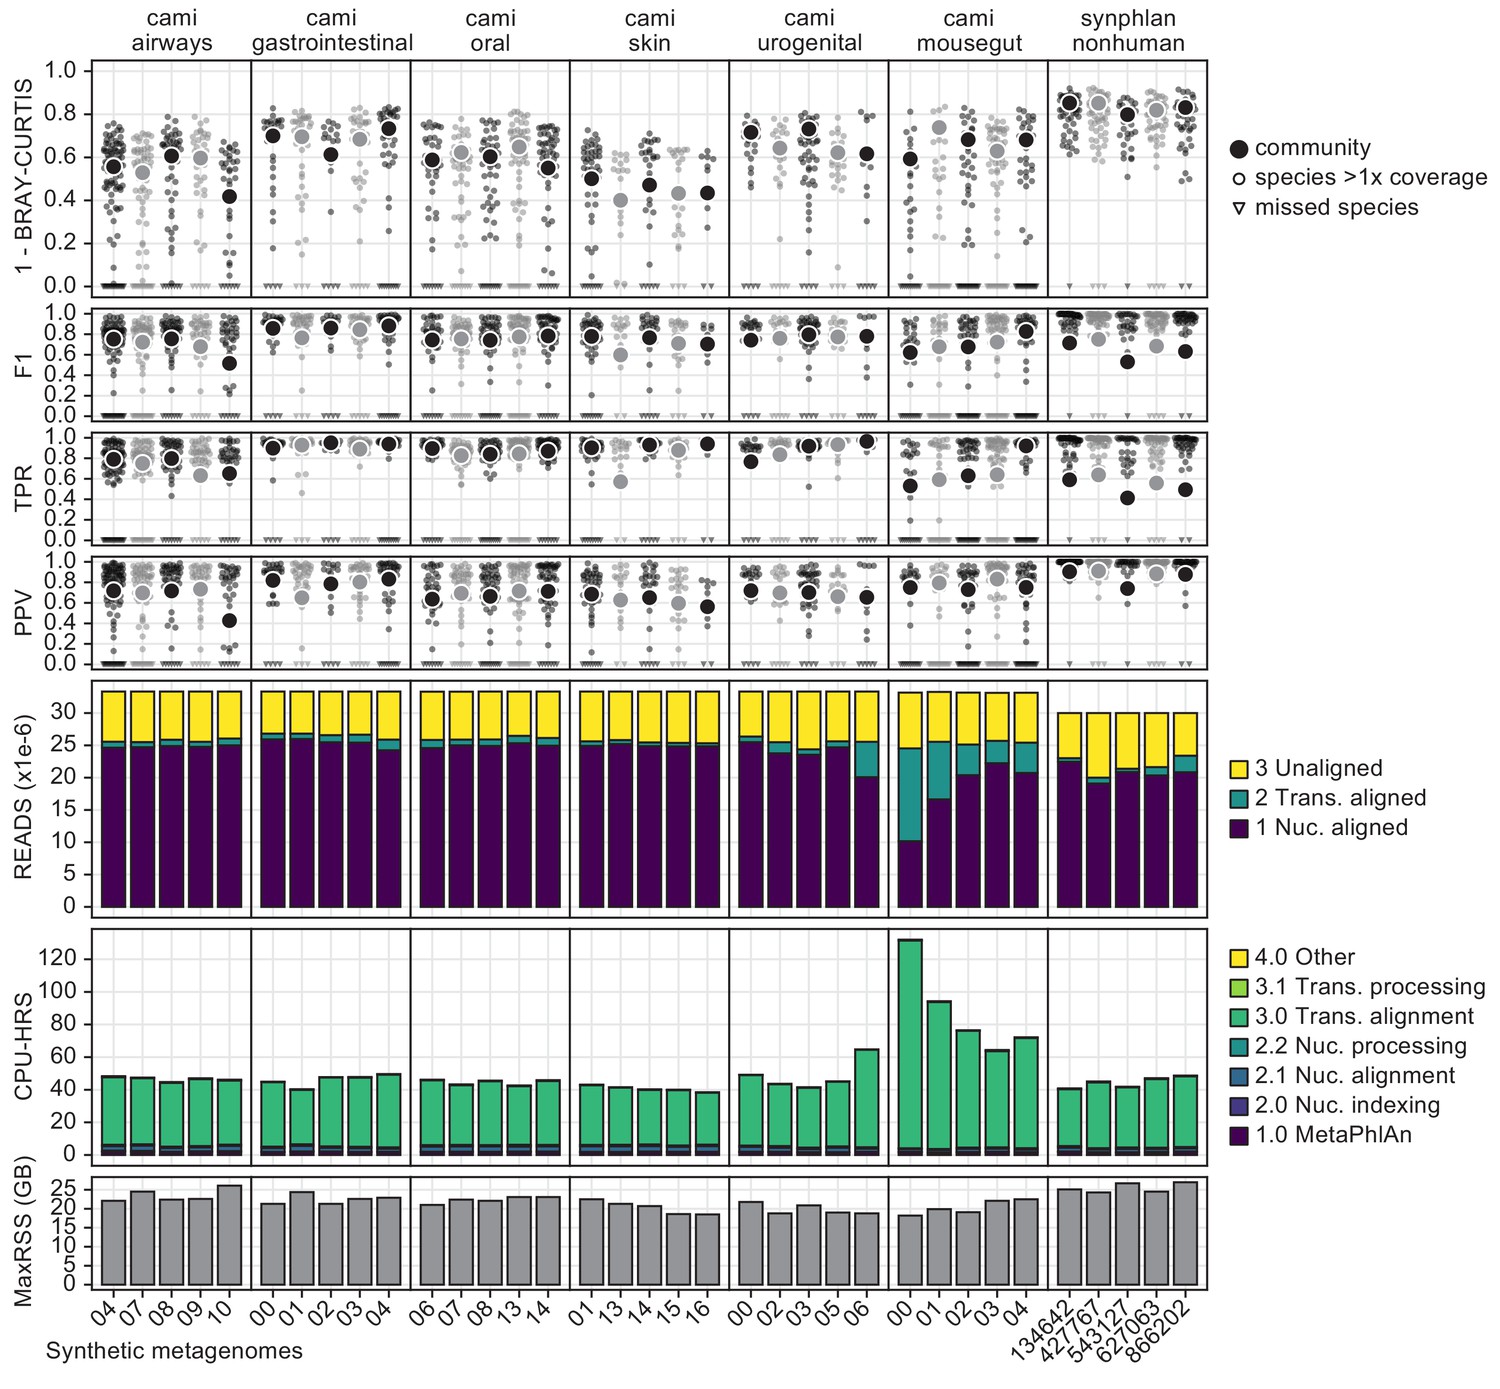
This figure provides a high-resolution view of HUMAnN 3’s performance in the evaluations of main-text Figure 1D (accuracy and performance on CAMI and non-human-associated metagenomes).
The top four rows (1 - BC, F1, TPR, and PPV) detail measures of accuracy for UniRef90-level protein families at the community (large dot) and well-covered-species (small dots) levels. The ‘READS’ row indicates the stage of HUMAnN 3’s tiered search where sample reads were aligned; ~75% of most samples’ reads were explained, with the vast majority of the reads assigned by known pangenomes outside of the CAMI mousegut samples (which relied more heavily on translated search for explanations). The ‘CPU-HRS’ row indicates the time spent in various phases of HUMAnN 3’s tiered search, with the translated search step dominating overall runtime. The MaxRSS row indicates the peak memory usage (in GBs) for each sample, and was consistently in the 20–25 GB range.
Figure 2 with 5 supplements
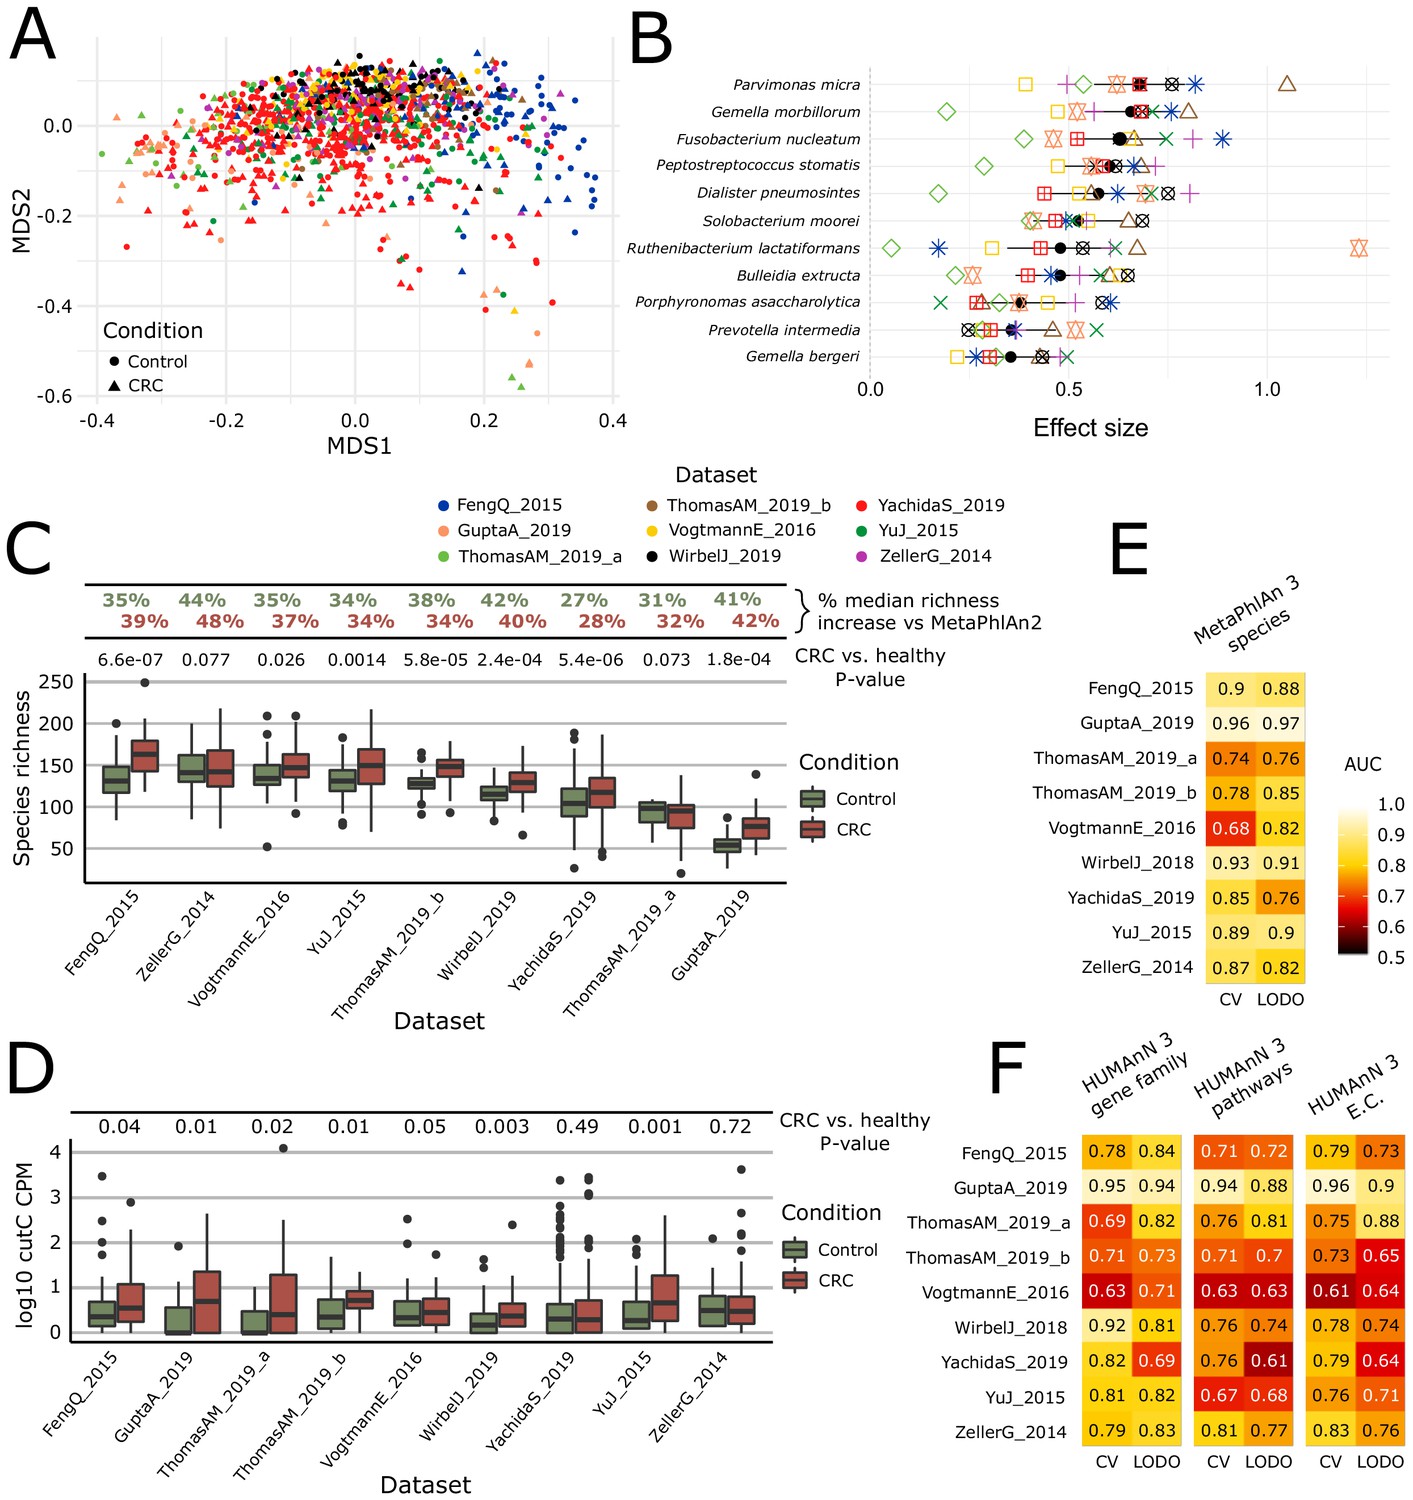
Meta-analysis with MetaPhlAn 3 and HUMAnN 3 expands taxonomic and functional associations with the CRC microbiome.
(A) We considered a total of nine independent datasets (1262 total samples) that highly but not completely overlap (PERMANOVA p=0.001 for each single dataset when compared to all the other together; between-datasets R2 = 0.14; within-dataset R2 = 0.86) in composition based on ordination (multidimensional scaling) of weighted UniFrac distances (Lozupone and Knight, 2005) computed from the MetaPhlAn 3 species relative abundances. (B) Meta-analysis based on standardized mean differences and a random effects model yielded 11 MetaPhlAn 3 species significantly (Wilcoxon rank-sum test FDR p<0.05) associated with colorectal cancer at effect size >0.35 (see Materials and methods). (C) Species richness is significantly higher in CRC samples compared to control (Wilcoxon rank-sum test on species richness in healthy versus CRC p<0.05 in 7/9 datasets), and the expanded MetaPhlAn 3 species catalog detects more species compared to MetaPhlAn 2 (CRC mean median increase 37.1%, controls mean median increase 36.3%). (D) Distribution of cutC gene relative abundance (log10 count-per-million normalized) from HUMAnN 3 gene family profiles supporting the potential link between choline metabolism and CRC (Thomas et al., 2019). (E) Random forest (RF) classification using MetaPhlAn 3 features and HUMAnN 3 features (F) confirms that CRC patients can be predicted at (treatment-naive) baseline from the composition of their gut microbiome with performances reaching ~0.85 in cross-validated (CV) or leave-one-dataset-out (LODO) ROC AUC (see Materials and methods).
Figure 2—figure supplement 1

Log-transformed relative abundances of the top 20 MetaPhlAn 3 species associated with colorectal cancer (A) and top 10 most abundant species (B) identified with a meta-analysis on 1262 samples.
Figure 2—figure supplement 2
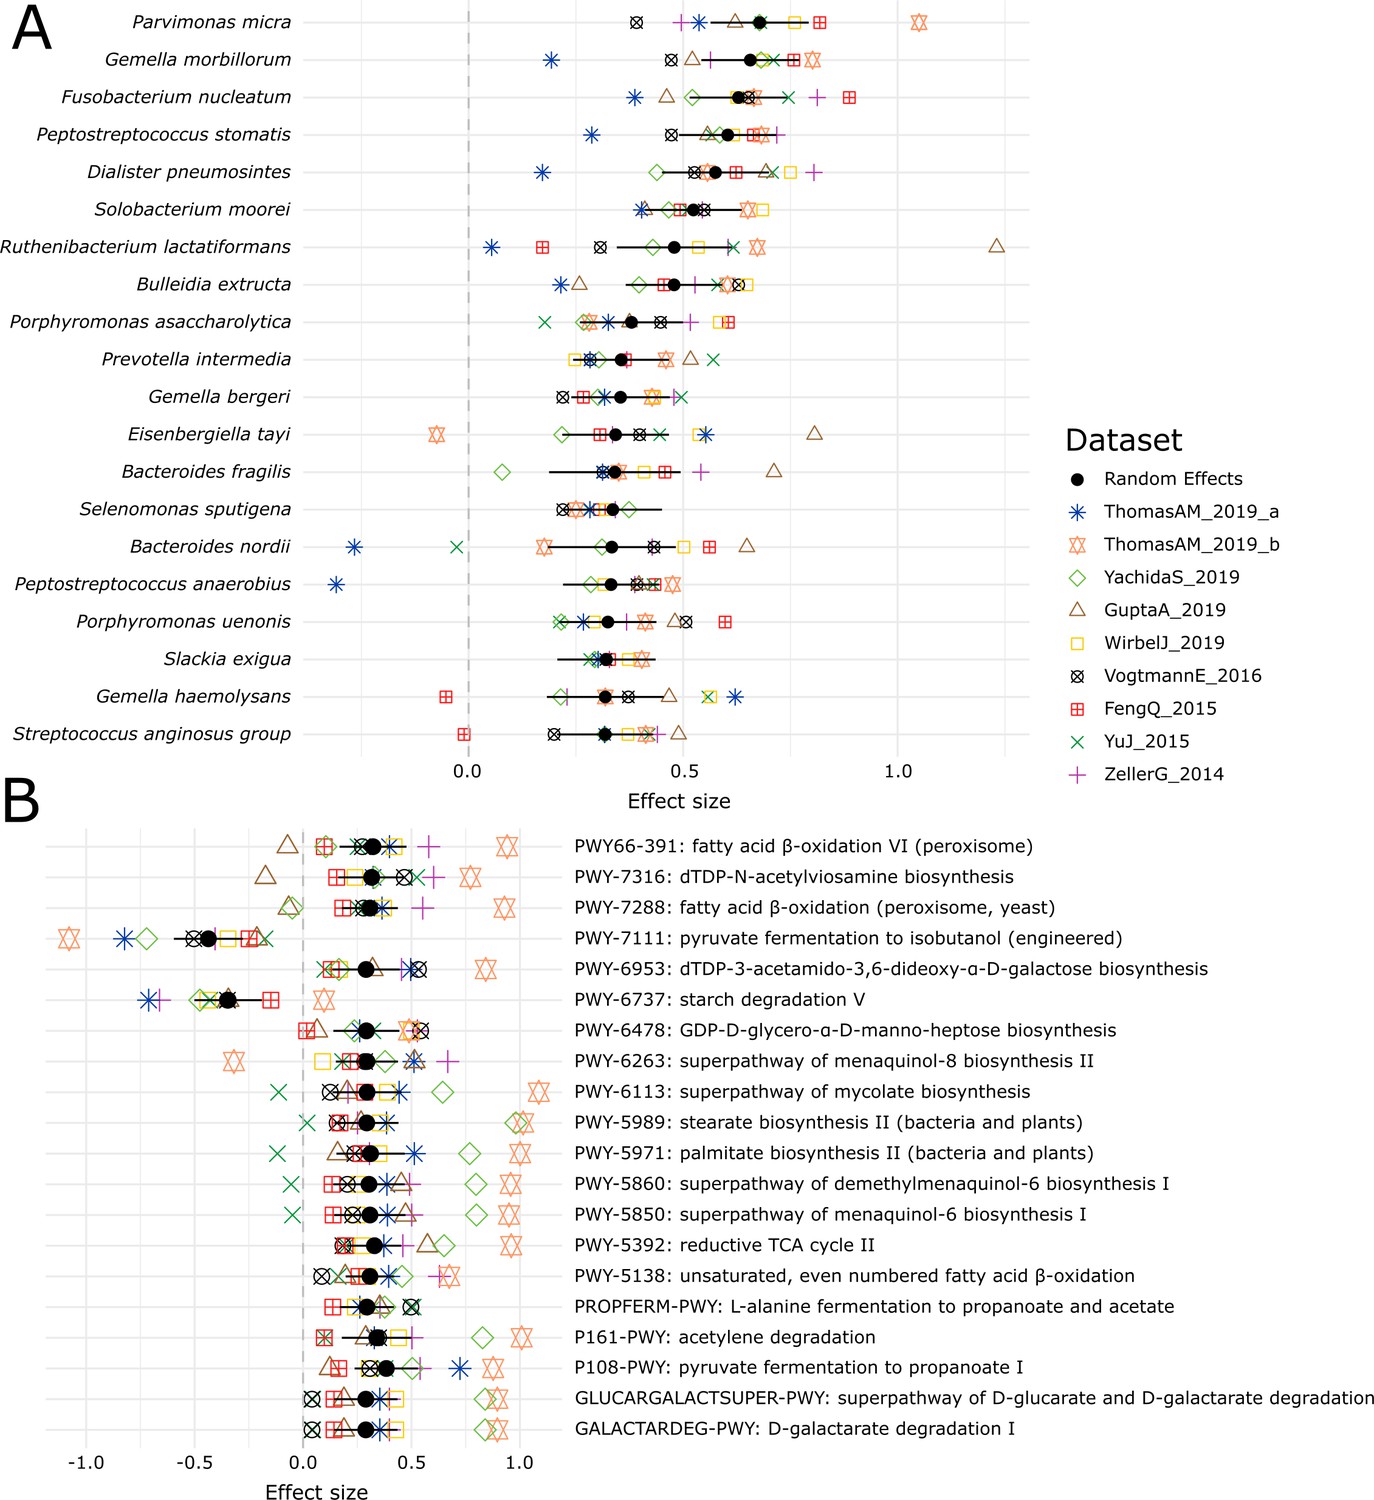
Meta-analysis of the CRC datasets on the MetaPhlAn 3 species-level relative abundances (A) and relative abundance of MetaCyc pathway profiles generated with HUMAnN 3 (B).
Figure 2—figure supplement 3

Forest plot reporting effect sizes calculated using a meta-analysis of standardized mean differences and a random effects model on cutC (A) and yeaW (B) relative abundances between CRC and control samples.
Figure 2—figure supplement 4
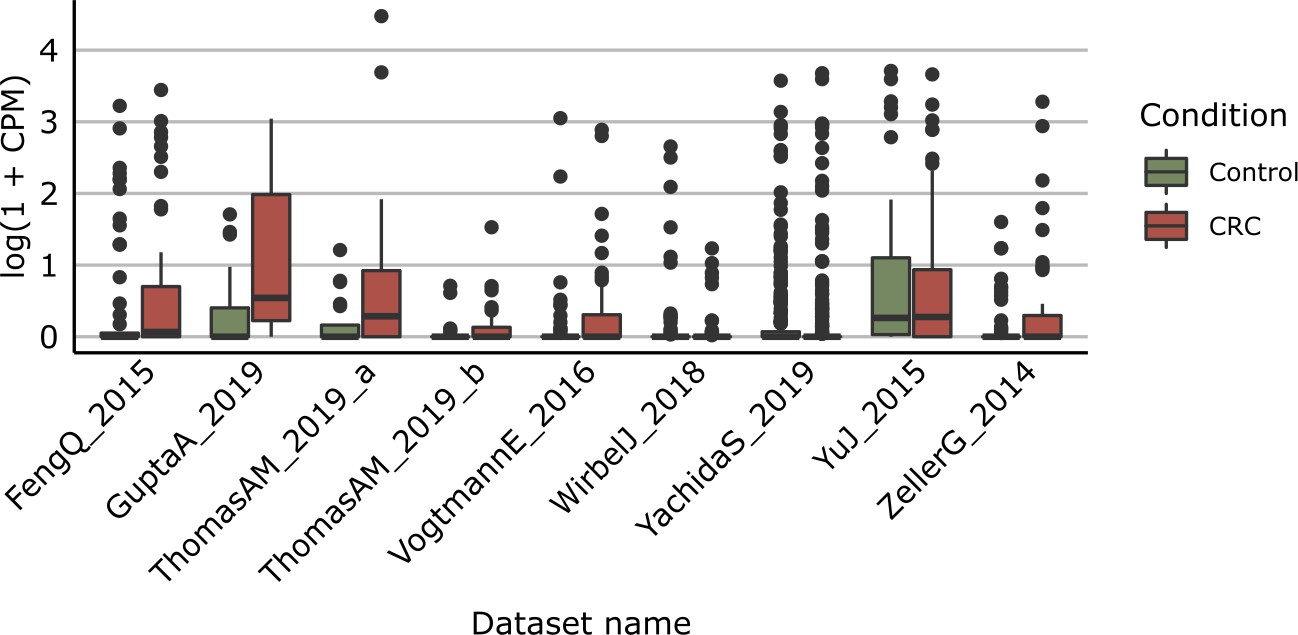
Distribution of yeaW gene relative abundance (log10 count-per-million normalized) extracted from HUMAnN gene family profiles.
Figure 2—figure supplement 5
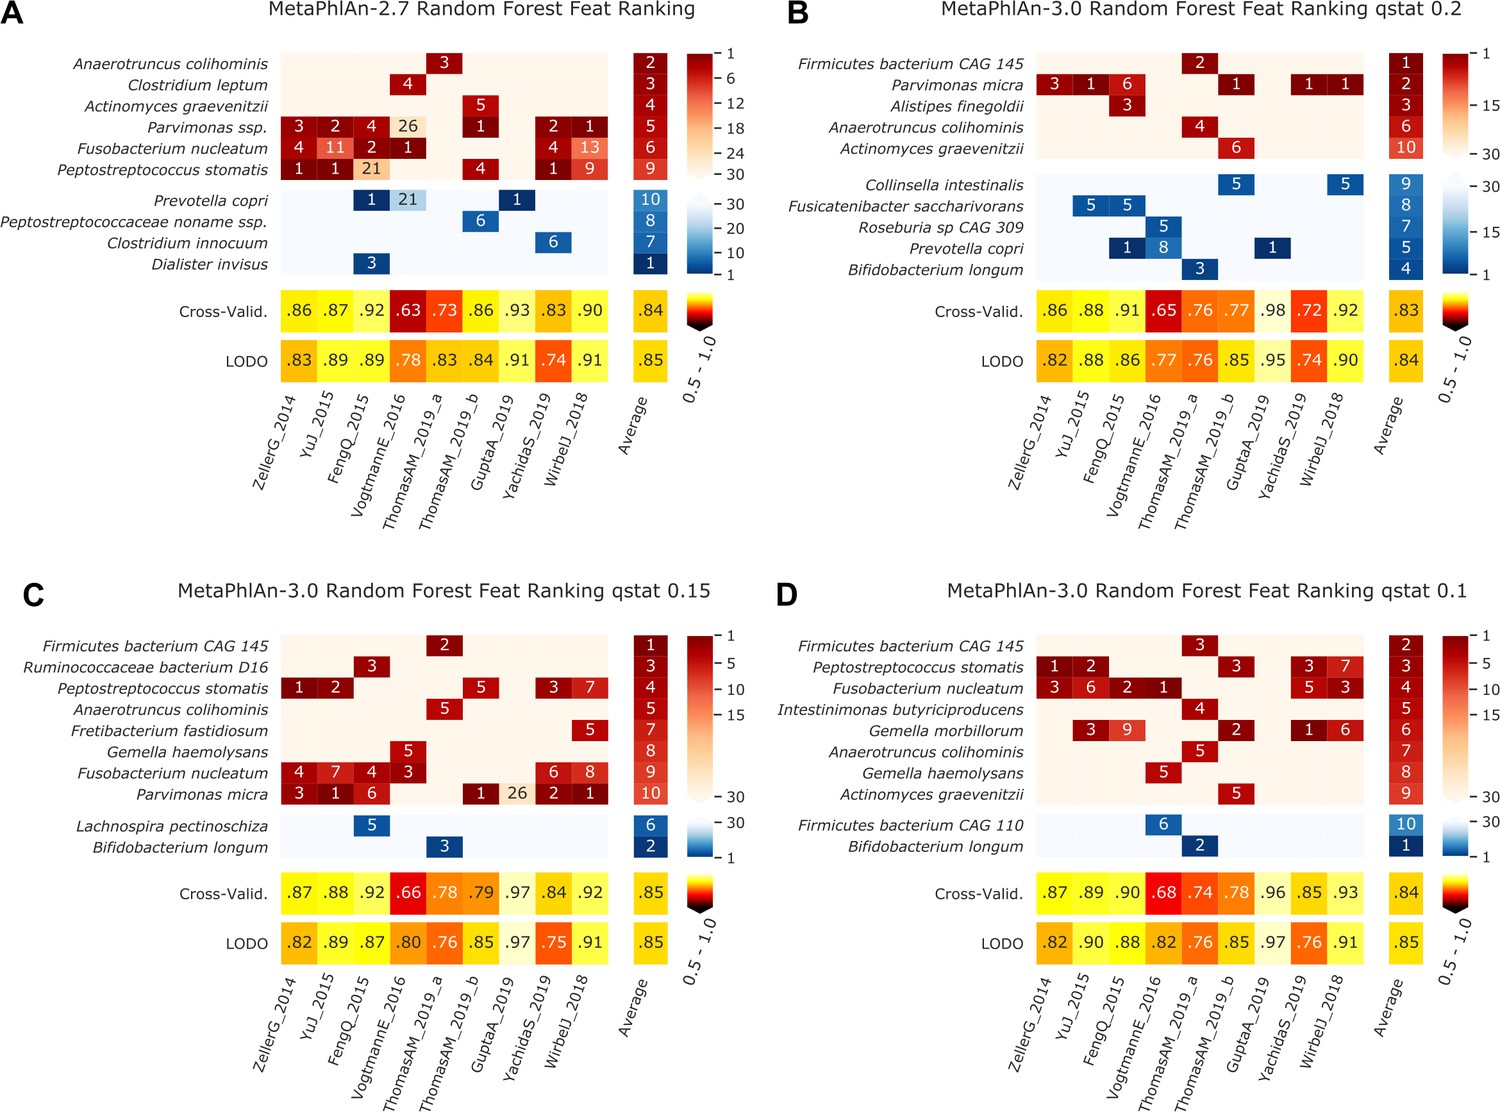
Features identified by the random-forest analysis on the species profiled with MetaPhlAn 2 and MetaPhlAn 3 using different values of q_stat, and by HUMANn 3 grouping UniRef90 in MetaCyc pathways and Enzyme Commission numbers.
Figure 3 with 1 supplement
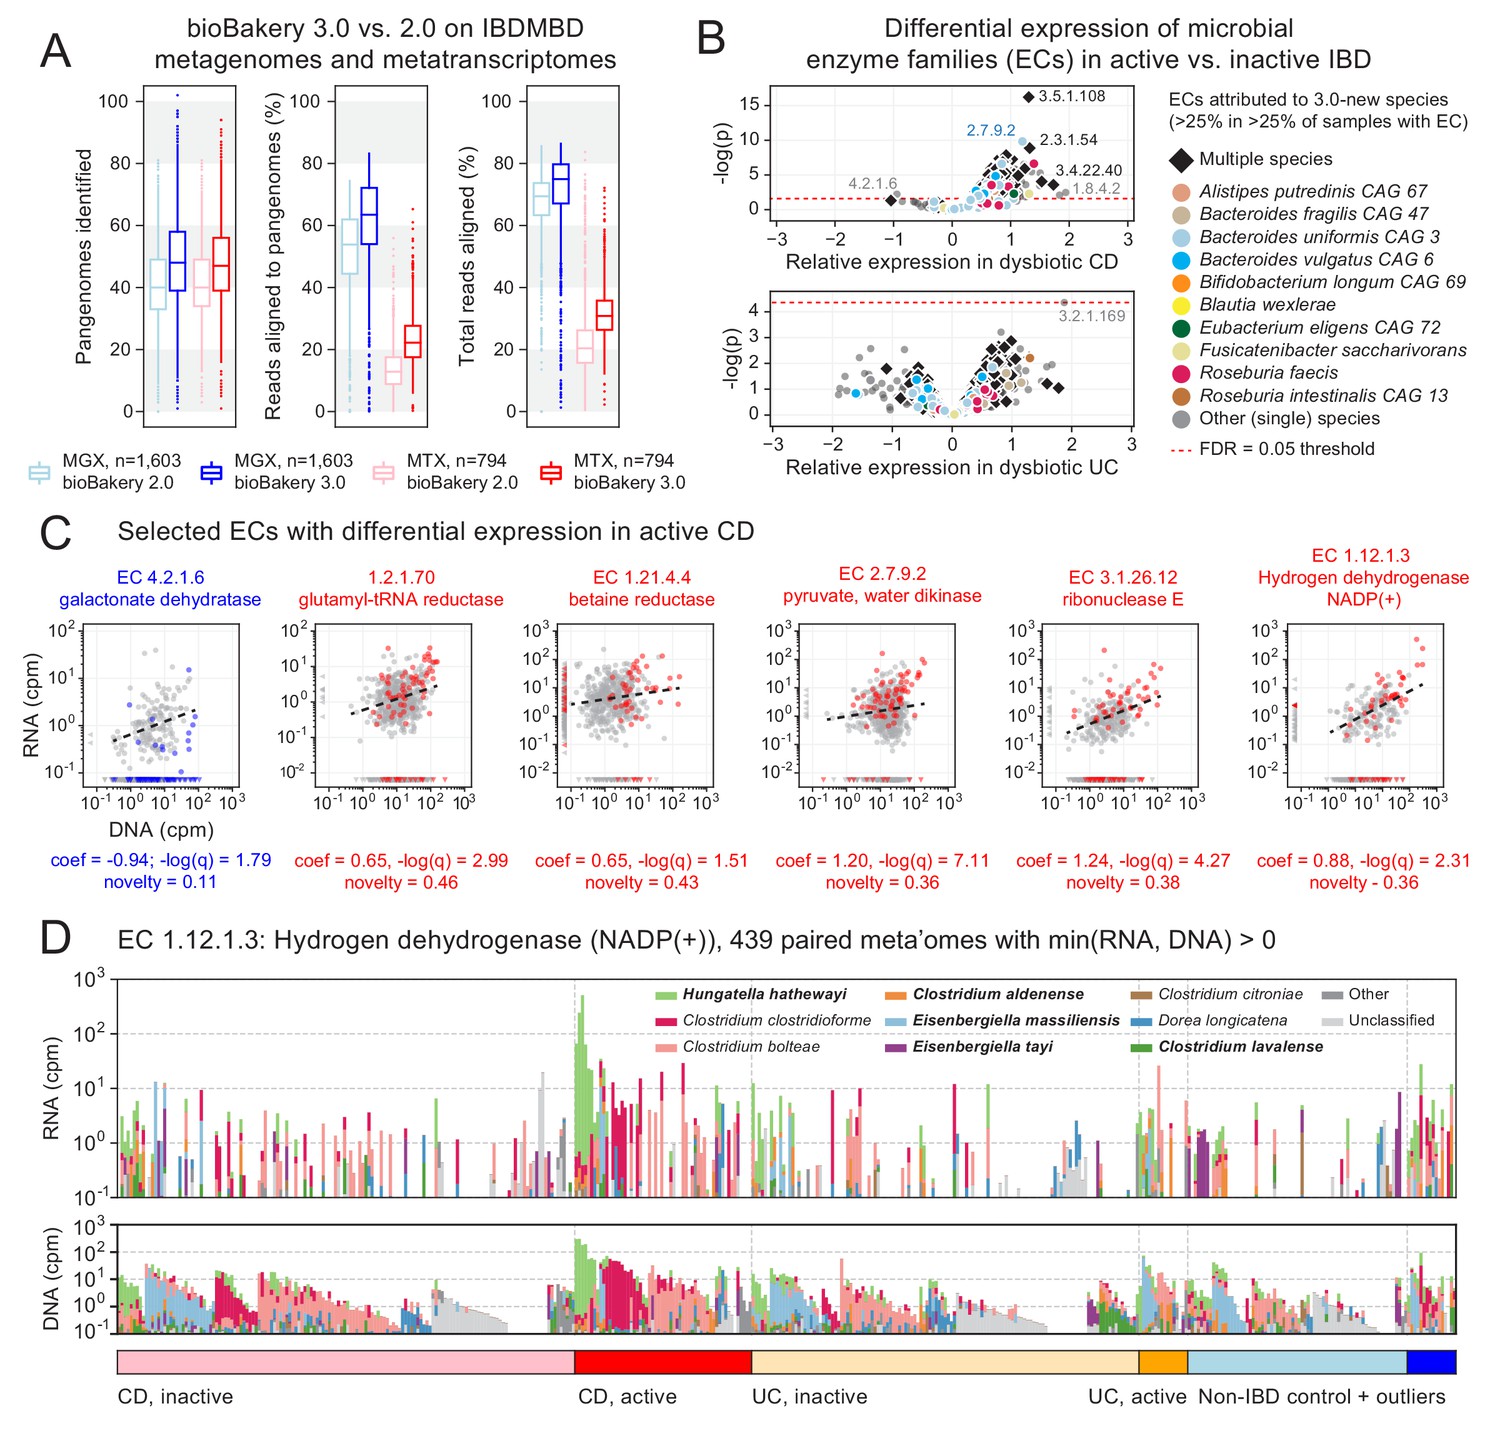
Longitudinal taxonomic and functional meta-omics of IBD.
(A) Comparison of MetaPhlAn and HUMAnN profiles of IBDMDB metagenomes and metatranscriptomes using v2 and v3 software (sequencing data and v2 profiles downloaded from http://ibdmdb.org). (B) > 500 Enzyme Commission (EC) families were significantly [linear mixed-effects (LME) models, FDR q < 0.05] differentially expressed in active CD relative to inactive CD; only a single EC met this threshold for active UC. ECs (points) are colored to highlight large contributions from one or more species that were new or newly classified in MetaPhlAn 3 (independent of the strength of their association with active IBD). (C) Selected examples of EC families that were differentially expressed in active CD. Colored points correspond to active CD samples; all other samples are gray. The first example (blue) is the only EC to be down-regulated in active CD (as indicated by CD active samples falling below the best-fit RNA vs. DNA line). To match the associated LME models (see Materials and methods), best-fit lines exclude samples where an EC’s RNA or DNA abundance was zero (such samples are shown as triangles in the x:y margins). (D) Species contributions to RNA (top) and DNA (bottom) abundance of EC 1.12.1.3. The seven strongest contributing species are colored individually; bold names indicate new species in MetaPhlAn 3. Samples are sorted according to the most abundant contributor and then grouped by diagnosis. The tops of the stacked bars (representing community total abundance) follow the logarithmic scale of the y-axis; species’ contributions are linearly scaled within that height.
Figure 3—figure supplement 1
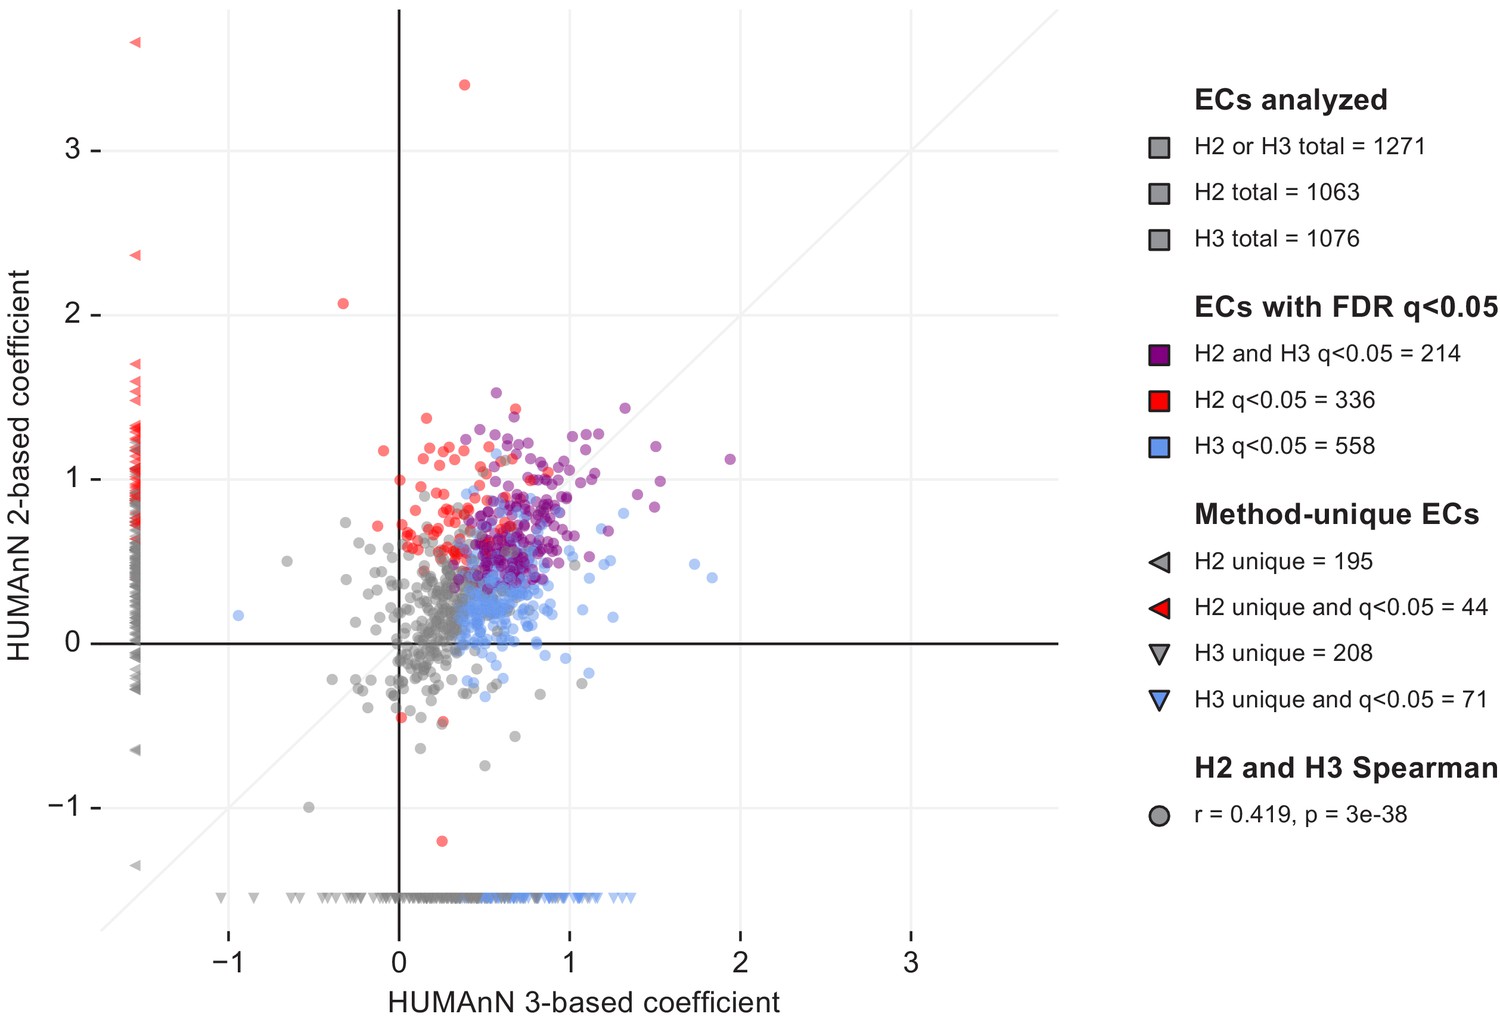
We repeated the differential expression analysis described in the main text using metagenomic and metatranscriptomic profiles of enzyme (EC) abundances from the IBDMDB population based on HUMAnN 2.11.0.
Here, we compare the coefficient of enzyme relative expression in dysbiotic Crohn’s disease samples between HUMAnN 2 and 3 (each point in the plot corresponds to one EC; counts in the legend indicate ECs that were uniquely or jointly detected/FDR-significant in HUMAnN 2 versus 3). HUMAnN 2 and 3 quantified similar numbers of ECs appropriate for downstream analysis (1063 and 1076, respectively). However, HUMAnN 3 identified 558 significantly differentially expressed (DE’ed) ECs compared with only 336 for HUMAnN 2 (with ‘significantly’ defined as FDR q < 0.05). Of these, 214 were shared between versions 2 and 3, meaning that HUMAnN 3 recapitulated the majority of DE’ed ECs found by HUMAnN 2 (64%) while also increasing the total reported DE’ed ECs by 66%. Enzymes that were uniquely analyzed by HUMAnN 2 or 3 are shown in the left and bottom margins, respectively. These include (1) ecologically rare ECs that narrowly passed analysis thresholds in one method but not the other and (2) ECs that were retired or reclassified between versions 2 and 3.
Figure 4 with 1 supplement
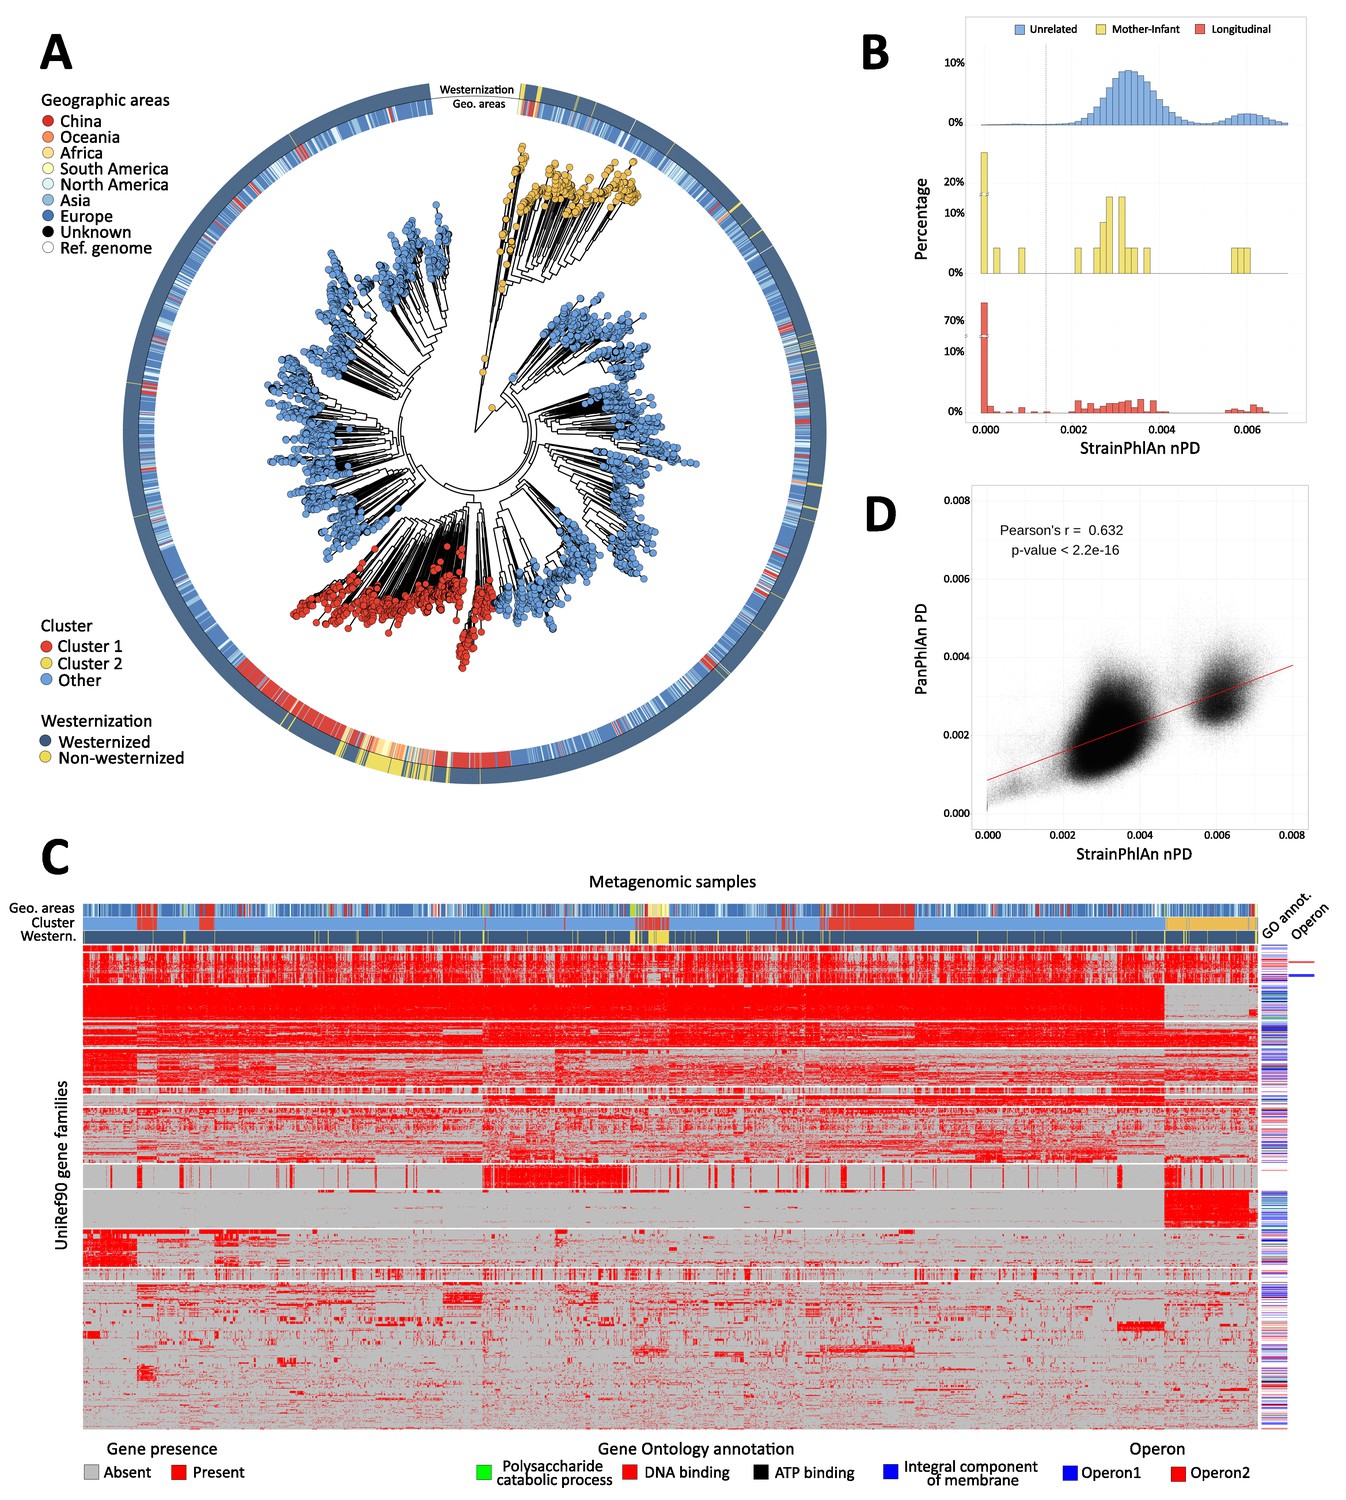
Population-scale strain-level phylogenetic and pangenomic analyses of Ruminococcus bromii from over 4000 human gut metagenomes.
(A) StrainPhlAn 3 profiling revealed stratification of Ruminococcus bromii clades with genetic content and variants frequently structured with respect to geographic origin and lifestyle. Genetically divergent subclades were identified, labeled as ‘Cluster 1’ (mainly composed of strains retrieved from Chinese subjects, Fisher’s exact test p<2.2e-16) and a subspecies-like Cluster 2. (B) Strain tracking of R. bromii. While unrelated individuals from diverse populations very rarely share highly genetically similar strains, pairs of related strains are readily detected by StrainPhlAn from longitudinal samples from the same individuals (quantifying short- and medium-term strain retention at about 75%) and in mother-infant pairs (confirming this species is at least partially vertically transmitted). Normalized phylogenetic distances (nPD) were computed on the StrainPhlAn tree. (p<0.003 two-sample Kolmogorov–Smirnov test on all the three distributions) (C) PanPhlAn 3 gene profiles of R. bromii strains from metagenomes highlights the variability and the structure of the accessory genes across datasets (core genes were removed for clarity). A total of 6151 UniRef90 gene families from the R. bromii pangenome were detected across the 2679 of the 4077 samples in which a strain of this species was present at a sufficient abundance to be profiled by PanPhlAn. The 13 highest-rooted gene clusters are shown, highlighting co-occurrence of blocks likely to be functionally related. The most common GO annotations are also reported together with two operons containing genes verified to be on the same locus by analysis of the reference genomes in the PanPhlAn 3 database. (D) Genetic (SNV on marker genes from StrainPhlAn 3) and genomic (gene presence/absence from PanPhlAn 3) distances between R. bromii strains are correlated (Pearson's r = 0.632, p-value<2.2e-16) pointing at generally consistent functional divergence in this species.
Figure 4—figure supplement 1
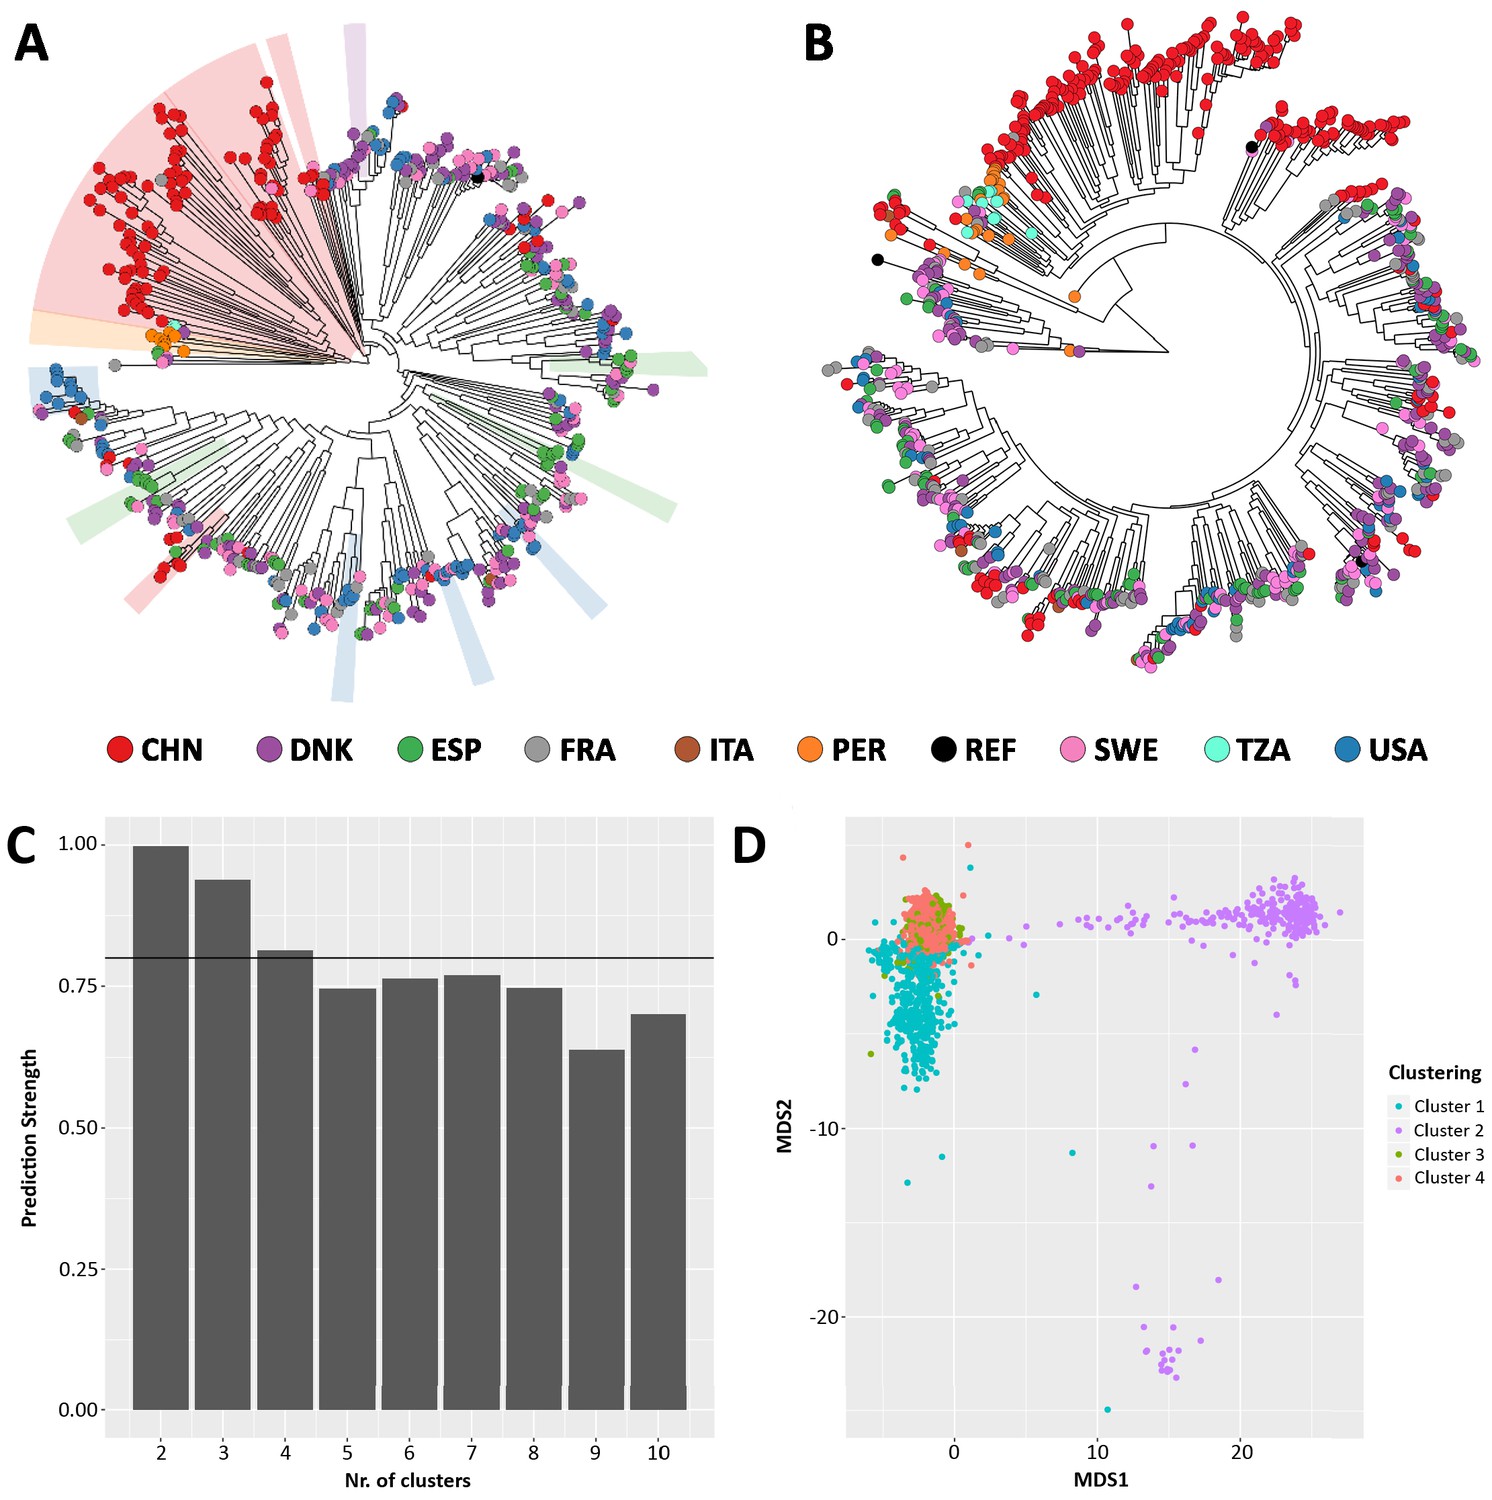
Comparison between StrainPhlAn (A) and StrainPhlAn 3 (B) strain level profiling capabilities.
Ruminococcus bromii species was profiled on 1590 metagenomes. (C) Prediction strength at different cluster numbers and (D) PAM clustering results on the StrainPhlAn 3 phylogenetic distance matrix expose four optimal clusters of Ruminococcus bromii strains.
Additional files
-
Supplementary file 1
Average values of F1 scores of MetaPhlAn 3, MetaPhlAn 2, mOTUs2, and Kraken species-level profiles computed on the 123 synthetic metagenomes.
- https://cdn.elifesciences.org/articles/65088/elife-65088-supp1-v1.docx
-
Supplementary file 2
bioBakery 3 software improvements.
- https://cdn.elifesciences.org/articles/65088/elife-65088-supp2-v1.xlsx
-
Supplementary file 3
Mean and ranked values of Bray-Curtis similarity and arcsine-square-root normalized Bray-Curtis similarity obtained by MetaPhlAn 3, MetaPhlAn 2, mOTUs2, and Kraken on the synthetic metagenomes considered in the evaluation.
- https://cdn.elifesciences.org/articles/65088/elife-65088-supp3-v1.xlsx
-
Supplementary file 4
Comparison of runtime and memory consumption of MetaPhlAn 3, MetaPhlAn 2, mOTUs2, and Kraken + Bracken on the 5 HMP metagenomes.
- https://cdn.elifesciences.org/articles/65088/elife-65088-supp4-v1.docx
-
Supplementary file 5
MetaPhlAn 3 taxonomic profiles and HUMAnN 3 functional profiles of the 1262 CRC samples.
- https://cdn.elifesciences.org/articles/65088/elife-65088-supp5-v1.xlsx
-
Supplementary file 6
MetaPhlAn 3 species-level, HUMAnN 3 pathway abundances and gene families abundances CRC meta-analysis results.
- https://cdn.elifesciences.org/articles/65088/elife-65088-supp6-v1.xlsx
-
Supplementary file 7
MetaPhlAn 3 species merged according to the species-level genome bin (SGB) system.
- https://cdn.elifesciences.org/articles/65088/elife-65088-supp7-v1.xlsx
-
Supplementary file 8
Number of distinct MetaPhlAn 3 markers per species.
- https://cdn.elifesciences.org/articles/65088/elife-65088-supp8-v1.xlsx
-
Supplementary file 9
Per-sample OPAL binary measures (true positive, false positive, false negative, precision, recall, F1 score) computed on MetaPhlAn 3, MetaPhlAn 2, mOTUs2, and Kraken species-level profiles computed on the 123 synthetic metagenomes.
- https://cdn.elifesciences.org/articles/65088/elife-65088-supp9-v1.xlsx
-
Supplementary file 10
Metadata of all the 1262 samples from the 10 CRC datasets.
- https://cdn.elifesciences.org/articles/65088/elife-65088-supp10-v1.xlsx
-
Transparent reporting form
- https://cdn.elifesciences.org/articles/65088/elife-65088-transrepform-v1.pdf
Download links
A two-part list of links to download the article, or parts of the article, in various formats.
Downloads (link to download the article as PDF)
Open citations (links to open the citations from this article in various online reference manager services)
Cite this article (links to download the citations from this article in formats compatible with various reference manager tools)
Integrating taxonomic, functional, and strain-level profiling of diverse microbial communities with bioBakery 3
eLife 10:e65088.
https://doi.org/10.7554/eLife.65088


