Multiple lineages of Streptomyces produce antimicrobials within passalid beetle galleries across eastern North America
- Department of Plant and Microbial Biology, University of California, Berkeley, United States
- Bioengineering and Biomedical Sciences Department, Biological Systems and Engineering Division, Lawrence Berkeley National Laboratory, United States
- Institute for Biodiversity Science and Sustainability, California Academy of Sciences, United States
- Department of Molecular and Cellular Biology, University of California, Berkeley, United States
- Ecology Department, Earth and Environmental Sciences, Lawrence Berkeley National Laboratory, United States
- Department of Environmental Science, Policy and Management, University of California, Berkeley, United States
Figures
Figure 1
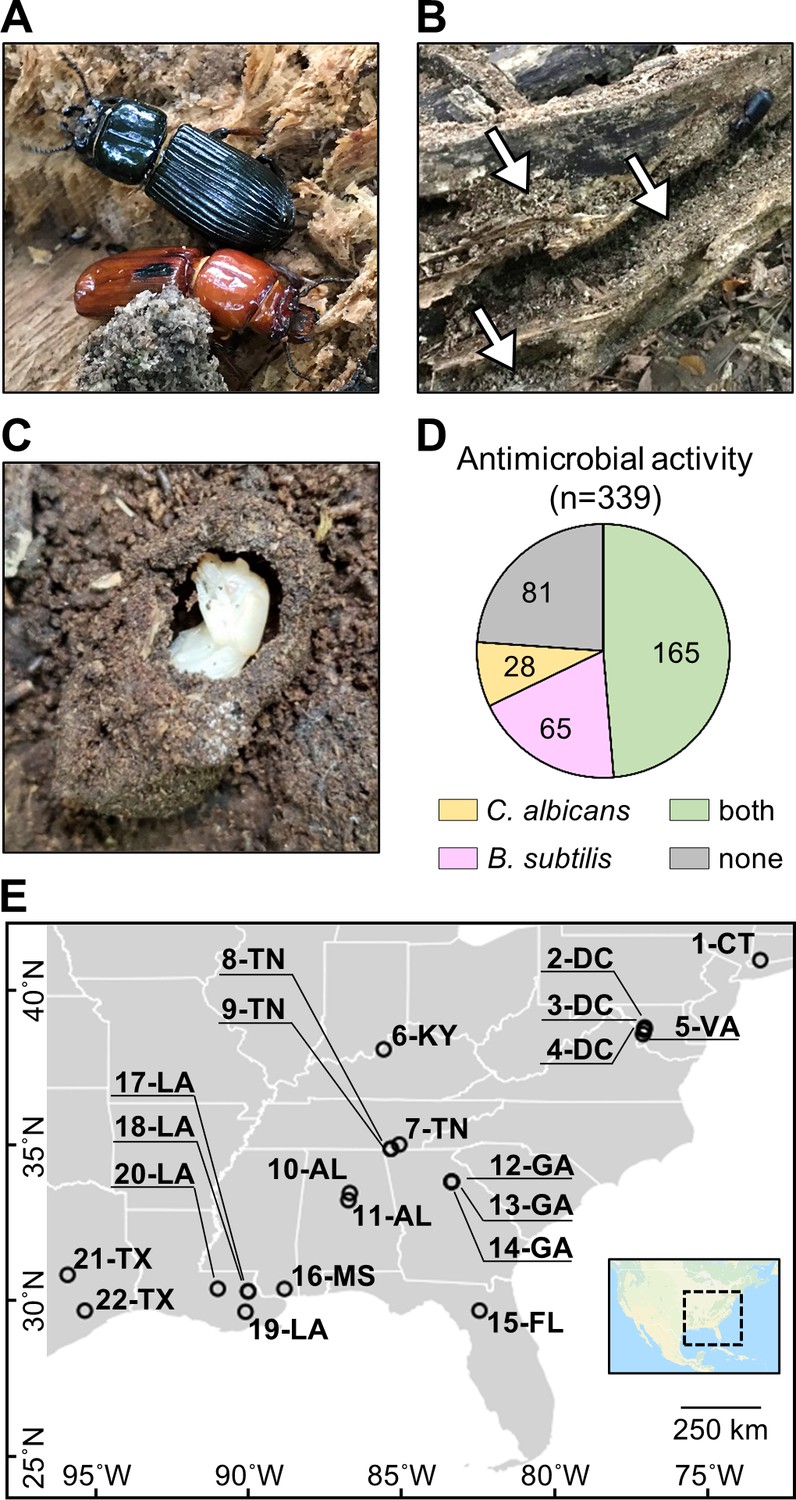
O. disjunctus beetles (A) inhabit and feed on decomposing logs.
They build galleries that are filled with frass (B, white arrows are pointing to the frass), which is a central material in this system. This material is also used to build pupal chambers (C). We sampled 22 galleries across 11 states (E) and isolated actinomycetes from all samples. This actinomycete collection showed a high rate of antimicrobial activity against B. subtilis and/or C. albicans (D). Each gallery is represented on the map by a circle with the gallery code next to it. CT: Connecticut; DC: District of Columbia; VA: Virginia; KY: Kentucky; TN: Tennessee; GA: Georgia; FL: Florida; AL: Alabama; MS: Mississippi; LA: Louisiana; TX: Texas.
Figure 2
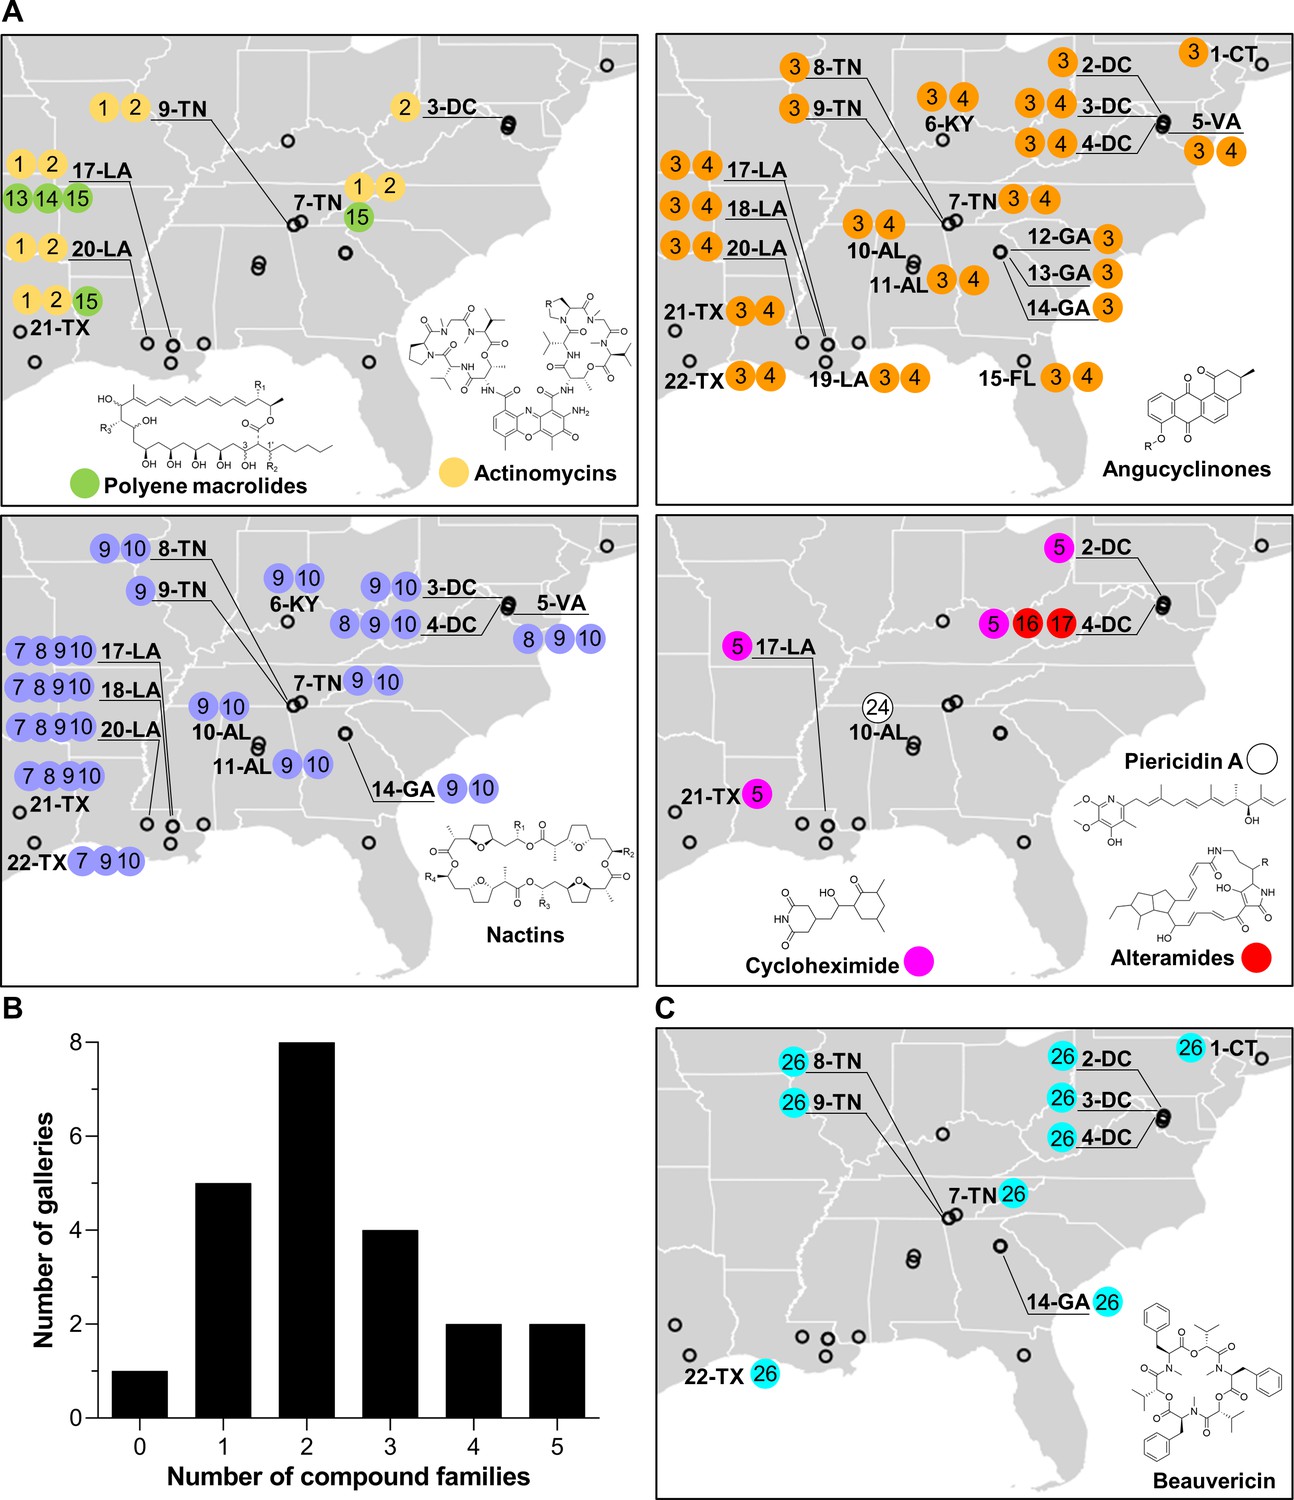
Geographic distribution of specialized metabolite families detected in frass material from wild beetle galleries.
(A) Distribution of bacterially produced compounds. (B) Number of galleries in which 0–5 families of bacterially produced compounds were detected. (C) Distribution of beauvericin, a fungal metabolite. Numbers in circles represent the numeric code of each compound: actinomycin D (1), actinomycin X2 (2), STA-21 (3), rubiginone B2 (4), cycloheximide (5), monactin (7), dinactin (8), trinactin (9), tetranactin (10), alteramide A (16), alteramide B (17), piericidin A (24), and beauvericin (26). Each gallery is represented on the map by a circle with the gallery code next to it. CT: Connecticut; DC: District of Columbia; VA: Virginia; KY: Kentucky; TN: Tennessee; GA: Georgia; FL: Florida; AL: Alabama; MS: Mississippi; LA: Louisiana; TX: Texas.
Figure 3
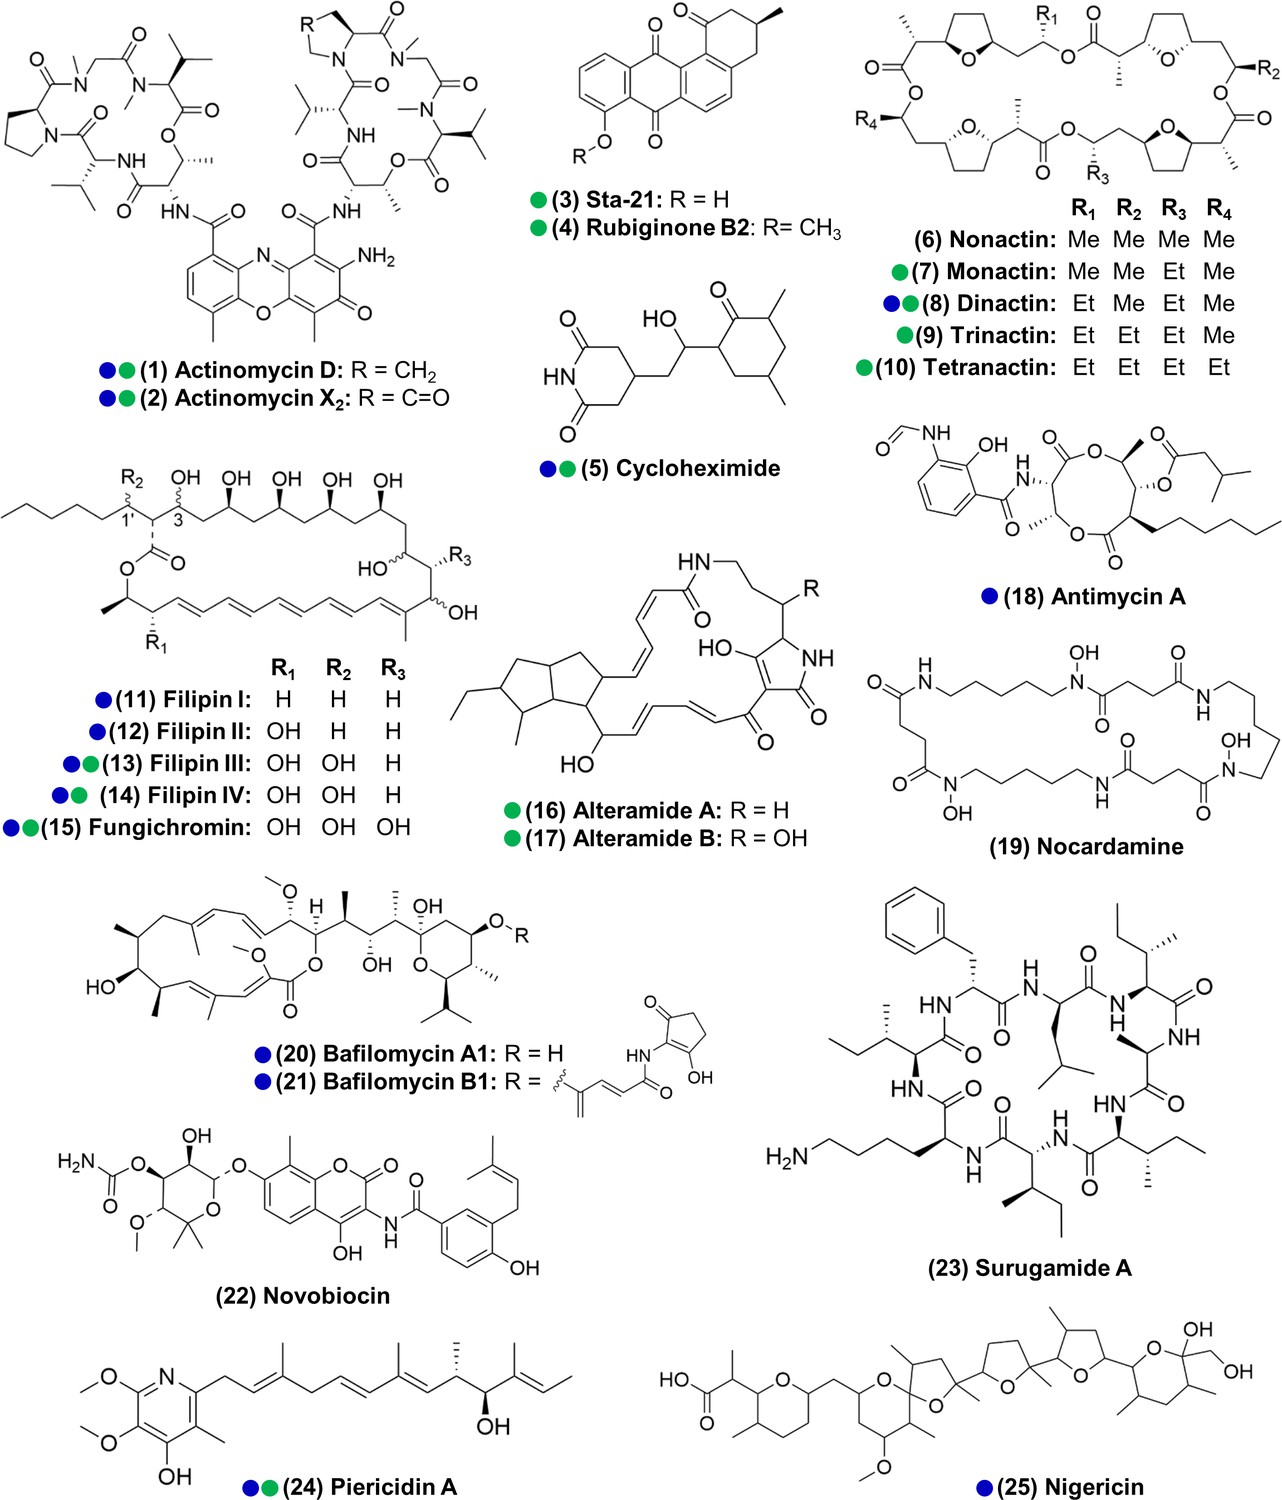
Actinomycetes associated with the O. disjunctus beetle produce structurally diverse specialized metabolites in vitro (1–25).
Blue circles represent compounds that were previously described to be produced by microbes associated with other insects. Green circles represent compounds detected in the frass that was sampled from wild O. disjunctus galleries. Stereochemistry was assigned based on the commercial standard used or from the literature.
Figure 4 with 8 supplements
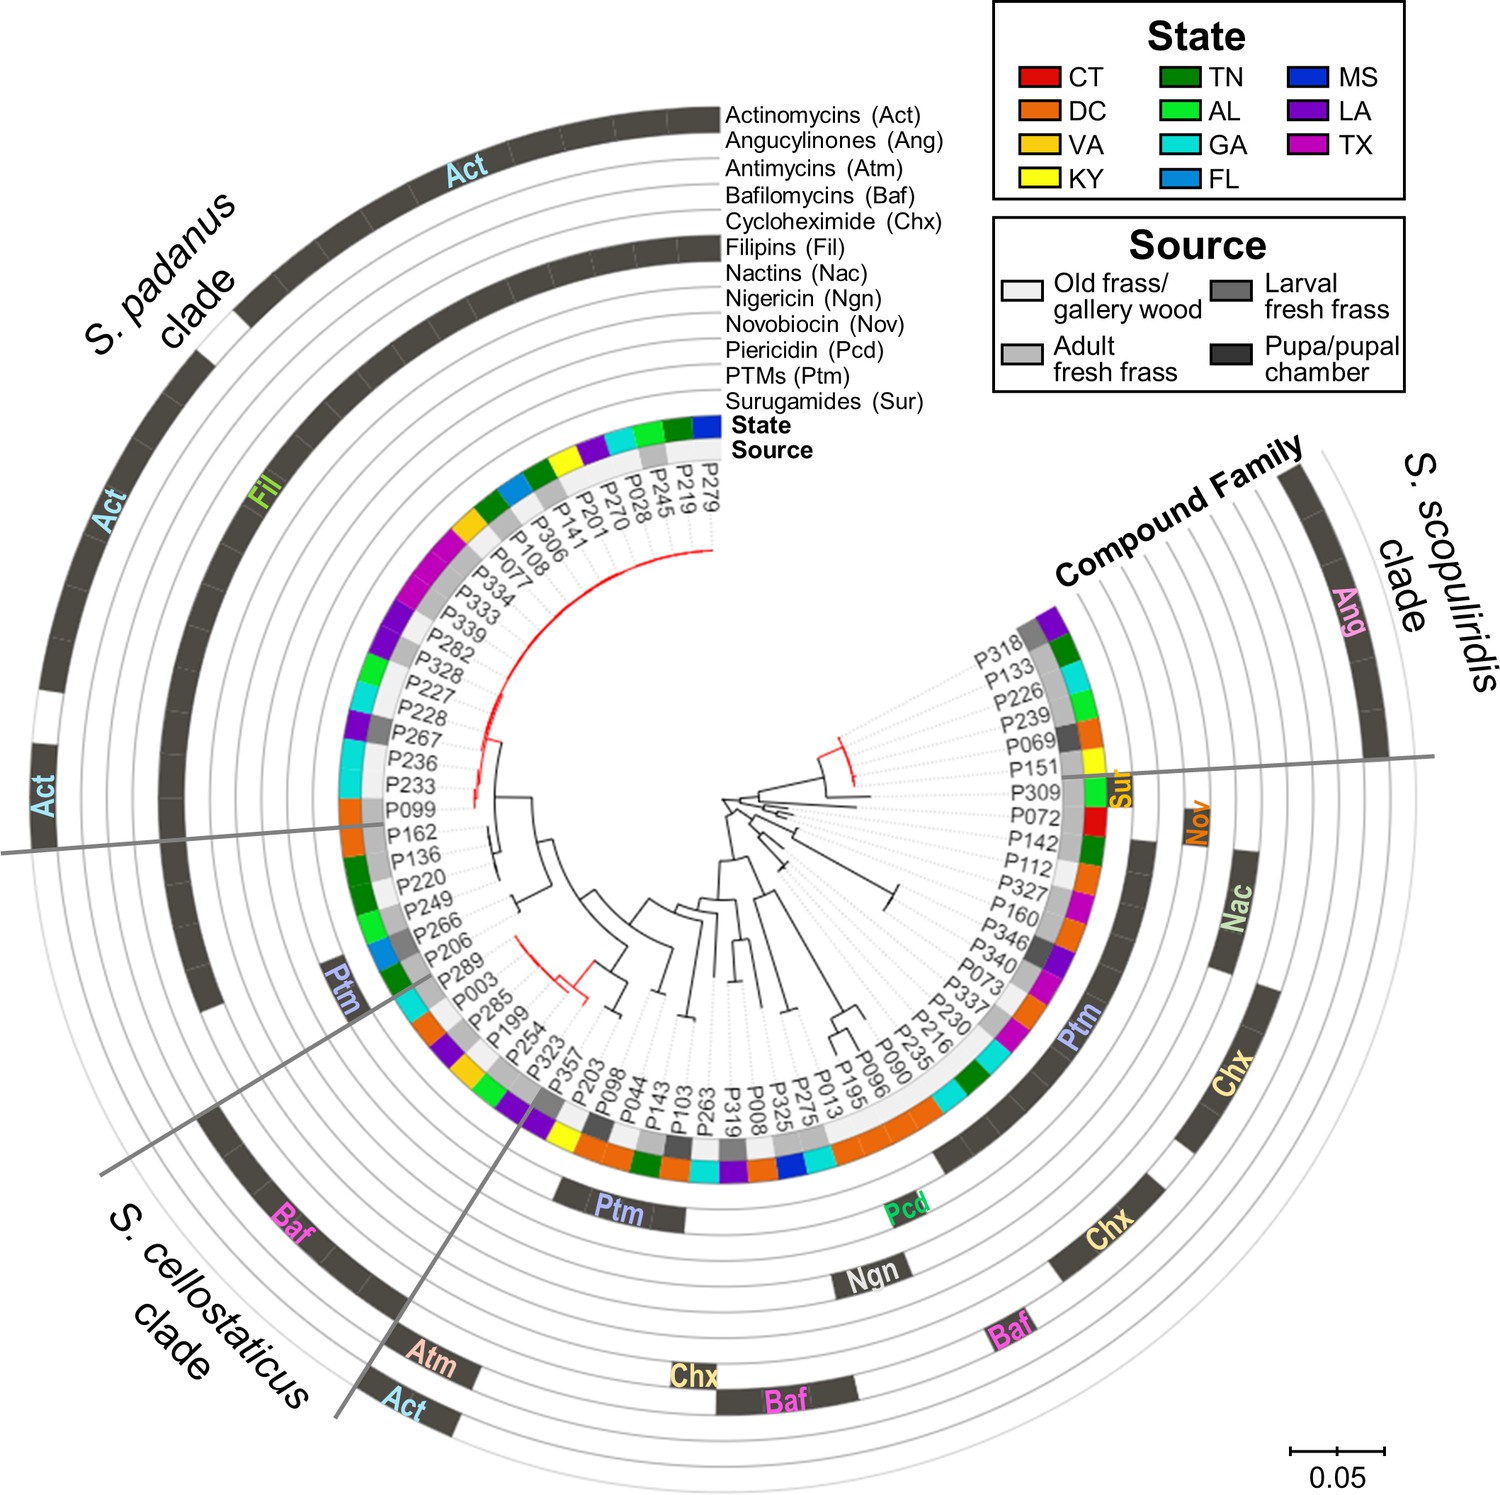
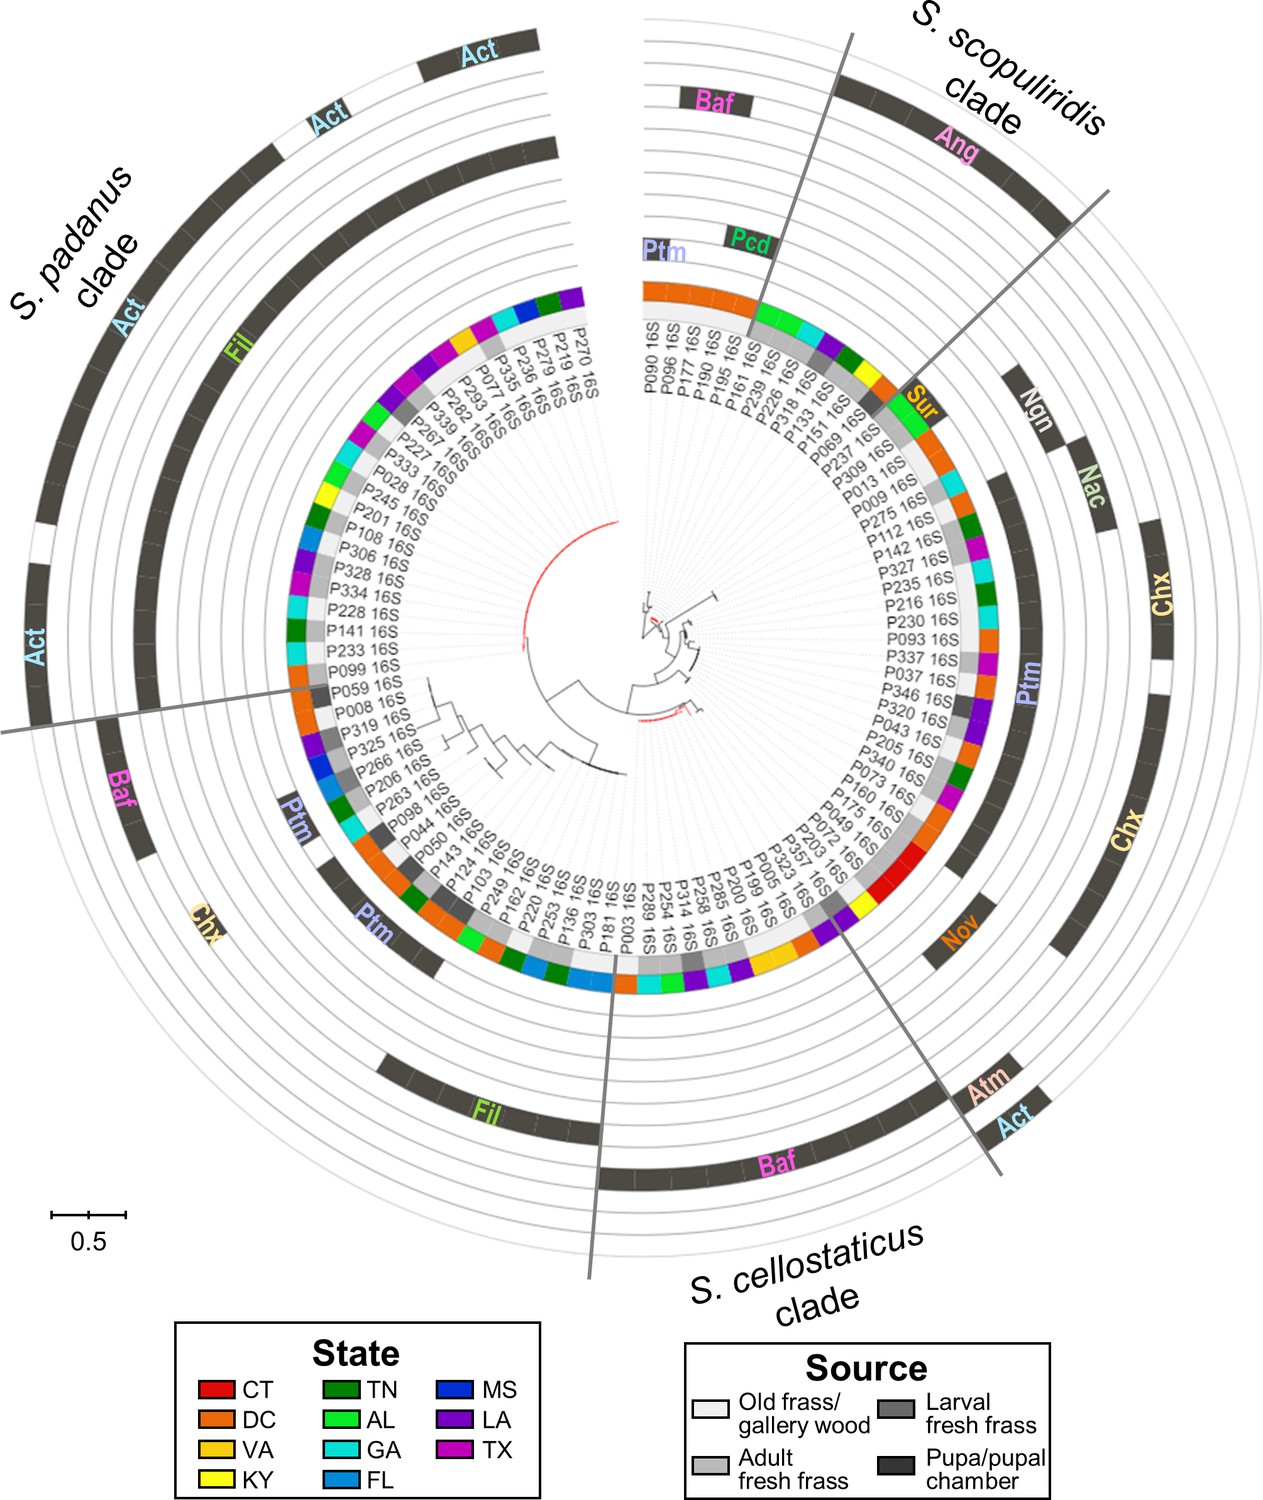
Maximum-likelihood phylogenetic tree built using concatenated sequences of four genes (16S rRNA, rpoB, gyrB, atpD) annotated with compounds produced by each microbial strain and their geographic and source origin (both represented by rings around the tree).
Scale bar represents branch length in number of substitutions per site. The outgroup (Mycobacterium tuberculosis H37RV) was removed manually from the tree to facilitate visualization. See Figure 4—figure supplement 1 for bootstrap values; Figure 4—figure supplement 2 for a tanglegram comparing this tree with a chemical dissimilarity dendrogram; Figure 4—figure supplements 3–5 for heatmaps showing the distance between strains geographic location; and Figure 4—figure supplements 6–8 for a phylogenetic tree containing, respectively, duplicate strains that were removed in this main phylogenetic tree, O. disjunctus isolates plus Streptomyces isolated from soil samples, and O. disjunctus isolates plus Streptomyces isolated from tropical passalid beetles, termites, bees/wasps/ants, and soils. Branches in red highlight the three major clades: S. padanus, S. cellostaticus, and S. scopuliridis. Leaf labels represent the strain code. Act: actinomycins; Ang: angucyclinones; Atm: antimycins; Baf: bafilomycins; Chx: cycloheximide; Fil: filipins; Nac: nactins; Ngn: nigericin; Nov: novobiocin; Pcd: piericidin; Ptm: polycyclic tetramate macrolactams; Sur: surugamides.
Figure 4—figure supplement 1
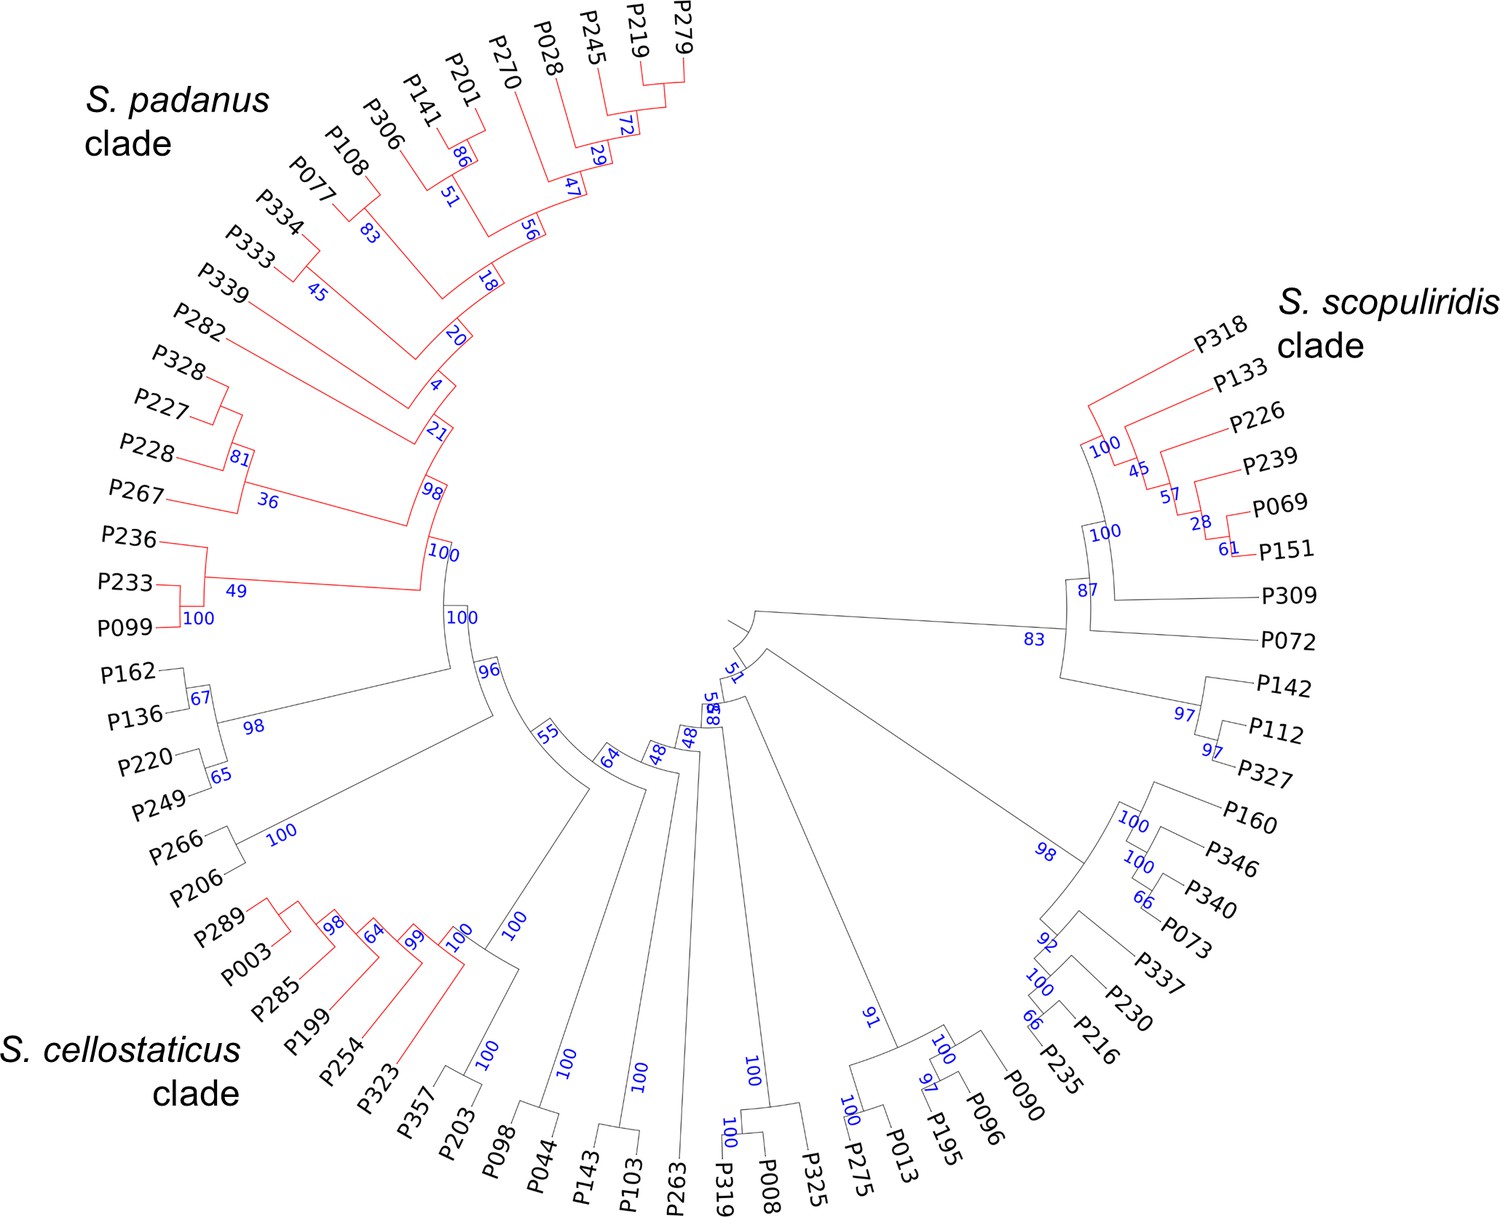
Maximum-likelihood phylogenetic tree built using concatenated sequences of four genes (16S rRNA, rpoB, gyrB, atpD).
Bootstrap support values (in percentage) are based on 1000 replicates (numbers in blue). Branches in red highlight the three major clades: S. padanus, S. cellostaticus, and S. scopuliridis. Leaf labels represent the strain code. The outgroup (Mycobacterium tuberculosis H37RV) was manually removed, and the branch length information was not incorporated into the tree to facilitate visualization of the bootstrap values.
Figure 4—figure supplement 2
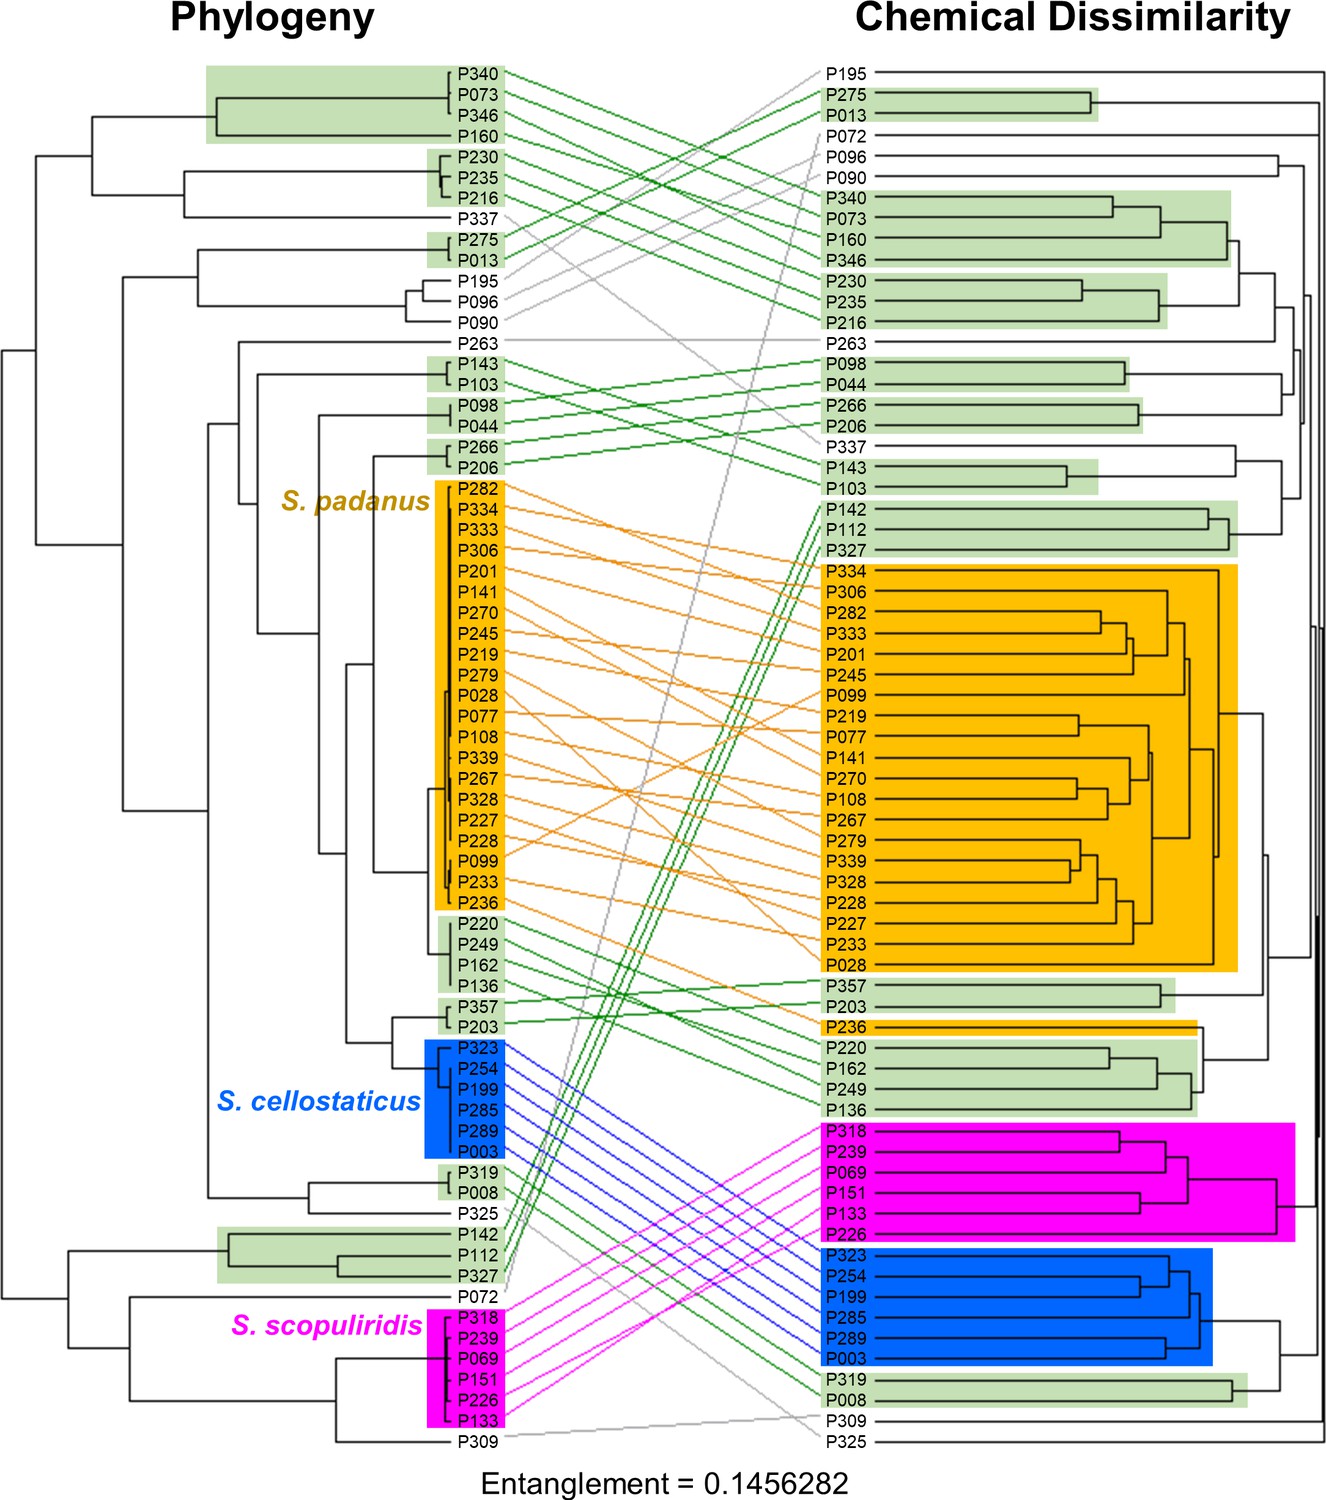
Tanglegram analysis comparing phylogenetic (left) and metabolic (right) information of Streptomyces strains associated with O. disjunctus shows chemo-evolutionary relationships among strains.
The maximum-likelihood phylogenetic tree was built using concatenated sequences of four genes (16S rRNA, rpoB, gyrB, atpD). The chemical dissimilarity dendrogram was generated using hierarchical cluster analysis on the presence and absence of ~19,000,000 chemical features detected in an untargeted metabolomics analysis of culture extracts, using Jaccard distance and UPGMA (unweighted pair group method with arithmetic mean) as the agglomeration method. Lines connect the same strains; orange boxes highlight the S. padanus clade; blue boxes highlight the S. cellostaticus clade; pink boxes highlight the S. scopuliridis clade; and green boxes highlight the smaller clades that were seen in both sides of the tanglegram.
Figure 4—figure supplement 3
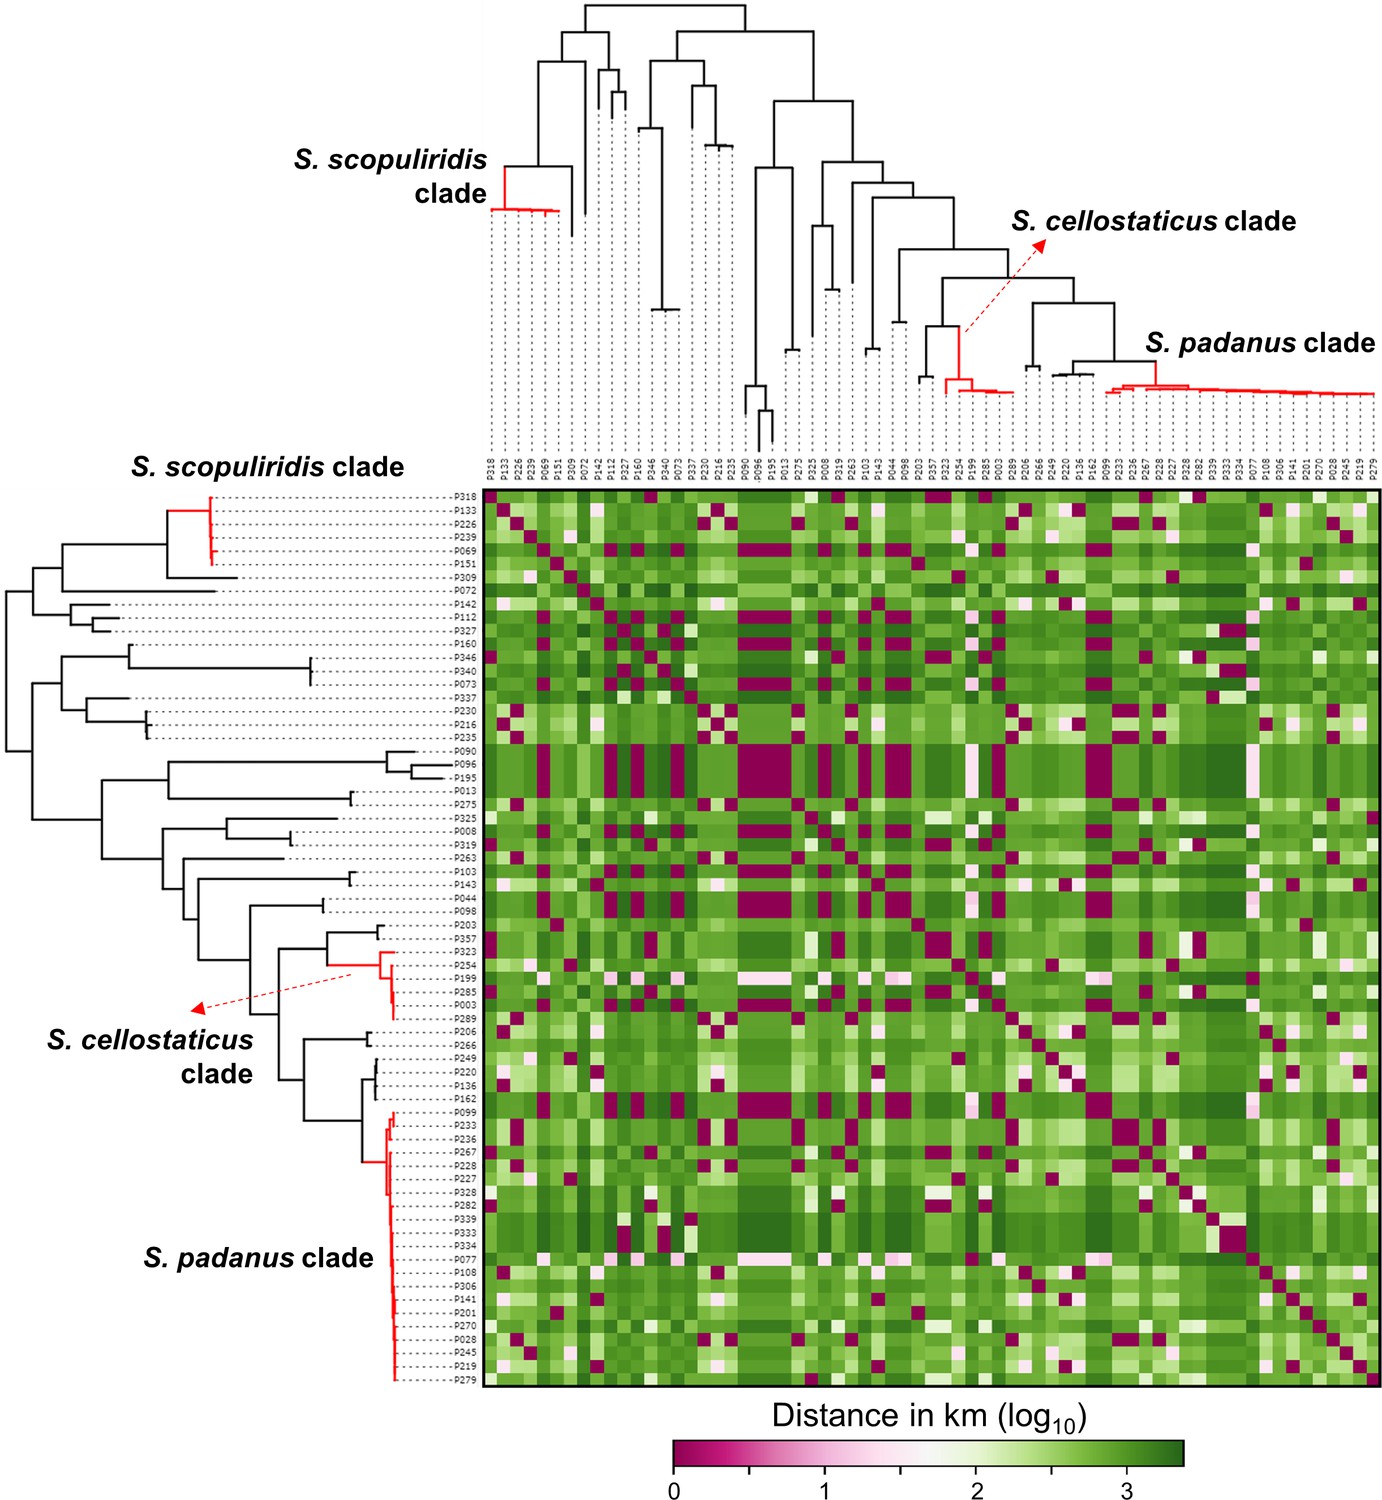
Heatmap showing the distance in kilometers (in log10 scale) between the geographic origin of Streptomyces strains associated with O. disjunctus galleries.
Branches in red highlight the three major clades: S. padanus, S. cellostaticus, and S. scopuliridis. Leaf labels represent the strain code.
Figure 4—figure supplement 4
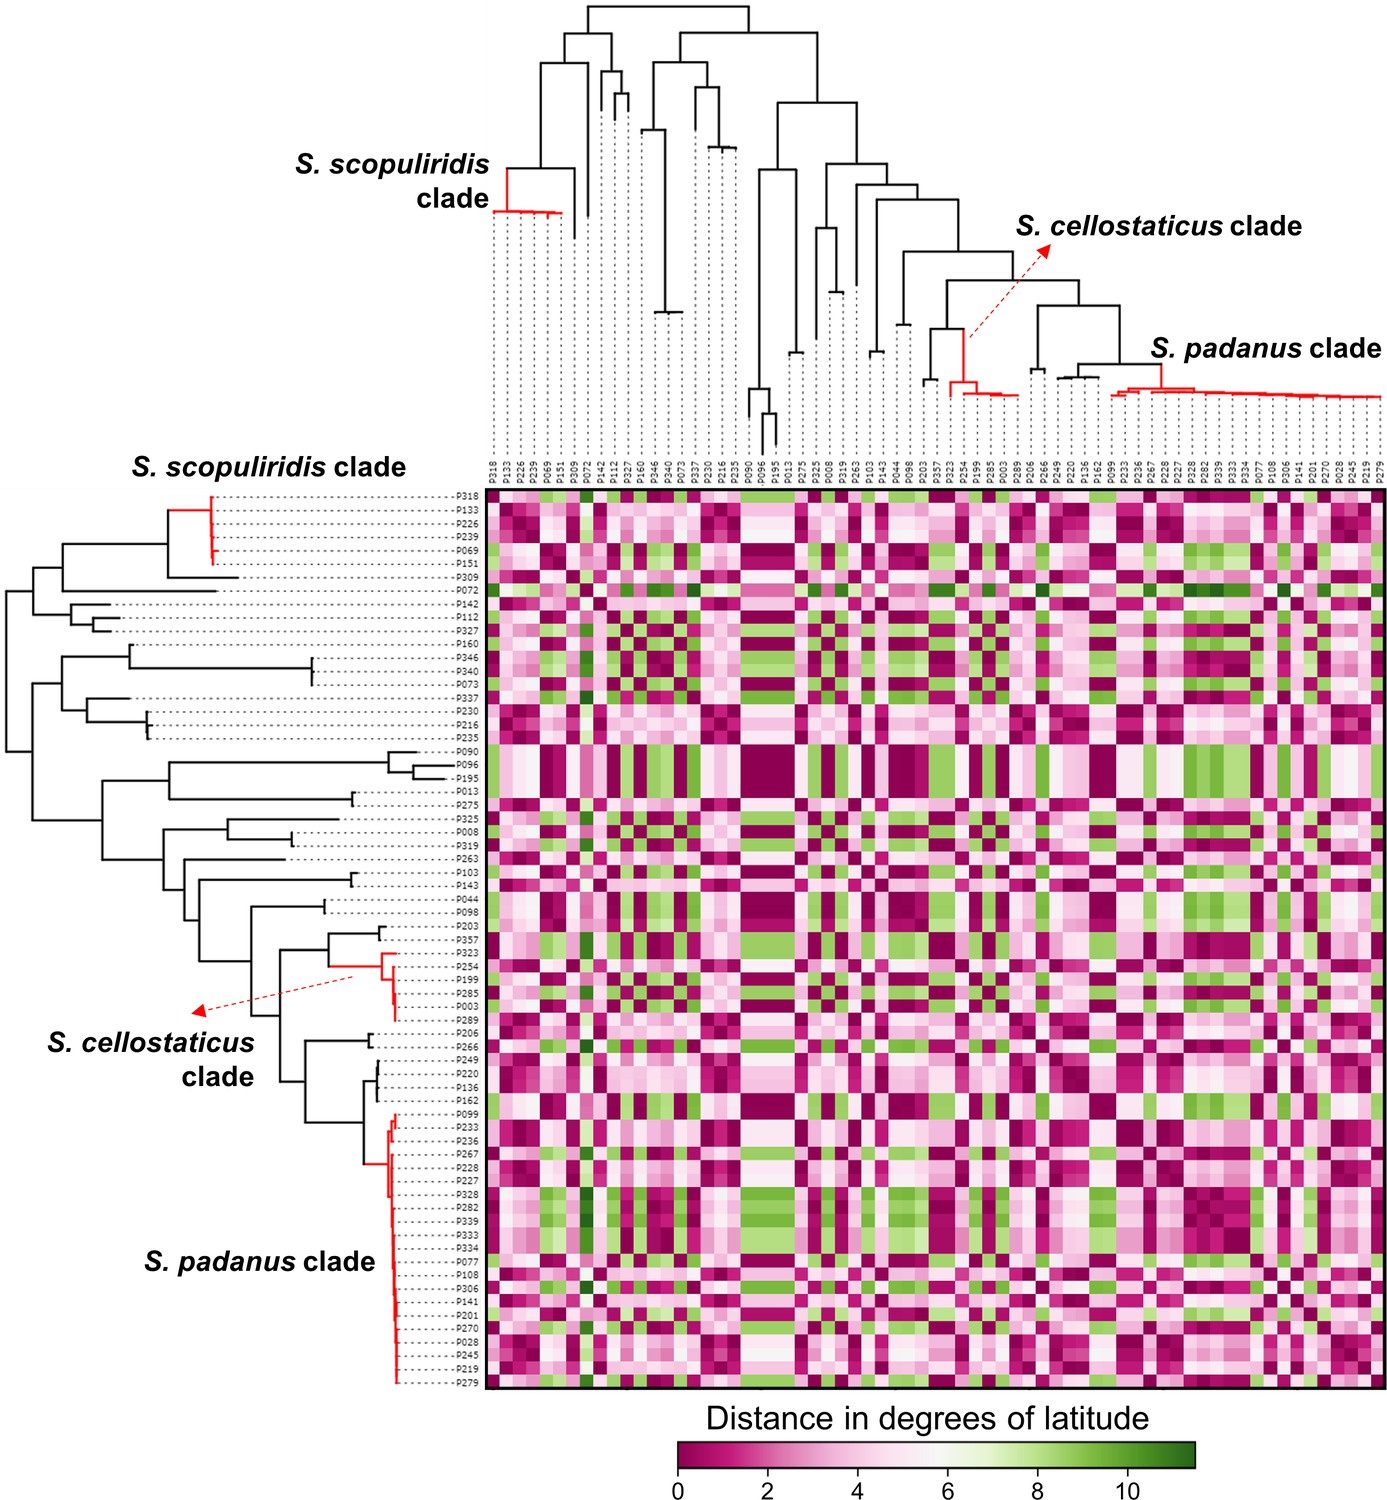
Heatmap showing the distance in degrees of latitude between the geographic origin of Streptomyces strains associated with O. disjunctus galleries.
Branches in red highlight the three major clades: S. padanus, S. cellostaticus, and S. scopuliridis. Leaf labels represent the strain code.
Figure 4—figure supplement 5
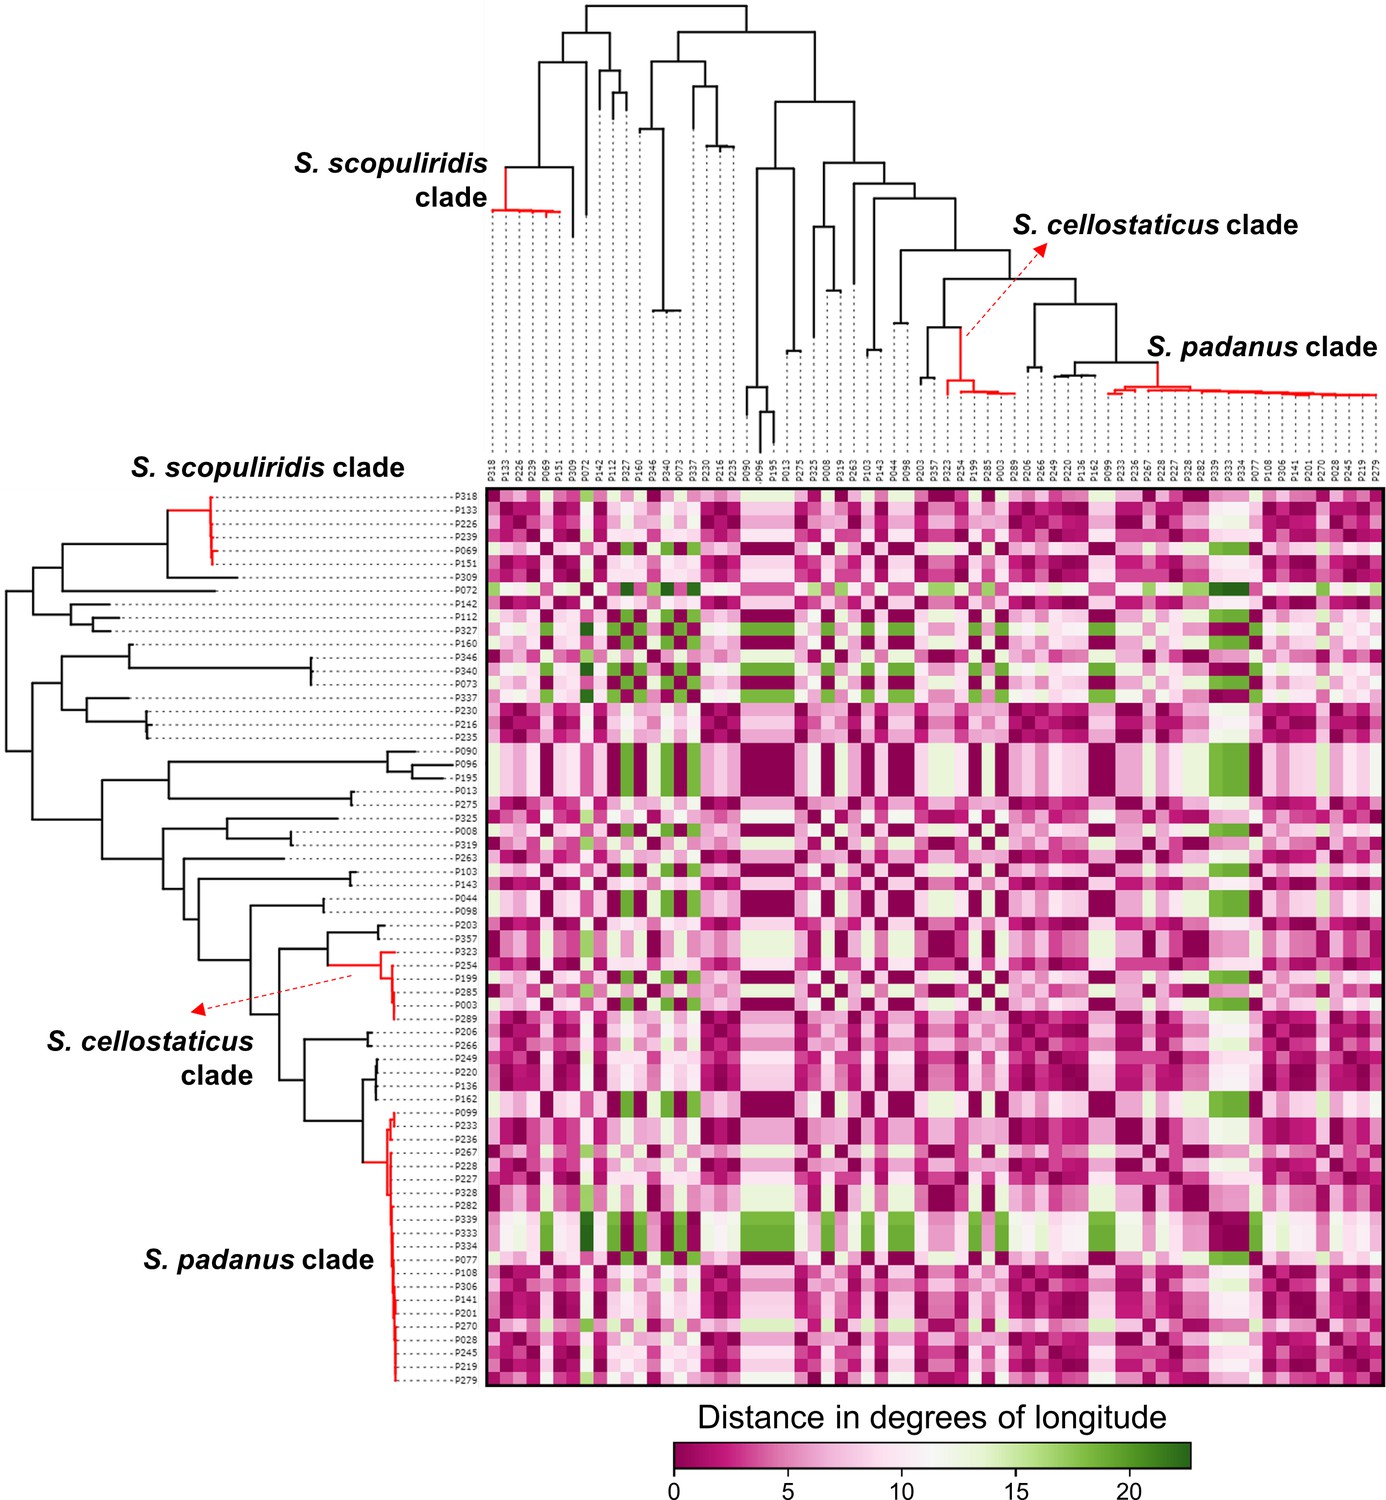
Heatmap showing the distance in degrees of longitude between the geographic origin of Streptomyces strains associated with O. disjunctus galleries.
Branches in red highlight the three major clades: S. padanus, S. cellostaticus, and S. scopuliridis. Leaf labels represent the strain code.
Figure 4—figure supplement 6
Maximum-likelihood phylogenetic tree built using the 16S rRNA gene sequence including duplicated strains, annotated with compounds produced by each microbial strain and their geographic and source origin (both represented by rings around the tree).
Scale bar represents branch length in number of substitutions per site. The outgroup (Mycobacterium tuberculosis H37RV) was removed manually from the tree to facilitate visualization. Leaf labels represent the strain code. Branches in red highlight the three major clades: S. padanus, S. cellostaticus, and S. scopuliridis. Leaf labels represent the strain code. Act: actinomycins; Ang: angucyclinones; Atm: antimycins; Baf: bafilomycins; Chx: cycloheximide; Fil: filipins; Nac: nactins; Ngn: nigericin; Nov: novobiocin; Pcd: piericidin; Ptm: polycyclic tetramate macrolactams; Sur: surugamides.
Figure 4—figure supplement 7
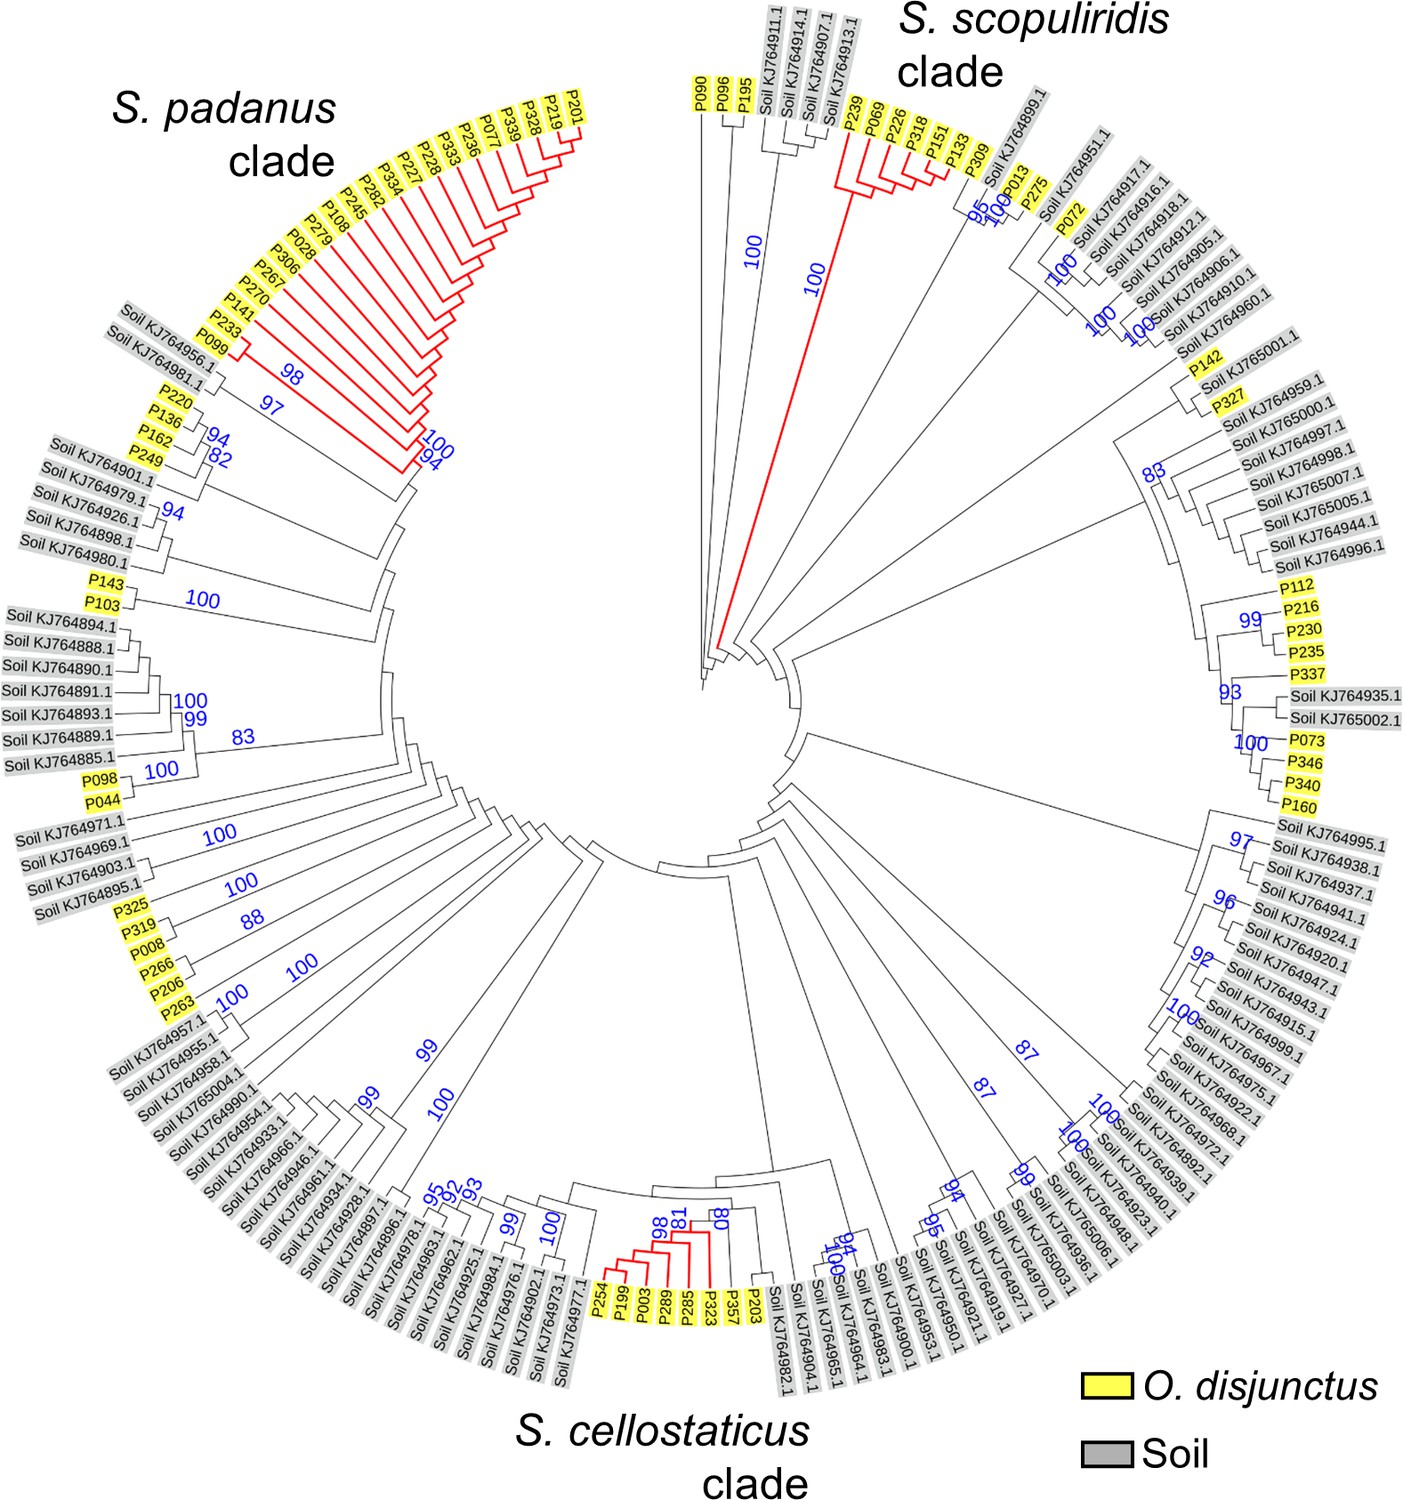
Maximum-likelihood phylogenetic tree built using the 16S rRNA gene sequence of Streptomyces strains isolated from O. disjunctus and soil.
Bootstrap support values (in percentage) are based on 1000 replicates (numbers in blue, only values above 80% are displayed). Branches in red highlight the three major clades: S. padanus, S. cellostaticus, and S. scopuliridis. Leaf labels represent the strain code. The outgroup (Mycobacterium tuberculosis H37RV) was manually removed, and the branch length information was not incorporated into the tree to facilitate visualization of the bootstrap values.
Figure 4—figure supplement 8
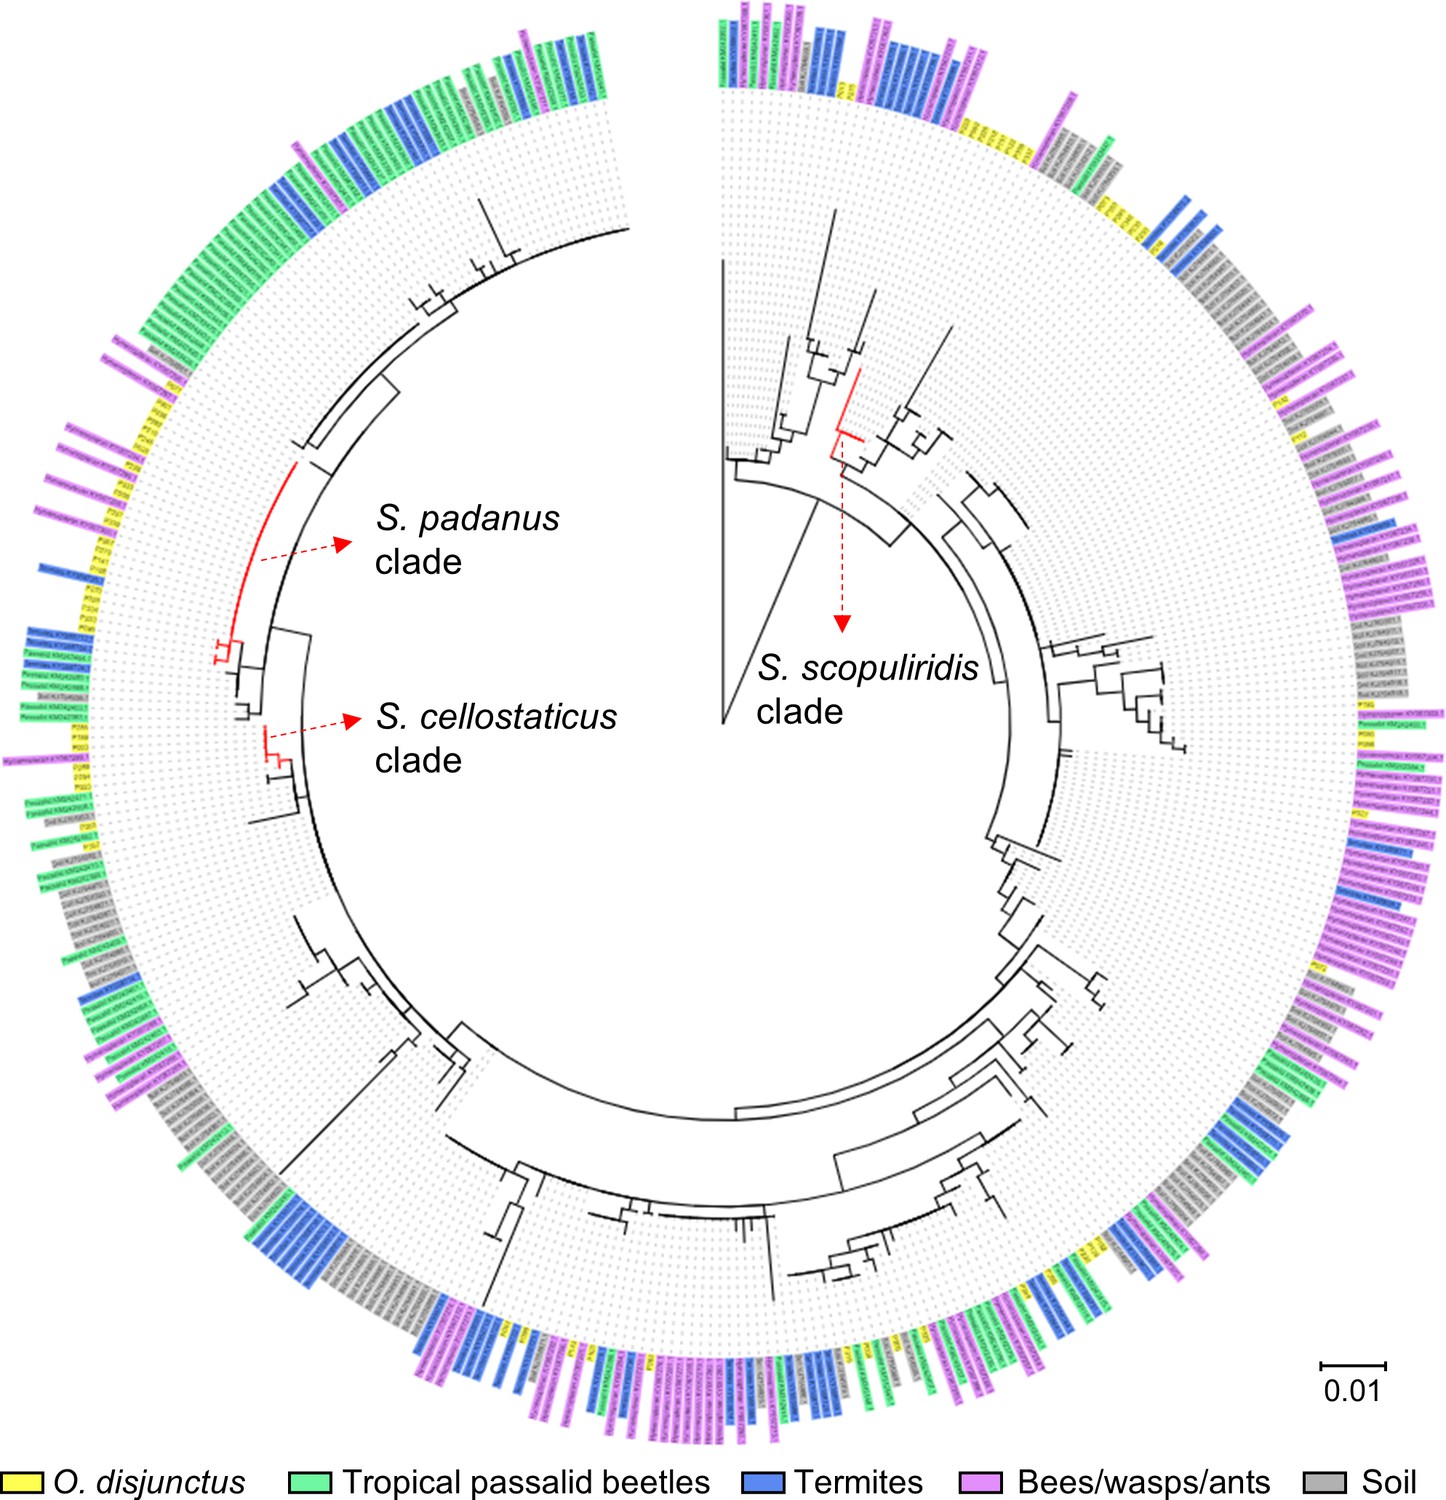
Maximum-likelihood phylogenetic tree built using the 16S rRNA gene sequence of Streptomyces strains isolated from O. disjunctus, tropical passalid beetles, termites, bees/wasps/ants, and soil.
Scale bar represents branch length in number of substitutions per site. Leaf labels represent the strain code. The outgroup (Mycobacterium tuberculosis H37RV) was removed manually from the tree to facilitate visualization. Branches in red highlight the three major clades: S. padanus, S. cellostaticus, and S. scopuliridis.
Figure 5 with 1 supplement
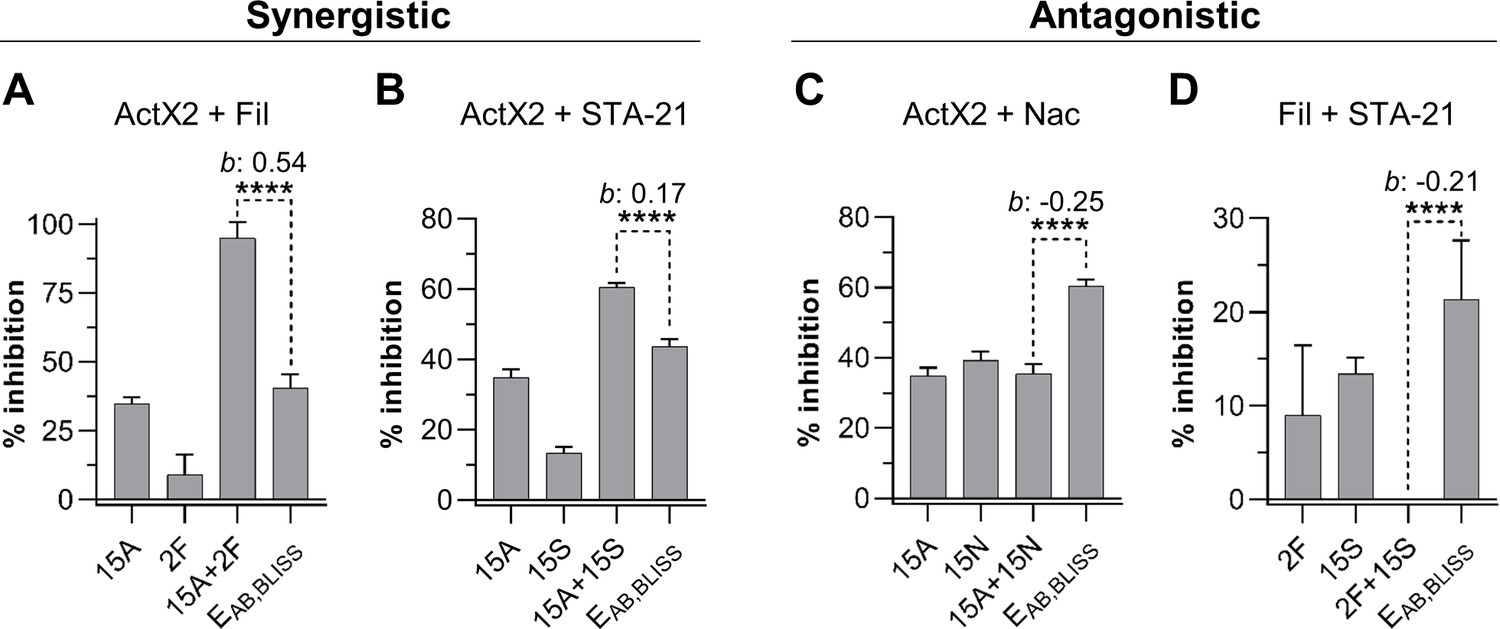
Actinomycin X2 (ActX2), filipins (Fil), nactins (Nac), and STA-21 display both synergistic (A, B) and antagonistic (C, D) interactions when tested for their ability to inhibit M. anisopliae P287 growth.
Bars represent means (+ SD) of percent of growth inhibition (sample size: seven independent biological replicates). Statistical significance was measured using a t-test. ****p<0.0001. Numbers at the X-axis represent the tested concentration of each compound in µg/mL (F: filipins; A: actinomycin X2; N: nactins; S: STA-21). b: Bliss excess; EAB,BLISS: expected value for an independent (additive) interaction between two drugs according to the Bliss Independence model. See Figure 5—figure supplement 1 for other compound combinations.
-
Figure 5—source data 1
M. anisopliae P237 growth inhibition (in percent) in each one of the replicates of the compound interactions assay.
F: filipins; A: actinomycin X2; N: nactins; S: STA-21.
- https://cdn.elifesciences.org/articles/65091/elife-65091-fig5-data1-v1.xlsx
Figure 5—figure supplement 1
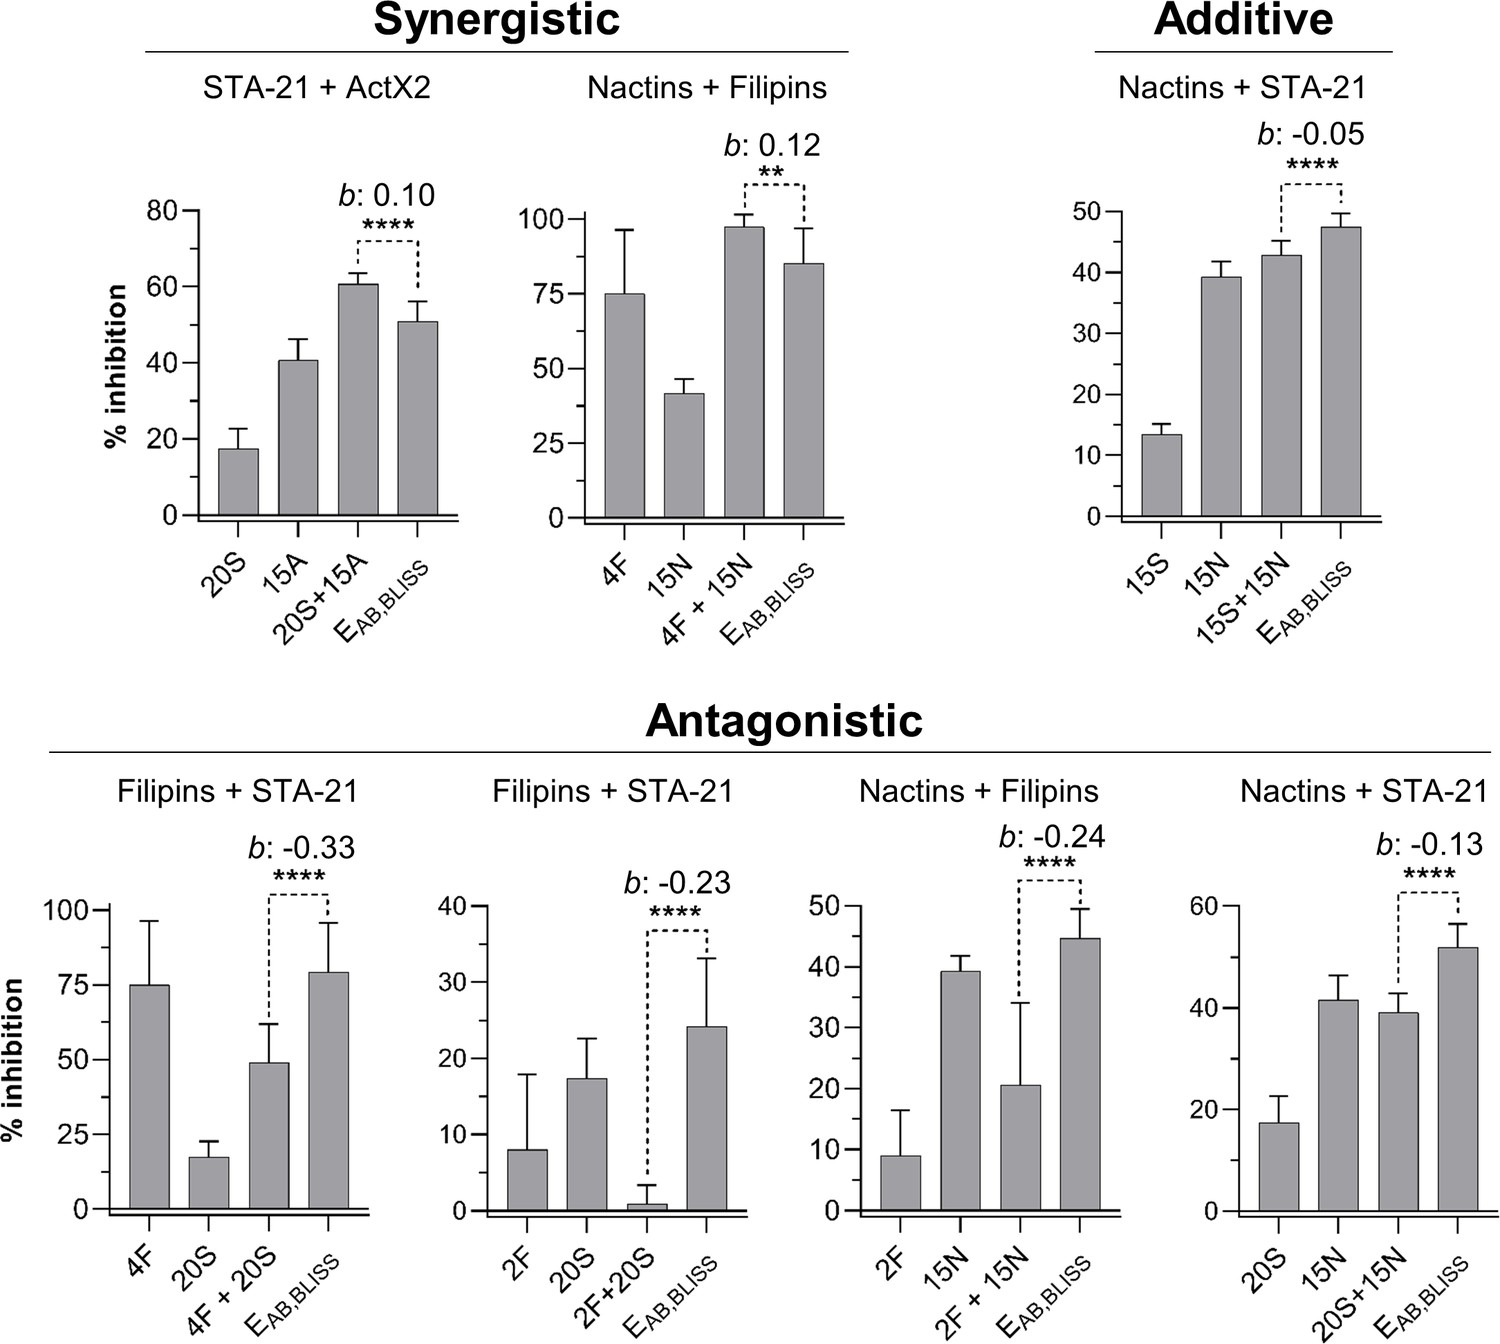
Other compound combinations used in the compound interaction assay.
Bars represent means (+ SD) of percent of growth inhibition (sample size: seven independent biological replicates). Statistical significance was measured using a t-test (****p<0.0001; **p=0.009). Numbers at the X-axis represent the tested concentration of each compound in µg/mL (F: filipins; A: actinomycin X2; N: nactins; S: STA-21). b: Bliss excess; EAB,BLISS: expected value for an independent (additive) interaction between two compounds according to the Bliss Independence model; ActX2: actinomycin X2.
Figure 6 with 3 supplements
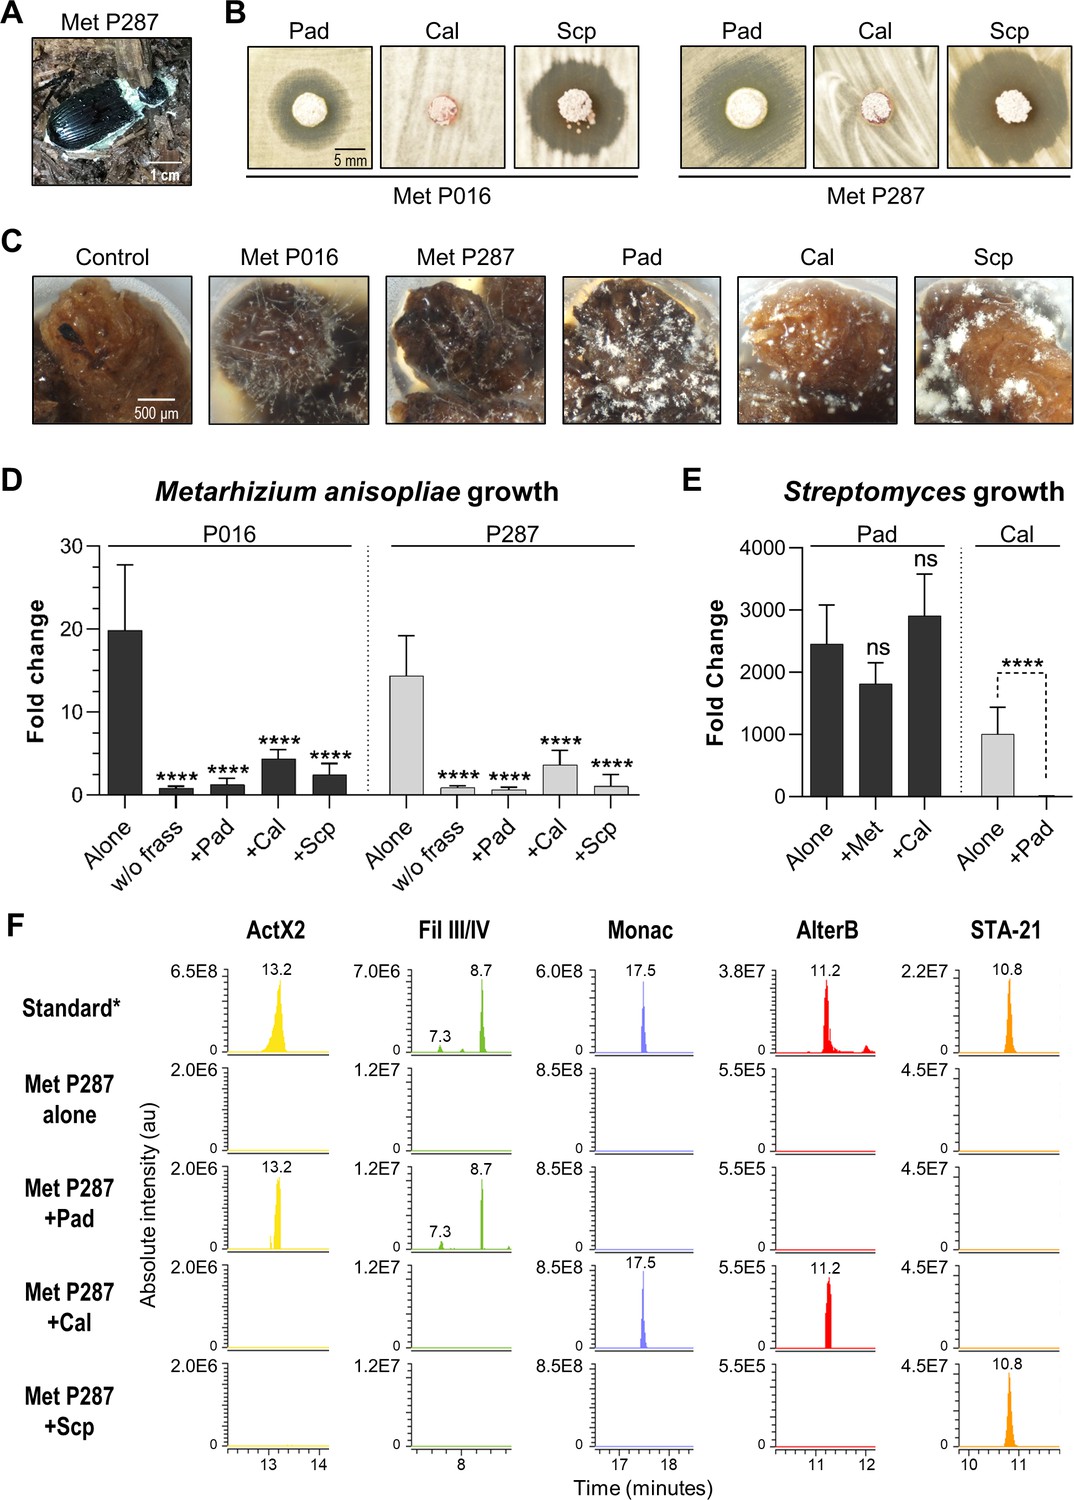
Competitive interactions between key Streptomyces isolates and entomopathogenic fungal strains directly in frass.
(A) Beetle carcass with M. anisopliae P287. (B) Selected streptomycetes displayed a zone of inhibition against wild isolates of M. anisopliae. (C) Each selected microbe growing on frass material after 7 days of incubation (7× magnification). (D) M. anisopliae growth represented in fold change when growing alone versus in the presence of a streptomycete. (E) S. padanus P333 and S. californicus P327 growth represented in fold change when growing alone versus in the presence of another organism. (F) Extracted ion chromatograms of specialized metabolites detected in treatments containing M. anisopliae P287. *Standard: a mixture of crude ethyl acetate extracts of International Streptomyces Project 2 (ISP2)-agar cultures of the three streptomycetes. Pad: S. padanus P333; Cal: S. californicus P327; Scp: S. scopuliridis P239; Met: M. anisopliae; w/o frass: microbe added to an empty microtube; Alone: single microbe; ActX: actinomycin X2; FilIII/IV: filipins III and IV; Monac: monactin; AlterB: alteramide B. Bars represent means (+ SD) of growth in fold change from time 0 to day 7 of incubation (sample size: eight independent biological replicates). Statistical significance was measured by comparing treatments to microbes grown alone on frass using t-test when comparing two groups or ANOVA followed by Tukey’s test when comparing more than two groups. ns: statistically not significant. ****p<0.0001. See Figure 6—figure supplements 1–3 for additional results.
-
Figure 6—source data 1
Growth in fold change of each microbe in each one of the treatments tested in the competition in frass assay.
Pad: S. padanus P333; Cal: S. californicus P327; Scp: S. scopuliridis P239; Met: M. anisopliae; Strept: Streptomyces.
- https://cdn.elifesciences.org/articles/65091/elife-65091-fig6-data1-v1.xlsx
Figure 6—figure supplement 1
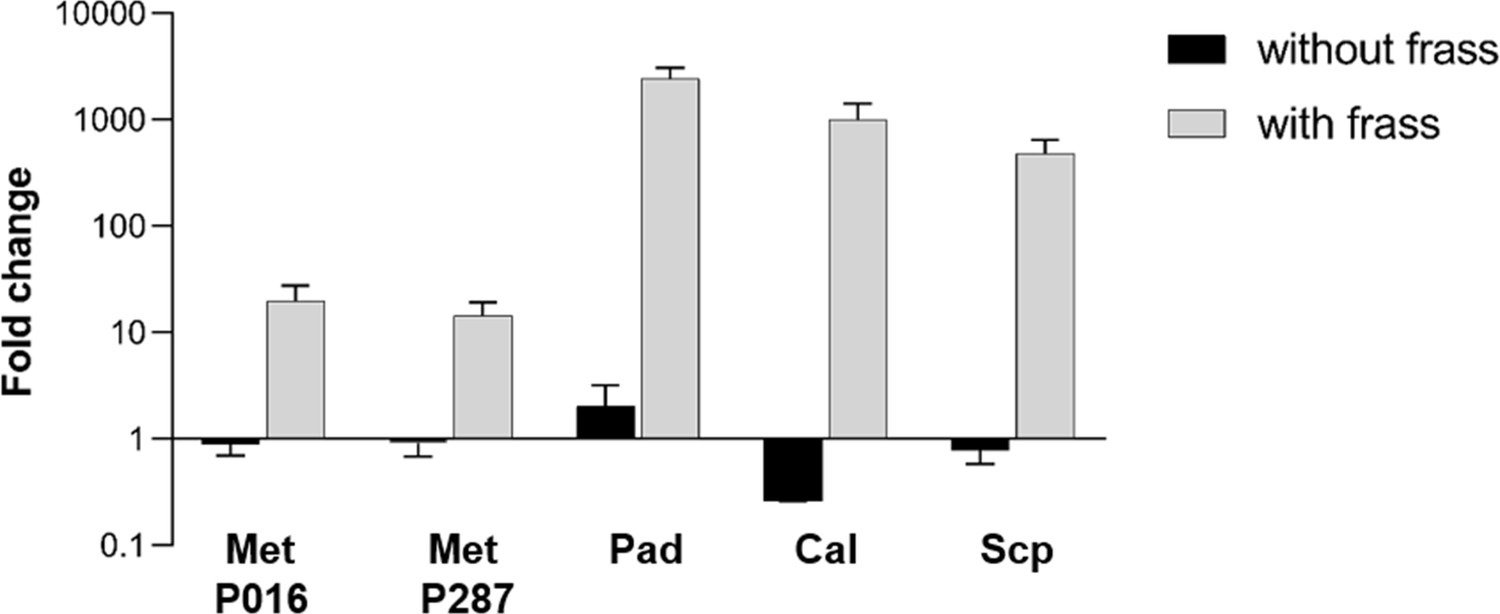
All microbes used in the interaction on frass assay were able to use the frass material as a substrate for growth.
Bars represent means (+ SD) of fold change in growth of each microbe in microtubes with and without frass material after 7 days of incubation (compared to the initial inoculum; sample size: eight independent biological replicates). Met P016: M. anisopliae P016; Met P287: M. anisopliae P287; Pad: S. padanus P333; Cal: S. californicus P327; Scp: S. scopuliridis P239.
Figure 6—figure supplement 2
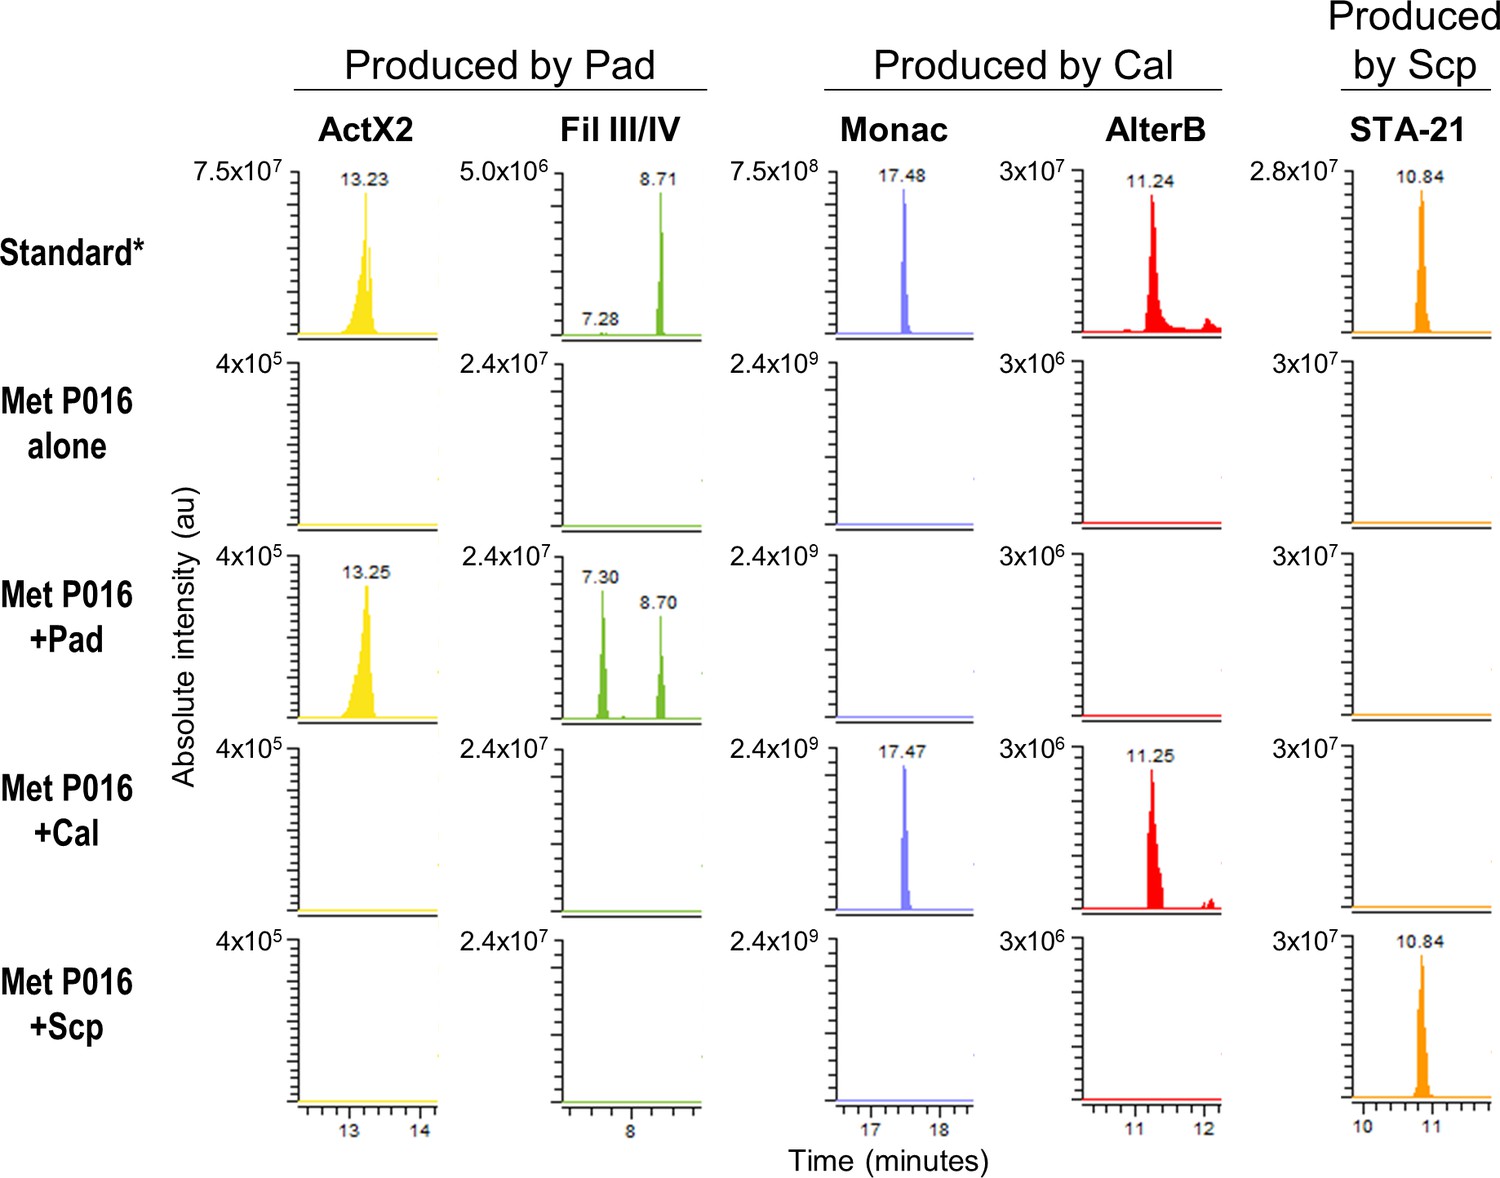
Extracted ion chromatograms of some specialized metabolites detected in treatments containing M. anisopliae P016.
*Standard: a mixture of crude ethyl acetate extracts of International Streptomyces Project 2 (ISP2)-solid cultures of the three streptomycetes. Pad: S. padanus P333; Cal: S. californicus P327; Scp: S. scopuliridis P239; Met: M. anisopliae; ActX: actinomycin X2; FilIII/IV: filipins III and IV; Monac: monactin; AlterB: alteramide B.
Figure 6—figure supplement 3
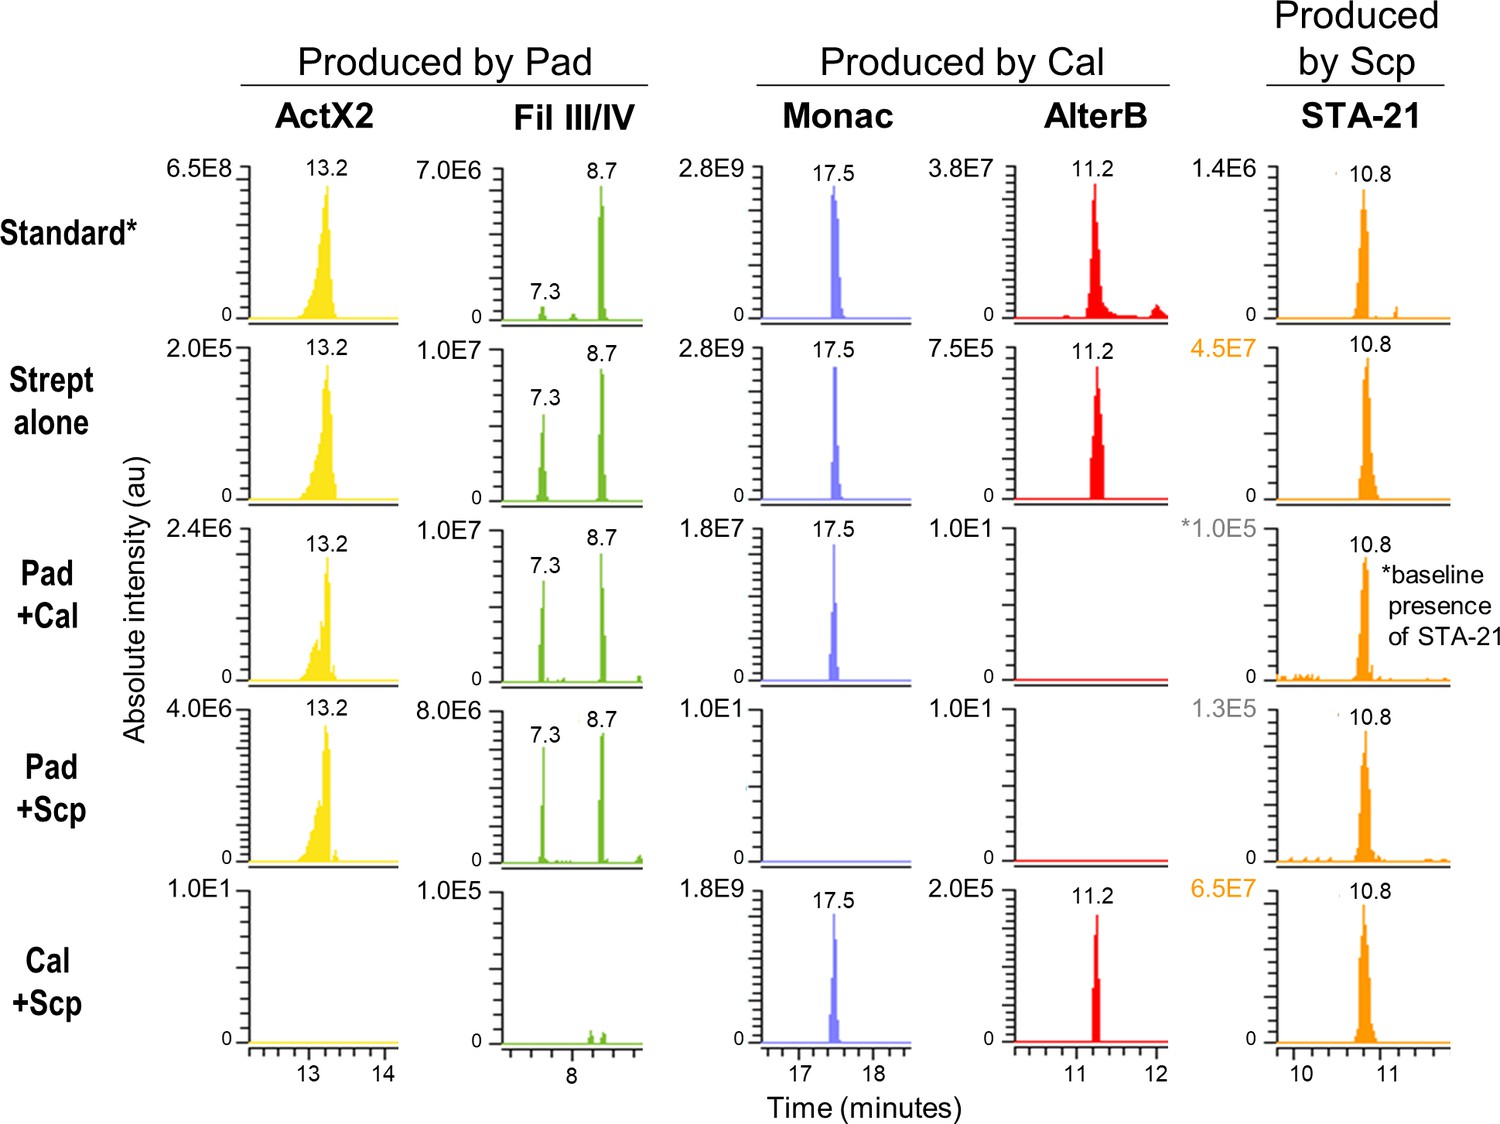
Extracted ion chromatograms of some specialized metabolites detected in treatments containing streptomycetes only.
Note that the absolute intensity of the peaks changes depending on the combination of microbes. *Standard: a mixture of crude ethyl acetate extracts of International Streptomyces Project 2 (ISP2)-solid cultures of the three streptomycetes. Pad: S. padanus P333; Cal: S. californicus P327; Scp: S. scopuliridis P239; ActX: actinomycin X2; FilIII/IV: filipins III and IV; Monac: monactin; AlterB: alteramide B. Please note that compound STA-21, produced by Scp, was already present at a low intensity in the frass material since it is an extremely common compound in this environment; therefore, it was detected in all the treatments. We used the intensity observed in the treatment Pad+Cal as its baseline intensity present in the frass prior to the treatments. Note that its intensity in the treatment Pad+Scp is very close to the baseline, whereas its intensity in the treatment Cal+Scp is similar to the one observed for Scp alone.
Additional files
-
Supplementary file 1
Supplementary Tables S1-6.
Table S1: Geographic location and other abiotic data of sampled beetle galleries. Table S2: Code and description of each microbe isolated from bessbug galleries. Antagonism assay results are represented in size of the zone of inhibition in millimeters. Table S3: Compounds detected in the frass of each gallery with their respective observed m/z of different adducts, retention time (Rt), peak height, and presence of MS2 spectrum. Compounds 1-13, 24 and 26 were annotated at level 1 identification if a MS2 spectrum of at least one adduct was detected, otherwise, they were annotated at level 2 identification. Compounds 16 and 17 were annotated at level 2 identification. Compounds 14 and 15 were annotated at level 3 identification. Table S4: Peak heights of compounds detected in each technical replicate of the LC-MS analyses of the environmental frass. Table S5: Details on the annotation of each compound. Table S6: GenBank accession number of each sequenced gene for microbial strains that were included in the phylogenetic study.
- https://cdn.elifesciences.org/articles/65091/elife-65091-supp1-v1.xlsx
-
Supplementary file 2
Extracted ion chromatogram (EIC, showing retention time) and MS2 spectra of each compound annotated at identification level 1 (actinomycin D, actinomycin X2, STA-21, rubiginone B2, cycloheximide, nonactin, monactin, dinactin, trinactin, tetranactin, filipin I, filipin II, filipin III, antimycin A, nocardamine, bafilomycin A1, bafilomycin B1, novobiocin, piericidin A, nigericin, beauvericin), comparing a commercial standard (top) to the culture extract of an exemplary microbe or environmental frass extract (bottom).
- https://cdn.elifesciences.org/articles/65091/elife-65091-supp2-v1.pdf
-
Supplementary file 3
MS2 spectra of each compound annotated at identification level 2 (alteramide A, alteramide B, surugamide A), comparing a spectrum detected in the culture extract of an exemplary microbe (top) to a publicly available spectrum on the MassIVE repository (bottom).
Publicly available spectra can be found at: alteramide A, alteramide B: f.MSV000079516/ccms_peak/Labelled/R5_lab_J1074_pre.mzXML; surugamide A: f.MSV000079519/ ccms_peak/Unlabelled/A1_unlab_J1074_pre.mzXML (accessed on June 2020).
- https://cdn.elifesciences.org/articles/65091/elife-65091-supp3-v1.pdf
-
Supplementary file 4
MS2 spectrum of each compound putatively annotated at identification level 3 (filipin IV, fungichromin), detected in the culture extract of an exemplary microbe.
Annotations were made based on fragmentation similarities with other analogs of the same family annotated at identification level 1 (filipins I–III).
- https://cdn.elifesciences.org/articles/65091/elife-65091-supp4-v1.pdf
-
Supplementary file 5
Three exemplary total ion chromatograms (TICs) of the LC-MS/MS analysis performed on environmental samples.
(A) Pupal chamber material; (B, C) old frass, plus the extracted ion chromatogram (EIC) of an exemplary compound detected in each sample. The MS1 spectrum refers to the main peak detected on each EIC, highlighting two adducts of each compound.
- https://cdn.elifesciences.org/articles/65091/elife-65091-supp5-v1.pdf
-
Supplementary file 6
Strains of Streptomyces padanus were isolated from 19/22 of the sampled O. disjunctus galleries.
(A) S. padanus P333 growing on an ISP2-agar plate after 7 days of incubation at 30°C. (B) Galleries that S. padanus was isolated from.
- https://cdn.elifesciences.org/articles/65091/elife-65091-supp6-v1.pdf
-
Supplementary file 7
Average coverage distribution of Streptomyces-derived genes identified in the metagenome of the different gut compartments of O. disjunctus.
The figure shows the prevalence of the Streptomyces-derived genes in all four gut compartments with significantly higher normalized-coverage in the posterior hindgut (PHG), the region where frass is compacted prior to its excretion. In each boxplot, a point represents a single gene per category and its detected coverage, and the diamond symbols represent the mean. The box boundaries represent the first and third quartiles of the distribution, and the median is represented as the horizontal line inside each box. Boxplots whiskers span 1.5 times the interquartile range of the distribution. FG: foregut; MG: midgut; AHG: anterior hindgut. Statistical differences were evaluated with Kruskal–Wallis test, and pairwise comparisons were done using a two-sided Wilcoxon test with p-values adjusted using the Benjamini–Hochberg method. Contigs and RPKM-normalized coverage data reported in Ceja-Navarro et al., 2019 were used to generate this figure. Contigs were aligned against the NCBI non-redundant database using the DIAMOND software (Buchfink et al., 2015) and the ‘long reads’ option. The obtained alignment was imported into MEGAN (Huson et al., 2018) and the taxonomy assigned using MEGAN’s LCA algorithm for long reads. Coverage data across the four regions of O. disjunctus’ gut was retrieved for contigs identified as taxonomically derived from Streptomyces sp.
- https://cdn.elifesciences.org/articles/65091/elife-65091-supp7-v1.pdf
-
Supplementary file 8
Metarhizium anisopliae strains P016 and P287 phenotypes after 10 days growing on PDA plates incubated at 25°C under constant light.
Magnification: 7×.
- https://cdn.elifesciences.org/articles/65091/elife-65091-supp8-v1.pdf
-
Transparent reporting form
- https://cdn.elifesciences.org/articles/65091/elife-65091-transrepform-v1.pdf
Download links
A two-part list of links to download the article, or parts of the article, in various formats.
Downloads (link to download the article as PDF)
Open citations (links to open the citations from this article in various online reference manager services)
Cite this article (links to download the citations from this article in formats compatible with various reference manager tools)
Multiple lineages of Streptomyces produce antimicrobials within passalid beetle galleries across eastern North America
eLife 10:e65091.
https://doi.org/10.7554/eLife.65091


