A genetic screen in macrophages identifies new regulators of IFNγ-inducible MHCII that contribute to T cell activation
- Department of Microbiology and Physiological Systems, University of Massachusetts Medical School, United States
- Department of Microbiology & Molecular Genetics, College of Osteopathic Medicine, Michigan State University, United States
- Division of Infectious Disease and Immunology, Department of Medicine, University of Massachusetts Medical School, United States
Figures
Figure 1 with 2 supplements
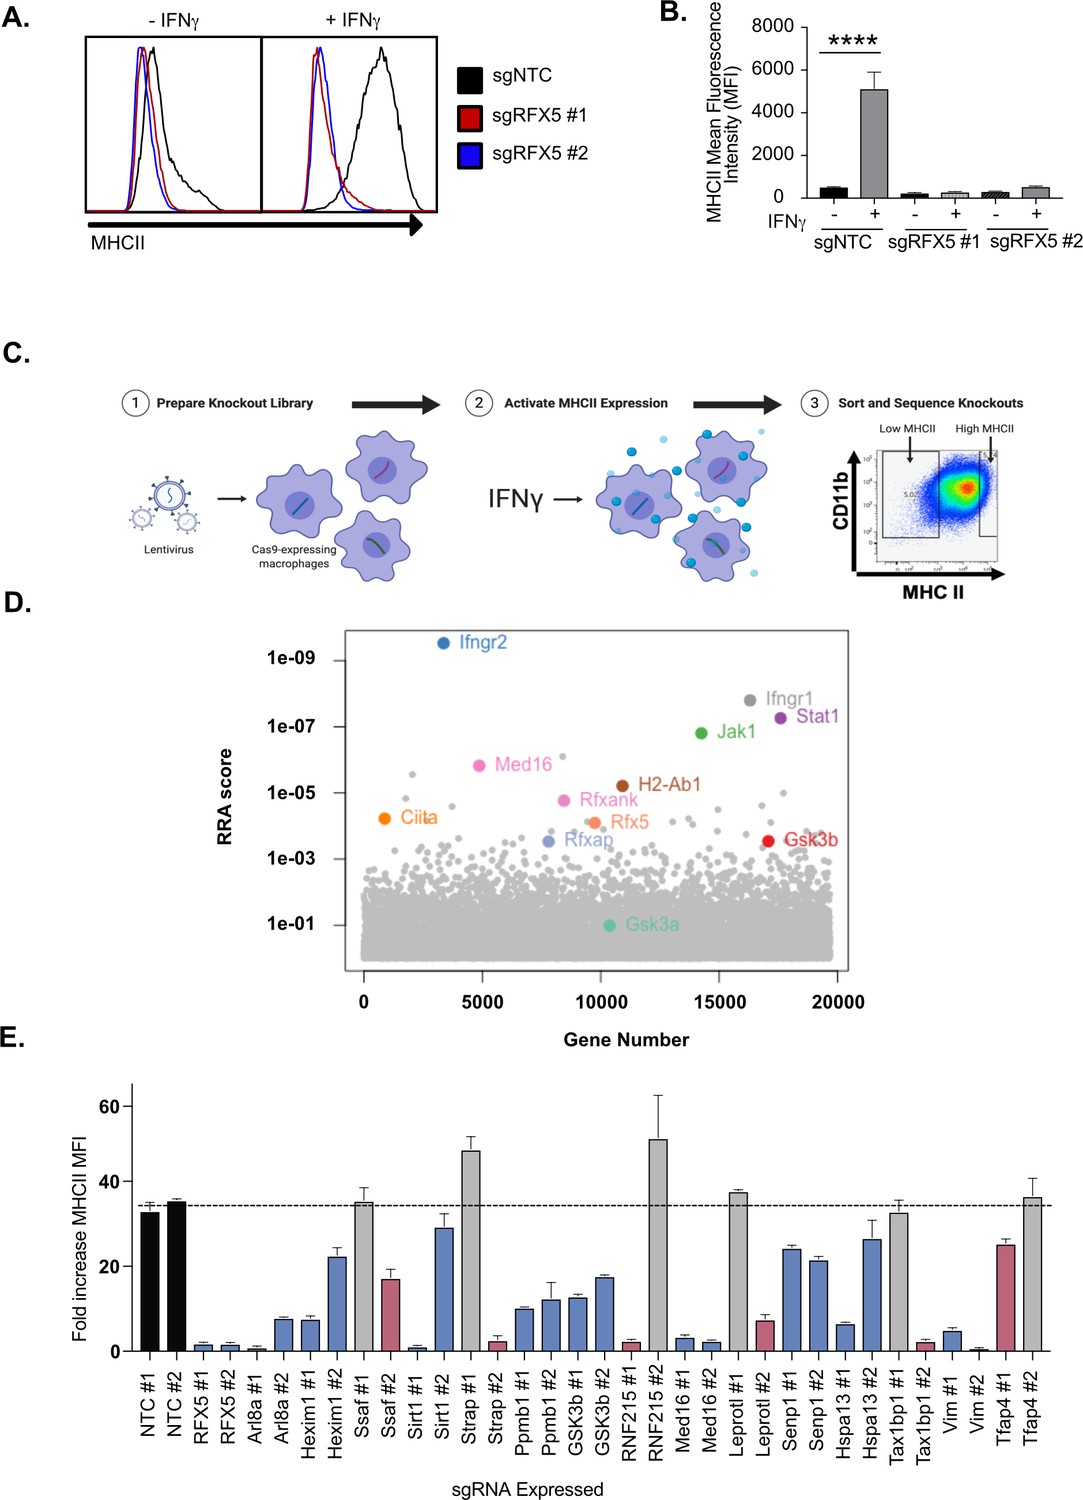
Genome-wide CRISPR Cas9 screen identifies regulators of IFNγ-dependent MHCII expression.
(A) Cas9+ iBMDMs (Clone L3) expressing the indicated sgRNAs were left untreated or treated with IFNγ (6.25 ng/ml) for 24 hours. Surface MHCII was quantified by flow cytometry. Shown is a representative histogram of MHCII surface staining and (B) the quantification of the mean fluorescence intensity (MFI) in the presence and absence of IFNγ stimulation from three biological replicates. **** p < 0.0001 by one-way ANOVA with tukey correction for multiple hypotheses. These data are representative of three independent experiments. (C) A schematic representation of the CRISPR-Cas9 screen conducted to identify regulators of IFNγ-inducible MHCII surface expression on macrophages. A genome-wide CRISPR Cas9 library was generated in L3 cells using sgRNAs from the Brie library (four sgRNAs per gene). The library was treated with IFNγ and MHCIIhi and MHCIIlow populations were isolated by FACS. The representation of sgRNAs in each population in addition to input library were sequenced. (D) Shown is score for each gene in the CRISPR-Cas9 library that passed filtering metrics as determined by the alpha-robust rank algorithm (a-RRA) in MAGeCK from two independent screen replicates. (E) The L3 clone was transduced with the indicated sgRNAs for candidates (two per candidate gene) in the top 100 candidates from the CRISPR-Cas9 screen. All cells were left untreated or treated with 10 ng/µl of IFNγ for 24 hours then were analyzed by flow cytometry. The fold-increase in MFI was calculated for triplicate samples for each cell line (MFI IFNγ+/MFI IFNγ-). The results are representative of at least two independent experiments. Candidates that were significant for two sgRNAs (Red) or one sgRNA (Blue) by one-way ANOVA compared to the mean of NTC1 and NTC2 using Dunnets multiple comparison test. Non-significant results are shown in gray bars.
-
Figure 1—source data 1
CRISPR screen analysis.
- https://cdn.elifesciences.org/articles/65110/elife-65110-fig1-data1-v2.xlsx
Figure 1—figure supplement 1
Optimization of CRISPR-Cas9 editing in iBMDMs.
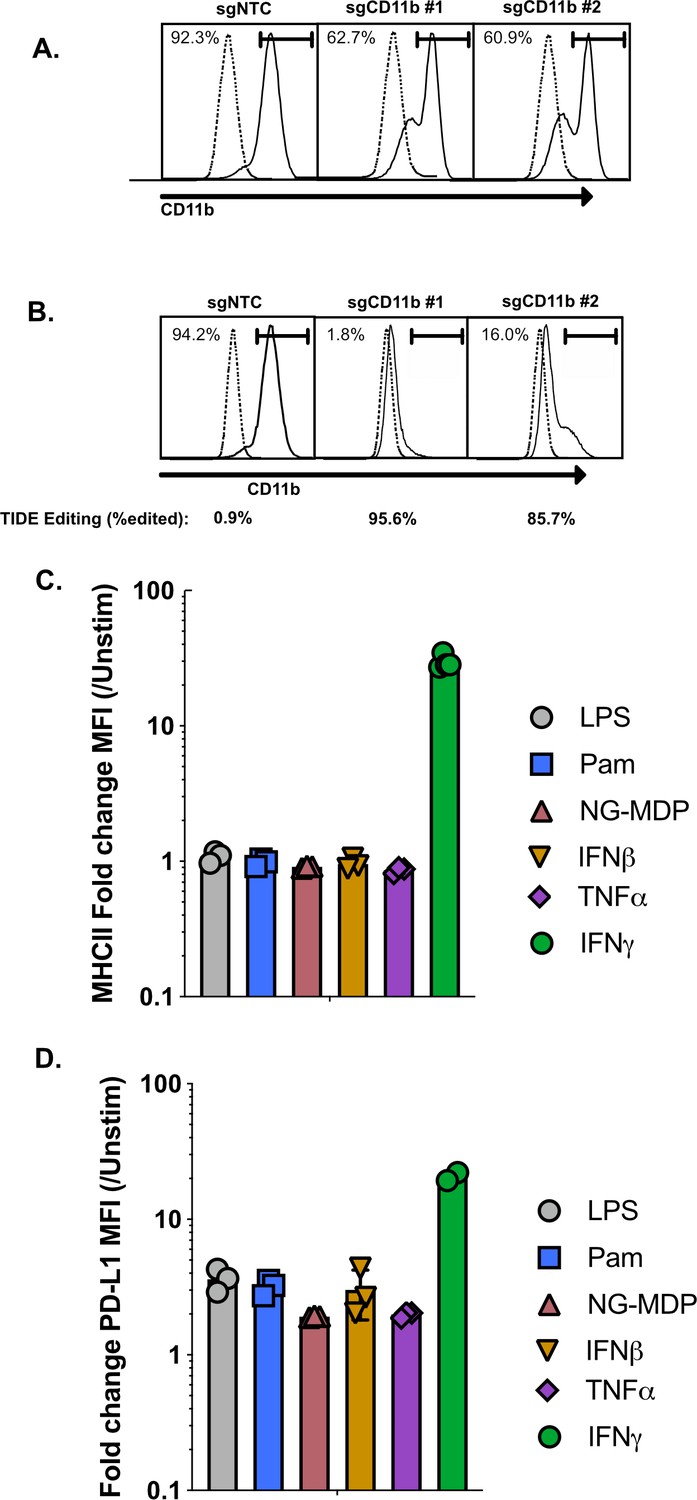
Immortalized C57BL/6 J macrophages were transduced with lentivirus expressing Cas9 then selected using Hygromycin. Polyclonal transductants were then transduced with a second lentivirus encoding two different sgRNAs targeting CD11b or a non-targeting control then selected with puromycin. (A) Transductants were then stained for surface CD11b one-week later and analyzed by flow cytometry. Shown is a representative histogram of CD11b from the polyclonal Cas9 line. Dotted line is unstained controls (B) Single-cell clones were isolated from the polyclonal Cas9 line by limiting dilution. One clone, clone L3 was transduced with two different sgRNAs targeting CD11b or a non-targeting control then selected with puromycin. Transductants were then stained for surface CD11b 1-week later and analyzed by flow cytometry. Shown is a representative histogram of CD11b from the L3 Cas9 clone. The dotted line is the unstained controls. Values under each sample represent the percent editing efficiency using TIDE analysis. (C and D) L3 cells were left untreated or were treated with 10 ng/ml IFNγ, 100 ng/nl LPS, 200 ng/ml PAM3Csk4, 200 IU/ml IFNβ, 25 ng/ml TNF or 10 µg/ml NG-MDP for 24 hr then the surface expression of either (C) MHCII or (D) PD-L1 was quantified by flow cytometry. Shown is the fold increase in marker expression compared to untreated L3 cells. These data are representative of two independent experiments.
Figure 1—figure supplement 2
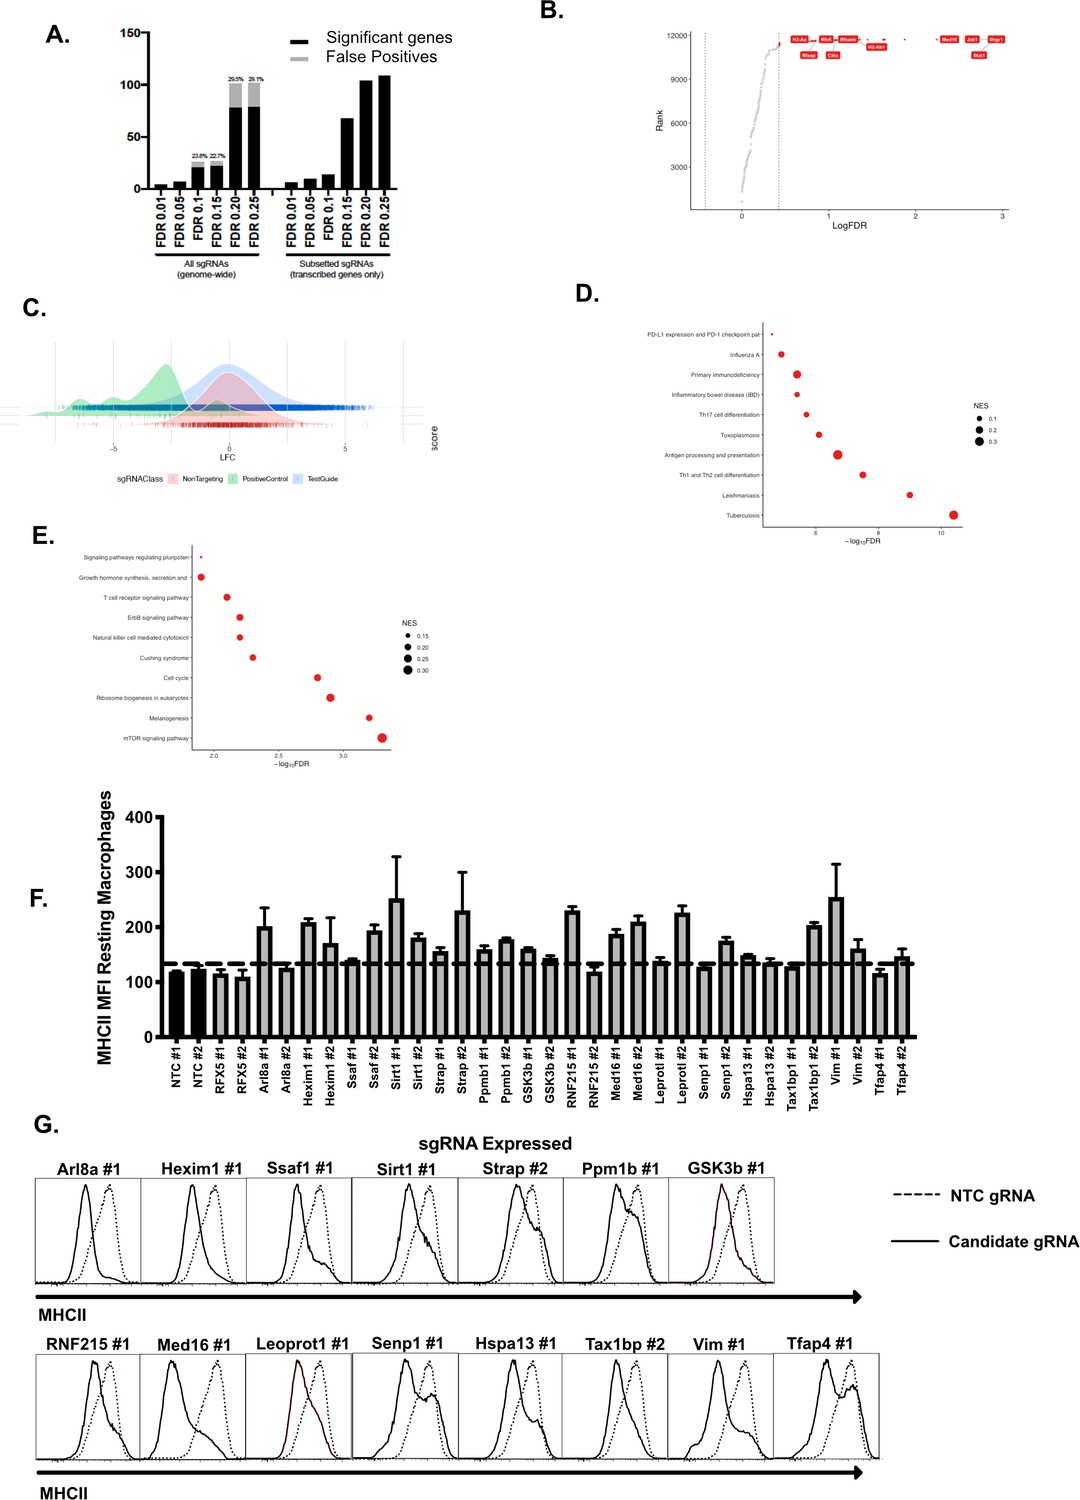
Adaptations to the MAGeCK analysis pipeline identifies high confidence regulators of IFNγ-mediated MHCII expression following a Genome-wide CRISPR Cas9 screen.
(A) At the selected alpha cutoff of 0.025, the number of significant genes by FDR level and the number of false positives (gray bar within black bar) when using all guides; proportion of significant genes that were false positives annotated above each bar (left half). This analysis was repeated using only transcribed genes as determined by RNAseq analysis (Figure 5—source data 1). (B) Genes that passed quality filtering and were expressed within L3 cells at the RNA level as determined by transcriptomics were ranked by the FDR as determined in MAGeCK. Highlighted in Red are the top hits many of which are within the canonical IFNγ-signaling and MHCII expression pathway. Vertical dotted lines indicate genes that are below a calculated FDR of.2 and include the follow-up candidates Med16 and GSK3β. (C) The distribution of sgRNAs based on the Log2-Fold Change as determined by MAGeCK from three groups of sgRNA targets; Positive controls (Known IFNγ/MHCII pathway), Test Guides (all targeting guides in BRIE library) and non-targeting controls (~1000 included in BRIE library) are shown. Positive control sgRNAs are left shifted compared to negative controls indicating an enrichment in the MHCIIlow population of these sgRNAs. (D) Significant genes from the genome-wide screen were used to identify enriched pathways from the KEGG pathway database. Shown are the top 10 enriched pathways from the screen results indicating a significant enrichment of IFNγ-related pathways ranked by FDR and the size of the circle indicates the Normalized Enrichment Score. (E) To identify new pathways unrelated to IFNγ signaling KEGG pathway enrichment was repeated with the top 11 genes related to IFNγ removed from the query list. Shown are the top 10 pathways that were identified by KEGG ranked by FDR and the size of the circle indicates the Normalized Enrichment Score. (F and G) The L3 clone was transduced with the indicated sgRNAs for candidates in the top 100 candidates from the CRISPR-Cas9 screen. All cells were treated with 10 ng/µl of IFNγ for 24 hr then were analyzed by flow cytometry. (F) Shown is the MHCII mean fluorescence intensity on each targeted macrophage cell line in the absence of IFNγ. (G) Shown are representative flow cytometry plots from the data quantified in Figure 1E. The results are representative of at least two independent experiments. *p < 0.05, **p < 0.01, ***p < 0.001 by one-way ANOVA compared to the mean of NTC1 and NTC2 using Dunnets multiple comparison test.
Figure 2 with 1 supplement
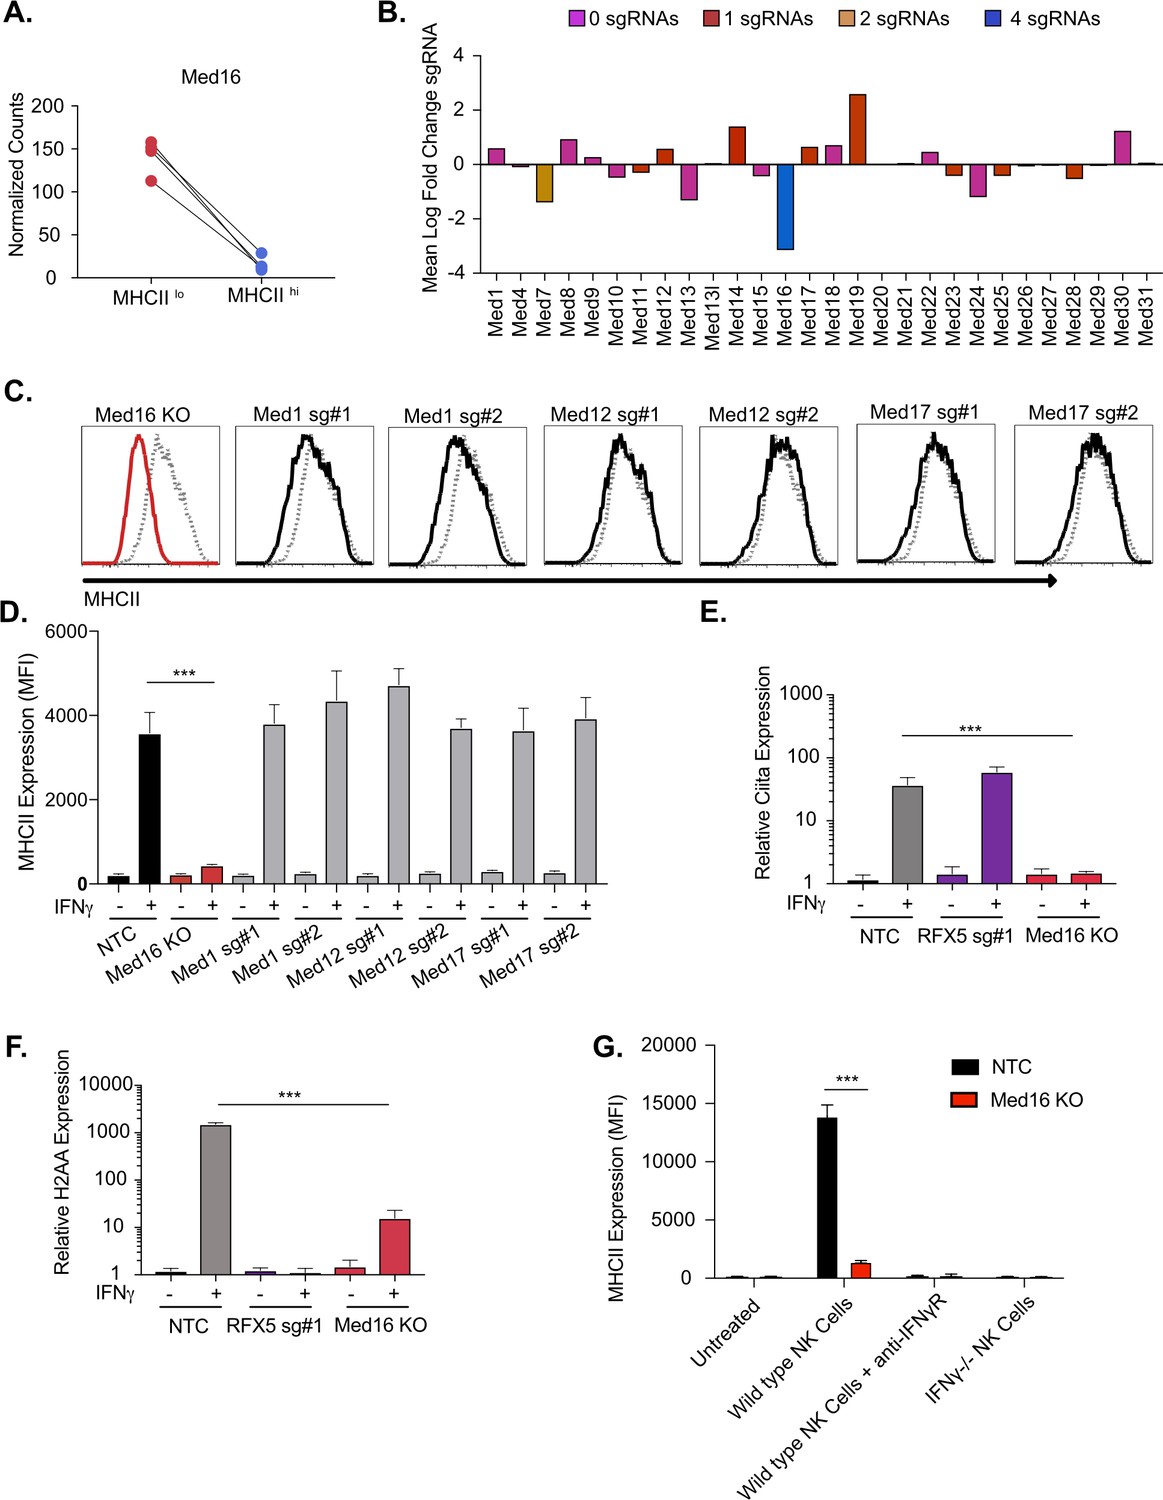
The mediator complex subunit MED16 is uniquely required for IFNγ-mediated MHCII surface expression.
(A) Shown is the normalized mean read counts from FACS sorted MHCIIlow and MHCIIhi populations for the four sgRNAs targeting Med16 within the genome-wide CRISPR-Cas9 library. (B) The mean of the log fold change (normalized counts in MHCIIhi/normalized counts in MHCIIlow) for each mediator complex subunit that passed quality control metrics described in Materials and methods. The bar colors indicate the number of sgRNAs out of four possible that pass the alpha cutoff using the MAGeCK analysis pipeline as described in material and methods. (C) Med16 KO cells or L3 cells targeted with the indicated sgRNA were left untreated or were treated with 6.25 ng/ml of IFNγ for 18 hours. Cells were then analyzed for surface MHCII expression by flow cytometry. Shown are representative comparing the MHCII surface expression of indicated mediator complex subunit (Black solid line) treated with IFNγ overlayed with NTC (Gray-dashed line) treated with IFNγ. (D) Quantification of the MFI of surface MHCII from the experiment in (C) from three biological replicates. These results are representative of two independent experiments. (E) NTC L3 cells, RFX5 sg#1 cells, and Med16 KO cells were left untreated or were treated with 6.25 ng/ml of IFNγ. 18 hours later cells RNA was isolated and qRT-PCR was used to determine the relative expression of Ciita and (F) H-2aa compared to GAPDH controls from three biological replicates. (G) NK cells from wild type or IFNγ-/- mice were activated with IL12/IL18 overnight then added to NTC or Med16 KO cells in the presence or absence of IFNγR blocking antibody. Twenty-four hours later MHCII expression on macrophages was quantified by flow cytometry. The results are representative of three independent experiments. ***p < 0.001 as determined one-way ANOVA compared to NTC cells with a Dunnets test.
Figure 2—figure supplement 1
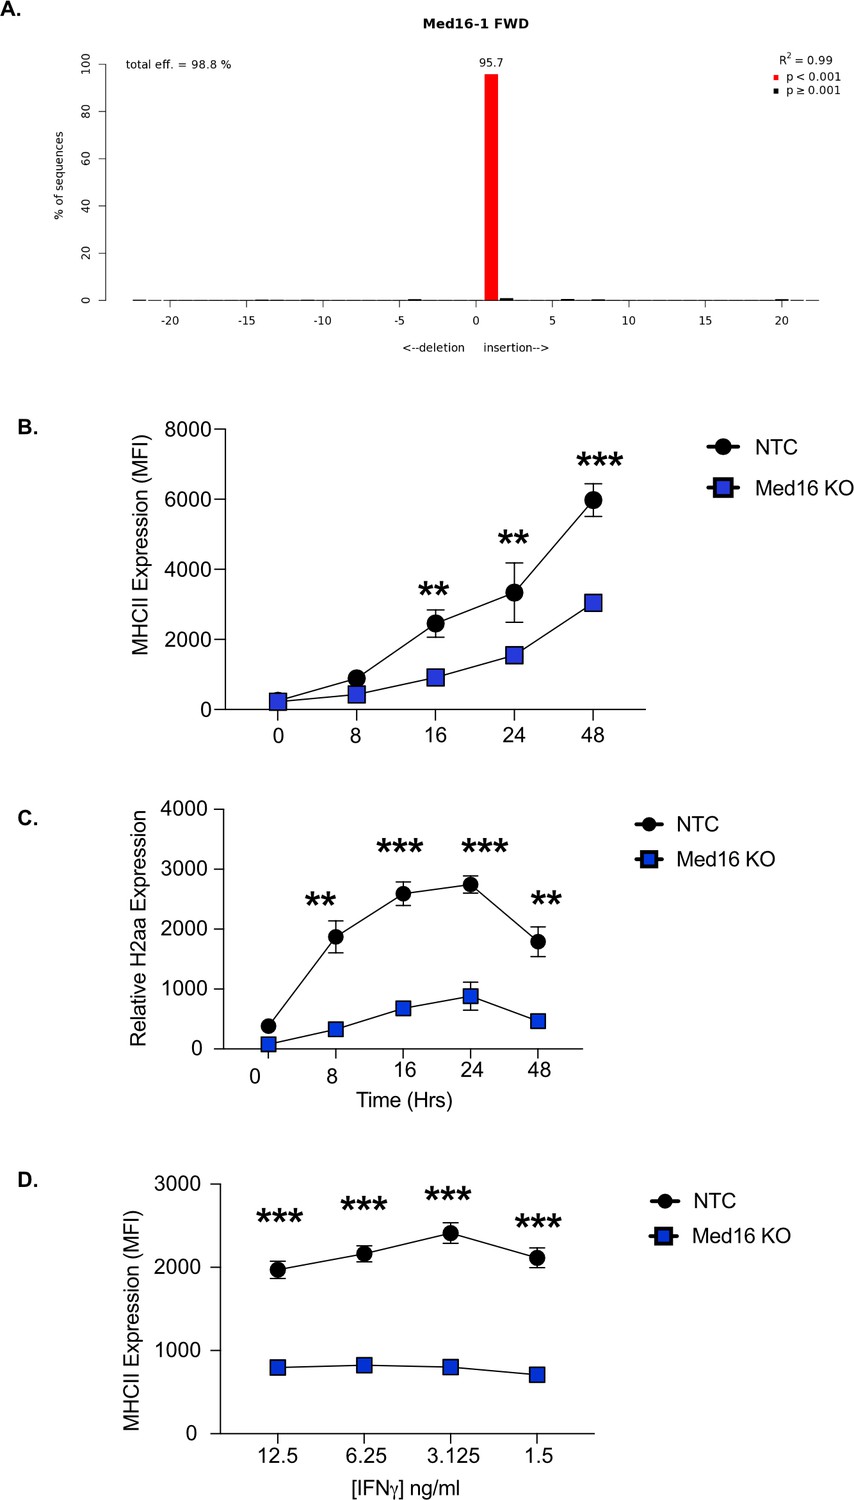
Med16 KO cells are deficient in MHCII expression of a range of IFNγ concentrations and time points.
Genomic DNA was isolated from NTC and Med16 KO cells and the PCR was used to amplify the region encoding Med16. TIDE analysis was used to quantify the editing efficiency of the indels in each cell line using trace plots following Sanger sequencing. Shown is the TIDE analysis profile indicating the percent editing efficiency for (A) Med16 KO compared to NTC controls. (B and C) Med16 KO or NTC cells were stimulated with 10 ng/ml IFNγ and at the indicated timepoints cells were either (B) analyzed by flow cytometry for surface expression of MHCII or (C) RNA was isolated and qRT-PCR was used to determine the relative expression of CIITA. Data are representative of three independent experiments with at least three biological replicates per group. **p < 0.01 ***p < 0.001 by two-way ANOVA. (D) Med16 KO or NTC cells were stimulated with the indicated concentration of IFNγ and 24 hours later the surface expression of MHCII was quantified by flow cytometry. Shown are biological triplicates from a single replicate of three independent experiments. ***p < 0.001 by two-way ANOVA.
Figure 3 with 1 supplement
GSK3β and GSK3α coordinate IFNγ-mediated CIITA and MHCII expression.
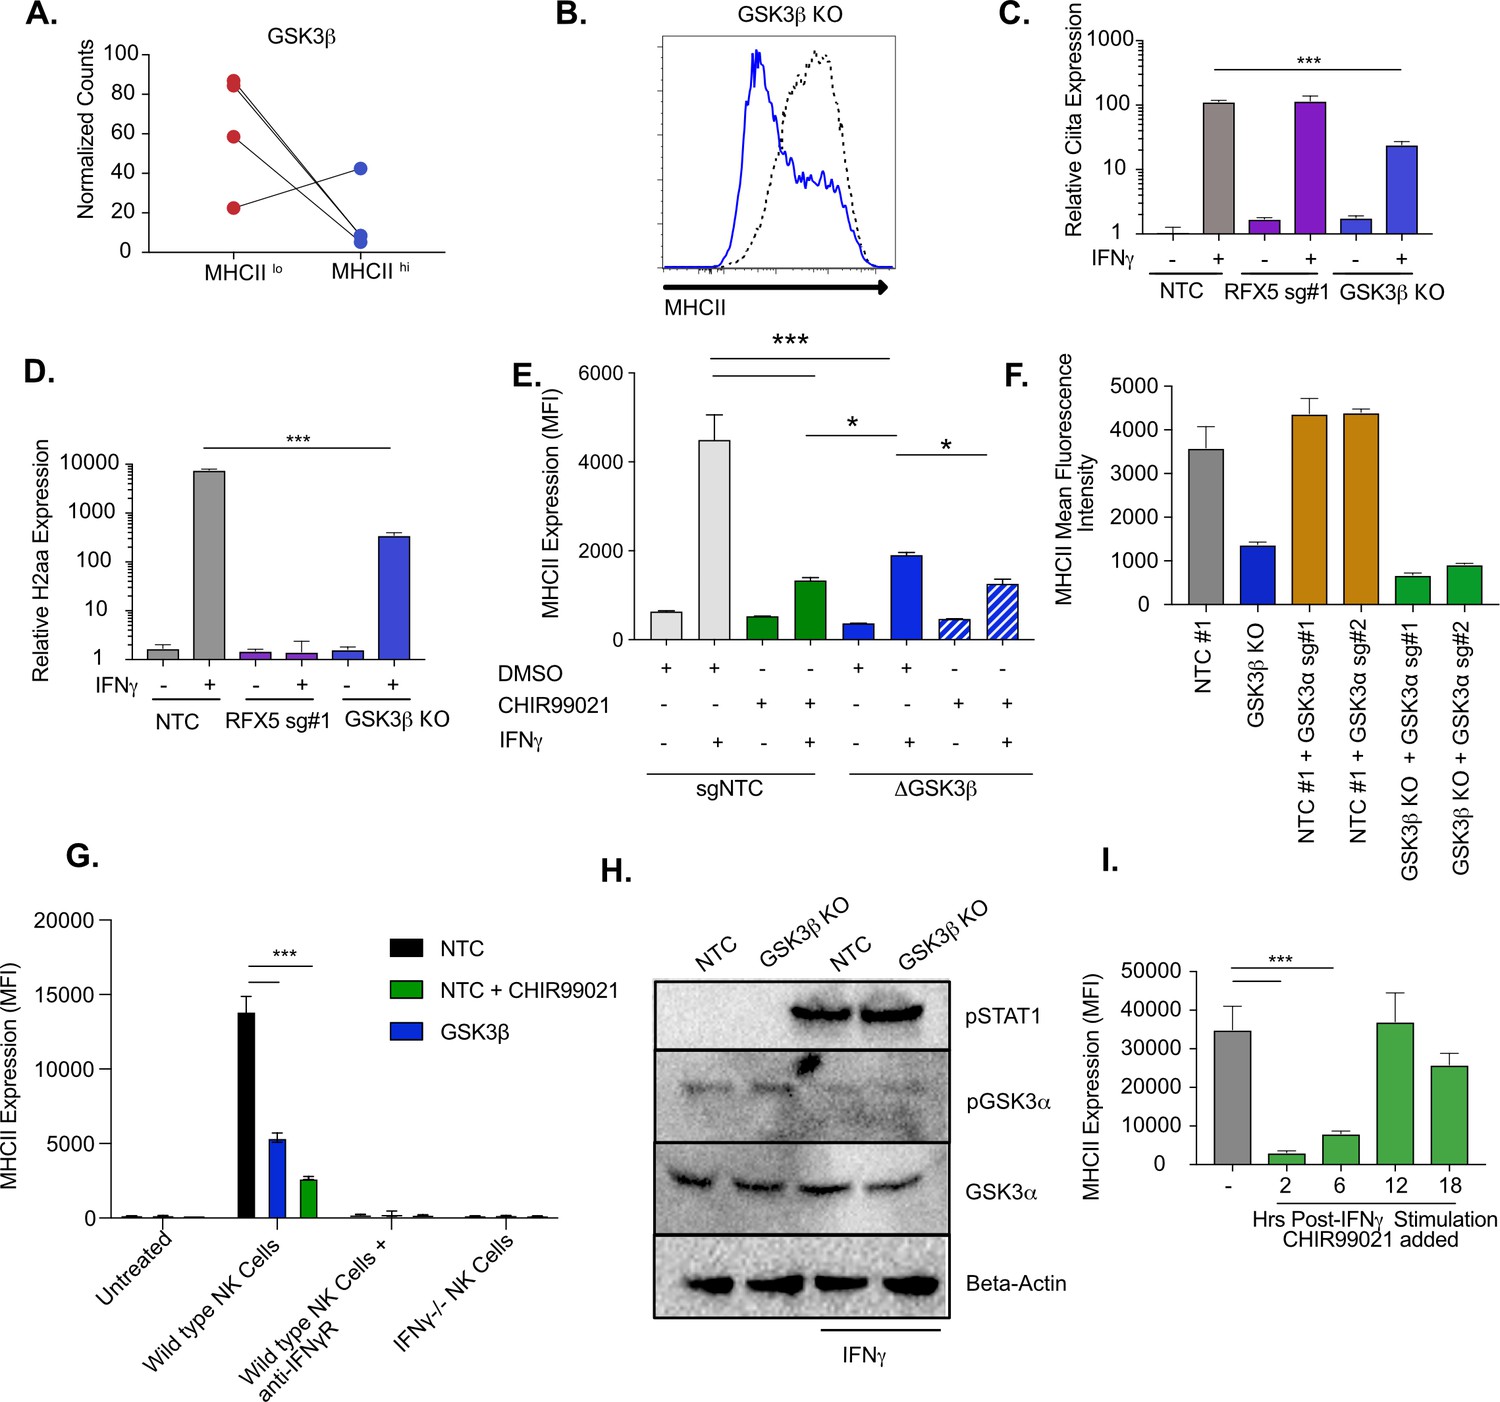
(A) Shown is the normalized mean read counts from FACS sorted MHCIIlow and MHCIIhigh populations for the four sgRNAs targeting Gsk3b within the genome-wide CRISPR-Cas9 library. (B) NTC L3 cells and Gsk3b KO cells were treated with 6.25 ng/ml of IFNγ. Eighteen hr later, cells were stained for surface MHCII and analyzed by flow cytometry. Shown is a representative flow cytometry plot overlaying Gsk3b KO (blue line) with NTC (grey line). The results are representative of five independent experiments. (C) NTC L3 cells, Rfx5 sg#1 cells, and Gsk3b KO cells were left untreated or were treated with 6.25 ng/ml of IFNγ. Eighteen hr later, cells RNA was isolated and qRT-PCR was used to determine the relative expression of Ciita and (D) H2aa compared to Gapdh controls from three biological replicates. The results are representative of three independent experiments. (E) NTC L3 cells or Gsk3β KO were treated with DMSO or 10 μM CHIR99021 as indicated then left untreated or stimulated with IFNγ for 18 hr. MHCII surface expression was then quantified by flow cytometry. The mean fluorescence intensity was quantified from three biological replicates. These results are representative of three independent experiments. (F) L3 cells or Gsk3b KO transduced with the indicated sgRNAs were treated with IFNγ and 18 hr later the surface levels of MHCII were quantified by flow cytometry. The mean fluorescence intensity of surface MHCII was quantified from three biological replicates from this experiment that is representative of 4 independent experiments. (G) NK cells from wild type or IFNγ-/- mice were activated with IL12/IL18 overnight then added to NTC or Gsk3b KO cells in the presence or absence of IFNγR blocking antibody, 10 μM CHIR99021 or DMSO. Twenty-four hours later, MHCII expression on macrophages was quantified by flow cytometry from three biological replicates. The results are representative of three independent experiments. (H) NTC or Gsk3b KO cells were left untreated or were stimulated with 6.25 ng/ml IFNγ for 30 min. Cell lysates were used for immunoblot analysis with the indicated antibodies for pSTAT1, total GSK3α, pGSK3α, and Beta-actin. (J) Immortalized bone marrow macrophages were treated with IFNγ. Control cells were treated with DMSO and for the remaining cells CHIR999021 was added at the indicated times following IFNγ treatment. 24 hours after IFNγ stimulation the levels of surface MHCII were quantified by flow cytometry. Shown is the MFI for biological triplicate samples. ***p < 0.001 **p < 0.01 *p < 0.05 by one-way ANOVA with a Tukey Correction test.
-
Figure 3—source data 1
Raw Blots.
- https://cdn.elifesciences.org/articles/65110/elife-65110-fig3-data1-v2.zip
-
Figure 3—source data 2
Labeled Blots.
- https://cdn.elifesciences.org/articles/65110/elife-65110-fig3-data2-v2.zip
Figure 3—figure supplement 1
Gsk3β and GSK3α coordinate MHCII expression in macrophages.
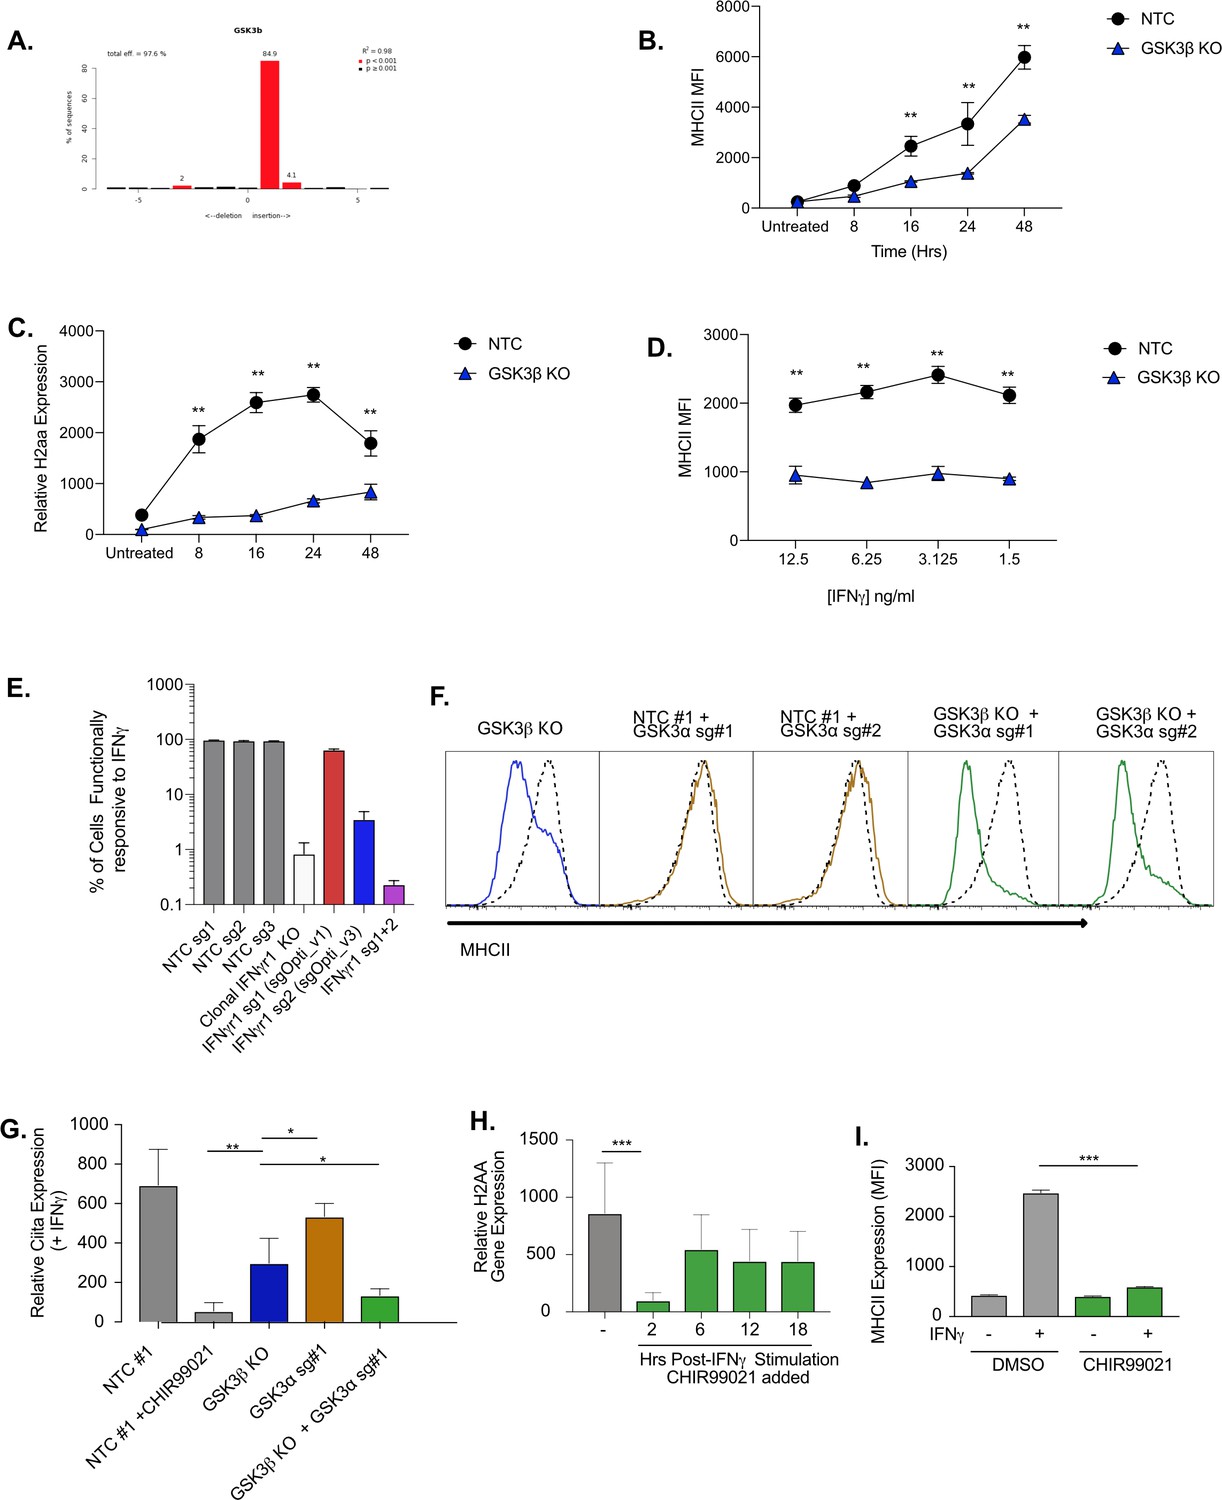
(A) Genomic DNA was isolated from NTC and Gsk3β KO cells and the PCR was used to amplify the region encoding GSK3β. TIDE analysis was used to quantify the editing efficiency of the indels in each cell line using trace plots following Sanger sequencing. Shown is the TIDE analysis profile indicating the percent editing efficiency for Gsk3b KO compared to NTC controls. (B and C) Gsk3b KO or NTC cells were stimulated with 10 ng/ml IFNγand at the indicated timepoints cells were either (B) analyzed by flow cytometry for surface expression of MHCII or (C) RNA was isolated and qRT-PCR was used to determine the relative expression of Ciita. Data are representative of three independent experiments with at least three biological replicates per group. **p < 0.01 ***p < 0.001 by two-way ANOVA. (D) Gsk3b KOor NTC cells were stimulated with the indicated concentration of IFNγ and 24 hr later the surface expression of MHCII was quantified by flow cytometry. Shown are biological triplicates from a single replicate of three independent experiments. ***p < 0.001 by two-way ANOVA. NTC controls in B, C and D were also used in Figure 2—figure supplement 1 and multiple tests have been accounted for. (E) Cells transduced with the indicated sgRNAs or a clonal IFNγR KO were left untreated or treated with IFNγ for 24 hr and analyzed by flow cytometry for the surface expression of the IFNγ-inducible marker CD271. Shown is the percent of cells that induced CD271 compared to untreated cells for each cell line. (F) L3 cells or Gsk3β KO transduced with the indicated sgRNAs were treated with IFNγ and 18 hr later the surface levels of MHCII were quantified by flow cytometry. A representative histogram of NTC cells (dotted line) is overlaid with cells targeted with the indicated sgRNA (solid line) after 18 hr of IFNγ treatment. (G) L3 cells or Gsk3β KO transduced with the indicated sgRNAs were treated with IFNγ and 18 hr later RNA was isolated and the expression of Ciita was quantified relative to Gapdh using qRT-PCR. Results are from three independent wells and are representative of two independent experiments. (H) The indicated genotypes were stimulated with IFNγ for 24 hr then RNA was isolated and the relative expression of H2-Aa was quantified relative to GAPDH from biological triplicate samples. The data are representative of three independent experiments. (I) Bone marrow derived macrophages from conditionally immortalized HoxB8 progenitor cells from C57BL/6 J mice were treated with DMSO or 10 μM CHIR99021 and left untreated or stimulated with IFNγ for 18 hours. The MHCII surface levels were then quantified by flow cytometry. Shown is the mean fluorescence intensity from three biological replicates in each condition. ***p < 0.001, **p < 0.01, *p < 0.05 by one-way ANOVA with a Tukey correction test.
Figure 4
GSK3α/β and Med16 function independently from mTORC1 to control IFNγ-mediated MHCII expression.
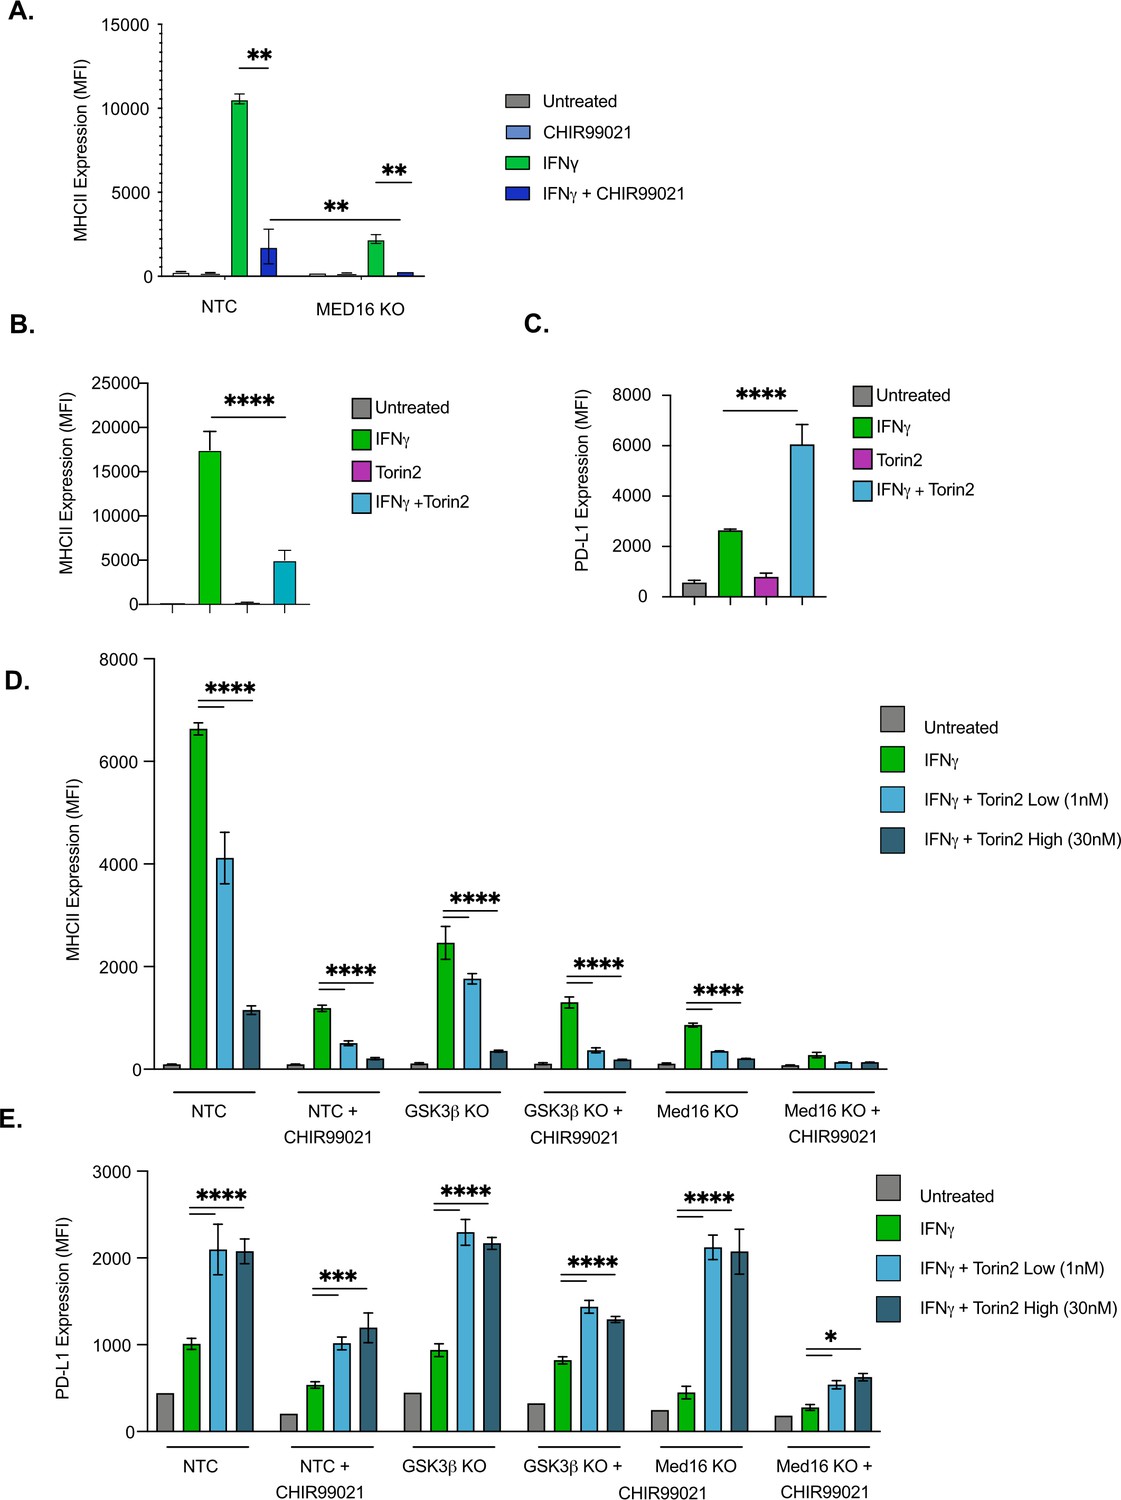
(A) NTC or Med16 KO cells were treated with DMSO or CHIR99021 then left untreated or stimulated with IFNγ overnight. The following day MHC II cell surface expression was determined by flow cytometry. The quantification of the MFI of MHCII from four biological replicates is shown. **p < 0.001 by two-way ANOVA with multiple comparison correction. (B and C) NTC cells were treated with DMSO or 30 nM Torin2 for 2-hr then were stimulated with 6.25 ng/ml IFNγ overnight. Eighteen hr later (B) MHCII expression and (C) PD-L1 expression were quantified by flow cytometry. Shown is the MFI of the indicated marker from three biological replicates and is representative of three independent experiments. (D and E) NTC, Gsk3b KO and Med16 KO cells were treated with DMSO or 10 uM CHIR99021 and/or the indicated Torin2 for 2 hours. Cells were then treated with IFNγ and the surface expression of (D) MHCII and (E) PD-L1 were quantified by flow cytometry. Shown is the MFI of the indicated marker from three biological replicates and is representative of three independent experiments. *p < 0.05, **p < 0.01, ***p < 0.001, **** p < 0.0001 by one or two-way ANOVA with correction for multiple comparisons.
Figure 5 with 1 supplement
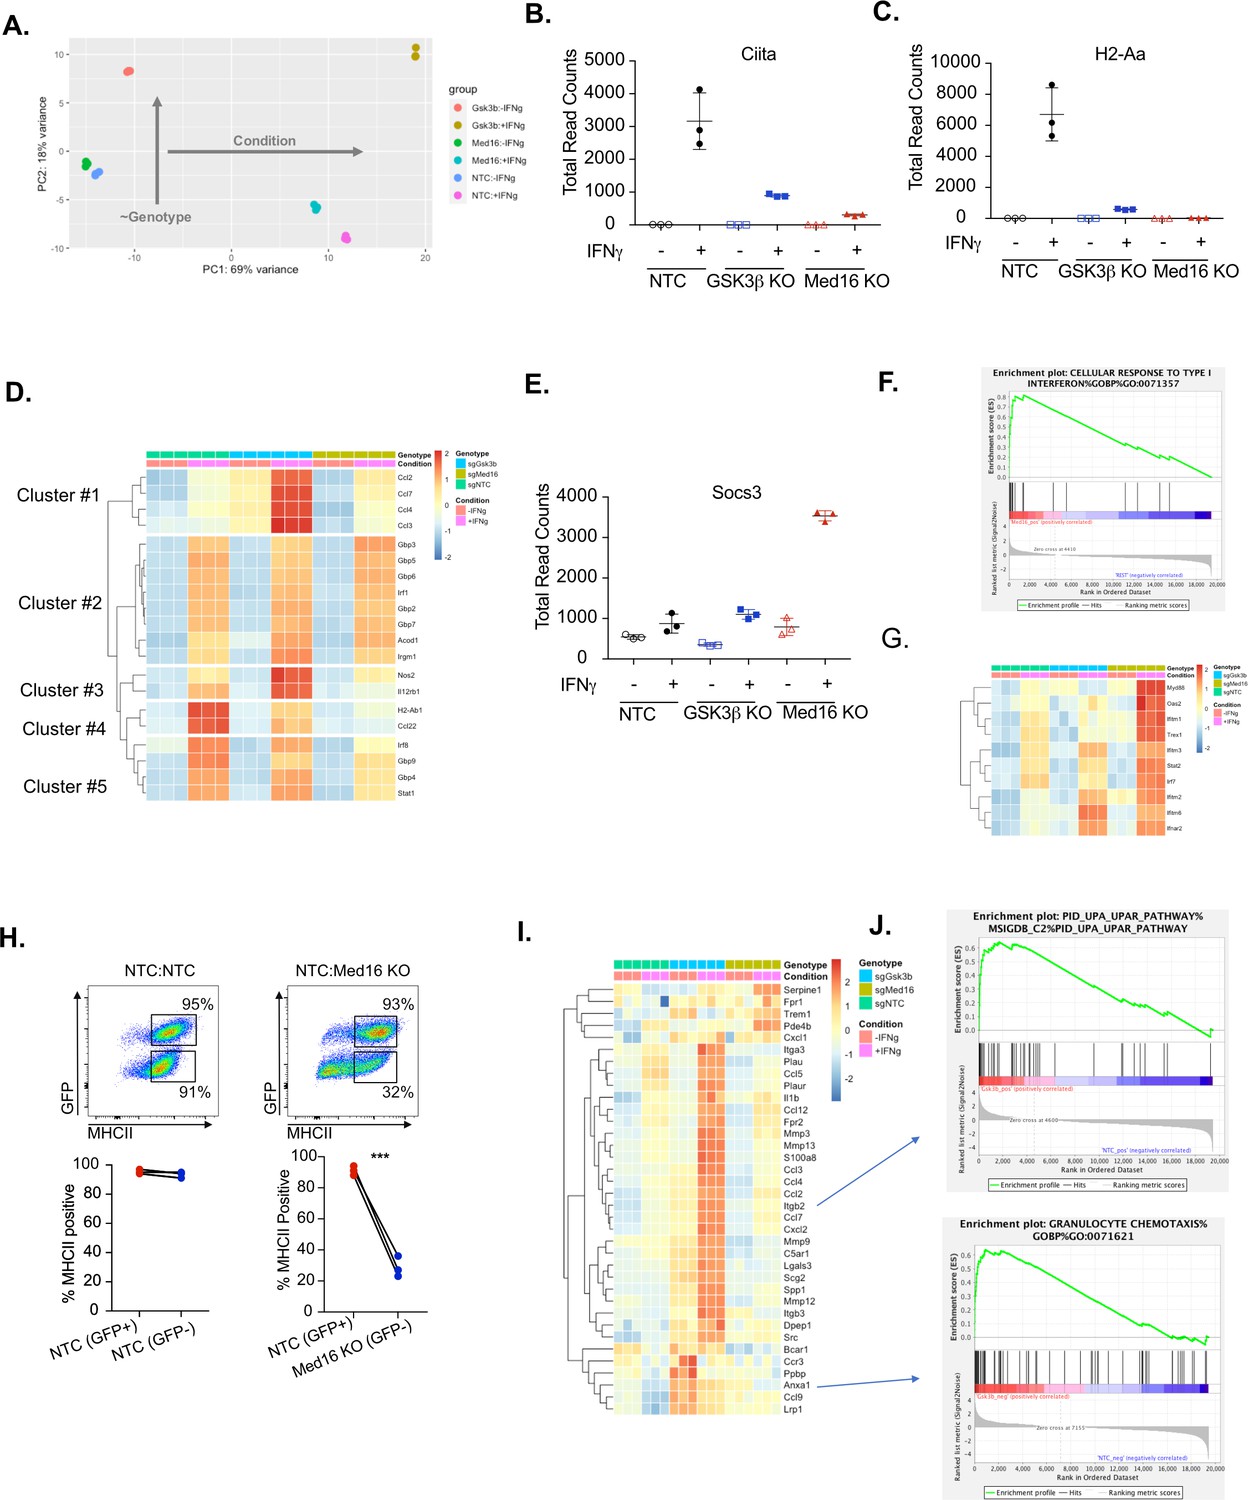
Transcriptomic analysis reveals distinct regulatory mechanisms of IFNγ signaling mediated by MED16 and GSK3β.
(A) The Global transcriptomes of NTC, Gsk3b KO and Med16 KO was determined in the presence and absence of IFNγ-stimulation for 18 hours by RNA sequencing. Shown is the principal component analysis of the transcriptomes from three biological replicates for each condition. Dotplot showing the normalized read counts for (B) CIITA and (C) H2-Aa. (D) Shown is a heatmap showing the relative expression (log normalized, row-scaled) of the most varied 20 genes involved in the cellular response to type II interferon (Gene Ontology GO:0071346). (E) Shown is a Dotplot visualizing the normalized counts of the type I IFN signature Socs3 from all RNAseq conditions. Clustering was used to (F) Significant gene sets from Med16 KO cells that were uniquely regulated from the RNAseq dataset were analyzed by gene set enrichment analysis (GSEA) then subjected to Leading Edge analysis, which identified a significant enrichment of the cellular responses to type I interferons (normalized enrichment score 2.81, FDR < 0.01). (G) Shown is a heatmap demonstrating the relative expression of the type I interferon signature identified in IFNγ-stimualted Med16 KO macrophages from the RNAseq analysis. (H) GFP+ NTC cells were mixed equally with GFP- NTC or GFP- Med16 KO cells. The following day cells were stimulated with 6.25 ng/ml IFNγ and 24 hours later MHCII expression was quantified on each cell type. (Top) Shown is a representative flow cytometry plot to identify the cells of interest and MHCII expression. (Bottom) the % MHCII positive was calculated for cells in each population in each well. Lines link samples that were within the same well. These data are from three biological replicates and represent three independent experiments. **p < 0.01 by two-tailed t-test. (I) Shown is a heatmap demonstrating the relative expression of unique differentially expressed genes from the Gsk3b KO in the presence (Top) and absence (Bottom) of IFNγ-stimulation. (J) These differentially expressed genes were used in GSEA to identify Leading Edge networks that are specific to Gsk3b KO cells. (Top) Shown is the leading-edge analysis of the UPAR pathway that was identified from IFNγ-stimulated Gsk3b KO cells. (Bottom) Shown is the leading-edge analysis of the Granulocyte chemotaxis pathway that was identified as differentially regulated in resting Gsk3b KO cells.
-
Figure 5—source data 1
RNAseq Analysis.
- https://cdn.elifesciences.org/articles/65110/elife-65110-fig5-data1-v2.xlsx
Figure 5—figure supplement 1
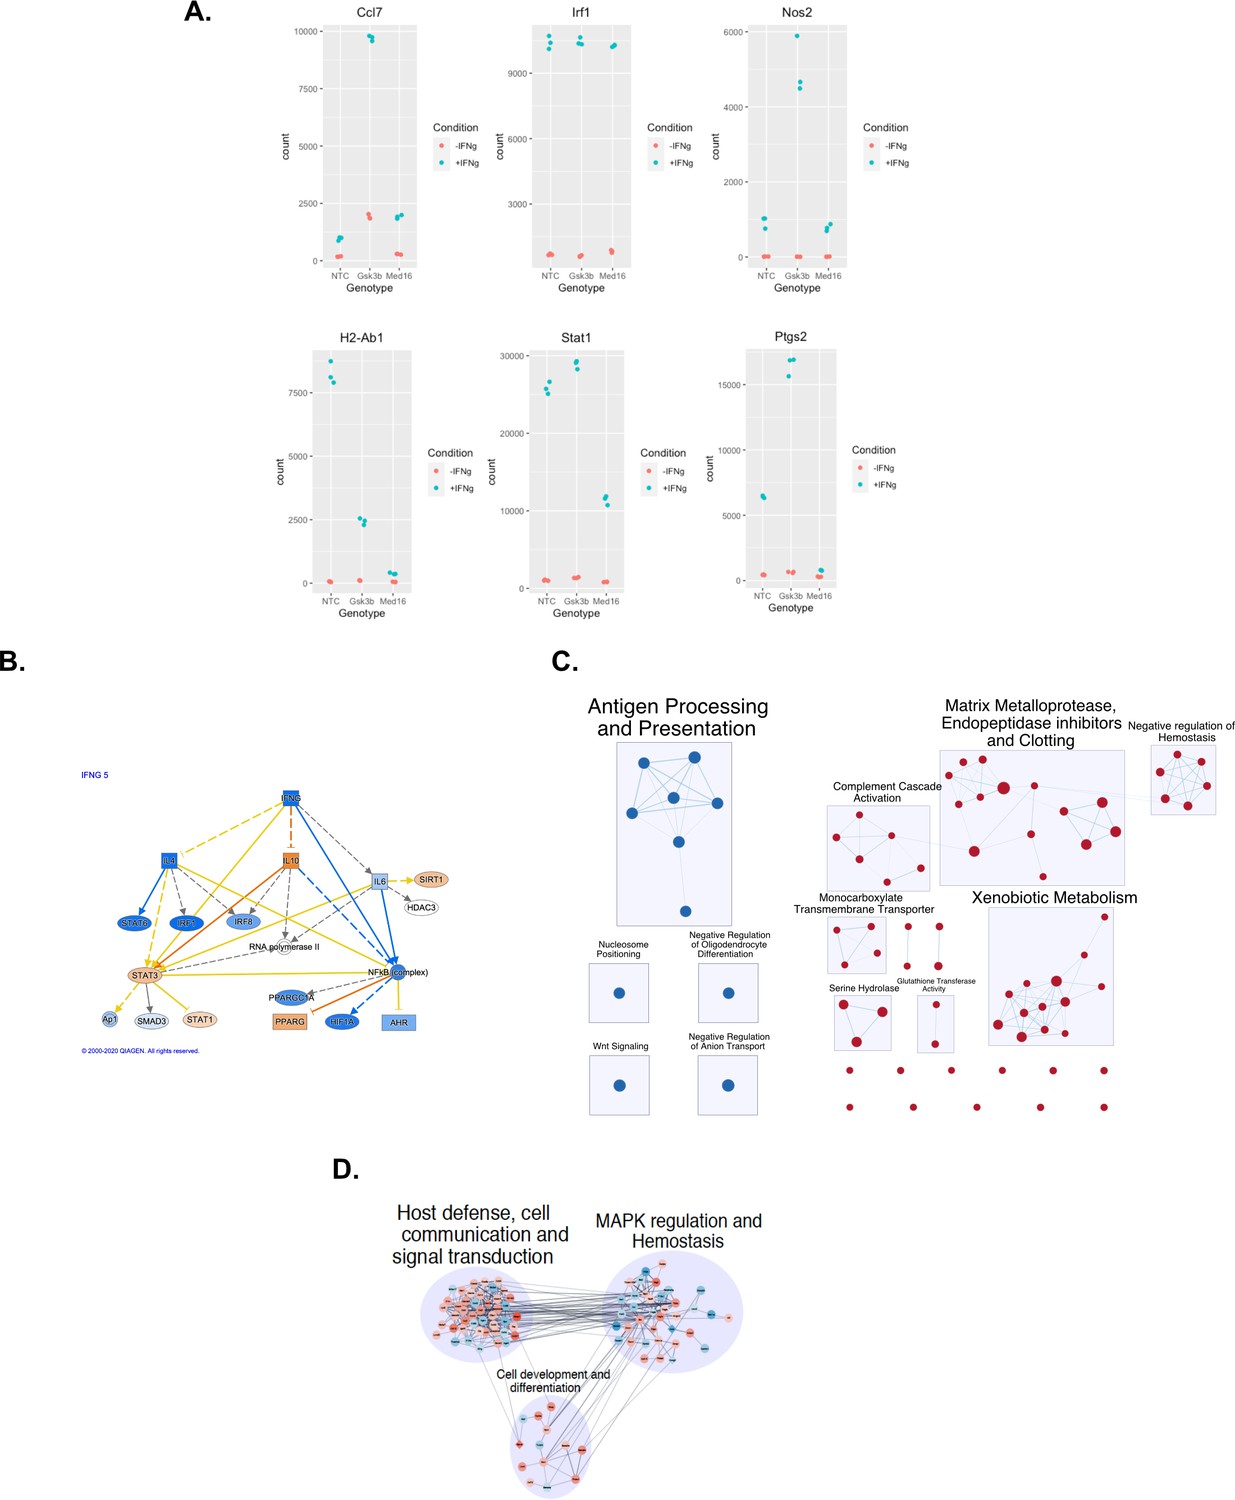
Transcriptomic analysis of MED16 and GSK3β reveals mechanisms of IFNγ-mediated control.
(A) RNAseq analysis of NTC, Gsk3β KO and Med16 KO cells was completed as described in the Materials and methods. Shown are representative scatter plots of normalized absolute read counts for genes that were highly variable among the conditions from the heatmap in Figure 5F. (B) Differential gene expression analysis from MED16 KO cells following IFNγ treatment was used to identify dysregulated pathways using gene set enrichment analysis (GSEA). Shown are visual representations of the pathway networks identified using EnrichmentMap and CytoScape. We found a strong downregulation (Blue) of genes involved in antigen processing and presentation and an upregulation (Red) in genes related to Xenobiootic metabolism, glutathione activity, and serine hydrolase and matrix metalloprotease activity. (C) GSEA of differentially expressed genes in the Med16 KO after IFNγ-stimulation identified a type I IFN signature. Shown is a pathway map generated by ingenuity pathway analysis highlighting the genes that are downregulated (Blue) or upregulated (Orange) in the Type I IFN pathway. The darkness of the color indicates the magnitude of the differential expression. (D) Differential expression analysis of the Gsk3β KO in untreated conditions were used in GSEA. Shown is a visual representation of the dysregulated genes placed into pathway networks using CytoScape. Genes that are upregulated are shown in Red and downregulated genes are shown in Blue. The darkness of the shading indicates the magnitude of the change as determined in the RNAseq analysis.
Figure 6
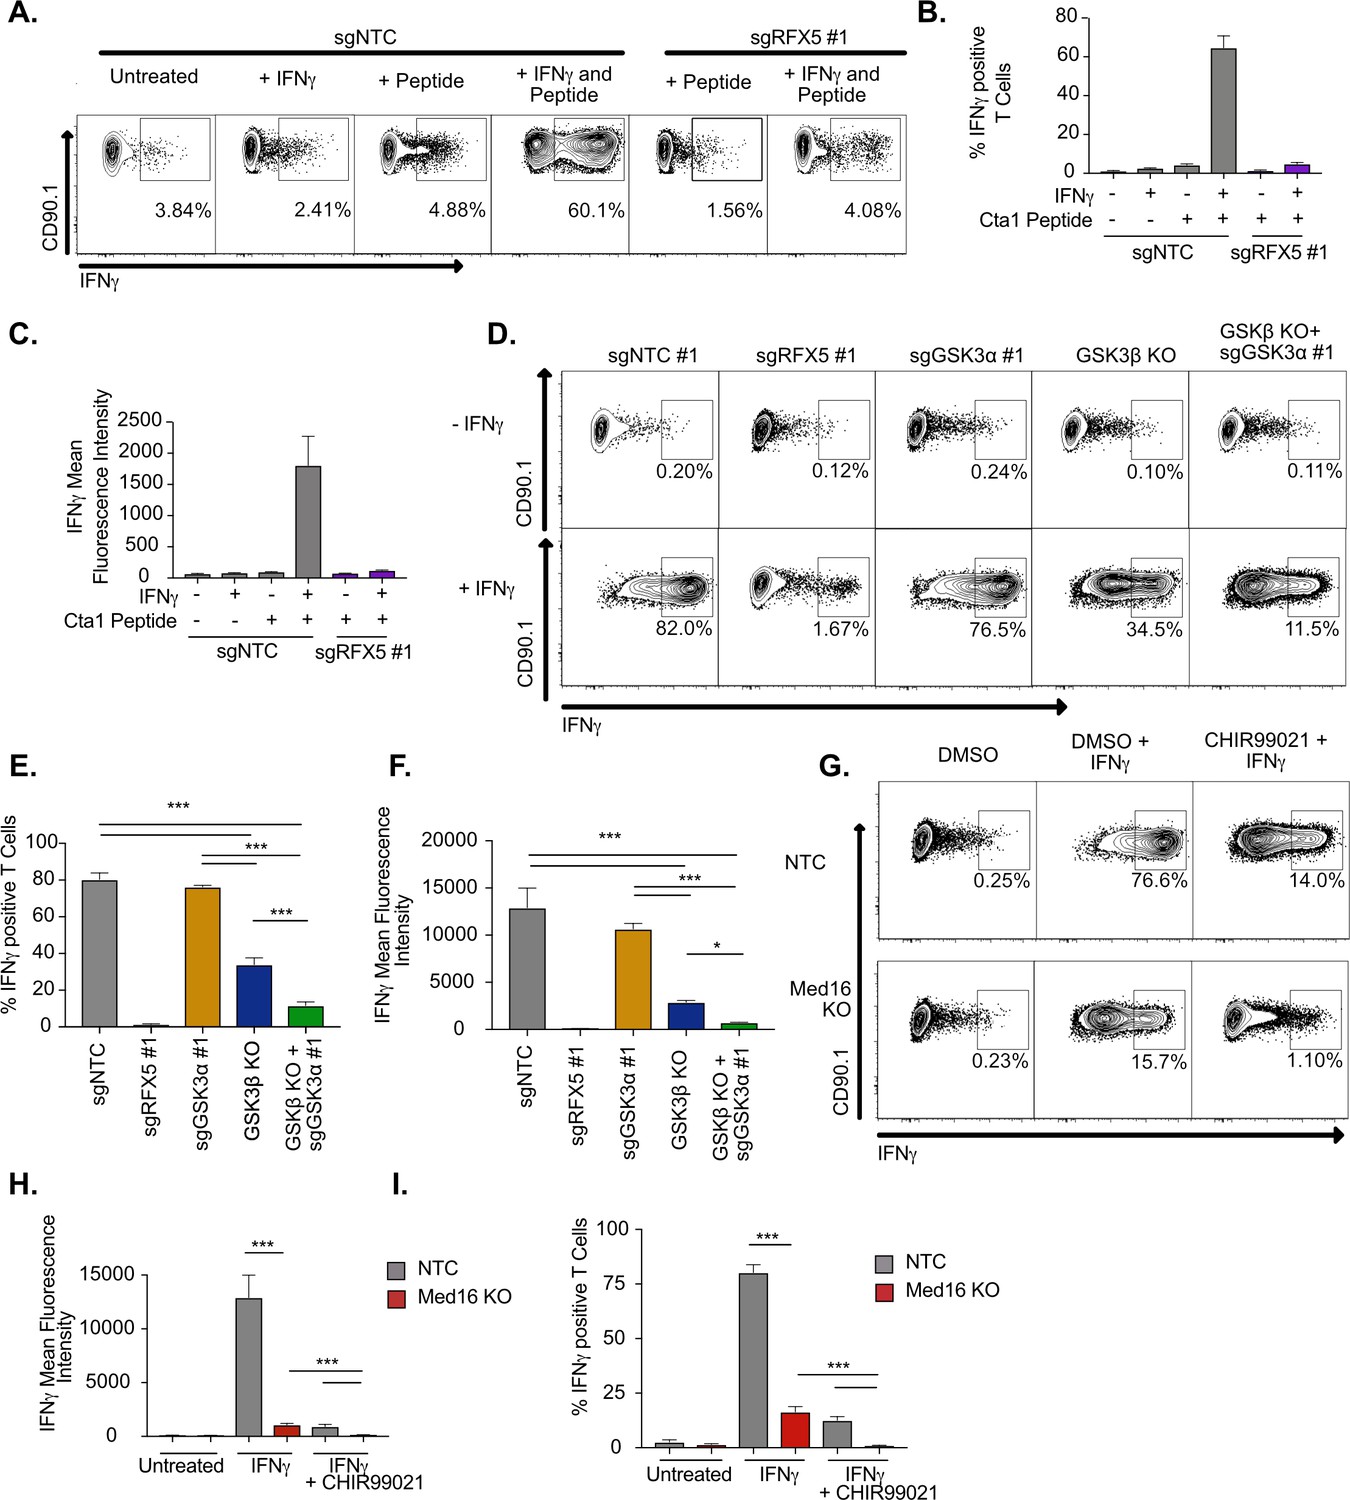
IFNγ-stimulated macrophages require MED16 or GSK3 to activate CD4+ T cells.
(A) Macrophages were left untreated, treated with 10 ng/ml IFNγ overnight, 5 μM peptide for 1 hr or both IFNγ and peptide as indicated. TCR-transgenic NR1 CD4+ T cells specific for the peptide Cta1 from Chlamydia trachomatis were then added to L3 macrophages of the indicated genotypes at a 1:1 ratio. Four hr after the addition of T cells, NR1 cells were harvested and the number of IFNγ-producing CD4+ T cells was quantified by intracellular staining and flow cytometry. Shown is a representative flow cytometry plot gated on live/CD4+ cells. Gates for IFNγ+ T cells were determined using an isotype control antibody. (B) The percent of live CD4+ T cells producing IFNγ and (C) the MFI of IFNγ production by live CD4+ T cells was quantified from triplicate samples. These results are representative of three independent experiments. (D) L3 cells targeted with the indicated sgRNAs were left untreated or treated overnight with IFNγ then pulsed with Cta1 peptide for 1 hr. NR1 cells were then added at a 1:1 ratio and 4 hr later NR1 cells were harvested and the number of IFNγ-producing CD4+ T cells was quantified by intracellular staining and flow cytometry. Shown is a representative flow cytometry plot gated on live/CD4+ cells. Gates for IFNγ+ T cells were determined using an isotype control antibody. (E) The percent of live CD4+ T cells producing IFNγ and (F) the MFI of IFNγ production by live CD4+ T cells was quantified from triplicate samples. These results are representative of three independent experiments. (G) NTC L3 cells or Med16 KO cells were left untreated or treated overnight with DMSO, IFNγ, and DMSO or IFNγ and CHIR999021 then pulsed with Cta1 peptide for 1 hour. NR1 cells were then added at a 1:1 ratio and 4 hours after the addition of T cells, NR1 cells were harvested and the number of IFNγ-producing CD4+ T cells was quantified by intracellular staining and flow cytometry. Shown is a representative flow cytometry plot gated on live/CD4+ cells. Gates for IFNγ+ T cells were determined using an isotype control antibody. (H) The percent of live CD4+ T cells producing IFNγ and (I) the MFI of IFNγ production by live CD4+ T cells was quantified from triplicate samples. These results are representative of three independent experiments. *** p < 0.001, *p < 0.05 by one-way ANOVA with a Tukey correction test.
Figure 7
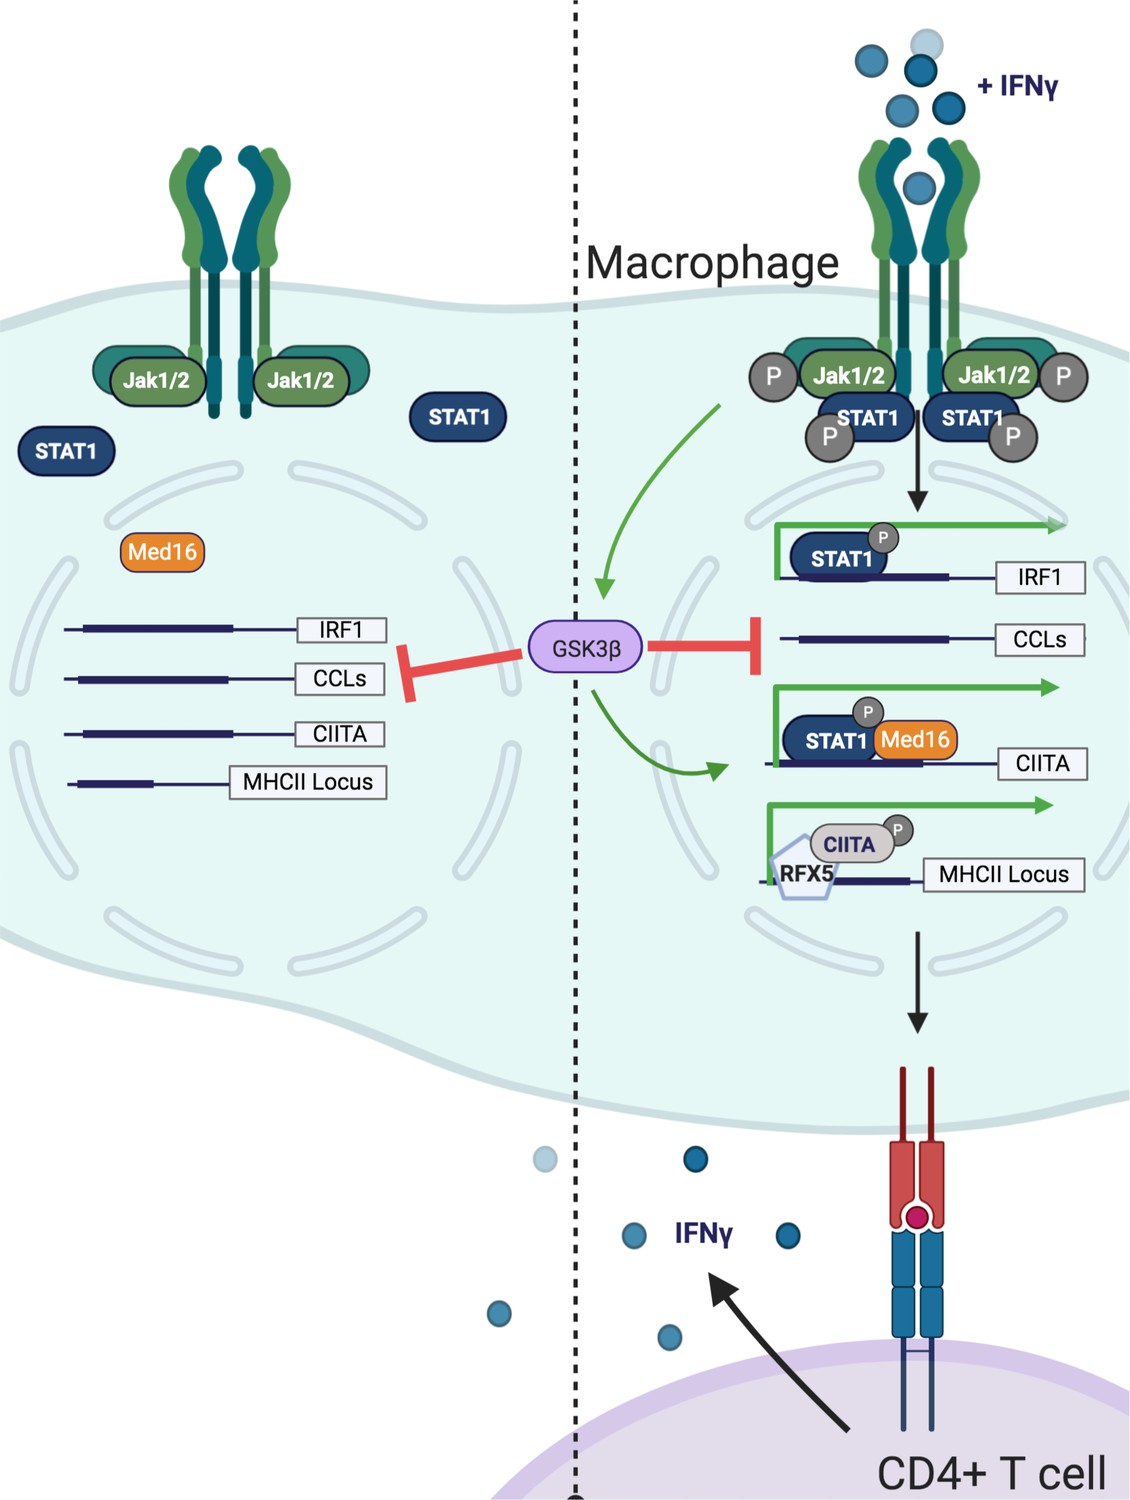
Model of GSK3β− and Med16-mediated control of IFNγ-activated MHCII expression.
Shown is a model of how GSK3β and MED16 regulate IFNγ-mediated MHCII expression. In the absence of IFNγ (Left) GSK3β controls the transcription of many macrophage genes related to inflammation such as CCLs. In contrast, Med16 KO cells shows minimal transcriptional changes in resting macrophages. Additionally, IFNγ-mediated gene expression is low. Following the activation of macrophages with IFNγ (Right), STAT1 becomes phosphorylated and translocates to the nucleus to drive gene transcription. The IFNγ-mediated induction of Irf1 does not require either GSK3β or MED16. While GSK3β continues to negatively regulate inflammatory genes like CCLs it also positively regulates the transcriptional activation of Ciita following IFNγ-activation. Through a parallel but distinct mechanism, IFNγ-mediated induction of Ciita also requires MED16 function. The expression of Ciita then recruits other transcription factors such as RFX5 to the MHCII locus where it induces the expression of MHCII, which allows for the activation of CD4+ T cells. Figure created using Biorender.
Tables
Key resources table
| Reagent type (species) or resource | Designation | Source or reference | Identifiers | Additional information |
|---|---|---|---|---|
| Cell line (Mus musculus) | L3-Cas9+ | This paper | Primary BMDMs immortalized with J2 virus were transduced with Cas9 and single cell cloned. | |
| Cell line (Mus musculus) | Med16 KO in L3-Cas9+ | This paper | L3-Cas9+ cells were transduced with Med16 sgRNAs and single cell cloned | |
| Cell line (Mus musculus) | GSK3β KO in L3-Cas9+ | This paper | L3-Cas9+ cells were transduced with GSK3b sgRNAs and single cell cloned | |
| Cell line (Mus musculus) | Cas9+ C57BL/6 J Estradiol-inducible HoxB8 Progenitors | Kiritsy et al (co-submitted) | Myeloid progenitors from Jackson stock 026179 were immortalized with HoxB8 retrovirus and maintained with 10 uM estradiol | |
| Strain, strain background (Mus musculus) | C57BL/6 J | Jackson Laboratories | Stock 000664 | |
| Strain, strain background (Mus musculus) | NR1 TCR-transgenic mice | Roan et al., 2006 | Mouse strain generated and maintained by Michael Starnbach | |
| Recombinant DNA reagent | sgOpti | AddgenePMID:27708057 | RRID:85,681 | |
| Recombinant DNA reagent | sgOpti with blasticidin and zeocyin selection | This Paper | sgOpti (RRID 85681) was modified with bacterial selection replaced with Zeocyin and mammalian selection replaced with Blasticidin | |
| Recombinant DNA reagent | sgOpti with hygromycin and kanamycin selection | This Paper | sgOpti (RRID 85681) was modified with bacterial selection replaced with Kanamycin and mammalian selection replaced with Hygromycin | |
| Antibody | MHCII-PE, Clone M5/114.15.2 (rat monoclonal) | Biolegend | RRID:AB_313323 | FC (1:800) |
| Antibody | anti-mouse IFN-γ Antibody (rat monoclonal) | Biolegend | Cat# 505807, RRID:AB_315401 | FC (1:200) |
| Recombinant DNA reagent | Mouse CRISPR KO pooled library (BRIE) | Addgene | RRID73,632 | |
| Recombinant DNA reagent | VSVG | Addgene | RRID:8,454 | |
| Recombinant DNA reagent | psPax2 | Addgene | RRID:12,260 | |
| Chemical Compound Drug | CHIR99021 | Sigma-Aldrich | Catalog: SML1046PubChemID: 329825639 | (Resuspended in DMSO) |
| Chemical Compound Drug | Torin2 | Sigma-Aldrich | Catalog:SML1225CAS #:1223001-51-1 | (Resuspended in DMSO) |
| Antibody | GSK3 (rabbit monoclonal) | Cell Signaling Technology | Catalog #: 4,337RRID: AB_10859910 | WB (1:1000) |
| antibody | pGSK3a (rabbit monoclonal) | Cell Signaling Technology | Catalog #: 9,316RRID:AB_659836 | WB (1:1000) |
| Antibody | Phospho-Stat1 Tyr701 Clone 58D6 (rabbit monoclonal) | Cell Signaling Technology | Cat# 5375, RRID:AB_10860071 | WB (1:1000) |
| Peptide, recombinant protein | Cta1133–152(KGIDPQELWVWKKGMPNWEK) | Genescript | Peptide identified in Roan et al., 2006 | |
| Antibody | Human anti-CD274, B7-H1, PD-L1, Clone 29E (mouse monoclonal) | Biolegend | Cat# 329713, RRID:AB_10901164 | FC (1:400) |
| Commercial assay or kit | Zombie Aqua Fixable Viability Kit | Biolegend | Catalog #: 423,101 | FC (1:100) |
| peptide, recombinant protein | IL-12 | Peprotech | Catalog #: 210–12 | |
| Antibody | Anti-IL4 Clone: 11B11 (rat monoclonal) | Biolegend | RRID:AB_2750407 | Neutralization (1:500) |
| Peptide, recombinant protein | IL-18 | Biolegend | Catalog #: 767,008 | |
| Peptide, recombinant protein | IL-15 | Peprotech | Catalog #: 500-P173 | |
| Commercial assay or kit | One-step RT PCR Kit | Qiagen | Catalog #: 210,215 | |
| Commercial assay or kit | Trizol | ThermoFisher Scientific | Catalog #: 15596026 | |
| Software algorithm | MAGECK | PMID:25476604 | ||
| Peptide, recombinant protein | Interferon-gamma | Biolegend | Catalog #:575,308 | |
| Commercial assay or kit | MojoSORT – Mouse CD4 Naïve T cell Isolation Kit | Biolegend | Catalog #:480,040 | |
| Commercial assay or kit | MojoSORT Mouse NK Cell isolation Kit | Biolegend | Catalog #: 480,050 | |
| Antibody | Beta-actin (rat monoclonal) | Biolegend | Catalog#: 664,802RRID:AB_2721349 | WB (1:2000) |
| Antibody | Goat anti-Rabbit HRP (goat polyclonal) | Invitrogen | Catalog#: 31,460 | WB (1:1000) |
| Antibody | Goat anti-Mouse HRP (goat polyclonal) | Invitrogen | Catalog #: 31,430 | WB (1:1000) |
| Sequence-based reagent | All oligonucleotide sequences are contained in Supplementary file 1. | This Paper | All oligonucleotide sequences are contained in Supplementary file 1. |
Additional files
-
Supplementary file 1
Oligonucleotides used in the study.
- https://cdn.elifesciences.org/articles/65110/elife-65110-supp1-v2.xlsx
-
Transparent reporting form
- https://cdn.elifesciences.org/articles/65110/elife-65110-transrepform1-v2.docx
Download links
A two-part list of links to download the article, or parts of the article, in various formats.
Downloads (link to download the article as PDF)
Open citations (links to open the citations from this article in various online reference manager services)
Cite this article (links to download the citations from this article in formats compatible with various reference manager tools)
A genetic screen in macrophages identifies new regulators of IFNγ-inducible MHCII that contribute to T cell activation
eLife 10:e65110.
https://doi.org/10.7554/eLife.65110


